Regression and Classification Methods for Learning Sound Wave Amplitude Modulation in Soft Tactile Sensing
Abstract
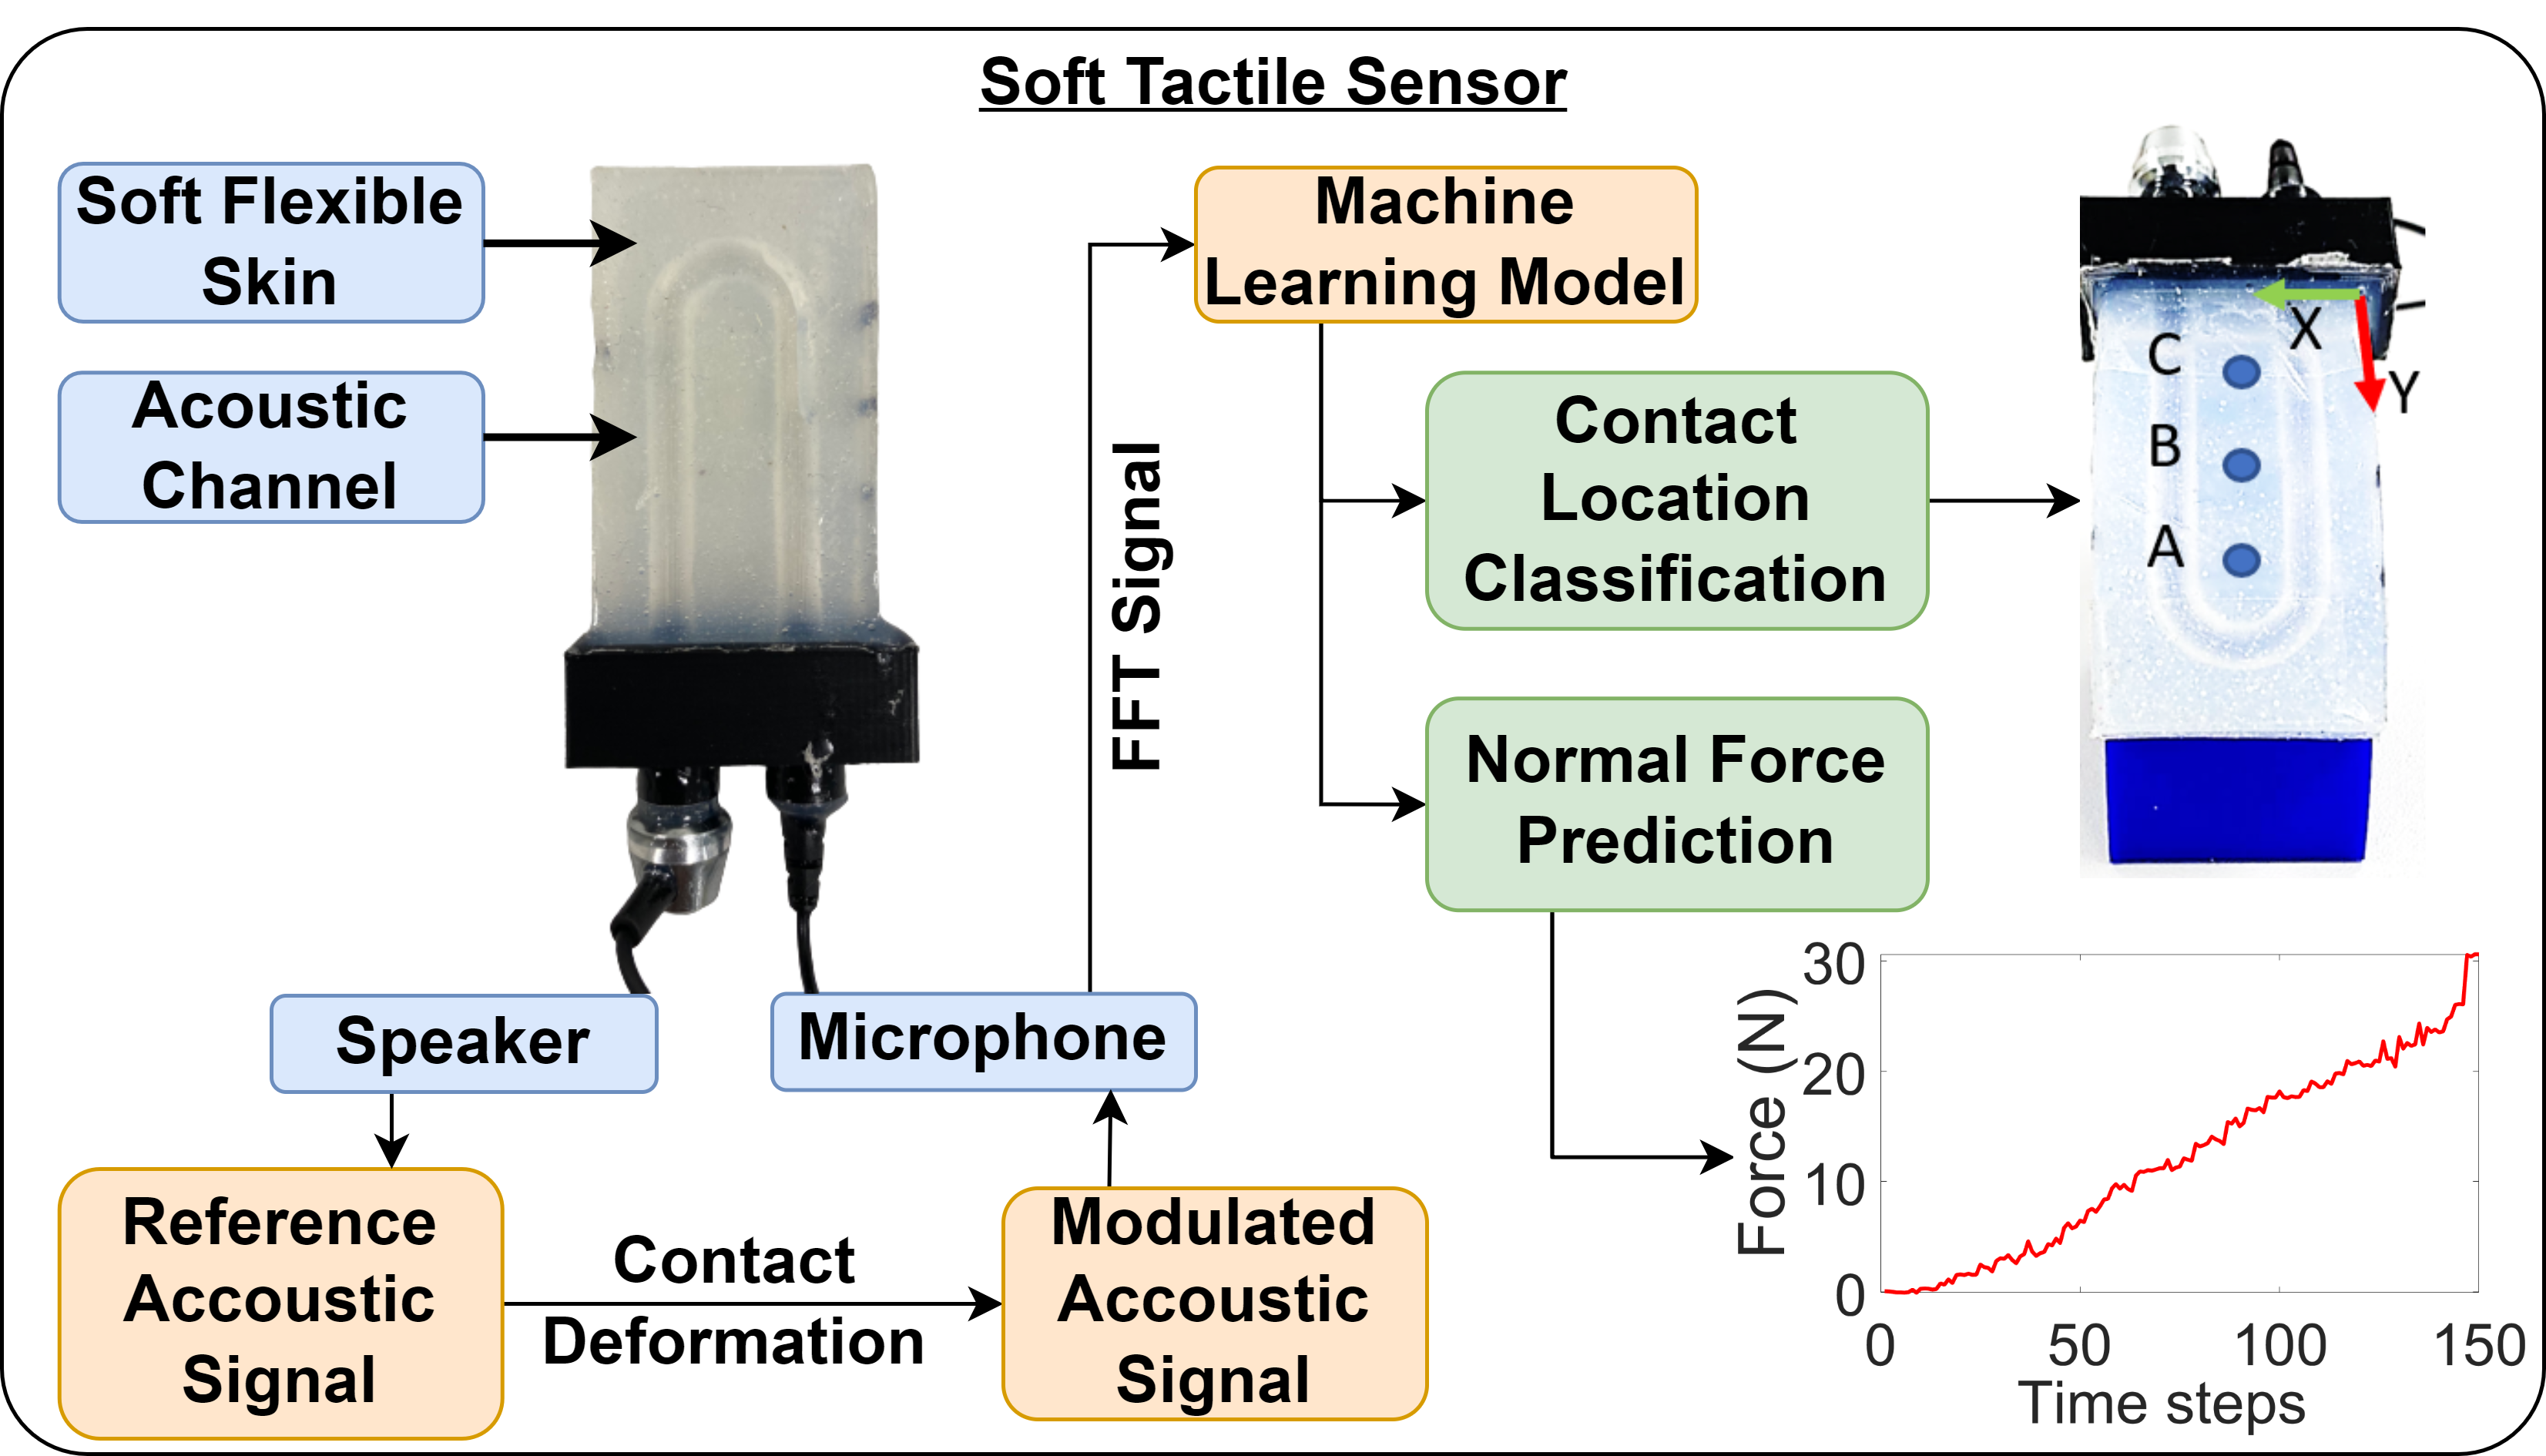
This paper presents a novel soft tactile skin (STS) technology operating with sound waves. In this innovative approach, the sound waves generated by a speaker travel in channels embedded in a soft membrane and get modulated due to a deformation of the channel when pressed by an external force and received by a microphone at the end of the channel. The sensor leverages regression and classification methods for estimating the normal force and its contact location. Our sensor can be affixed to any robot part, e.g., end effectors or arm. We tested several regression and classifier methods to learn the relation between sound wave modulation, the applied force, and its location, respectively and picked the best-performing models for force and location predictions. Our novel tactile sensor yields 93% of the force estimation within ±1.5 N tolerances for a range of 0-30+1 N and estimates contact locations with over 96% accuracy. We also demonstrated the performance of STS technology for a real-time gripping force control application.
I Introduction
Accurate measurement of physical interactions plays a vital role in various physical robotic tasks, such as human-robot interaction [1], object grasping, and manipulation [2]. Tactile sensing technologies have been developed and improved to enable robot agents to understand their environment better, leading to safer, more precise, and more efficient actions in a broader range of physical interaction tasks [3, 4, 5]. Soft tactile sensors are important for handling deformable objects and robust manipulation. These sensors feature a soft, flexible sensing surface whose deformation provides tactile information such as normal/shear forces, contact location, and contact surface texture, etc. Soft tactile sensors utilise both electronic (e.g., resistive [6], capacitive [7], piezoelectric [8], magnetic [9, 10], impedance [11]) and non-electronic transduction methods (e.g., camera-based [12, 13, 14, 15, 16, 17, 18], fluid-based [19], and acoustics [20, 21, 22, 23]) and their combinations [24] for converting the membrane deformation to tactile information.
Despite the progress in soft tactile sensing technology, several limitations persist: many off-the-shelf soft tactile sensors have a fixed topology/shape and size, making integration/interfacing with existing hardware (e.g., end-effectors) challenging where there are space constraints (e.g., integrating camera-based tactile sensors is problematic as they need ample space [14, 25]). Moreover, developing sensors with closely knit electric components to fit into tight spaces requires sophisticated manufacturing techniques and cost. Hence there are attempts to find less complex tactile sensing technologies that can adapt to different shapes and form factor requirements.
Zoller et al. [27] added a tactile sensing capability by using sound waves to a pneumatically actuated soft finger. They added a speaker and microphone within the finger’s chamber for pneumatic actuation. The microphone continuously monitors changes in sound modulation. Sound waves’ amplitude changes if the finger deforms due to an applied external force. They used the finger with added sensing capability to measure contact forces and contact location with a certain precision [28]. However, the sensor is integrated with a soft finger and is not a stand-alone sensor to be used on other robot counterparts.
We developed a stand-alone and low-cost tactile sensing technology suitable for being used in different shapes and sizes, called Soft Tactile skin (STS) (Fig. 1a). Our contribution includes (i) a novel open-source low-cost tactile sensor that is easy to fabricate for fitting different shapes. A membrane with embedded acoustic channels, microphone, and speakers are the only key components of STS. (ii) We also present a design for a frame-less STS (f-STS) for non-flat surfaces. (iii) We investigated different regression and classification methods for learning the relation between the applied force and its location and the microphone readings for our STS designs during its performance testing(iv) We demonstrate STS performing on flat and non-flat surfaces and also for a force-controlled robotic grasping application. These tests prove that STS technology can be used in realistic robotic applications.
II Related Works
Acoustic techniques have been explored for deriving tactile features like contacts, deformations, forces, and shape recognition etc. For instance, Shinoda et al. [29] created a silicone hemispherical fingertip embedded with an ultrasound transmitter and receiver array, capable of detecting deformations up to 10µm and inclination changes to 0.001 radians. They later improved this design by adding a hollow cavity within the membrane to measure stress via acoustic resonance. Teramoto et al. [23] introduced a flexible membrane underlaid with acoustic transducers to measure object curvature upon contact. Tanaka et al. [22] devised an acoustic sensor for real-time lump detection in laparoscopic surgery, employing a silicone-based hollow tube and analyzing sound wave deformations through the tube.
Chuang et al. [20] designed an ultrasonic sensor capable of real-time static normal force measurements (1-6 N) and shape recognition, analysing time-of-flight variations in ultrasonic pulses due to surface deformation. The sensor architecture includes a Thin Film Transistor layer sandwiched between piezoelectric PVDF layers and a soft polymer sensing surface. These design calls for sophisticated manufacturing. However, a revolution was brought by V. Wall et al. [28], who extended acoustic methods to pinpoint the force location and material characteristics using a soft pneumatic finger equipped with an enclosed speaker and microphone. When featuring only a microphone, this design can still measure contact forces, locations, and materials, although it requires sound generation at the contact point for functionality [30]. These reports showcase the potential of using acoustic techniques to extract tactile information from soft material deformation. But for developing a low-cost tactile sensing skin, it is advisable (1). not to integrate complex electronic circuitry into the skin, and (2). relocating sensory hardware away from the sensing surface enables sensor compactness and avoids requiring sophisticated manufacturing techniques. Further, this allows for a variety of skin form factors. We follows these principles to make STS a low-cost and easily manufacturable standalone sensor.
III Soft Tactile Skin
III-A Design:
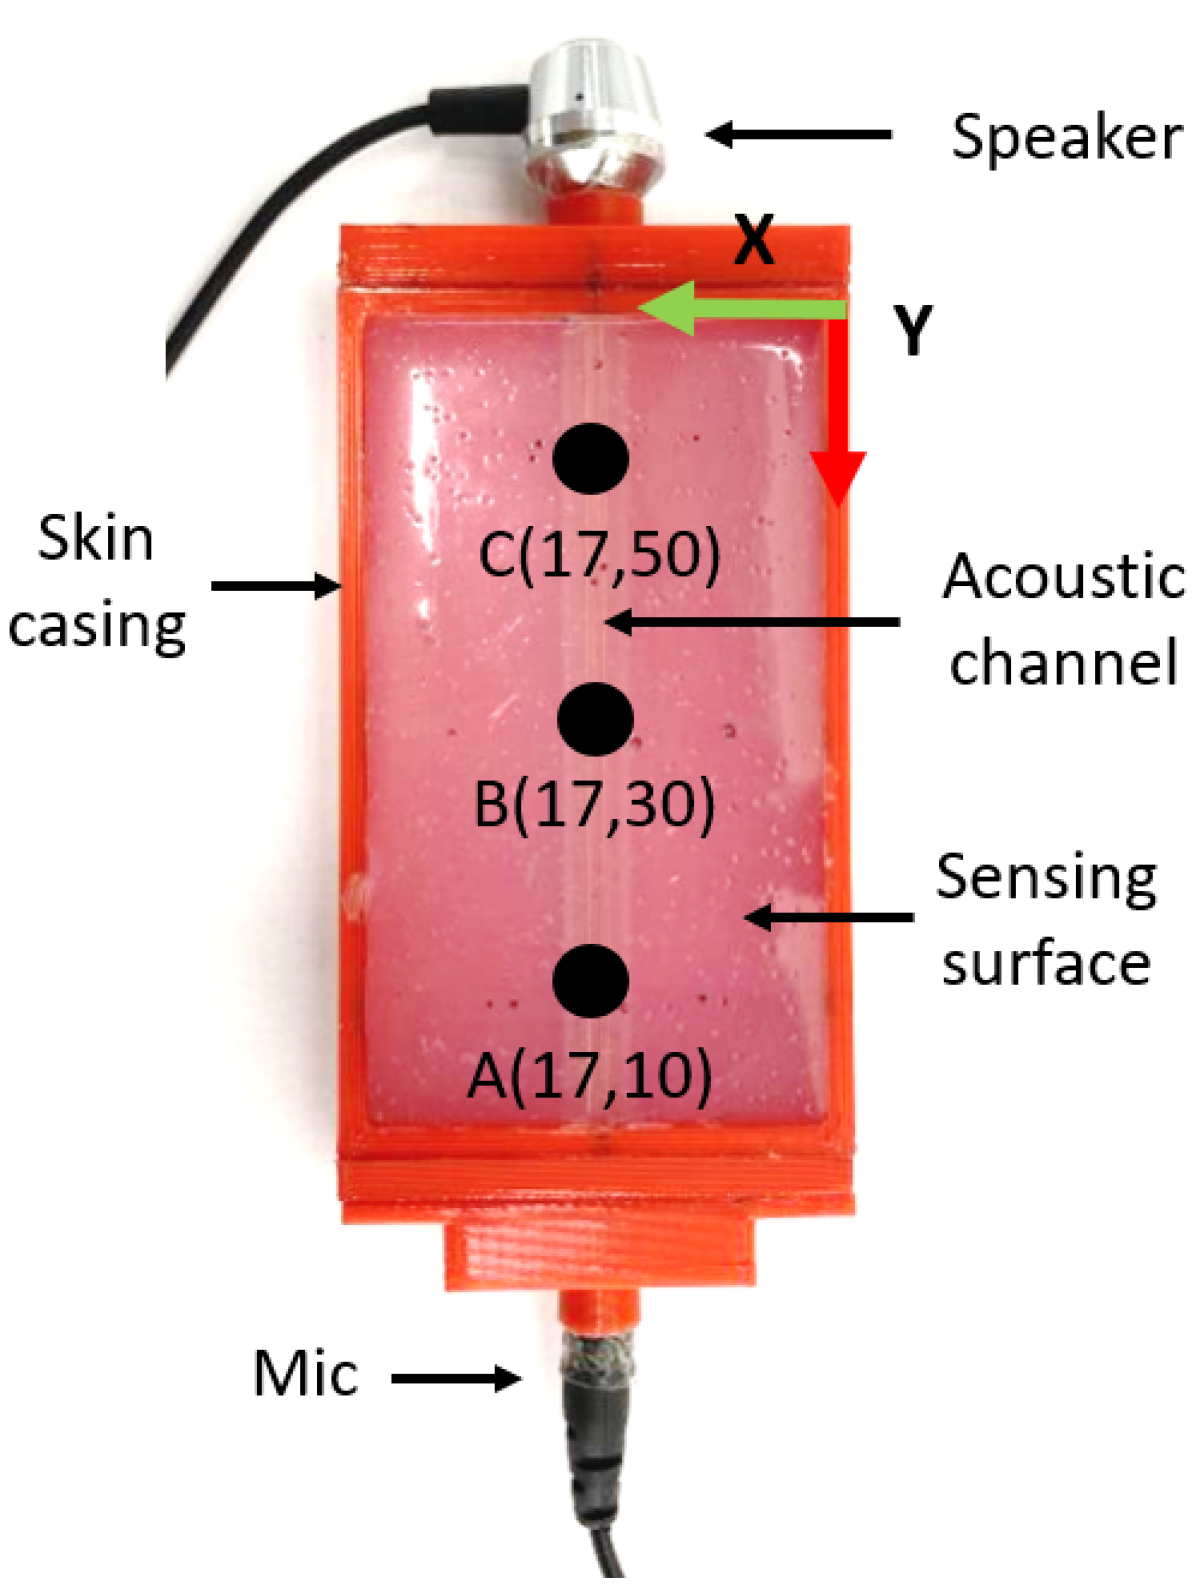
To prove the proposed STS technology, we initially fabricated a flat, rectangular-shaped silicone skin measuring 35 mm x 60 mm. We mount the skin inside a 3D-printed casing to ensure portability and ease of testing and connecting the speaker-microphone unit. However, we have shown the skin design without a hard case in the later section of the paper. We investigated various skin configurations with single and dual ACs with simple geometrical shapes, such as cylindrical and conical, that run through the length of the skin. The diameter of the cylindrical AC is 5 mm, while the conical AC has diameters of 5 mm and 3 mm. The ACs connect the speaker-microphone arrangement of the skin. The prototyping procedure is detailed in the Appendix111https://tinyurl.com/2mpy6vfr.
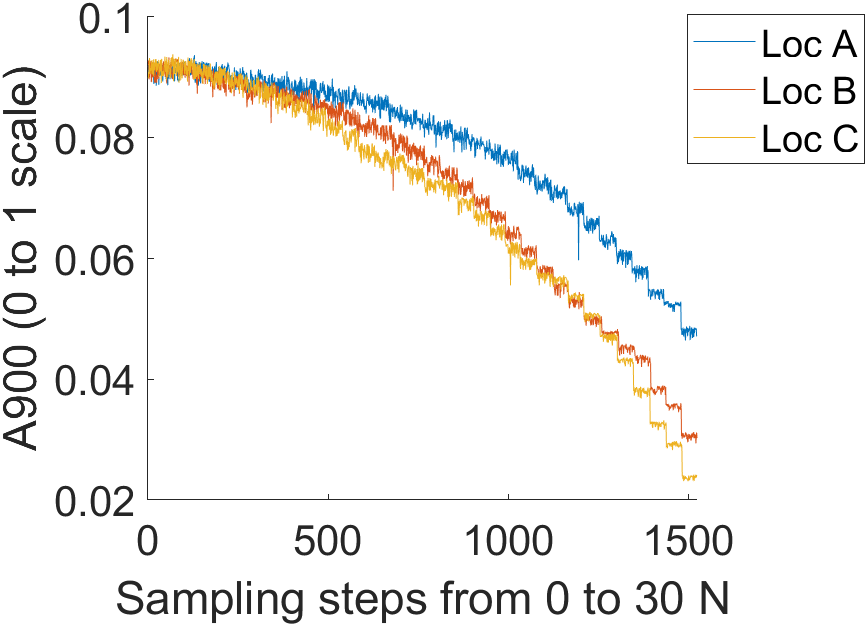
The speaker unit generates continuous sound waves that travel through the ACs, and the microphone receives the sound waves. As the channels deform due to external physical interactions, the amplitude of the sound waves changes (see Fig. 3), and we leverage ML models to capture the relationship between the amplitude changes and the tactile information. The details of the different skin configurations tested are presented in the following sections.
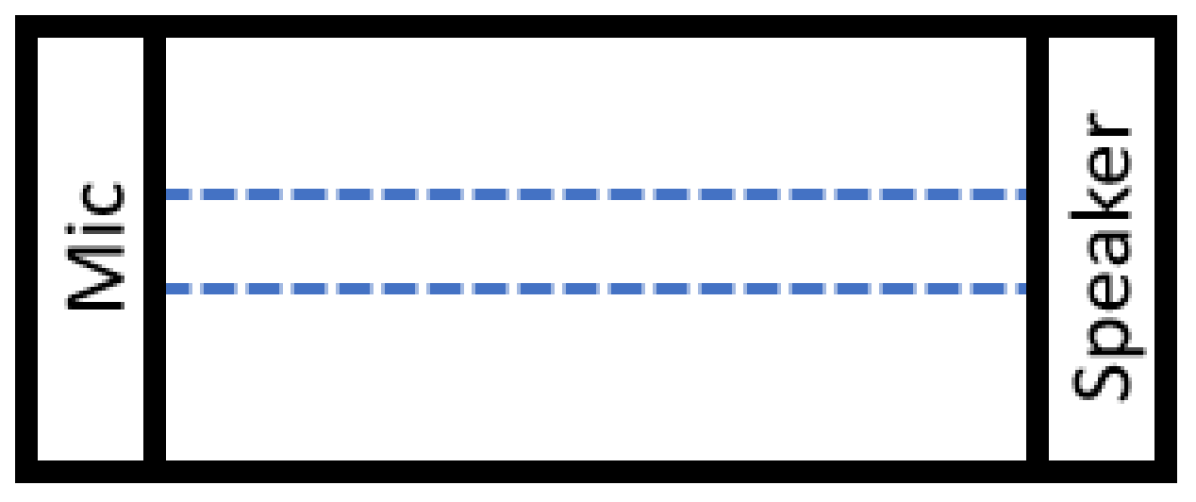
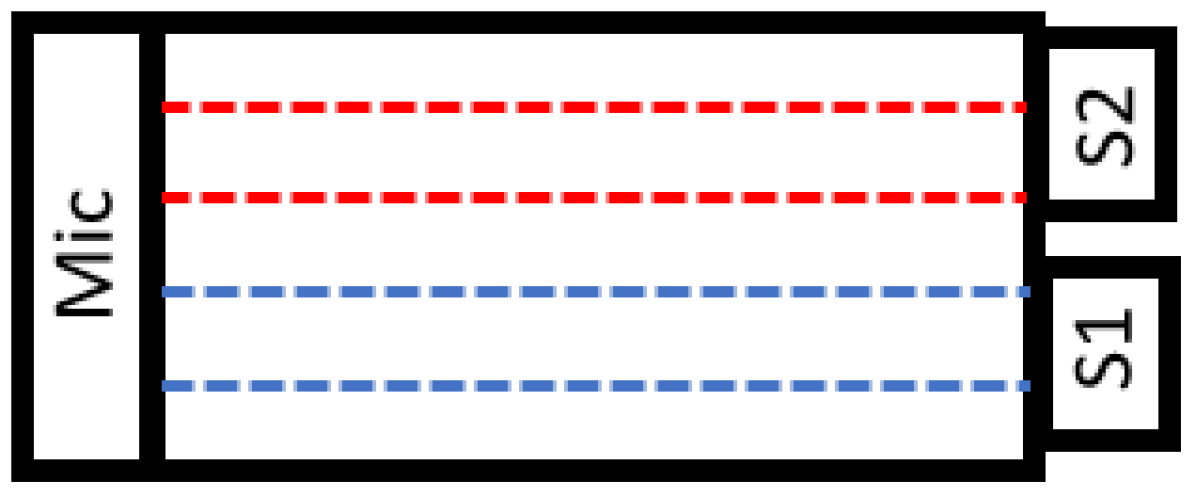
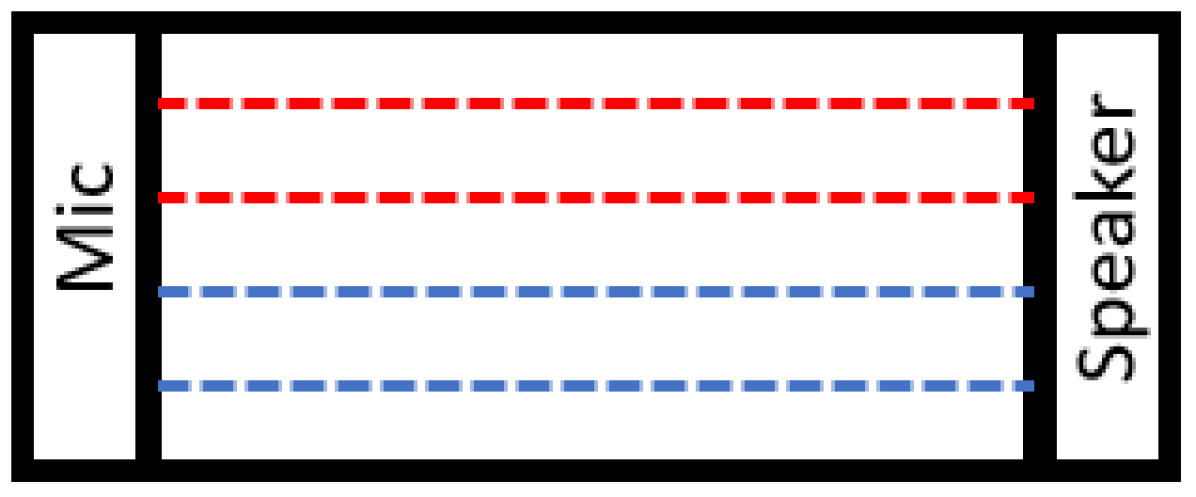
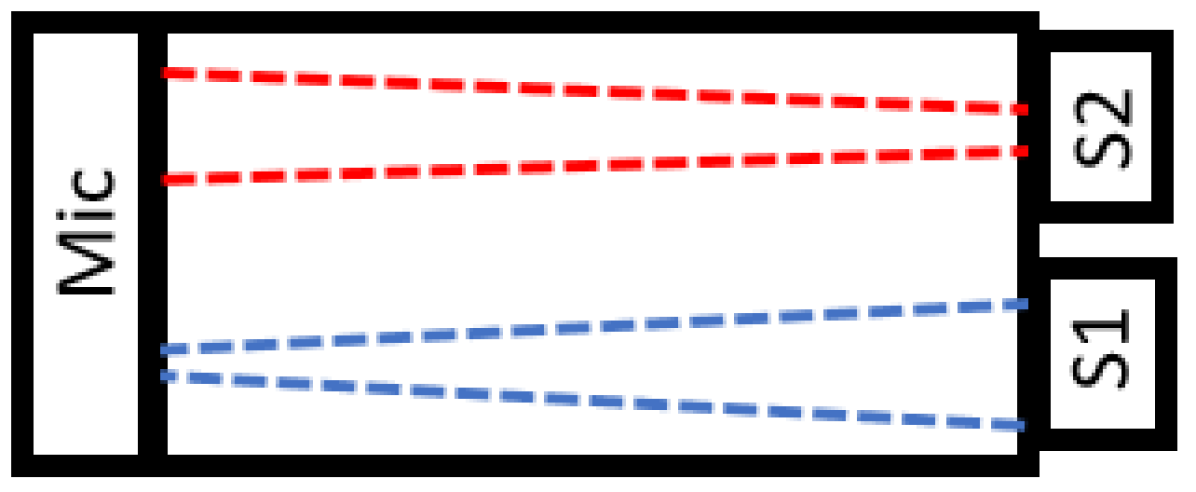
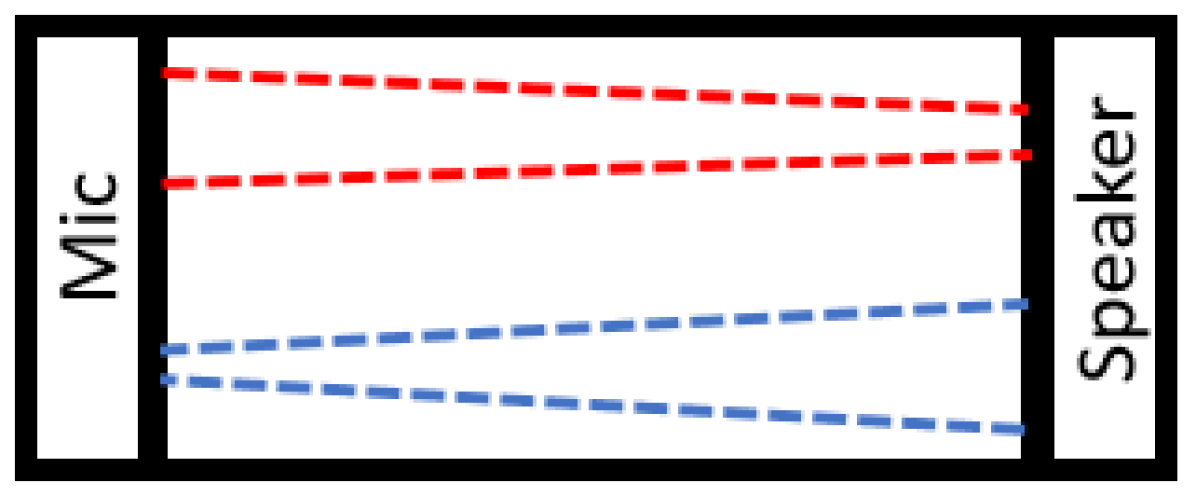
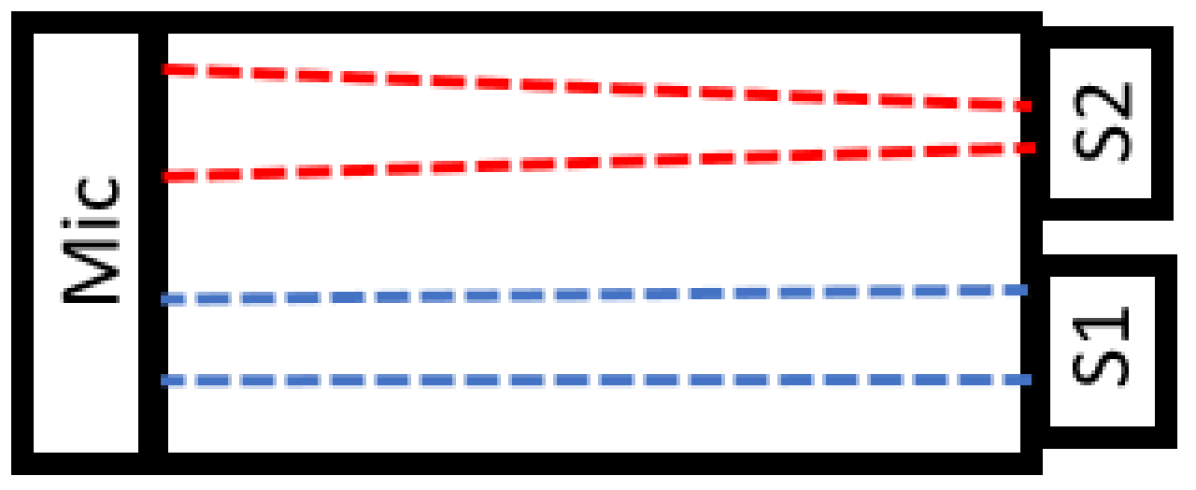
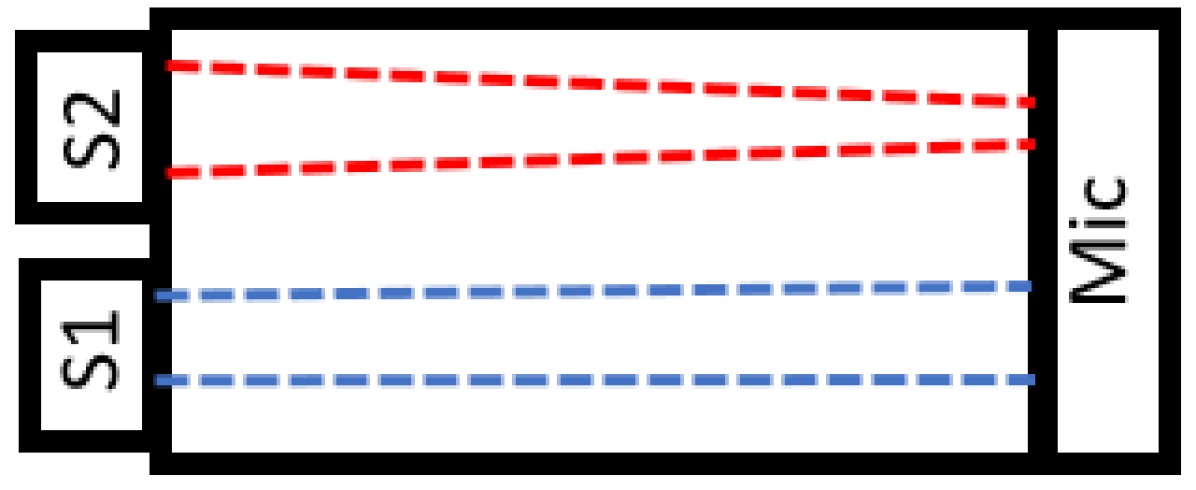
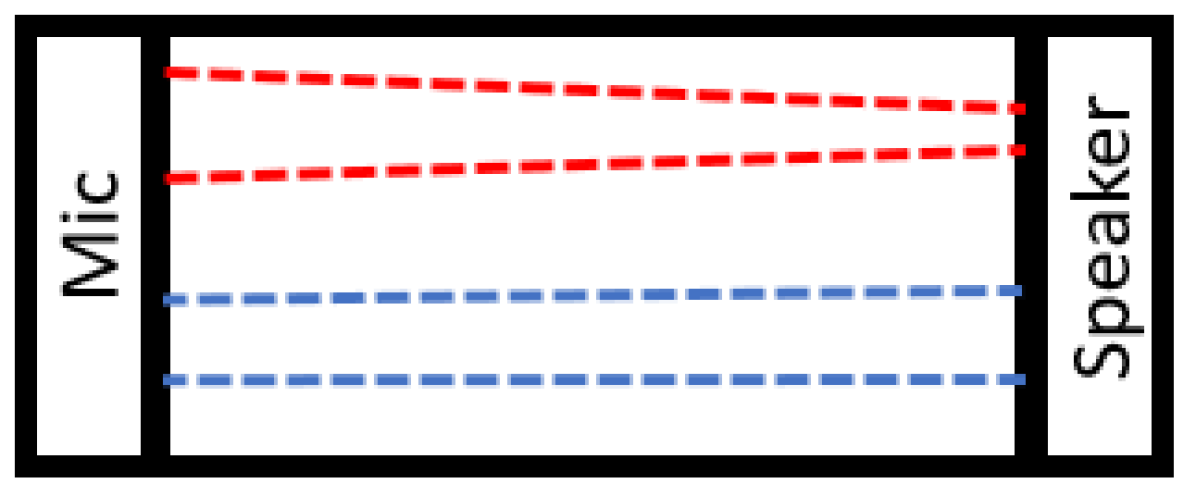
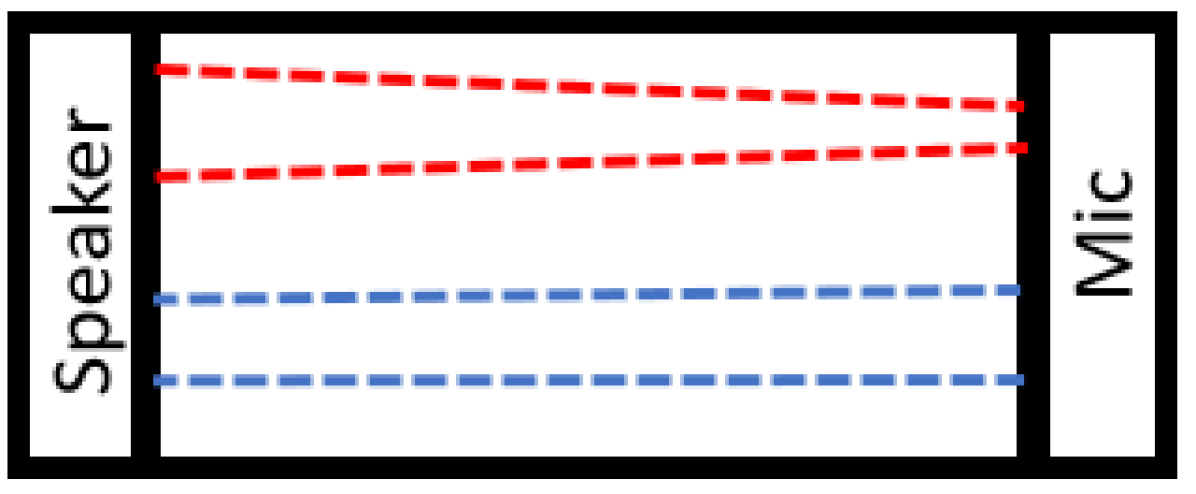
Acoustic Channel Design: The impact of contact deformation on sound waves varies with the shape of the ACs, which we exploit to estimate force and contact location. We investigated the effect of different channel configurations on feature extraction for force and contact location (see Fig 2 for AC designs).
We studied single-channel and dual-channel configurations to verify our hypothesis that ACs can be used to estimate tactile information. The study on single-channel skin configuration (STS 1) verifies the usability of this tactile skin, which calls for a narrow sensing region. For a broader sensing surface, the skin requires multiple channels, which we explore with studies on dual ACs (STS 2a-b, STS 3a-b, STS 4a-d) as an initial step. In future works, we will explore using multiple channels with different geometries spanning the entire skin area. For single-channel skin (STS 1), we considered a cylindrical-shaped channel. For dual channel skin configurations, we have used combinations of (1) two cylindrical-shaped channels (STS 2a, STS 2b), (2) two conical-shaped channels (STS 3a, STS 3b), and (3) a conical-shaped channel with cylindrical-shaped one (STS 4a-4d).
By providing these channel configurations, we also tested two other design hypotheses: (1) Can AC with a non-varying cross-section (cylinder) distinguish forces acting on different points along their length? (2) for dual-channel skins, can ACs with different geometrical shapes (STS 4a-4d) best capture the tactile information compared to skins with similar AC geometries (STS 2a-2b, STS 3a-3b)?
Speaker Configurations: Speaker configurations are the second primary design feature we investigated in this work. We used a single speaker for STS 1, STS 2b, STS 3b, STS 4c, and STS 4d. We provided an individual speaker for each channel for STS 2a, STS 3a, and STS 4a-4b.
These speaker arrangements enable us to study the differences in skin performance (1) when all channels are provided with a single speaker versus each channel with an individual speaker and (2) when the speakers are arranged on the smaller and larger diameter ends of the conical channel (STS 4a and 4b, STS 4c and 4d).
In this study, we used computer headphone speakers and a microphone, which will be replaced with a miniature type in further development studies.
III-B Extracting Tactile Feature from Sound Signal:
We aim to estimate two tactile features, i.e., the normal force (Newtons) and their contact location from the sound wave’s amplitude modulation. We use the data-driven approach to capture the mapping between the sound’s wave amplitude modulation and these features. First, we created a dataset using a robot arm and load cell by applying force to a series of locations on the soft skin. We then used different regression and classification methods to learn the mapping and outputting of the tactile features.
IV Experiments and results
IV-A Sensor Calibration:
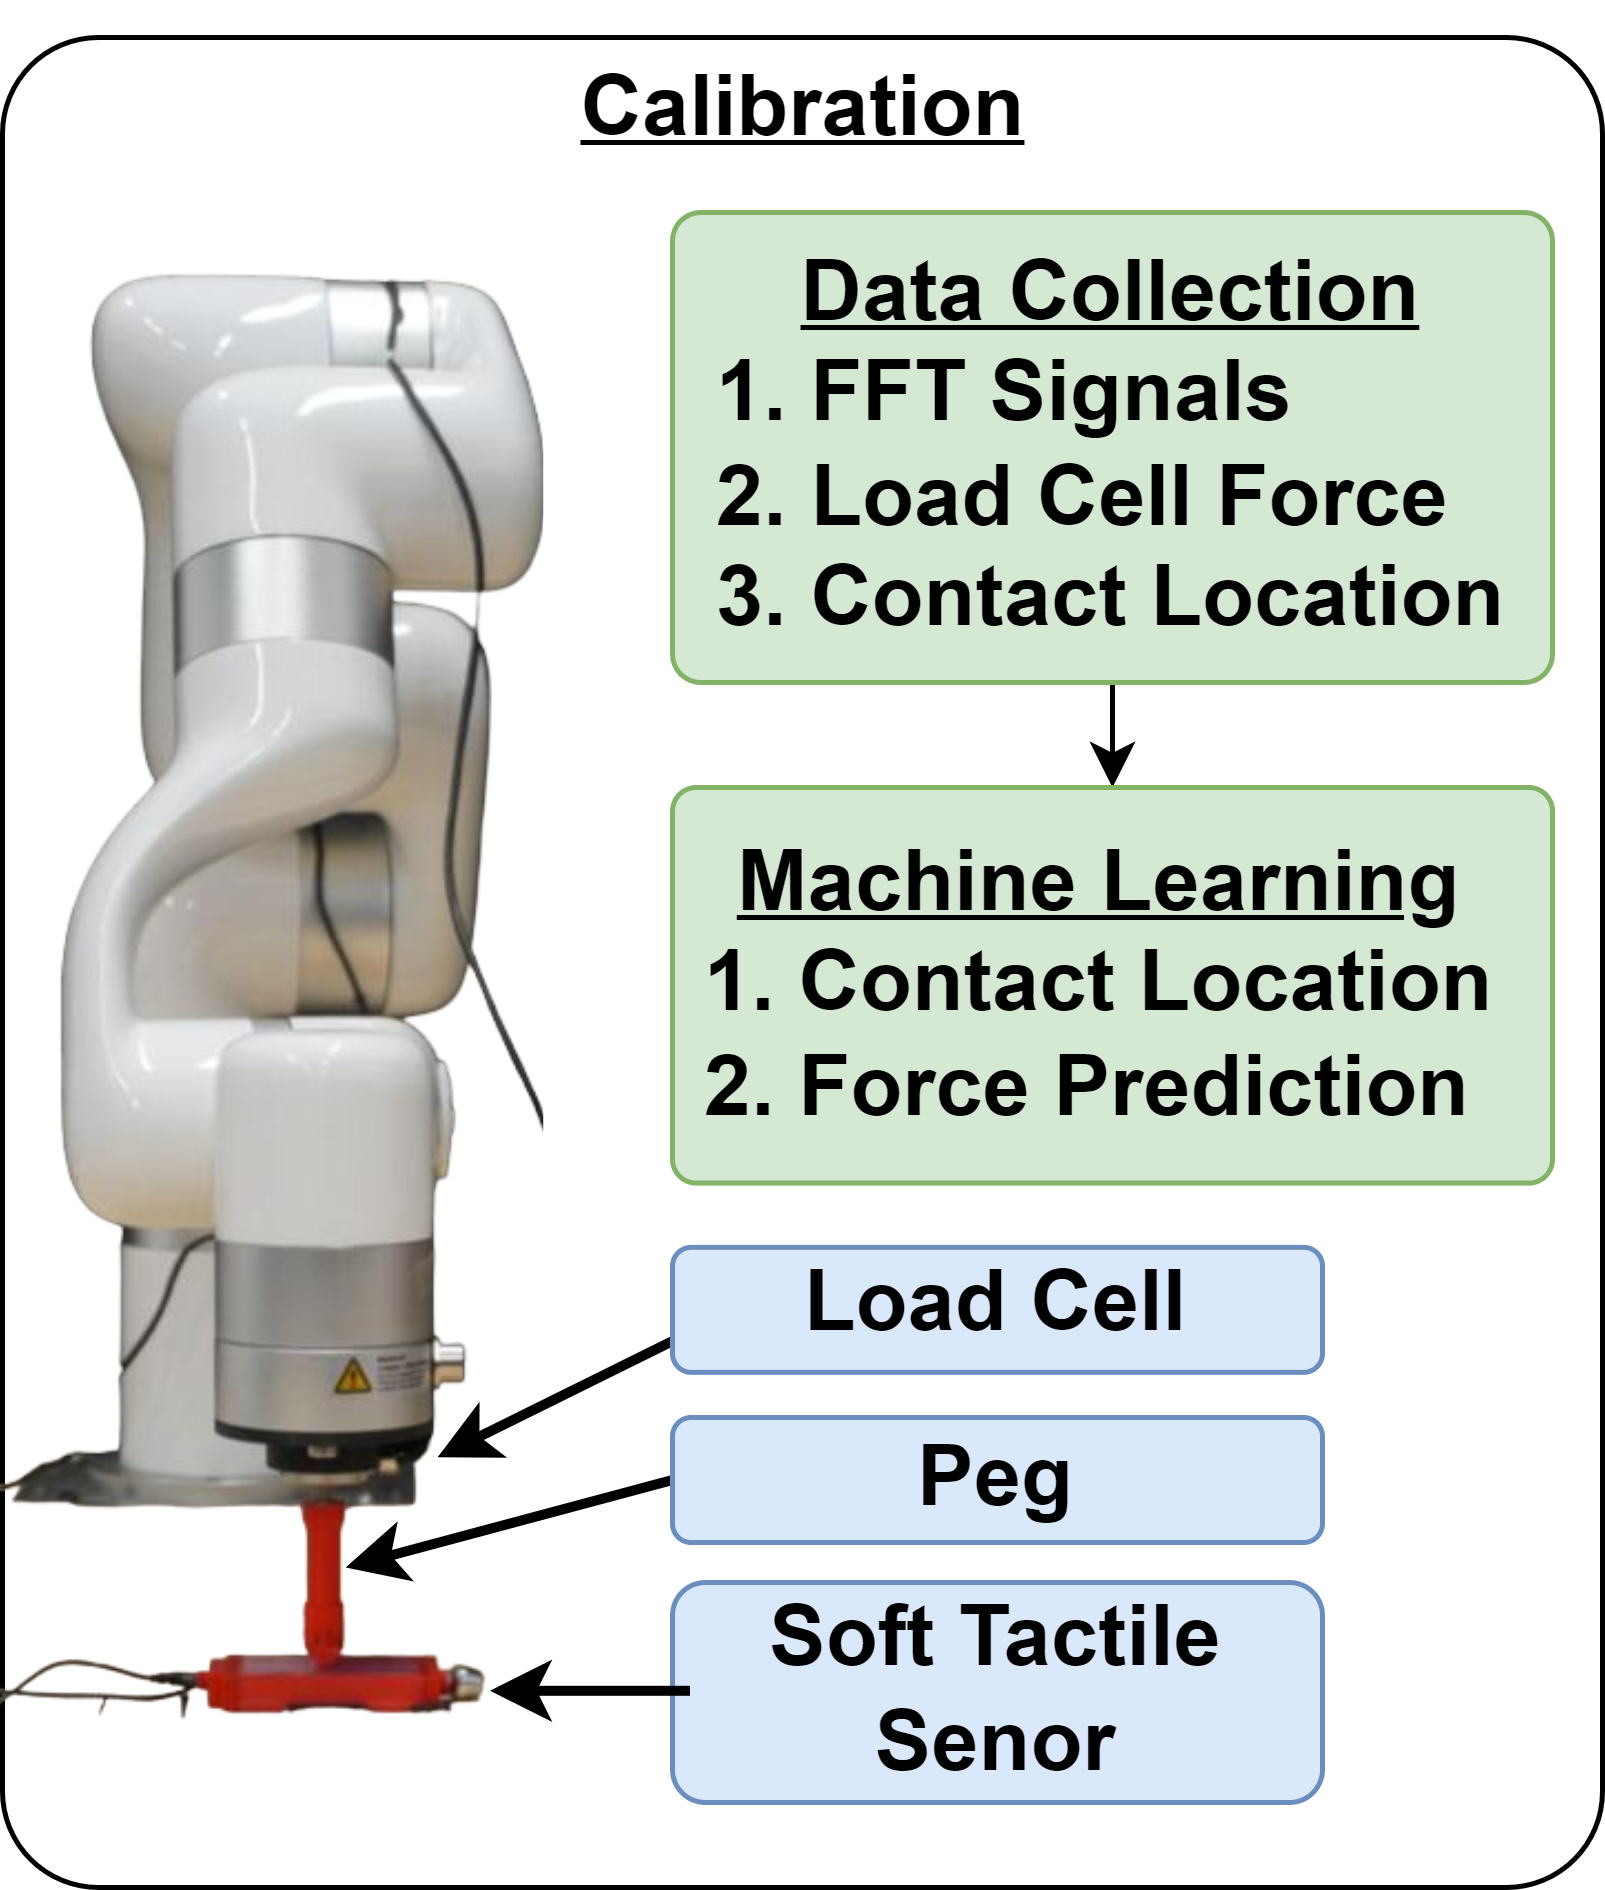
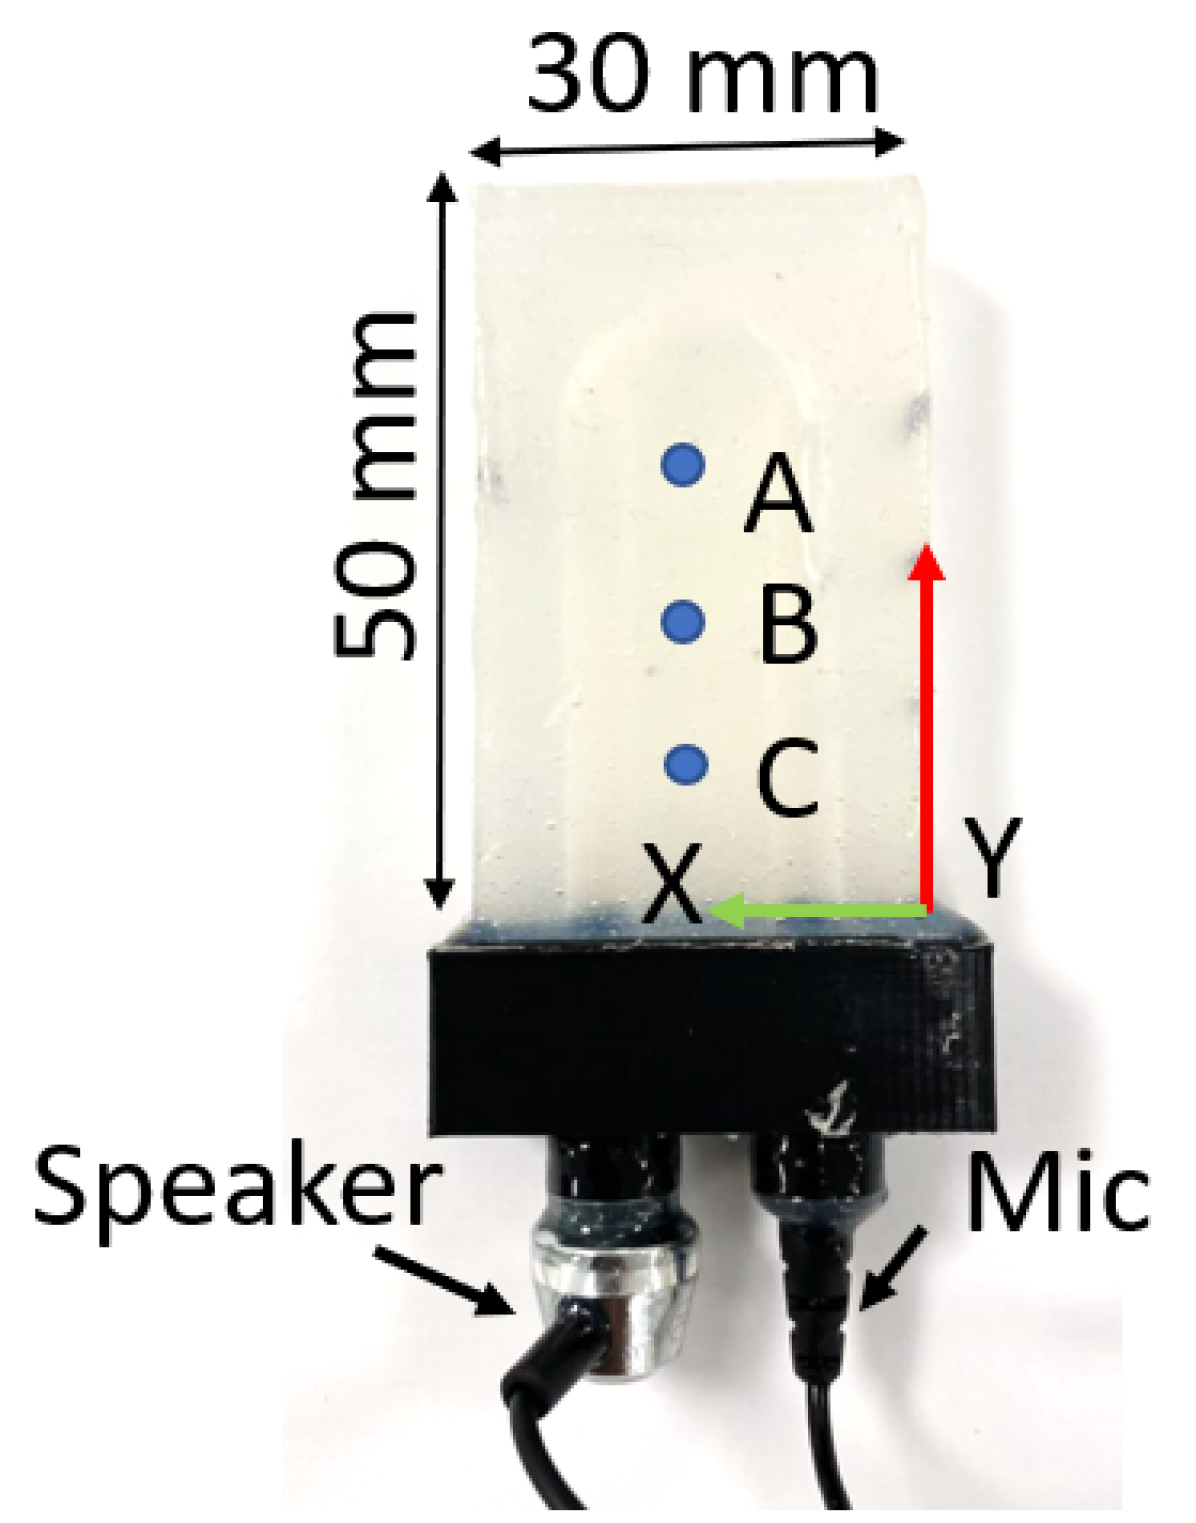
We used a 6 DOF robot arm222The UFactory xArm by ufactory.cc with a calibrated high-precision load cell (Miniature In Line Load Cell, a high-precision axial load cell with 0-1kN range and N resolution) mounted on the robot wrist. It has an inbuilt driver board for USB communication with the PC and is mounted with a wedge-shaped 3D-printed peg as shown in Fig. 1b. We used the arm to apply a force on STS sensing points by the load cell and peg. We initially considered three calibration points on the skin surface for all configurations, namely , , and , as illustrated in Fig. 2(j). Point A and C are closer to the microphone and the speaker, respectively.
|
Regression model | RMSE | Classifier model | Accuracy (%) | ||
|---|---|---|---|---|---|---|
| AST 1 | Exponential GP | 0.72 | Bagged Ensemble Trees | 96.4 | ||
| AST 2a | Rational Quadratic GP | 2.21 | Fine Guassian SVM | 95.7 | ||
| AST 2b | Matern 5/2 GP | 3.24 | Weighted KNN | 98.2 | ||
| AST 3a | Exponential GP | 2.15 | Bilayered NN | 92.5 | ||
| AST 3b | Exponential GP | 1.06 | Bagged Ensemble Trees | 91.9 | ||
| AST 4a | Exponential GP | 3.25 | Weighted KNN | 92.8 | ||
| AST 4b | Exponential GP | 3.6 | Fine Gaussian SVM | 95.4 | ||
| AST 4c | Exponential GP | 2.53 | Weighted KNN | 97.2 | ||
| AST 4d | Exponential GP | 1.18 | Weighted KNN | 97.3 |
For the calibration process, the STS was positioned in a fixed location on the workbench, as depicted in Fig. 1b, and a continuous reference sound signal was emitted through the speaker(s). The specific characteristics of this reference signal are outlined in the upcoming subsection. Subsequently, the robot arm sequentially approached each calibration point while a peg attached to the arm exerted pressure by an incremental push move of 0.2 mm. As the peg’s central axis traversed vertically through the designated points, the AC(s) underwent compression. At every 0.2 mm increment, the corresponding load cell measurements were recorded, and simultaneously, the microphone captured 50 samples of the received sound signal. This procedure was repeated until the load cell reading reached 30+1 N (∗, indicates the tolerance of the value).
Reference Sound Signal: A test reference sound signal is generated using Audacity. It comprises four sine waves of frequencies of 300, 500, 700, and 900 Hz with an amplitude of 0.6 (on a 0 to 1 scale). During the sensor operation, this reference signal is played through the speaker(s).
Data Processing: The data processing pipeline for the calibration process is shown in Fig. 1b. After data processing, the resulting dataset contains the load cell reading with the corresponding contact location (A, B, or C) and the modulated sound waves’ amplitudes and frequencies. We use Fast Fourier Transform (FFT) to compute the amplitudes of the sound signals received by the microphone (FFT data). For each skin model, 5100 data points are generated, with 1700 data points each for the three locations, A, B, and C.
IV-B Force and Contact Location Estimation:
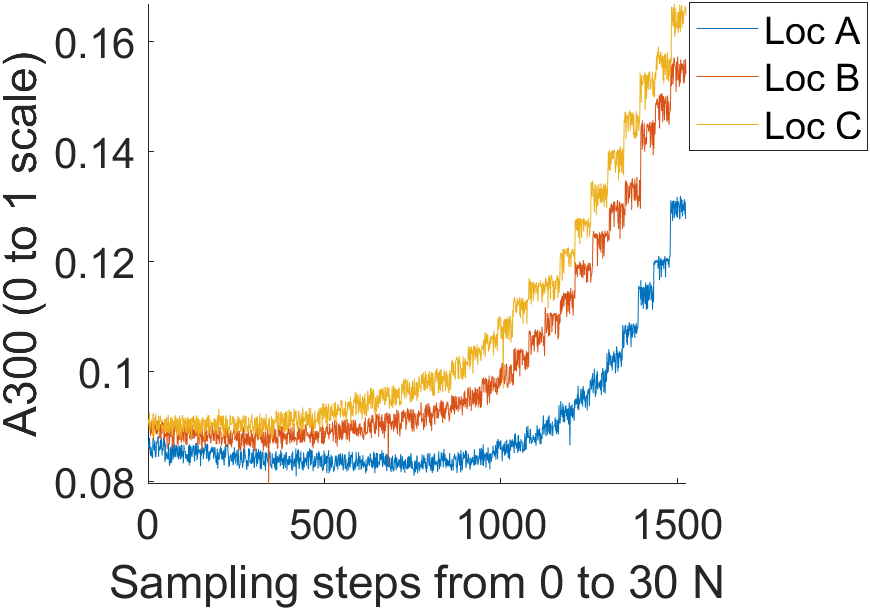
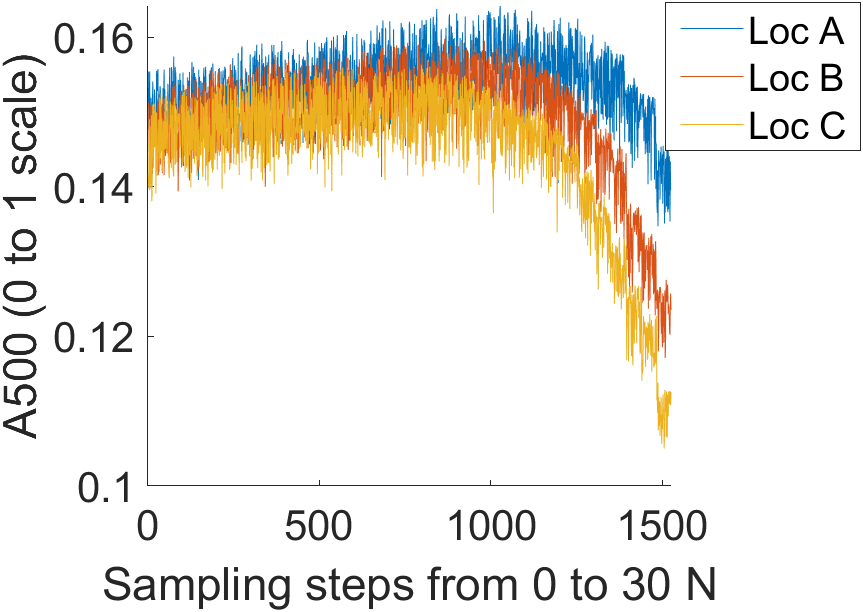
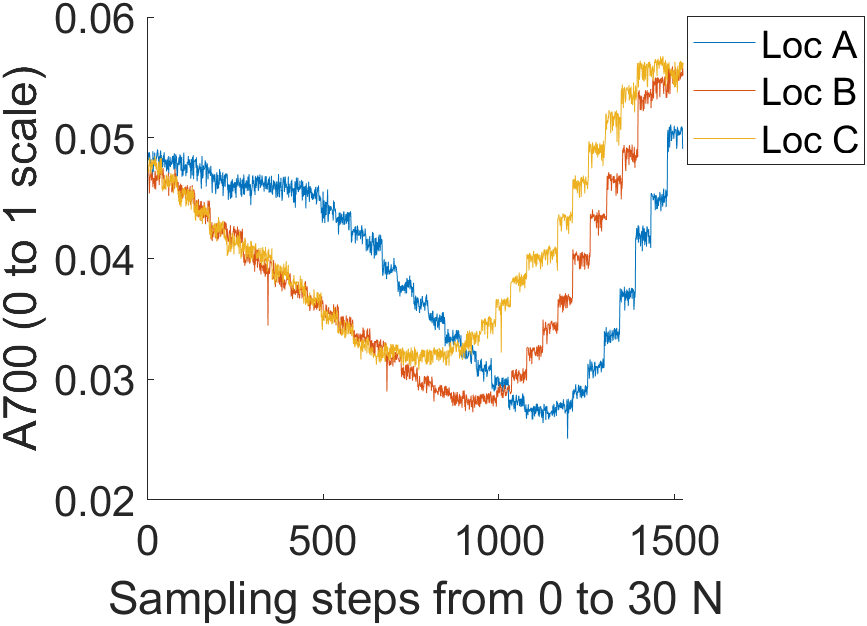
We learned the amplitudes of individual frequency components in the reference signal (FFT data) vary with an increase in force from 0 to 30+1 N at each location A, B, and C on the STS. Fig. 3 presents a sample of these variations for STS 1. This indicates the collected FFT data effectively estimate unknown forces and their contact locations. Therefore, we express the unknown force and its location as:
| (1) |
where is the unknown force at instance , are the amplitudes of frequency components of the FFT at 300, 500, 700, and 900 Hz recorded at the same instance (FFT data), and is the location of contact (A, B or C).
Performance Metrics: The following metrics present the outcomes of the tests conducted to present the findings. (i) We use validation error and/or efficiency for the selection of regression and classifier models and each STS. (ii) The performance force estimation is presented as the percentage of estimations that fall within 0.50 N, 1 N, and 1.50 N tolerance of the actual force values. (iii) The contact location estimation performance is presented as the total number of true estimations per test (170 trials are tested for each STS location), and they are averaged to define the overall accuracy. We compared various regression and classifier models (see Appendix11footnotemark: 1) to estimate the force and its location from the FFT data. We compare these models’ validation errors/accuracy for each STS data. The models are trained using a dataset partition of 90:10 and 10-fold cross-validation. The regression model with the minimum validation error and the classifier with the maximum accuracy are selected for estimating force and location, respectively (refer to table I). The details of force and location estimations using these models are presented below.
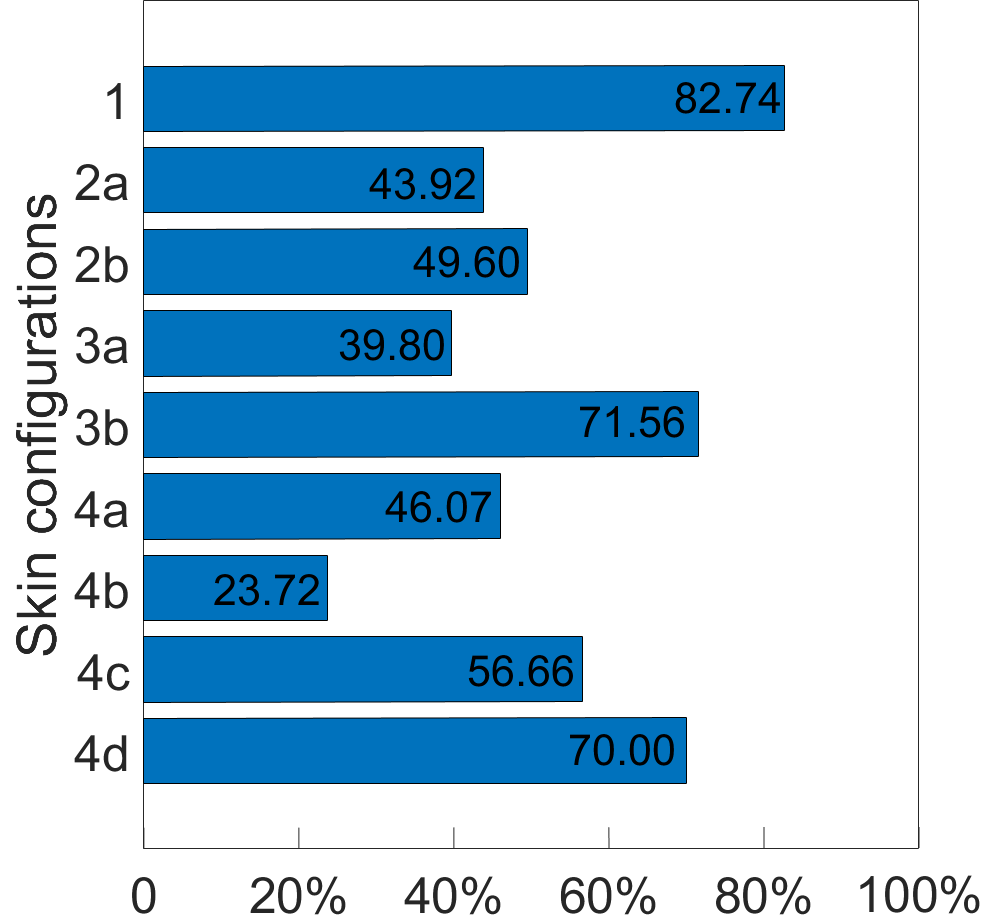
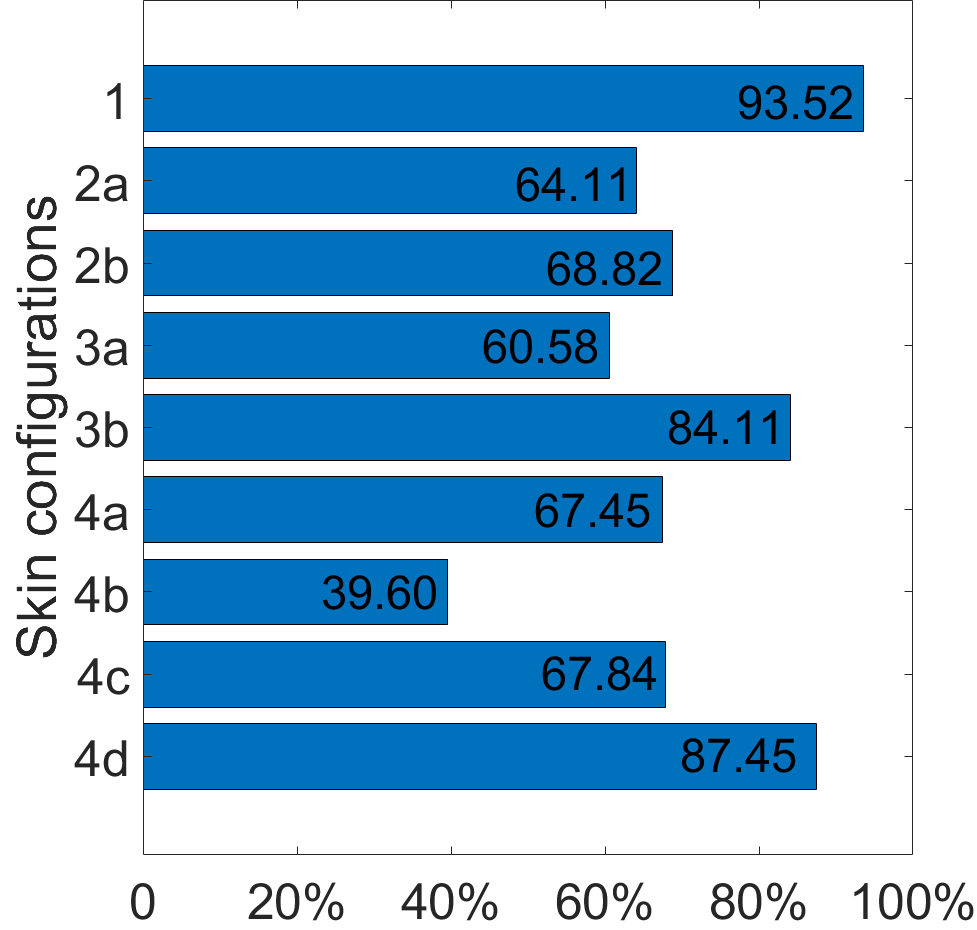
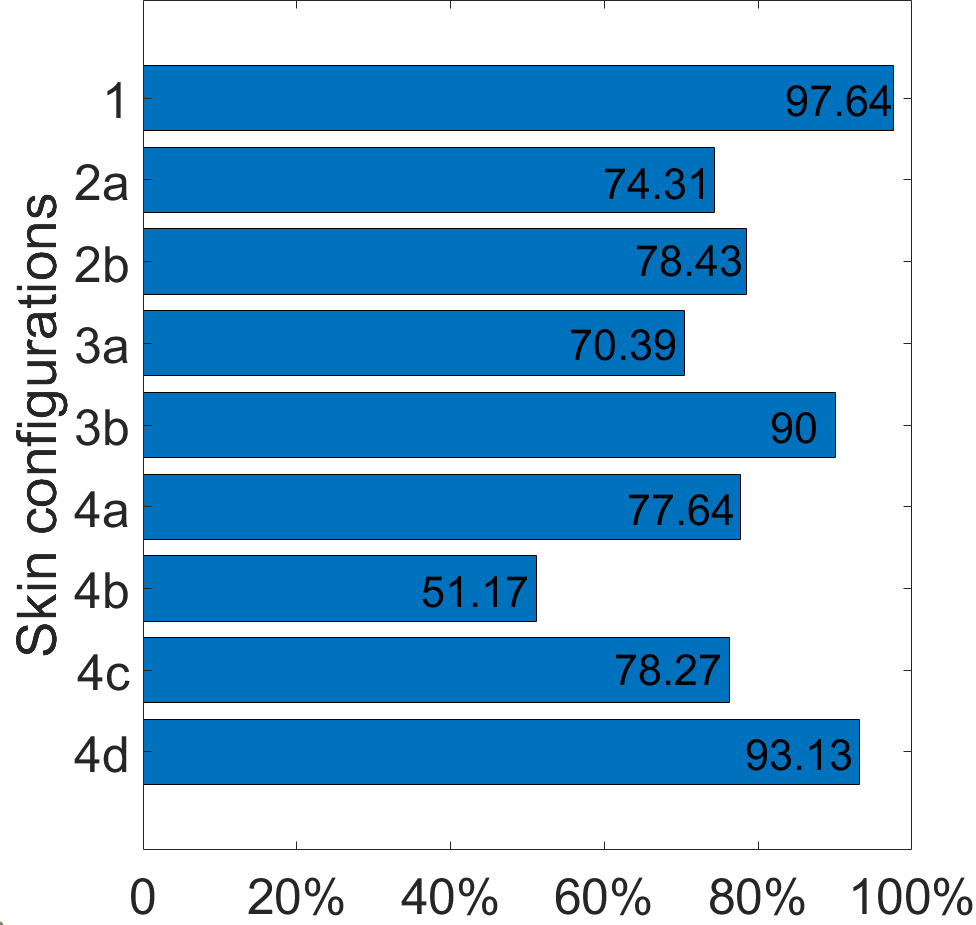
Force estimation: The force estimation performance of the STSs is presented in Fig. 4, showing the percentage of force estimations falling within 0.5 N, 1 N, and 1.5 N tolerances. The performance of each skin configuration is analysed based on the effect of AC geometries and speaker configuration.
| True predictions | STS configuration | ||||||||
|---|---|---|---|---|---|---|---|---|---|
| STS 1 | STS 2a | STS 2b | STS 3a | STS 3b | STS 4a | STS 4b | STS 4c | STS 4d | |
| A | 169 | 169 | 168 | 165 | 163 | 168 | 168 | 168 | 168 |
| B | 160 | 168 | 169 | 150 | 142 | 151 | 156 | 165 | 167 |
| C | 164 | 153 | 168 | 161 | 150 | 155 | 162 | 166 | 162 |
| Accuracy (%) | 96.66 | 96.07 | 99.01 | 93.33 | 89.21 | 92.94 | 95.29 | 97.84 | 97.45 |
IV-B1 Effect of Acoustic Channel Geometry
The single-channel STS 1 configuration demonstrated a force estimation accuracy of 82.74% within 0.5 N tolerance range and 93.5% within 1 N range, indicating that a single channel with a uniform geometrical shape can accurately infer contact forces acting on different points. Other skin configurations were also tested to investigate the feasibility of using an array of AC to serve a skin that may require a broader sensing surface area. The results in Fig. 4 show that considerably better performance can be achieved when the channel geometries are non-identical and a single speaker unit serves all channels. This is evident when comparing the performance of skin configuration STS 3b, STS 4c, and STS 4d with STS 2b.
IV-B2 Effect of Speaker Configuration
The results in Fig 4 indicate that the dual-channel skin configurations with a single speaker (STS 2b, STS 3b, STS 4c, STS 4d) mostly outperformed others or showed comparable performance to their speaker designs (STS 2a, STS 3a, STS 4a, STS 4b). This suggests that a single speaker can serve multiple channels without compromising performance. This finding can imply that the skin technology is potentially scalable, and a skin with multiple channels may not require an equal number of speakers (this is an open question for future works). Speakers on different ends of channels did not show any significant impact on the sensor performance.
Contact Location Estimation: Table II presents the accuracy of each STS configuration for estimating the contact locations (tested for 170 cases per location). All skin configurations achieved a high accuracy of 89% for location estimation. The results in Table II also indicate that the performance of location estimation is better with a single speaker serving the AC(s).
The results demonstrate (1) A smaller-width skin can utilise a single acoustic channel to measure contact force and its location accurately. The channel can also have a simple geometry, such as a cylinder. Although the shape is fixed along its length, it can still distinguish forces and their locations applied at different points. (2) For skin with a broader sensing surface area, an array of non-identical ACs can be used, and individual speakers for each channel may not be necessary. (3) Further study will investigate STS with different AC shapes that may lead to improved STS performance.
V Frame-less STS
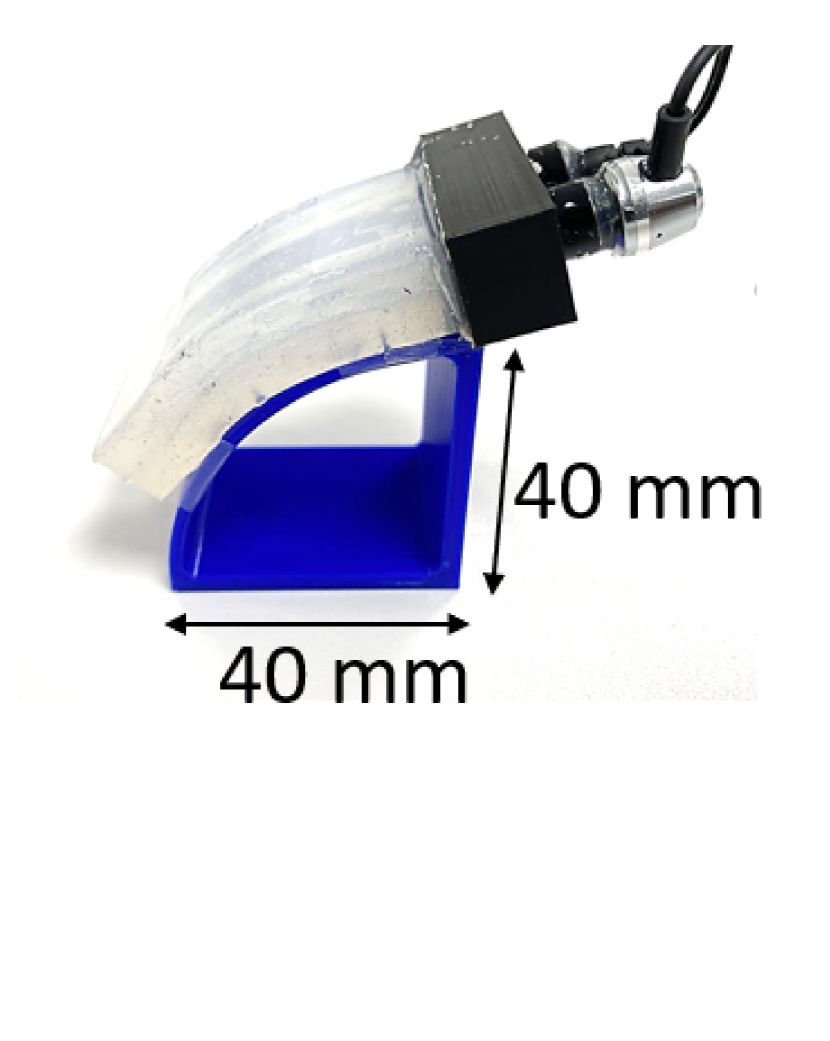
Frame-less STS (f-STS) is the evolution of this STS concept, where it has a flexible sensing membrane capable of being fastened to any curved surface. This skin design can provide a broader range of robotic equipment with tactile sensation, such as enabling safer human-robot interactions in shared work environments. The test design of f-STS has a casing to house the speaker and microphone at the bottom and from which the sensing surface extends (refer fig.5(a)). The acoustic channel design is cylindrical, connecting the speaker and microphone, inspired by STS 1 design which was the best-performing configuration. To test its capability of being used on curved surfaces for tactile sensing, the f-STS is attached to a 3D-printed curved surface, as shown in fig.5(b). The prototyping procedure is detailed in the Appendix11footnotemark: 1.
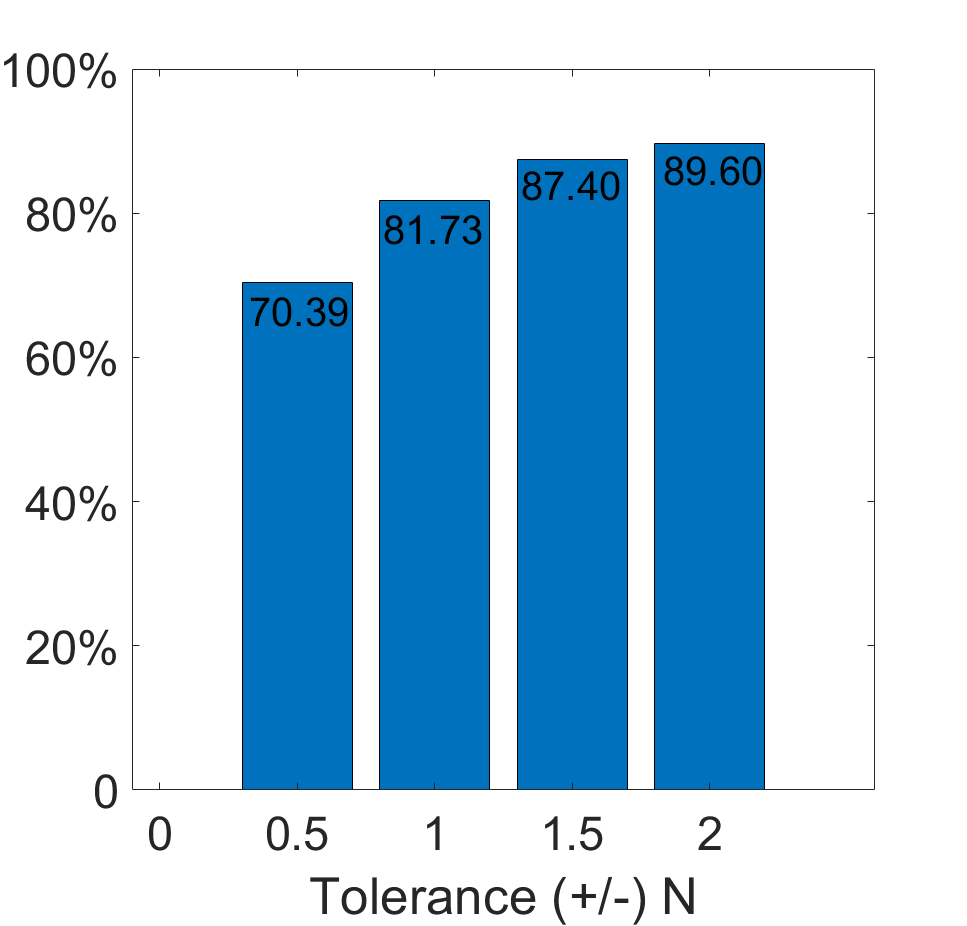
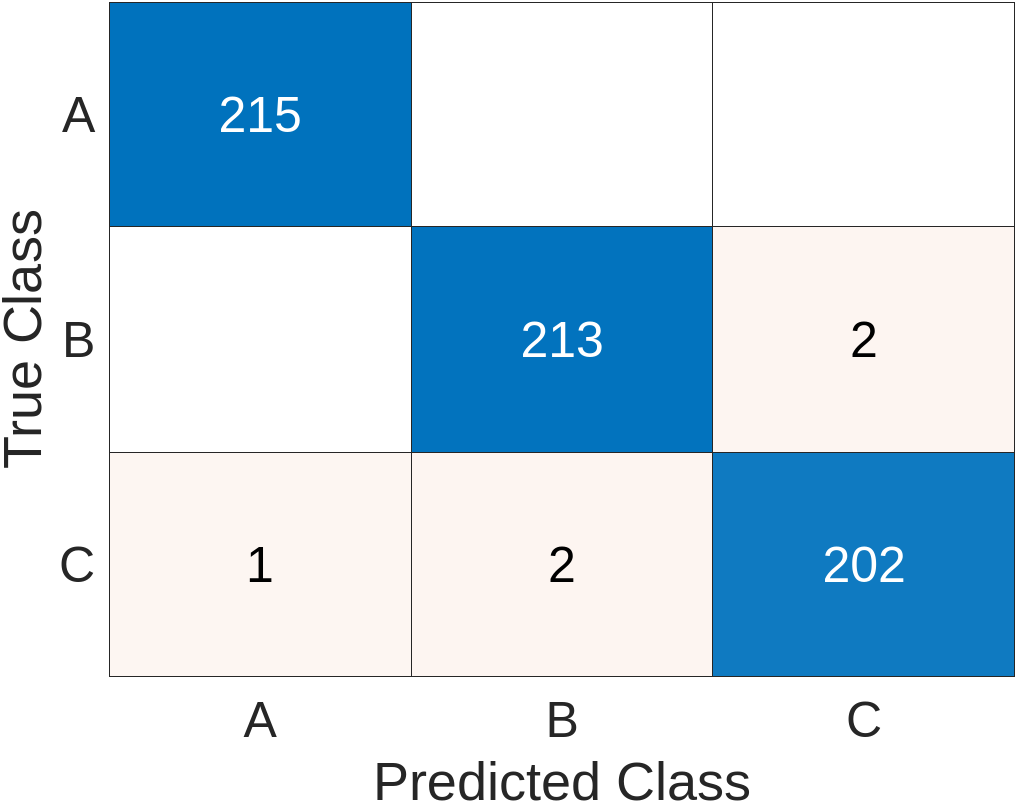
To test the force and contact location capability, we employed a similar calibration process as used before. We chose three calibration points spaced 10 mm apart (while higher resolution calibration is feasible, it requires significantly more time) as illustrated in Fig.5(a). A total of 6350 data points were collected, and we utilised a 90:10 data partitioning scheme for training and testing purposes. Here too, we evaluated various regression and classification methods, ultimately selecting the optimal model for estimating the force and its location. The Bagged Trees Ensemble exhibited the most promising cross-validation results, yielding a cross-validation error of 1.77 N for force estimation and a cross-validation accuracy of 99.2% for estimating force location. Fig.5(c) presents the percentage of accurately estimated forces with different tolerance values. Notably, 70.39% of force estimations fall within the 0.50 N tolerance range, while this percentage increases to 81.73%, 87.40%, and 89.60% within 1 N, 1.50 N and 2 N tolerances, respectively. STS demonstrates an impressive 99% accuracy for contact location estimation (Fig. 5(d)). These results show STS technology can be used as a sensory cover for surfaces with different geometry needing tactile sensing.
| Target Grip Force | White Noise | Mean Absolute Error | ||||
| Chess | Dice | Lemon | Marble | Strawberry | ||
| 2 N | Off | 0.03 | 0.04 | 0.04 | 0.05 | 0.02 |
| On | 0.08 | 0.05 | 0.05 | 0.06 | 0.09 | |
| 10 N | Off | 0.26 | 0.14 | 0.38 | 0.40 | 0.51 |
| On | 0.36 | 0.22 | 0.38 | 0.78 | 0.91 | |
| 20 N | Off | 0.40 | 1.20 | 0.40 | 0.73 | 0.19 |
| On | 0.61 | 1.10 | 0.63 | 0.81 | 0.21 | |
V-A Noise Interference Test
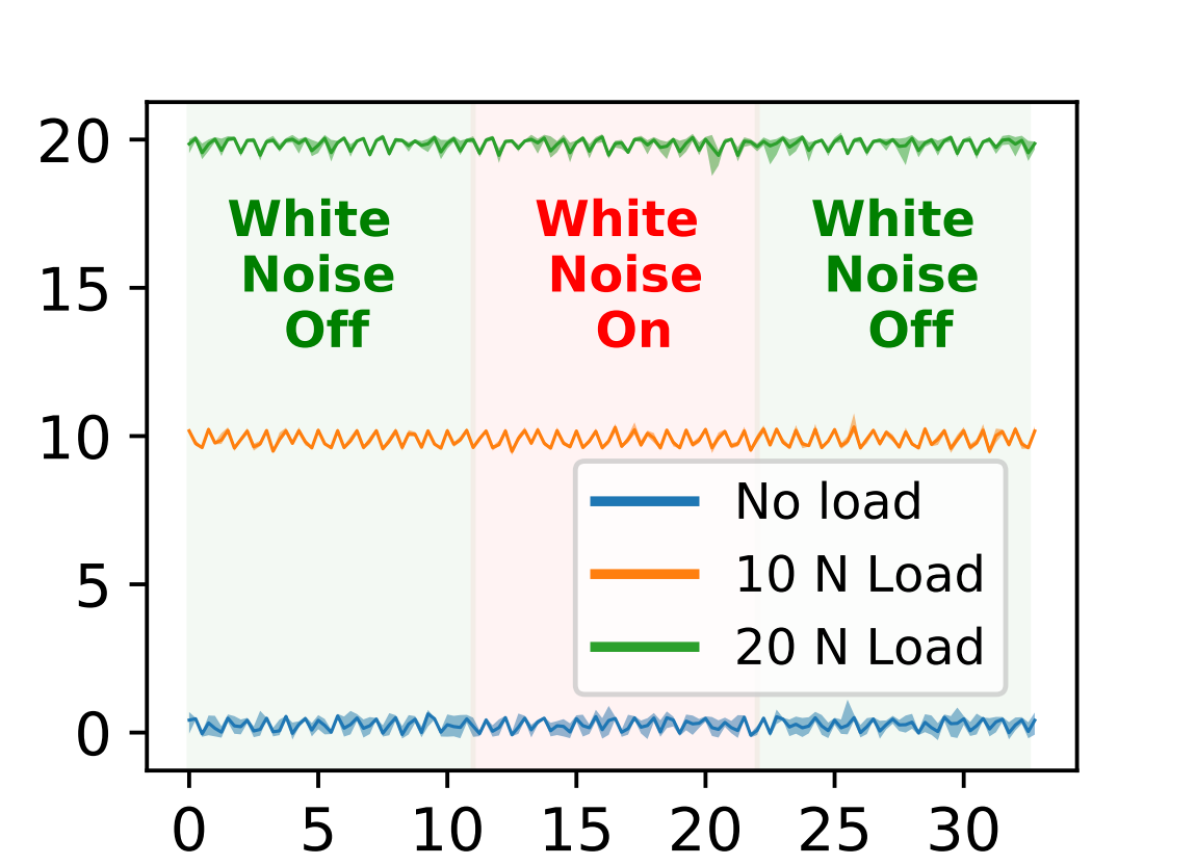
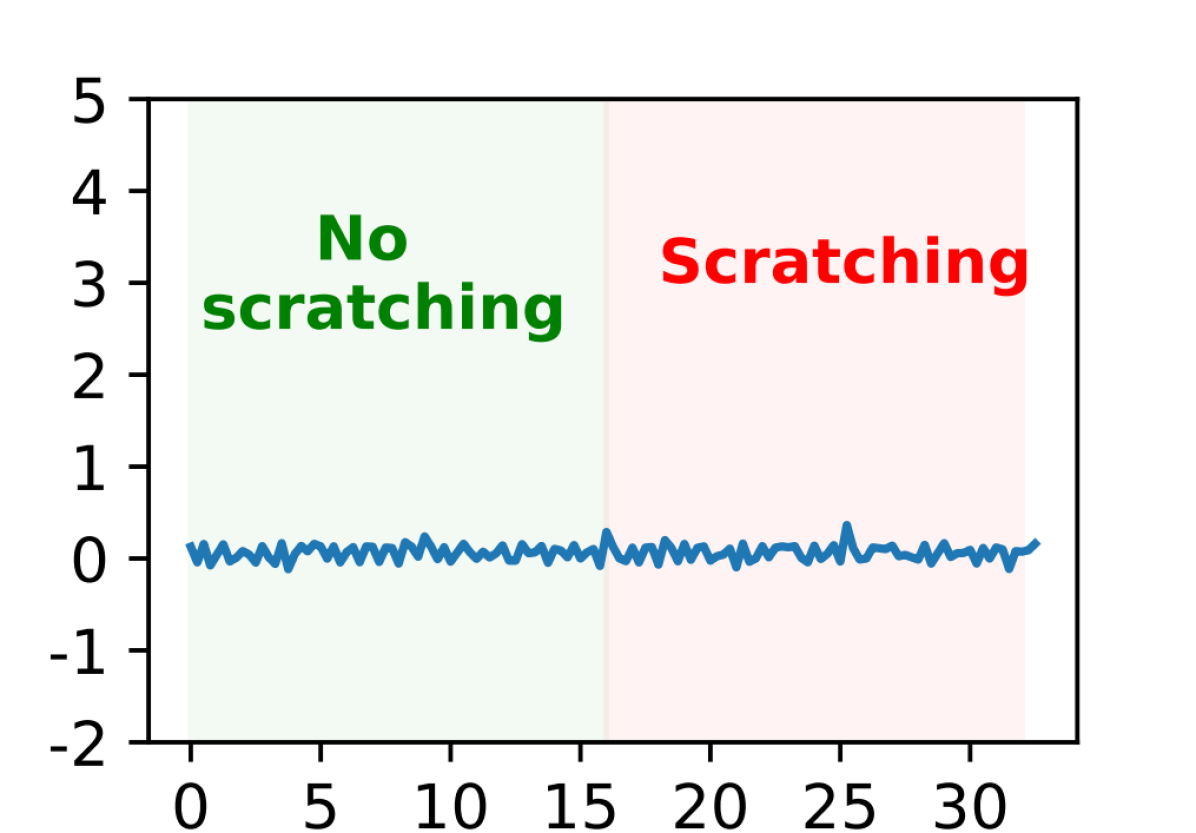
We study the robustness of f-STS in the presence of white noise at 100 decibels for zero, 10 N, and 20 N constant loading on point B. Fig 6(a) shows the sensor readings in the white noise tests. In test trials, we start with 11 seconds of normal conditions, then turn on the noise for the next 11 seconds, and finally return to normal conditions for the last 11 seconds. We repeated each loading test 5 times. Fig. 6(a) shows the mean and variance of the f-STS reading, demonstrating it is robust to the white ambient noise. We also tested the effect of the contact noise on f-STS readings by scratching the f-STS surface with no load condition with a stiff paintbrush for 11 seconds (Fig.6(b)). The figure shows that the sensor readings remain constant for smooth strokes compared to the normal no-load condition. Testing the contact noise effect under different loading conditions can be complex, as distinguishing the changes in f-STS readings resulting from contact noise or from the actual contact forces may not be trivial.
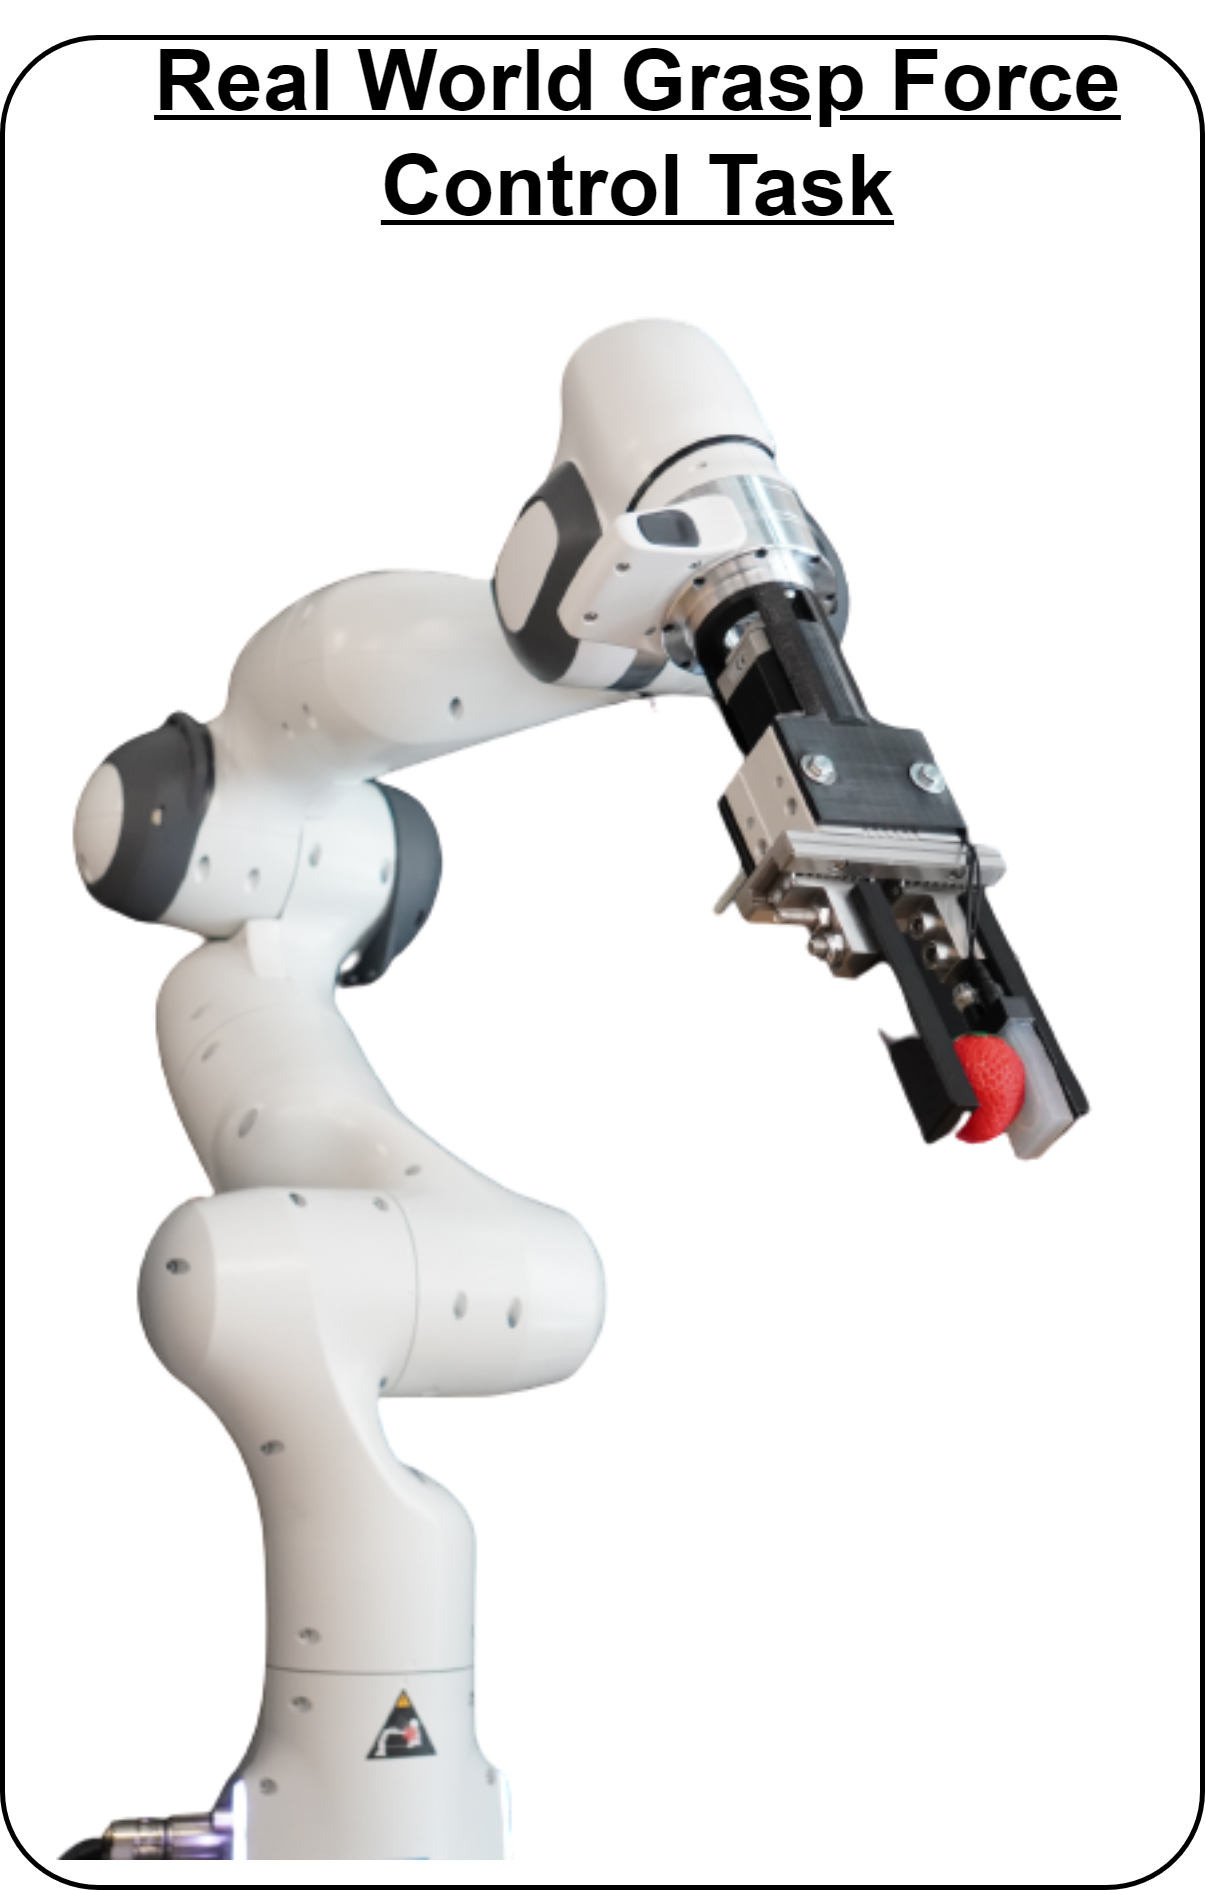
V-B Robotic Application
We tested the f-STS in a pick-and-place task with real-time grip force control. We evaluated the performance of the controller by gripping five test objects from the YCB object set [26] with and without the presence of white noise (100 decibels). Fig. 1c shows an experimental setup consisting of (1) a seven dof Franka Emika arm, (2) an SMC LEZH gripper, and (3) an f-STS. SMC gripper has a 30 mm stroke with a maximum 210 N grip force. The control task includes (i) gripping an object from a top pose with a specified grip force, (ii) lifting the object upward 10 cm, (iii) moving it to a goal point, and (iv) dropping it there. The grip force controller aims to keep the grip force constant during stages using the STS tactile feedback. When the robot reaches the grip pose, the gripper starts decreasing its grip width with a 1mm step size until the measured grip force by f-STS sensor reaches a target desired value. Then, the lift, move, and drop stages are executed automatically. We tested the controller for three target grip forces, namely 2N, 10N, and 20N.
Table III shows the Mean Absolute Error (MAE) of the target grip forces per object, and they are in the acceptable range for an early-stage prototype. The target force is based on the f-STS sensor readings and not a true contact force from a load cell. For 2N and 10N target grip forces, strawberry resulted in the highest MAE. For 20N, the dice show the highest MAE. This is because these contact shapes are not in the calibration data set. However, this can be covered by an extensive calibration dataset. The table also shows that although the MAE in the reading during the white noise can be slightly higher than the normal test condition, they are very close to the desired force value.
VI Conclusion
We presented the concept of a novel Soft Tactile skin technology based on sound wave amplitude modulation. STS uses Acoustic Channels beneath the sensing surface to measure the contact normal force and its location. To validate the concept, we studied different STS designs with different configurations of Acoustic Channels, acoustic hardware (speaker-mic) to validate the concept. During our study, STS made more than 93% of static normal force estimations with 1.5 N tolerance for a full-scale force range of 0-30+1 N and also made more than 96% accurate force contact location estimations. Moreover, we made a prototype of a frame-less STS (f-STS) and tested it. f-STS shows the potential of using the STS technology as a tactile sensory cover on curved surfaces and other real-time robotic applications. Overall, the STS has the potential to become a valuable tool for tactile measurements for various robotic applications. We hope STS contributes to the advances in learning physical robot interactions.
References
- [1] M. Fritzsche, N. Elkmann, and E. Schulenburg, “Tactile sensing: A key technology for safe physical human robot interaction,” in Proceedings of the 6th International Conference on Human-robot Interaction, 2011, pp. 139–140.
- [2] H. Yousef, M. Boukallel, and K. Althoefer, “Tactile sensing for dexterous in-hand manipulation in robotics—a review,” Sensors and Actuators A: physical, vol. 167, no. 2, pp. 171–187, 2011.
- [3] W. Mandil, K. Nazari, and A. Ghalamzan, “Action Conditioned Tactile Prediction: case study on slip prediction,” in Proceedings of Robotics: Science and Systems, New York City, NY, USA, 6 2022.
- [4] R. S. Dahiya, G. Metta, M. Valle, and G. Sandini, “Tactile sensing—from humans to humanoids,” IEEE transactions on robotics, vol. 26, no. 1, pp. 1–20, 2009.
- [5] J. Dargahi and S. Najarian, “Advances in tactile sensors design/manufacturing and its impact on robotics applications–a review,” Industrial Robot: An International Journal, 2005.
- [6] J. Zimmer, T. Hellebrekers, T. Asfour, C. Majidi, and O. Kroemer, “Predicting grasp success with a soft sensing skin and shape-memory actuated gripper,” in 2019 IEEE/RSJ International Conference on Intelligent Robots and Systems (IROS). IEEE, 2019, pp. 7120–7127.
- [7] Q. Li, Z. Ullah, W. Li, Y. Guo, J. Xu, R. Wang, Q. Zeng, M. Chen, C. Liu, and L. Liu, “Wide-range strain sensors based on highly transparent and supremely stretchable graphene/ag-nanowires hybrid structures,” Small, vol. 12, no. 36, pp. 5058–5065, 2016.
- [8] K. Song, S. H. Kim, S. Jin, S. Kim, S. Lee, J.-S. Kim, J.-M. Park, and Y. Cha, “Pneumatic actuator and flexible piezoelectric sensor for soft virtual reality glove system,” Scientific reports, vol. 9, no. 1, p. 8988, 2019.
- [9] M. Rehan, M. M. Saleem, M. I. Tiwana, R. I. Shakoor, and R. Cheung, “A soft multi-axis high force range magnetic tactile sensor for force feedback in robotic surgical systems,” Sensors, vol. 22, no. 9, p. 3500, 2022.
- [10] G. Diguet, J. Froemel, M. Muroyama, and K. Ohtaka, “Tactile sensing using magnetic foam,” Polymers, vol. 14, no. 4, p. 834, 2022.
- [11] H. Wu, B. Zheng, H. Wang, and J. Ye, “New flexible tactile sensor based on electrical impedance tomography,” Micromachines, vol. 13, no. 2, p. 185, 2022.
- [12] B. Ward-Cherrier, N. Pestell, L. Cramphorn, B. Winstone, M. E. Giannaccini, J. Rossiter, and N. F. Lepora, “The tactip family: Soft optical tactile sensors with 3d-printed biomimetic morphologies,” Soft robotics, vol. 5, no. 2, pp. 216–227, 2018.
- [13] D. F. Gomes and S. Luo, “Geltip tactile sensor for dexterous manipulation in clutter,” in Tactile Sensing, Skill Learning, and Robotic Dexterous Manipulation. Elsevier, 2022, pp. 3–21.
- [14] W. Yuan, S. Dong, and E. H. Adelson, “Gelsight: High-resolution robot tactile sensors for estimating geometry and force,” Sensors, vol. 17, no. 12, p. 2762, 2017.
- [15] E. Donlon, S. Dong, M. Liu, J. Li, E. Adelson, and A. Rodriguez, “Gelslim: A high-resolution, compact, robust, and calibrated tactile-sensing finger,” in 2018 IEEE/RSJ International Conference on Intelligent Robots and Systems (IROS). IEEE, 2018, pp. 1927–1934.
- [16] M. Lambeta, P.-W. Chou, S. Tian, B. Yang, B. Maloon, V. R. Most, D. Stroud, R. Santos, A. Byagowi, G. Kammerer et al., “Digit: A novel design for a low-cost compact high-resolution tactile sensor with application to in-hand manipulation,” IEEE Robotics and Automation Letters, vol. 5, no. 3, pp. 3838–3845, 2020.
- [17] Z. Chen, S. Zhang, S. Luo, F. Sun, and B. Fang, “Tacchi: A pluggable and low computational cost elastomer deformation simulator for optical tactile sensors,” IEEE Robotics and Automation Letters, vol. 8, no. 3, pp. 1239–1246, 2023.
- [18] C. Sferrazza and R. D’Andrea, “Design, motivation and evaluation of a full-resolution optical tactile sensor,” Sensors, vol. 19, no. 4, p. 928, 2019.
- [19] D. Gong, R. He, J. Yu, and G. Zuo, “A pneumatic tactile sensor for co-operative robots,” Sensors, vol. 17, no. 11, p. 2592, 2017.
- [20] C.-H. Chuang, H.-K. Weng, J.-W. Chen, and M. O. Shaikh, “Ultrasonic tactile sensor integrated with tft array for force feedback and shape recognition,” Sensors and Actuators A: Physical, vol. 271, pp. 348–355, 2018.
- [21] H. Shinoda, K. Matsumoto, and S. Ando, “Acoustic resonant tensor cell for tactile sensing,” in Proceedings of International conference on Robotics and Automation, vol. 4. IEEE, 1997, pp. 3087–3092.
- [22] Y. Tanaka, T. Fukuda, M. Fujiwara, and A. Sano, “Tactile sensor using acoustic reflection for lump detection in laparoscopic surgery,” International journal of computer assisted radiology and surgery, vol. 10, pp. 183–193, 2015.
- [23] K. Teramoto and K. Watanabe, “Acoustical tactile sensor utilizing multiple reflections for principal curvature measurement,” in SICE 2001. Proceedings of the 40th SICE Annual Conference. International Session Papers (IEEE Cat. No. 01TH8603). IEEE, 2001, pp. 339–344.
- [24] K. Park, H. Yuk, M. Yang, J. Cho, H. Lee, and J. Kim, “A biomimetic elastomeric robot skin using electrical impedance and acoustic tomography for tactile sensing,” Science Robotics, vol. 7, no. 67, p. eabm7187, 2022.
- [25] N. F. Lepora, “Soft biomimetic optical tactile sensing with the tactip: A review,” IEEE Sensors Journal, vol. 21, no. 19, pp. 21 131–21 143, 2021.
- [26] B. Calli, A. Walsman, A. Singh, S. Srinivasa, P. Abbeel, and A. M. Dollar, “Benchmarking in manipulation research: The ycb object and model set and benchmarking protocols,” arXiv preprint arXiv:1502.03143, 2015.
- [27] G. Zöller, V. Wall, and O. Brock, “Active acoustic contact sensing for soft pneumatic actuators,” in 2020 IEEE International Conference on Robotics and Automation (ICRA). IEEE, 2020, pp. 7966–7972.
- [28] V. Wall, G. Zöller, and O. Brock, “Passive and active acoustic sensing for soft pneumatic actuators,” arXiv preprint arXiv:2208.10299, 2022.
- [29] H. Shinoda and S. Ando, “A tactile sensor with 5-d deformation sensing element,” in Proceedings of IEEE International Conference on Robotics and Automation, vol. 1. IEEE, 1996, pp. 7–12.
- [30] G. Zöller, V. Wall, and O. Brock, “Acoustic sensing for soft pneumatic actuators,” in 2018 IEEE/RSJ International Conference on Intelligent Robots and Systems (IROS). IEEE, 2018, pp. 6986–6991.