Gazealytics: A Unified and Flexible Visual Toolkit for Exploratory and Comparative Gaze Analysis
Abstract.
We present a novel, web-based visual eye-tracking analytics tool called Gazealytics. Our open-source toolkit features a unified combination of gaze analytics features that support flexible exploratory analysis, along with annotation of areas of interest (AOI) and filter options based on multiple criteria to visually analyse eye tracking data across time and space. Gazealytics features coordinated views unifying spatiotemporal exploration of fixations and scanpaths for various analytical tasks. A novel matrix representation allows analysis of relationships between such spatial or temporal features. Data can be grouped across samples, user-defined AOIs or time windows of interest (TWIs) to support aggregate or filtered analysis of gaze activity. This approach exceeds the capabilities of existing systems by supporting flexible comparison between and within subjects, hypothesis generation, data analysis and communication of insights. We demonstrate in a walkthrough that Gazealytics supports multiple types of eye tracking datasets and analytical tasks.
1. Introduction
[]
Analysis of eye tracking data collected in observational studies is a complex process that aims to make sense of large amounts of gaze data involving high-frequency gaze samples, collected from a number of individuals (Pozdniakov et al., 2023; Afzal et al., 2022). Even in controlled experiments, there may be many samples collected, each involving multiple activities, which can result in long recordings requiring complicated multivariate data analysis (Chang et al., 2018; Servais et al., 2022; Burch, 2022). Therefore, to make analysis tractable, researchers often identify key areas of interest (AOIs) within the field of view, as well as time windows of interest (TWIs) throughout the period of participant activity (Menges et al., 2020; Kwok et al., 2019).
AOIs are typically pre-identified in the experimental setup and statistical methods can be used to test hypotheses concerning expected activity within and across AOIs. However, the comprehensive space-time data recorded from gaze tracking is not only useful for hypothesis testing but may also be used for building hypothesis, i.e., supported by data-driven exploratory eye tracking analysis (Kurzhals et al., 2016b).
Many of the current tools are inflexible in the degree to which they support exploratory data analysis (Menges et al., 2020; Burch et al., 2019). Existing non-visual tools allow analysis with a pre-defined hypothesis, but there is little in the way of tools that allow for the exploration or generation of hypothesis (Blascheck et al., 2016; Panetta et al., 2020). To our knowledge, there is no single tool that provides a highly dynamic visual exploration with filtering options based on multiple criteria over fixations, saccades and scanpaths across many ways of grouping the data, e.g., by samples, AOIs (spatial filtering), or TWIs (temporal filtering).
 \Description
[]
Our contribution is twofold. First, we provide a multi-way visual exploratory approach for data from eye tracking studies, extensively using matrix-based overview (see Figure 1). As we summarise in section 2, a unified general matrix relationship approach has not been previously presented for eye tracking analysis. Our second contribution is an interactive group-level exploration tool for gaze data analysis. Gazealytics provides flexible visual data aggregation for identifying gaze patterns at various data dimensions: samples, AOIs, and TWIs. We show with eye tracking examples that Gazealytics supports flexible exploratory and comparative analysis.
We make Gazealytics publicly available, as an open-source gaze analytics toolkit111https://github.com/gazealytics/gazealytics-master. The toolkit provides an easy-to-use interface to integrate into analysts’ existing workflow. Several users have already used the web application for their real-world eye tracking data analysis problems (see, e.g., (Cai et al., 2022; Pozdniakov et al., 2023; Chen et al., 2023)).
2. Related Work
![[Uncaptioned image]](/html/2303.17202/assets/x2.png)
Blascheck et al. (2017) survey techniques for interactive visualisation and visual analytics for eye tracking. Their taxonomy covers various facets of gaze analysis. In particular, they distinguish between static and dynamic stimuli, between passive and active stimulus content, between temporal, spatial, and spatiotemporal visualisations, and between point-based and AOI-based representations of gaze.
Our approach primarily targets static stimuli, and mostly passive stimulus content. Gazealytics provides a rich set of visualisation views, thus supporting a range of techniques to cover temporal, spatial, and spatiotemporal analysis. Finally, we make heavy use of AOIs to drive the analysis, but still support point-based visualisation as well.
Brehmer and Munzner (2013) list 11 categories to characterise task typology. Kurzhals et al. (2017) present six eye tracking visualization tasks to describe multivariate gaze data analysis and their derived analytical tasks. To support the elasticity of Gazealytics compared with state-of-the-art, we aim to support the full range of eye tracking visualisation tasks. Using Brehmer and Munzner (2013)’s typology and Blascheck et al. (2017)’s taxonomy, Table 1 compares Gazealytics with other visual eye tracking analytics tools—both research and commercial ones. It should be noted that the selection of tools for this comparison is based on literature review, and author’s collaborations with eye-tracking practitioners actively using the tools. The criteria focus on matrix-based visualisation and interactive group-level exploration. It is not meant to be exhaustive by any means; we have rather chosen a set of tools that cover a range of different functionalities and tasks that is closest to our work.
While existing visualisation techniques come with a variety of visualisation views (Blascheck et al., 2014), we want to pick out matrix-based visualisation as one particularly important one. Matrix visualisations can show AOI transitions of fixations and of aggregated or concatenated fixations over multiple samples between AOIs (Wang et al., 2021), scanpath similarity between samples (Kumar et al., 2019; Burch et al., 2018), relationships of mean fixation duration on AOIs by tasks (Siirtola et al., 2009), and so on.
Kurzhals et al. (2016a) point out that only little work had been done in combining traditional numerical-based analysis and human-in-the-loop gaze analytical reasoning. Therefore, there is still need for an improved combination of visual-interactive exploration and advanced visualisations.
In summary, Gazealytics adopts many of the individual visualisation views already known from the literature. In particular, it makes heavy use of matrix visualisation, aggregation, and filtering. However, as shown in Table 1, Gazealytics is unique in its combination of such individual components, the number and extent of supported visualisation views, their integration in the interactive and user-steered process, and the level of exposure of parameters to the user.
3. System and design
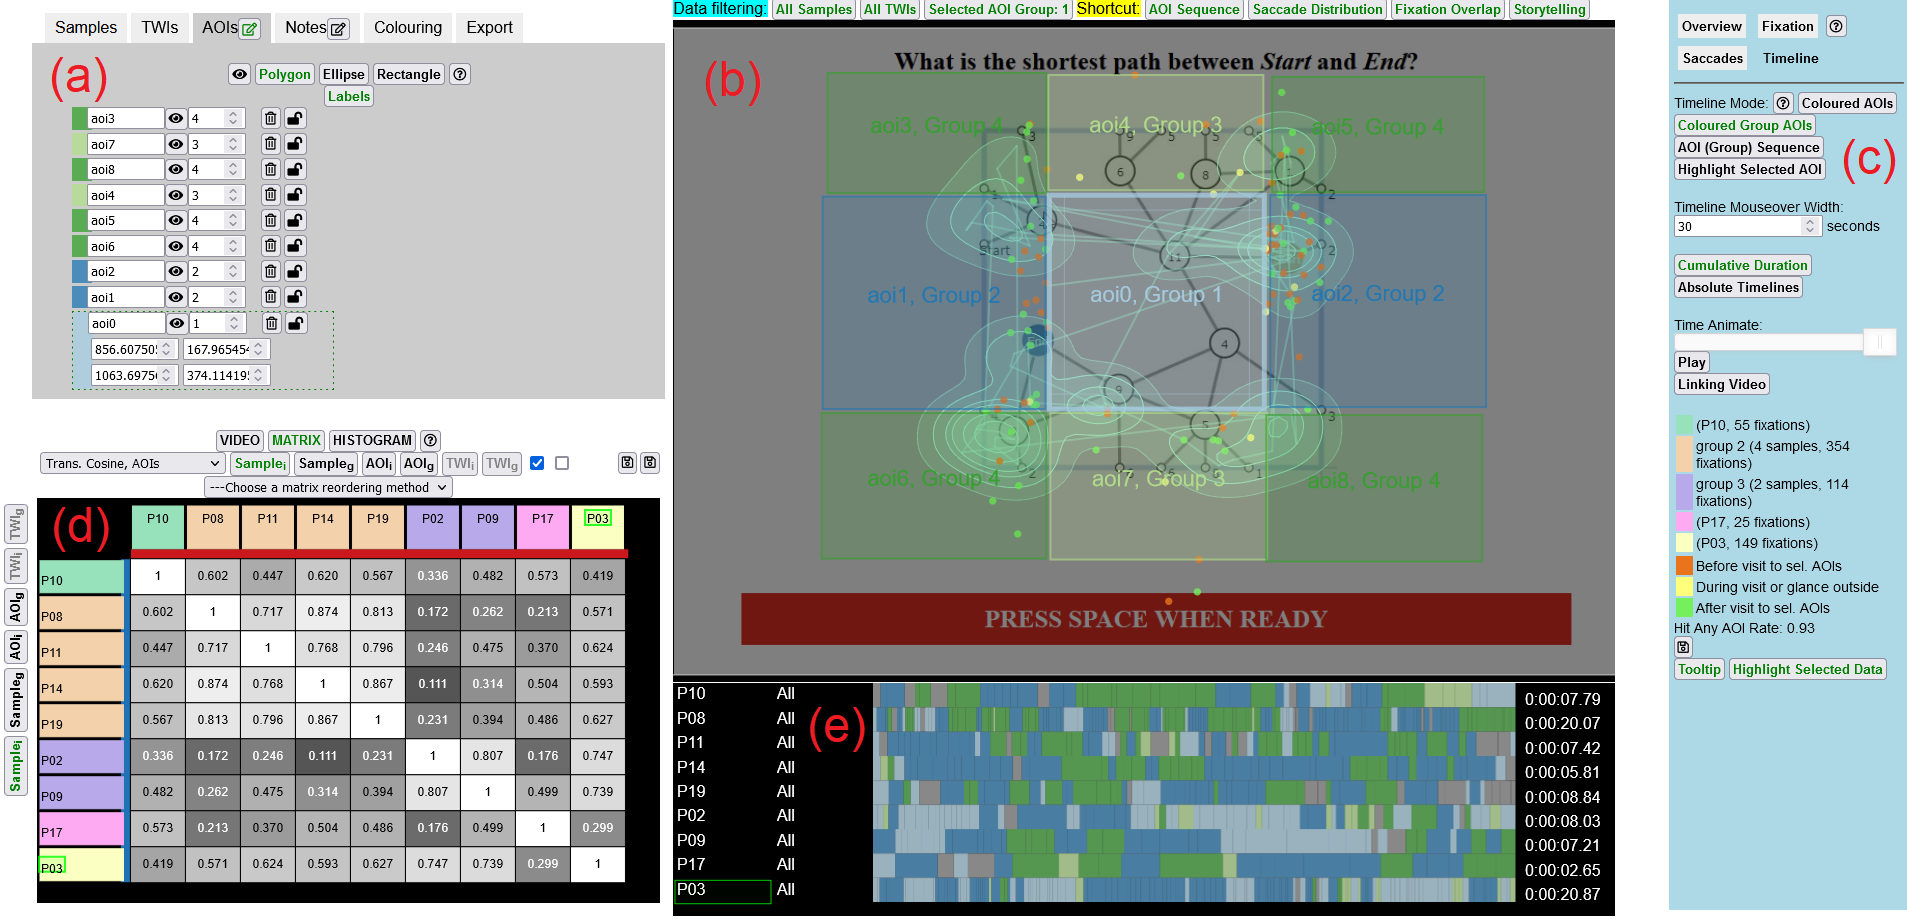
In the following, we describe key characteristics of our design. The main GUI components are illustrated in Figure 2. Data is loaded from a text file with three tab separated fields: time, gaze x- and y-coordinates, easily obtained from most eye-tracking equipment and therefore generalisable to many eye-tracking applications (Kurzhals et al., 2017). Additionally, Gazealytics adopts an optional fourth input field where a user can label the timestamp and gaze coordinate with an associated experimental condition which can be mapped to the visual gaze analysis.
3.1. Design overview
Gazealytics consists of five GUI panels. The data management panel in Figure 2(a) allows for managing input data across multiple dimensions: Who (samples), Where (AOIs), and When (TWIs), described in Kurzhals et al. (2017). Furthermore, this panel allows visual aggregation, configuration, and manipulation of grouping across these dimensions. Export of various results of the current sessions such as gaze features, AOI mapping of fixations, and visualisations are available in multiple buttons. Other tabs of the data management panel support text annotation, customising colour schemes using analysts’ existing definitions, and export configuration for visual elements such as axis labels or charts. A parameter control panel in Figure 2(c), including the control bar at the top of Figure 2(b) allows for toggling and showing current state of data filtering by individual, group level, or overall in each data dimension. This panel also includes an interactive legend for filtering out unselected sample groups. For example, Figure 2(c)–middle shows a legend of 3 sample groups (green, ogange, purple), where a mouse click on green legend resulted in visually filtering out the scanpath and density maps of organe and purple groups in the spatial view, as seen in Figure 2(b).
Three main visualisation panels provide coordinated views for flexible exploration: the metric panel in Figure 2(d), the spatial panel in Figure 2(b), and the timeline panel in Figure 2(e). The metric panel in Figure 2(d) provides flexible multivariate data exploration and comparison (Relate (Kurzhals et al., 2017)). The metric panel (d) can be switched between a matrix and a histogram view (next to the matrix tab) of fixation and saccade distributions. A video view, embedded to the metric panel (left of the matrix), as seen in Figure 2(d), allows a user to attach a video associated with each sample. When a TWI is selected, it navigates the video of a currently selected sample to the corresponding timespan of the TWI for gaining context about eye movement data. Furthermore, coordinated views showing the spatial panel (b) can be linked with a matrix or histogram view in Panel (d), which present group or individual attention distribution numerically and across the spatial view field via density maps, with fixations and saccades showing spatial context. A scanpath showing temporal eye movement sequence is shown on-demand in Figure 2(b) on mouse hovering over the scarfplot of AOI sequences in Figure 2(e).
3.2. Multi-way visual exploration with matrix-based overview
In the metric panel in Figure 2(d), a matrix shows view metrics between pairs of features grouped by either sample, TWI, or AOI. The matrix supports a common range of fixation, saccade and scanpath metrics by Poole and Ball (2006). To support both exploratory and comparative analytical tasks, the matrix shows similarity comparison (Compare (Kurzhals et al., 2017)) in terms of visual metrics within each of the data dimension: samples, AOIs, and TWIs. Examples include AOI (group) sequence scores, based on encoding each sample’s AOI visiting sequence, and string alignment according to the Needleman-Wunsch algorithm (Needleman and Wunsch, 1970). Similarity of AOI transitions between sample (group) and attention distribution (density overlap of AOIs or density maps).
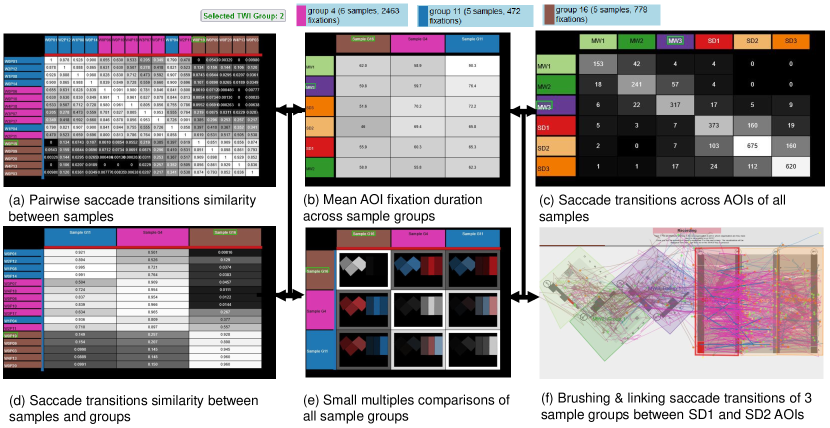
An example of a controlled experiment dataset using metric panel and spatial panel of 16 samples is shown in Figure 1. To take an overview of the entire dataset, an analyst can directly jump into any multivariate data exploration at individual (a,b,c) or group level (b,d,e,f). Temporal filter is applied where metrics are aggregated for all repeated measures within TWI Group 2. To gain spatial context, Figure 1(f) shows results of brushing and linking over matrix cell (SankeyDiagram1, SankeyDiagram2), denoted as (SD1, SD2) of AOI transition matrix in Figure 1(c), highlighting AOI transitions in Group 4 has higher frequency of “looking out” from SD1 to SD2 than Group 11, supported by fixation context (red, green, yellow dots) where the brushed saccades connect to.
To visually identify gaze patterns (Detect (Kurzhals et al., 2017)) from visual exploration , visualisation algorithms such as matrix reordering (Behrisch et al., 2016), directional and spatial saccade bundling (in the spatial view) (Hurter et al., 2011) are applied to optimise the layout and reveal high-level structures or patterns for better capturing the relationships within the data (Chen, 2022). Figure 1(a) shows an example of applying the “optimal leaf” ordering to reveal three potential visual blocks (using AOI transition similarity criteria) along the diagonal (Behrisch et al., 2016). Samples can then be grouped, while moving into various matrix relationship visualisations to cross-verify the grouping and metrics results.
3.3. Interactive visual grouping and exploration in multiple data dimensions
Gazealytics supports a comprehensive set of tools for group-level analysis. A user can aggregate metrics of fixations, visitations, density distribution, saccade transition counts, etc, from two or more samples, with spatial aggregation of these metrics in AOI groups, and temporal aggregation of them in TWI groups, identified by unique logical group IDs (GIDs). Figure 1 shows a temporal aggregation of saccade transition similarity by a selected TWI Group: 2 (defined in section 4), across samples (Figure 1(a)), or samples and sample groups (Figure 1(b)). In the spatial panel, visual grouping and data granularity also applies to a focus-and-context interaction which allows selecting an AOI and gaining an overview of surrounding spatial context of fixations by samples, spatial, and temporal filtering. Figure 1(f) shows fixations context: before/after visiting/glancing a selected (focus) AOI (SD1, denoted by bolder boundary). If a different TWI group or a different sample filtering is applied, the visuals will show different results; This also applies to brushing & linking where coordinated views highlight selected group’s fixation, saccades as one brushes over matrix cells or complementary views. Timeline panel displays AOI group sequence, or scarf plots coloured by AOI groups. A change of grouping triggers metric re-calculation using data aggregation and the resulting visualisations are re-generated.
3.4. Implementation
The software architecture is an MVC framework using HTML canvas for visuals. Metrics aggregation is achieved via identifying data elements with the same logical group ID (GID). Gazealytics has native support for having more than one instance, via spawning a new tab within a web browser for a flexible comparison across experimental conditions. It allows insights to be disseminated with peers through exporting and restoring the visualisations.
4. Exploratory and Comparative Analysis Examples
 \Description
[]
 \Description
[]
The features of Gazealytics were developed through a series of close collaborations with eye-tracking practitioners actively using the software to analyse their collected study data. We now present two examples of actual use. We refer to the task typology in Table 1 when describing the activities performed.
The first example use case is an evaluation of whether information visualisations placed side-by-side could be complementary (Chang et al., 2017). The experimental design involved 24 participants, and 12 repeated measures across 4 tasks (Figure 1). Chang et al. (2017) used the Tobii Pro software to label AOIs and extracted fixation metrics, and they built custom visualisations to inspect the results before running statistical comparisons. This is a typical approach for the analysis of eye movement data, and here it succeeded in detecting three eye movement strategies between two large predefined AOIs within the stimuli. However, it was difficult to analyse finer-grained gaze behaviours.
In contrast, with Gazealytics, one can flexibly begin analysis with any stage of the multi-way exploration (subsection 3.2) from different perspectives.
1. Confirm pre-identified hypothesis: We first created two AOIs using definitions of the left and right side-by-side diagrams, as described in the prior study (Import) (Chang et al., 2017). Trials were imported as TWIs representing start time and end time of each trial (Import). By selecting a local filtering with a TWI (selecting a specific trial), we aggregated samples to observe within-subject differences across participants in terms of the fixation percentage time on AOIs metrics (Filter, Aggregate). This allowed us to quickly confirm the exclusive and parallel use of the left and right side-by-side views for a representative graph exploration task (i.e., Out-Link task (Chang et al., 2017)).
2. Data-driven exploration: To gain further insights into the use of each left and right view, we created new finer-grained AOIs not reported previously by Chang et al. (2017), by labeling three matrix waves and three Sankey Diagrams within the AOI (Annotate), as shown in Figure 1(f). Six AOIs were created and two logical AOI group IDs were assigned to each AOI from the group editor in the data management panel (Aggregate, Change).
Next, we selected a larger granularity to gain an overview (TWI Group 2), i.e., temporal aggregate of data dimension, which aggregated metrics from all the trials belonging to the Out-Link task (Select, Navigate). Using coordinated views of metric, spatial, and timelines, it gave us additional context. In the spatial view in Figure 2(b), we first inspected the gaze points entering (green dots), leaving (red dots), or glancing out (yellow dots) of the leftmost Sankey Diagram AOI (boundary highlighted in bold when selected from the spatial view or AOI tab). Subsequently, we repeated the same exploration by switching between sample groups to allow us to gain insights into each sample group’s “gazing out rate (to the left or right) of the selected leftmost Sankey-diagram (SD1)” (Select, Navigate). As a result, we found that Group 11 has a higher number of red dots than Group 4 (as seen in Figure 1(f)).
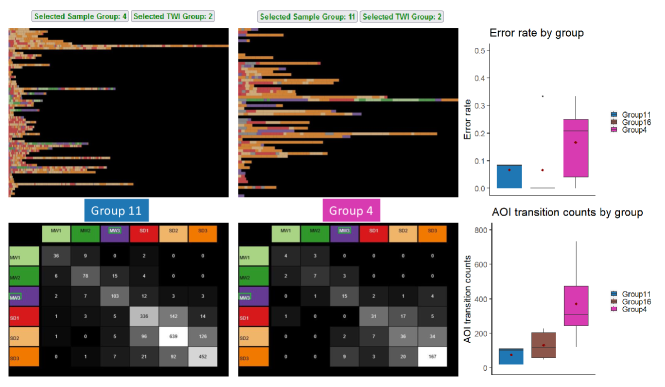
3. Comparative analysis: To compare group behaviours, we jumped into data-driven exploration of the stage denoted in Figure 1(a). By comparing pairwise AOI transitions similarity and arranging the matrix layout with optimal matrix reordering (Arrange), three different visual blocks were visually identified along the diagonal. We edited the group ID of each sample according to the block patterns found (Aggregate, Change). We visually identified that Group 11 and Group 4 had similar AOI group fixation percentage times based on new metrics derived at a group-level (Figure 1(f, g)) (Derive). For Group 11, Figure 3 showed it has less frequent AOI transitions than Group 4. We extracted AOI transitions metrics of each individual participant from Gazealytics (Produce), and executed our statistical test script of the extracted data in R . We found a potential weak trend () that there was an overall difference in AOI transitions across groups (Friedman’s non-parametric test). This provided the new insight that Group 4 participants using Sankey Diagram had a weak trend to have smaller number of AOI transitions than Group 11. During exploration, we also spotted the outlier P21, which has less than 10 fixations. It was then excluded (Filter) from the rest of the exploration.
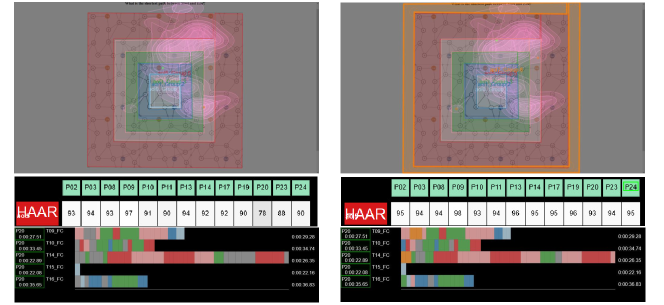
4. Coordinated views and interactive exploration: Our second use case is an example of exploratory analysis with data collected from a user study where AOIs are not pre-identified (Chen et al., 2020). Gazealytics supports dynamically annotating unlabelled gaze-data with AOIs while visually inspecting the impact of AOI definitions on visual metrics (such as AOI uncertainty metrics), to arrive at more robust AOI definitions. An example of visually improving hit-any-AOI-rate (HAAR) is shown in Figure 4, which could lead to higher quality of eye tracking data analysis (Wang et al., 2022). Visual exploration reduces the impact of AOI uncertainty by improving HAAR from 77% (left) to 88% (by manipulating the shape of green and pink polygons to be more aligned at the boundaries) (Annotate, Change). Further visual checking and manipulation result in an improved HAAR of 93% (right) for a more suitable AOI definition. Inspecting the timeline panel (at the bottom right) shows that fixations at the gray area (bottom left) were mapped to AOI4 and AOI6.
5. conclusion
We have presented Gazealytics, a new visual eye tracking analytics toolkit that supports flexible exploratory gaze analysis. It combines matrix-based overview with the ability to aggregate visual metrics at individual or group-level of sample, area-, and time-window of interest, that are dynamically linked with their spatiotemporal visualisations. Our comparative table shows that Gazealytics provides a comprehensive and interactive toolkit for exploratory gaze analysis beyond other current toolkits, in terms of a full range of visualisation task taxonomy supported. Eye tracking examples show that with the unified toolkit and multiple coordinated views, it supports multiple types of eye tracking datasets and a wide range of analytical tasks.
Furthermore, there has not been many extensive user studies on how a flexible and generic visual eye tracking analytics toolkit affects eye tracking analysts’ workflow in the real-world analysis context. With this approach, we hope to further elicit new insights through evaluating with eye tracking experts to propose a more human-centric approach to visual eye tracking analytics.
Acknowledgements.
The authors would like to thank Chunlei Chang for actively using the toolkit and provide us his feedback, Ishwari Bhade for co-developing Gazealytics, Kuno Kurzhals for the discussion of visual eye tracking toolkit comparisons, as well as the anonymous reviewers for their helpful comments on this paper. This research is funded by Monash Faculty of Information Technology and the Deutsche Forschungsgemeinschaft (DFG, German Research Foundation) – Project-ID 251654672 – TRR 161.References
- (1)
- Afzal et al. (2022) Umair Afzal, Arnaud Prouzeau, Lee Lawrence, Tim Dwyer, Saikiranrao Bichinepally, Ariel Liebman, and Sarah Goodwin. 2022. Investigating Cognitive Load in Energy Network Control Rooms: Recommendations for Future Designs. Frontiers in Psychology 13 (2022).
- Behrisch et al. (2016) Michael Behrisch, Benjamin Bach, Nathalie Henry Riche, Tobias Schreck, and Jean-Daniel Fekete. 2016. Matrix Reordering Methods for Table and Network Visualization. Computer Graphics Forum 35, 3 (2016), 693–716.
- Blascheck et al. (2016) T. Blascheck, M. John, K. Kurzhals, S. Koch, and T. Ertl. 2016. VA2: A Visual Analytics Approach for Evaluating Visual Analytics Applications. IEEE Transactions on Visualization and Computer Graphics 22, 1 (2016), 61–70.
- Blascheck et al. (2014) T. Blascheck, K. Kurzhals, M. Raschke, M. Burch, D. Weiskopf, and T. Ertl. 2014. State-of-the-Art of Visualization for Eye Tracking Data. In EuroVis – STARs, R. Borgo, R. Maciejewski, and I. Viola (Eds.). The Eurographics Association, 63–82.
- Blascheck et al. (2017) T. Blascheck, K. Kurzhals, M. Raschke, M. Burch, D. Weiskopf, and T. Ertl. 2017. Visualization of Eye Tracking Data: A Taxonomy and Survey. Computer Graphics Forum 36, 8 (2017), 260–284.
- Brehmer and Munzner (2013) Matthew Brehmer and Tamara Munzner. 2013. A Multi-Level Typology of Abstract Visualization Tasks. IEEE Transactions on Visualization and Computer Graphics 19, 12 (2013), 2376–2385.
- Burch (2022) Michael Burch. 2022. Eye Tracking and Visual Analytics. CRC Press.
- Burch et al. (2019) Michael Burch, Ayush Kumar, and Neil Timmermans. 2019. An Interactive Web-Based Visual Analytics Tool for Detecting Strategic Eye Movement Patterns. In Proceedings of the 11th ACM Symposium on Eye Tracking Research & Applications. Article 93, 5 pages.
- Burch et al. (2018) Michael Burch, Kuno Kurzhals, Niklas Kleinhans, and Daniel Weiskopf. 2018. EyeMSA: Exploring Eye Movement Data with Pairwise and Multiple Sequence Alignment. In Proceedings of the 2018 ACM Symposium on Eye Tracking Research & Applications. Article 52, 5 pages.
- Cai et al. (2022) Minghao Cai, Bin Zheng, and Carrie Demmans Epp. 2022. Towards Supporting Adaptive Training of Injection Procedures: Detecting Differences in the Visual Attention of Nursing Students and Experts. In Proceedings of the 30th ACM Conference on User Modeling, Adaptation and Personalization. 286–294.
- Chang et al. (2017) Chunlei Chang, Benjamin Bach, Tim Dwyer, and Kim Marriott. 2017. Evaluating Perceptually Complementary Views for Network Exploration Tasks. In Proceedings of the 2017 CHI Conference on Human Factors in Computing Systems. 1397–1407.
- Chang et al. (2018) Chunlei Chang, Tim Dwyer, and Kim Marriott. 2018. An Evaluation of Perceptually Complementary Views for Multivariate Data. In Proceedings of the 2018 IEEE Pacific Visualization Symposium (PacificVis). IEEE, 195–204.
- Chen (2022) Kun-Ting Chen. 2022. It’s a Wrap! Visualisations that Wrap Around Cylindrical, Toroidal, or Spherical Topologies. arXiv preprint arXiv:2209.13251 (2022).
- Chen et al. (2020) Kun-Ting Chen, Tim Dwyer, Kim Marriott, and Benjamin Bach. 2020. DoughNets: Visualising Networks Using Torus Wrapping. In Proceedings of the 2020 CHI Conference on Human Factors in Computing Systems. Article 53, 11 pages.
- Chen et al. (2023) Kun-Ting Chen, Quynh Quang Ngo, Kuno Kurzhals, Kim Marriott, Tim Dwyer, Michael Sedlmair, and Daniel Weiskopf. 2023. Reading Strategies for Graph Visualizations that Wrap Around in Torus Topology. arXiv:2303.17066 [cs.HC]
- Hurter et al. (2011) Christophe Hurter, Alexandru Telea, and Ozan Ersoy. 2011. MoleView: An Attribute and Structure-Based Semantic Lens for Large Element-Based Plots. IEEE Transactions on Visualization and Computer Graphics 17, 12 (2011), 2600–2609.
- Kumar et al. (2019) Ayush Kumar, Neil Timmermans, Michael Burch, and Klaus Mueller. 2019. Clustered Eye Movement Similarity Matrices. In Proceedings of the 11th ACM Symposium on Eye Tracking Research & Applications. Article 82, 9 pages.
- Kurzhals et al. (2017) Kuno Kurzhals, Michael Burch, Tanja Blascheck, Gennady Andrienko, Natalia Andrienko, and Daniel Weiskopf. 2017. A Task-Based View on the Visual Analysis of Eye-Tracking Data. In Eye Tracking and Visualization, Michael Burch, Lewis Chuang, Brian Fisher, Albrecht Schmidt, and Daniel Weiskopf (Eds.). Springer International Publishing, Cham, 3–22.
- Kurzhals et al. (2016a) Kuno Kurzhals, Brian Fisher, Michael Burch, and Daniel Weiskopf. 2016a. Eye tracking evaluation of visual analytics. Information Visualization 15, 4 (2016), 340–358.
- Kurzhals et al. (2016b) Kuno Kurzhals, Marcel Hlawatsch, Christof Seeger, and Daniel Weiskopf. 2016b. Visual Analytics for Mobile Eye Tracking. IEEE Transactions on Visualization and Computer Graphics 23, 1 (2016), 301–310.
- Kwok et al. (2019) Tiffany C. K. Kwok, Peter Kiefer, Victor R. Schinazi, Benjamin Adams, and Martin Raubal. 2019. Gaze-Guided Narratives: Adapting Audio Guide Content to Gaze in Virtual and Real Environments. In Proceedings of the 2019 CHI Conference on Human Factors in Computing Systems. Article 491, 12 pages.
- Menges et al. (2020) Raphael Menges, Sophia Kramer, Stefan Hill, Marius Nisslmueller, Chandan Kumar, and Steffen Staab. 2020. A Visualization Tool for Eye Tracking Data Analysis in the Web. In Proceedings of the ACM Symposium on Eye Tracking Research and Applications (ETRA ’20 Short Papers). Article 46, 5 pages.
- Needleman and Wunsch (1970) Saul B. Needleman and Christian D. Wunsch. 1970. A General Method Applicable to the Search for Similarities in the Amino Acid Sequence of Two Proteins. Journal of Molecular Biology 48, 3 (1970), 443–453.
- Panetta et al. (2020) Karen Panetta, Qianwen Wan, Srijith Rajeev, Aleksandra Kaszowska, Aaron L Gardony, Kevin Naranjo, Holly A Taylor, and Sos Agaian. 2020. ISeeColor: Method for Advanced Visual Analytics of Eye Tracking Data. IEEE Access 8 (2020), 52278–52287.
- Poole and Ball (2006) Alex Poole and Linden J. Ball. 2006. Eye Tracking in HCI and Usability Research. In Encyclopedia of Human Computer Interaction. IGI global, 211–219.
- Pozdniakov et al. (2023) Stanislav Pozdniakov, Roberto Martinez-Maldonado, Yi-Shan Tsai, Vanessa Echeverria, Namrata Srivastava, and Dragan Gasevic. 2023. How Do Teachers Use Dashboards Enhanced with Data Storytelling Elements According to their Data Visualisation Literacy Skills?. In LAK23: 13th International Learning Analytics and Knowledge Conference. 89–99.
- Servais et al. (2022) Anaïs Servais, Christophe Hurter, and Emmanuel J. Barbeau. 2022. Attentional switch to memory: an early and critical phase of the cognitive cascade allowing autobiographical memory retrieval. https://doi.org/10.31234/osf.io/z32qe PsyArXiv.
- Siirtola et al. (2009) Harri Siirtola, Tuuli Laivo, Tomi Heimonen, and Kari-Jouko Räihä. 2009. Visual Perception of Parallel Coordinate Visualizations. In Proceedings of the 2009 13th International Conference Information Visualisation. IEEE, 3–9.
- Wang et al. (2021) Yao Wang, Mihai Bâce, and Andreas Bulling. 2021. Scanpath Prediction on Information Visualisations. arXiv preprint arXiv:2112.02340 (2021).
- Wang et al. (2022) Yao Wang, Maurice Koch, Mihai Bâce, Daniel Weiskopf, and Andreas Bulling. 2022. Impact of Gaze Uncertainty on AOIs in Information Visualisations. In Proceedings of the 2022 Symposium on Eye Tracking Research and Applications. Article 60, 6 pages.