Reading Strategies for Graph Visualizations that Wrap Around in Torus Topology
Abstract.
We investigate reading strategies for node-link diagrams that wrap around the boundaries in a flattened torus topology by examining eye tracking data recorded in a previous controlled study. Prior work showed that torus drawing affords greater flexibility in clutter reduction than traditional node-link representations, but impedes link-and-path exploration tasks, while repeating tiles around boundaries aids comprehension. However, it remains unclear what strategies users apply in different wrapping settings. This is important for design implications for future work on more effective wrapped visualizations for network applications, and cyclic data that could benefit from wrapping. We perform visual-exploratory data analysis of gaze data, and conduct statistical tests derived from the patterns identified. Results show distinguishable gaze behaviors, with more visual glances and transitions between areas of interest in the non-replicated layout. Full-context has more successful visual searches than partial-context, but the gaze allocation indicates that the layout could be more space-efficient.
[]
1. Introduction
Traditional 2D network visualizations are designed to be viewed on a printed page or standard screen. Recently, (Chen et al., 2020) have shown that by laying out a network on a flattened 2D torus topology, the layout algorithm has more flexibility in relaxing node positions, thereby improving graph layout aesthetics. However, a downside of such representations is the visual cut of network links introduced at the boundaries of the display that requires mental wrapping to bridge the cuts (Chen et al., 2021b) (Figure 2(b)). To address this problem, repeated tiles of the original diagram can be drawn around the boundaries of the display, providing partial (PartialContext, see Figure 2(c)) or even full context (FullContext, see Figure 2(d)) in the layout. To further mitigate the impact of such visual cuts, interactive panning (Chen et al., 2021a, b) or a combination of panning and rotation (Chen et al., 2022) can be used to center the content of interest. Yet, interactivity in visualization requires human intervention, suffers from increased mental effort (Munzner, 2014), and is unavailable in public displays or printouts.
In this work, we focus on understanding users’ reading strategies for stationary wrapped layouts. The controlled user study by Chen et al. (2020) showed that FullContext was the best torus layout in terms of error rate, speed, and subjective preference, and as good as traditional node-link without link wrapping (NoTorus). In Chen et al. (2020)’s study, although participants’ visual focus was collected using an eye tracker, the analysis of their study primarily centered on task effectiveness not the visual search behavior, nor did they publish any gaze analysis results. Therefore, this leaves open questions related to aspects such as the mental process and different reading strategies required to perform task over a wrap-around representations. In this paper, we publish the eye tracking dataset111https://osf.io/au3bj/ and report its analysis addressing these questions.
To fill this gap, we perform an exploratory analysis of this eye tracking data and conduct statistical tests derived from the gaze patterns identified. Our results show that there are distinguishable reading strategies for each layout condition, varying by tasks. In general, when content of interest (e.g., unique shortest path) wraps around the boundary, the NoContext layout leads to a strategy with more frequent long-range glancing after immediately fixated areas, and has significantly more transitions between two or more clusters of fixation points than other layout conditions. As implication for future design, we thus suggest to automatically center content of interest to avoid visual cuts. In PartialContext, frequent visual searches over redundant areas are identified. In FullContext, the visual search concentrates on one or two complete shortest paths, leading to reduced task-completion times; however, the large screen space is quite inefficiently used according to our analysis of scanpaths.
Our findings also indicate that the three-by-three tiled display in FullContext is still necessary, but not a full level of replication at the corners has to be utilized, suggesting a more compact representation of a full-context layout. Our results complement existing task performance analyses and offer implications for future torus-based data visualizations.
2. Related Work
Graph drawings have been previously analyzed with eye tracking studies and revealed different reading strategies depending on network layout (Pohl et al., 2009; Burch et al., 2013), tasks (Huang et al., 2009), quality criteria (Huang, 2013), and coordinated views (Chang et al., 2017). We extend this line of work by analyzing gaze data characteristics for a new network layout, that is, wrapped layouts of node-link diagrams.
Eye tracking data has been reported to be useful in identifying graph reading strategies (Blascheck et al., 2017). Huang (2007, 2013) observed eye movement to extract graph reading behavior given different crossing angles, and deductively recommended designing crossing angles approximately degrees to achieve optimal task performance. However, he mainly based his eye tracking data analysis on observing eye movement videos, whereas visual analytics could help gain deeper insights (Andrienko et al., 2012; Kurzhals et al., 2017). Pohl et al. (2009) compared graph readability strategies in force-directed, orthogonal, and hierarchical graph layouts with eye tracking. They found that, for path-following tasks, orthogonal and force-directed layouts come with less link tracing effort than hierarchical layouts due to more visual attention found in line crossings in hierarchical layouts. Burch et al. (2011) utilized an analysis based on areas of interest (AOIs) to identify the differences in the readability of three tree visualization layouts. The time to cross-check between AOIs explained why the radial layout was less efficient in performing the given task. Burch et al. (2013) further analyzed the eye tracking part of this study in more detail in order to identify reading strategies by employing exploratory visual analytics; we follow a similar approach in our paper, but for a different kind of layouts. Jianu et al. (2014) performed a small-scale eye tracking study to evaluate four different augmentation visualization strategies on top of a node-link diagram for group-visualization-related tasks. Variations in task solution strategies for path following tasks are presented in metro maps reading strategies (Netzel et al., 2017; Kumar et al., 2019).
While all of the aforementioned work focused on visual guidance aspects for traditional node-link diagrams with no wrapping, we focus on studying wrapped layouts.
3. Eye Tracking Study
In the following, we briefly review the main aspects of the previous experiment conducted by Chen et al. (2020). Our work focuses on analyzing eye tracking data that was collected in this study, while the earlier publication focused on task performance. The following description thus focuses primarily on the eye-tracking part, as well as general aspects relevant to our analysis. For more details, we point the reader to Chen et al. (2020).
3.1. Design and Procedure
The study used a repeated-measure design, in which each participant performed a set of tasks on the four different graph layout conditions shown in Figure 1. Eye movement data of 19 participants was collected. Gaze sequence data was dropped if it was below a threshold of 70% gaze samples detected with at least one eye. This resulted in valid data from 13 participants. A Tobii Pro X3-120 eye tracking system was used to record eye movement data at a sampling rate of 120 Hz. Participants sat in front of a Dell 22-inch LCD monitor at a distance given by the calibration feature of the eye tracking system.
Before conducting the experiment, subjects were asked to fill out a questionnaire about personal details and an online tutorial was provided to explain the torus-based network diagrams used in the study. There were four training trials for each layout condition right before the recorded trial. Each trial began with question text located at the top. Once a participant hit the start button, an image stimulus was loaded below the question and a timer started. The image was shown for a maximum duration of 30 seconds. A progress bar appeared below the stimulus 10 seconds before the timeout. Once the button was hit, the image disappeared and the question showed up again, with multiple-choice options for answering the question.
3.2. Datasets and Tasks
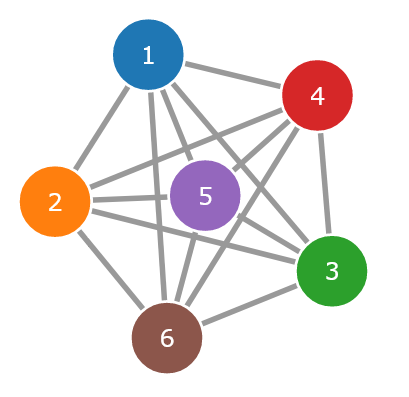
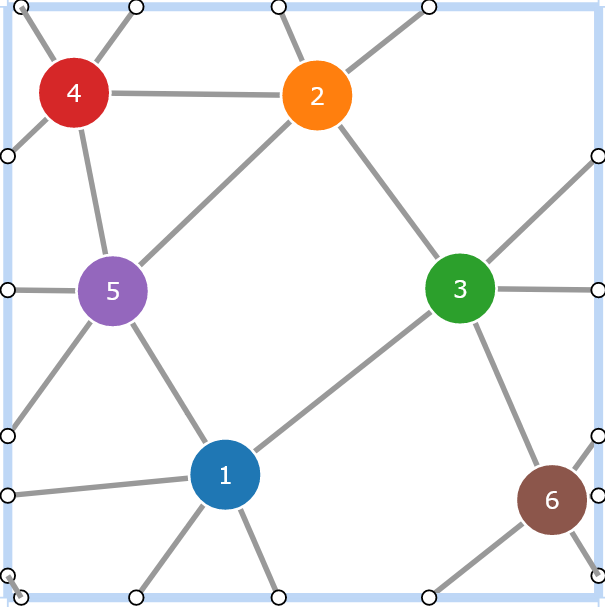
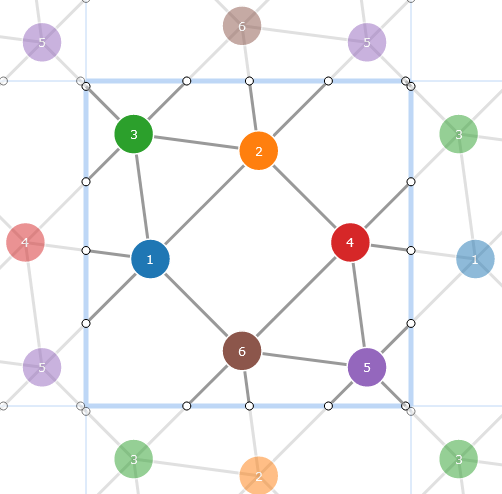
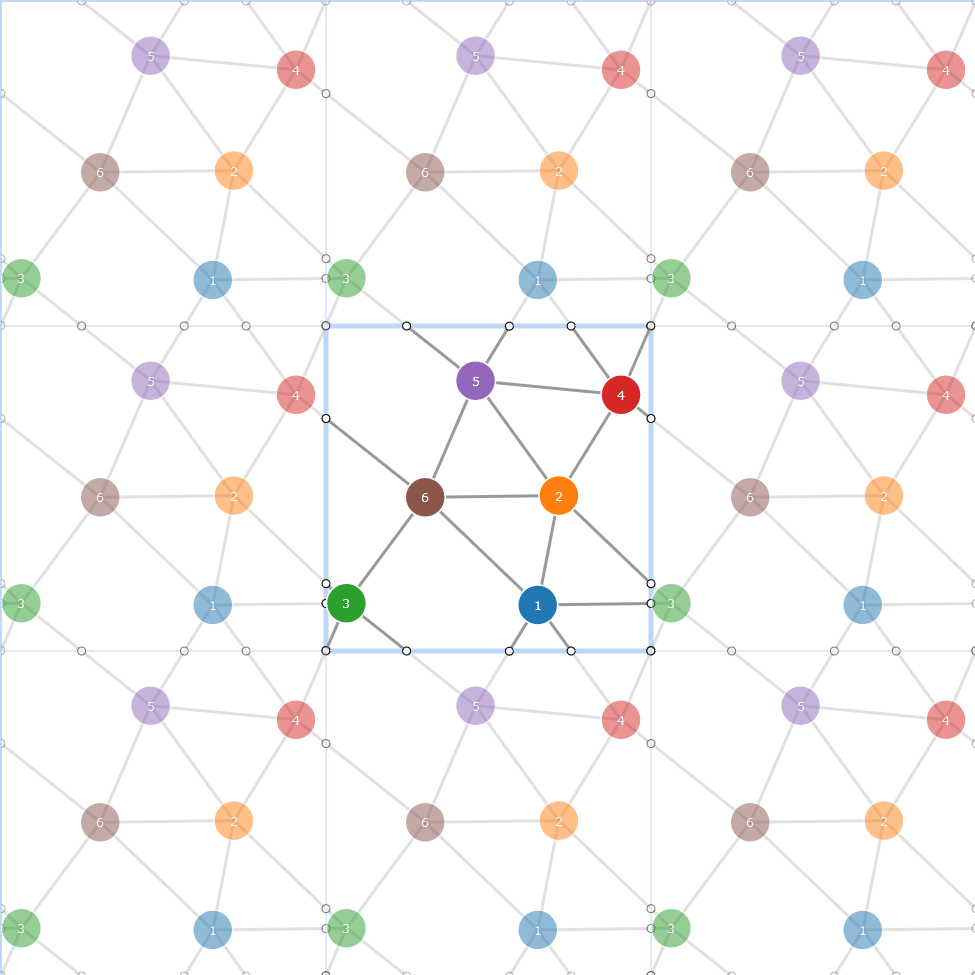
In the actual study, stimuli were given in the form of NoTorus (i.e., a standard force-directed node-link representation of a network), NoContext (i.e., a torus drawing without any contextual tiling around the boundary), PartialContext (i.e., a torus drawing with partial contextual tiling around the boundary to aid comprehension of the link wrapping), and FullContext layouts (i.e., a torus drawing with full three-by-three contextual tiling around the boundary to aid comprehension of the link wrapping). An example graph is shown in Figure 3. The fully replicated network layouts have 8 repeated cells (top, right, bottom, left, and four corners). Partially replicated layouts show one third of the fully replicated layouts around the boundaries of the center cell.
The tasks were (1) to locate the shortest path of a set of orange and blue nodes (ShortestPath) with text labels indicating start and end node; (2) to identify all neighbors of an orange node (Neighbors); and (3) to count the total number of nodes (NodeCount) and links (LinkCount). The latter task was chosen because the link wrapping had to be understood and a strategy had to be applied to answer correctly. The applied strategies are of special interest in this paper.
Note that the diagrams are scaled to the same size in the figures in this paper for a clear illustration of visual scanpaths and density maps, but in the eye tracking experiments, stimuli were shown to participants so that the central cell was the same size as the non-replicated drawing; i.e., the area of fully replicated layout drawings (975 975) shown to study participants were nine times that of non-replicated drawings (325 325).
3.3. Previous Results
Overall the task performance results suggested that fully replicated and traditional layouts outperform NoContext and PartialContext for link-and-path-following tasks in accuracy, completion time, and the subjective user rank. Their qualitative user feedback reported that while major of participants favored FullContext for taking an entire overview of the network, others mentioned the extra replication looked redundant and preferred the clean representation of the NoContext layout. Towards a better understanding of user reading strategy of each layout, we perform an eye tracking data analysis.
4. Analysis of reading strategies

[]
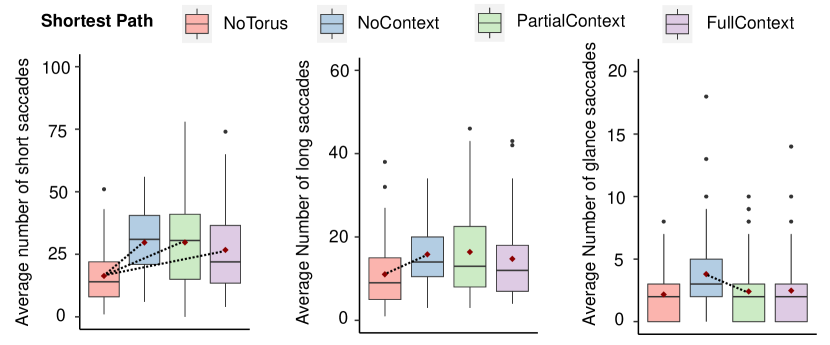
[]Box plot of number of short saccades, long saccades, and glance saccades across participants for each layout condition. The short saccade cutoff length is 100 pixels, which is less than one third of the width of the central tile.
Our overarching goal is to understand visual scanning strategies that participants apply to perform graph exploration tasks with layouts that wrap around in different levels of repeated tiled display.
As the focus of the tasks was on link-and-path following, we define a reading strategy as a sequence of frequently occurring spatial fixation points in an image stimulus out of correctly performed samples. A similar data model has also been used by Burch et al. (2013). The fixation identification parameters are based on a dispersion-based algorithm (I-DT) (Salvucci and Goldberg, 2000). We choose dispersion as 130 pixels by the sum of a bounding box for a cluster of gaze points, and minimum time window as 80 milliseconds. This results in about 1–2 fixations over a node in the network diagram we presented to participants.
We first perform exploratory data analysis to understand graph reading strategies. We visually inspect overall fixation distributions of each stimuli, across all participants, to gain an overview of the gaze data. We then inspect the scanpaths of each individual participant, analyzing scanpath similarity, and summarize visual investigation patterns found for each layout and task. Secondly, informed by the patterns identified, we perform comparative analysis with statistical inference to investigate the difference in gaze metrics regarding layout conditions. We use a visual gaze tracking analysis toolkit, called Gazealytics (Chen et al., 2023) 222https://github.com/gazealytics/gazealytics-master, to perform both of such exploratory and comparative analysis.
The analysis and report is based on a representative stimuli. Similar method has been used to report an existing eye tracking study by Burch et al. (2013).
In the following, we present results of the ShortestPath task. The results of LinkCount tasks are available in the supplementary material.
 \Description
[]
 \Description
[]
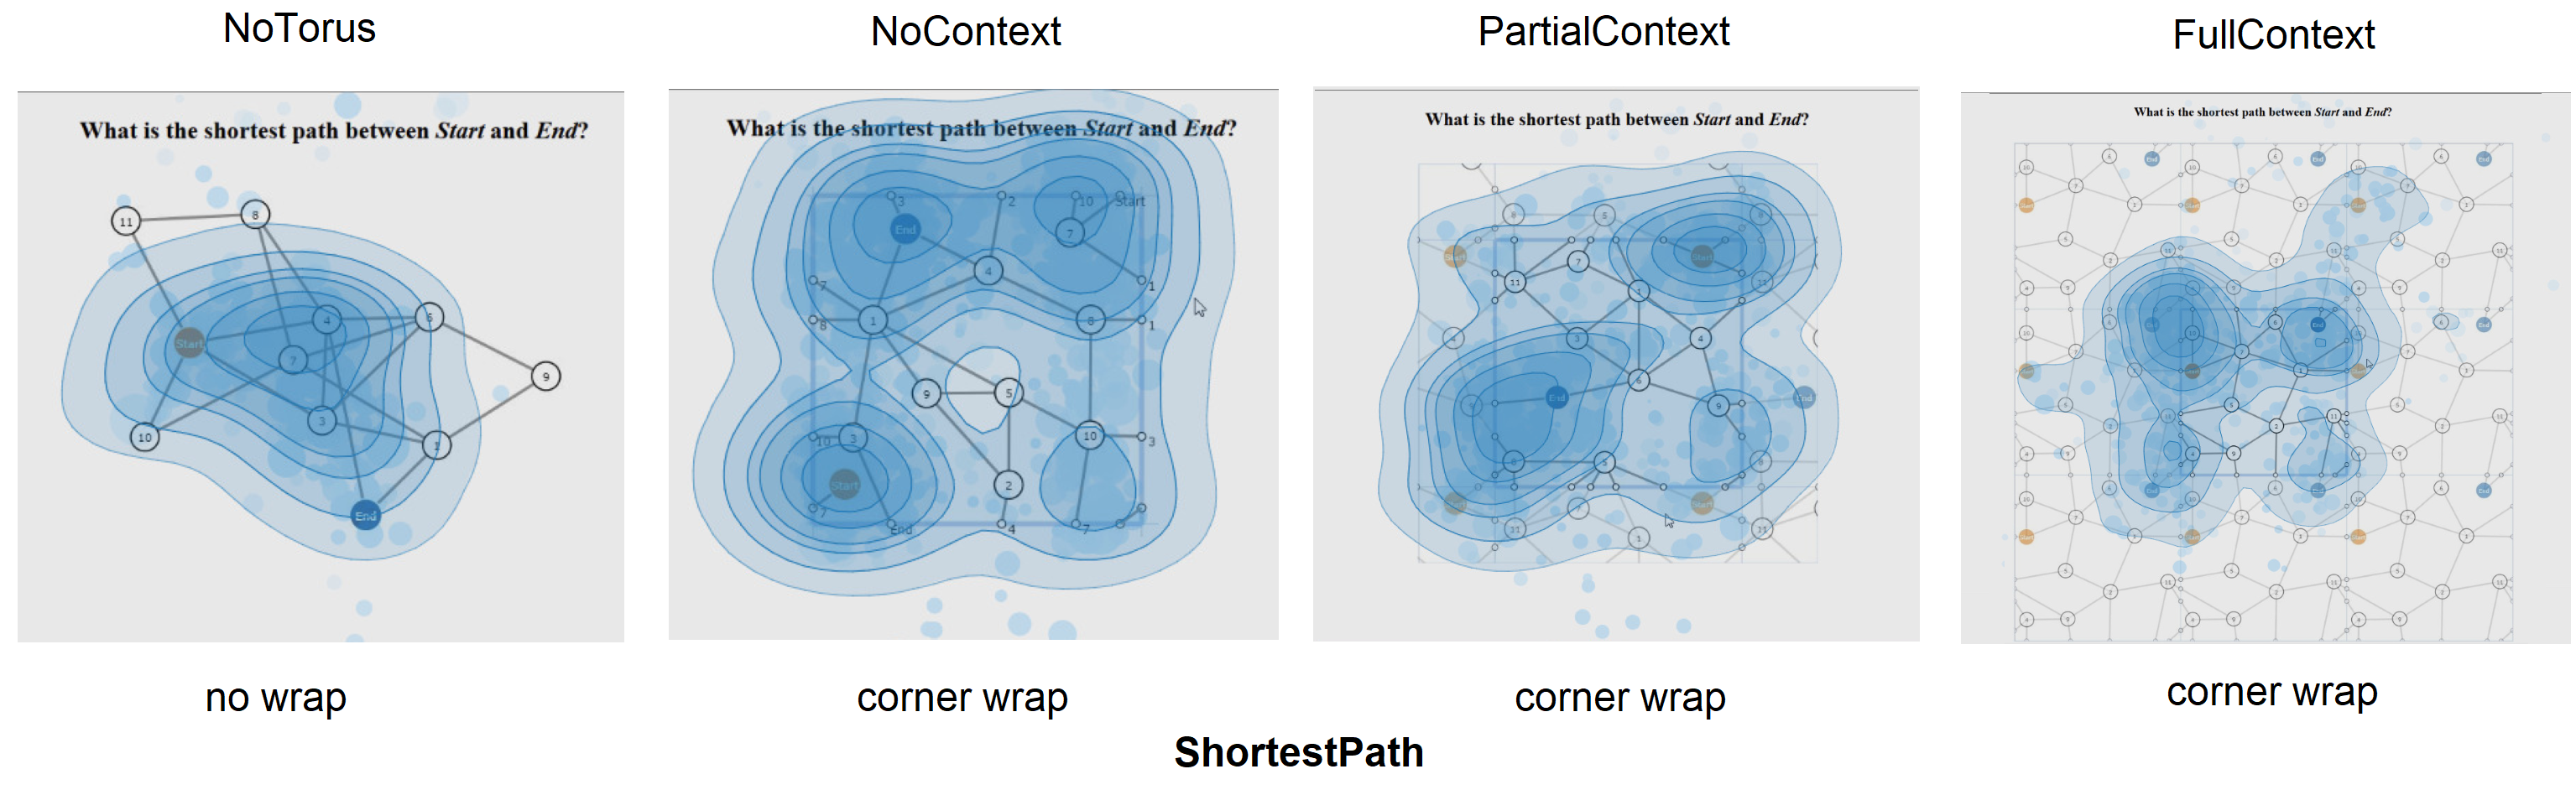
4.1. Aggregated Fixation Distribution
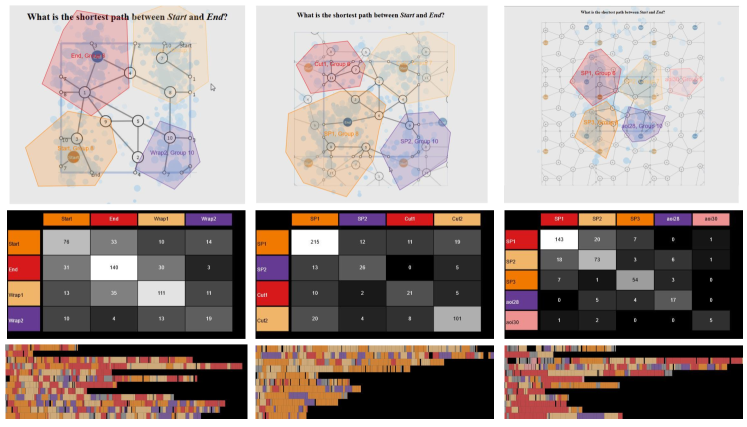
Figure 1 shows the visualizations of aggregated fixation distribution for the ShortestPath task for a representative stimulus, where the unique shortest path follows a top-bottom, left-right wrapping, or combination of them (i.e., corner wrapping). For NoTorus, most fixations are concentrated on the center, forming one visual cluster of fixations over the shortest path between the start and the end node, as seen in Figure 1(a). Sole cluster of fixations is also found in all the other NoTorus trials, independent of tasks (see the supplementary material).
By contrast, NoContext, PartialContext, and FullContext show similarly clearer separation between clusters of fixations. However, the relationship between these clusters vary across layout conditions. For NoContext, participants spent longer duration fixating at each of the start and the end node, along with their links to the boundaries where it discontinues. In addition, disjoint clusters of fixations at upper-right and bottom-right cover intermediate nodes of the shortest path, as seen in Figure 1(b), suggesting a relationship among them to connect the visual cuts wrapped across the boundaries. This is different from PartialContext and FullContext. Two clusters of fixations cover the replication of unique shortest path were found for PartialContext at the bottom-left and the bottom-right (Figure 1(c)), and the same for FullContext with three to four clusters (Figure 1(d)). However, an additional dense fixations at upper-right in PartialContext seems redundant since it is not possible to find the shortest path in adjacent tiles.
For FullContext, dense fixations were found surrounding the center and surrounding tiles, including a portion of corner tiles, but with decreasing fixations going outward dense maps, suggesting inefficient gaze allocation since participants are more in favor of center and adjacent tiles over the entire layout.
4.2. Reading Strategies Based on Scanpath Analysis
Figure 3 shows results of the analysis of scanpaths of the same stimulus as subsection 4.1, ordered from left to right by their increasing task completion time. For NoContext, there is an increasing frequency of cross-checking the shortest path with low (Figure 3(b)) to high frequency (Figure 3(d)). Furthermore, scanpaths were found switching between four corners with constant visual scan back to immediately starting regions, forming a frequent glance pattern between regions. We quantify the frequency of such visual search patterns and compare across each layout condition in subsection 4.3. For PartialContext, Figure 3(g)–(i) show the scanpaths cover a full shortest path, however, there are also visual scan with a start or end node that does not lead to any shortest path due to the clipping of the repeated tiles, such as the orange start node near the upper-right corner, confirming the observation of redundant cluster of fixations in subsection 4.1. For FullContext, Figure 3(l)–(n) show one to two effective searches out of all tiles.
Our findings confirm existing path-following reading strategies in the study by Netzel et al. (2017), there are participants showing scan once, multiple rounds, inspecting other possible paths between origin and destination.
4.3. Comparative Statistical Analysis Based on Gaze Metrics
Inspired by aggregated fixation distribution (subsection 4.1) and scanpath strategies results (subsection 4.2), we quantify the patterns with metrics and conduct statistical analysis based on metrics.
To quantify the glance patterns, we classify saccades into three categories: short (less than 100 pixels), long, and glance saccades. A glance saccade is defined as saccades from a fixation at time index to one at time and fall back to one at time so that the Euclidean distance between fixations at and is less than one third of the distance between fixations at time and , i.e., a glance saccade occurs when gaze moves back and forth. A similar approach has also been used (Goodwin et al., 2022).
We use the Friedman test to evaluate significant differences between layout conditions where the dependent variables (shown below) did not meet the normality assumption. We use the Nemenyi post-hoc test for pairwise comparisons. Confidence intervals indicate 95% confidence for mean values.
Results of saccade frequencies of ShortestPath for medium and large stimuli across layouts are shown in Figure 4. Overall, there is an effect of the number of short (), long (), and glance saccades () on layout conditions. Post-hoc analysis shows that NoTorus has significantly less short saccades than NoContext (), PartialContext (), and FullContext (). NoTorus has significantly less long saccades than NoContext (), and a weak trend to have less long saccades than PartialContext (). NoContext layout has significantly more glance saccades than PartialContext (), and a weak trend to have more glance saccades than FullContext ().
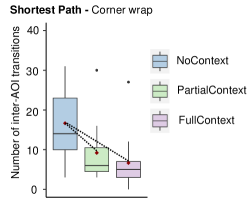
Furthermore, similar to Burch et al. (2011), we define AOIs to investigate the relationships between clusters of fixations between the visual clusters of fixations identified in density maps for each layout, as seen in Figure 5. The comparison of the number of inter-AOI transitions indicates that overall there is an effect of inter-AOI transitions on layout conditions (). Posthoc analysis shows that NoContext has significantly more inter-AOI transitions than PartialContext () and FullContext (), as seen in Figure 6. A number of participants were found sharing similar investigatory patterns. They are grouped in the scarfplot based on their pairwise visual similarity AOI transitions (Kurzhals et al., 2014) (Figure 6(bottom)).
Both results indicate that (1) the low-performance of NoContext could be a result of increasing mental effort to perform more frequent saccades and inter-AOI transitions when the content of interest wraps around. In particular, long-range glance saccades are used more often than the other layouts to connect visual cuts of links and paths across the boundaries. (2) While there are similar number of clusters of fixations for each torus-based layout, there is different strategic use of these clusters. There are more inter-cluster transitions in NoContext than in PartialContext and FullContext, while the latter has more self-transitions.
5. Discussion and Conclusion
We studied different reading strategies in wrapped node-link layout representations using eye tracking. Our results indicate that there are distinguishable reading strategies by aggregated fixation distributions, scanpaths, and comparative gaze metrics. In addition, we provide further evidence that the low-performance of PartialContext from the prior study is caused by ineffective visual searches where the path continuation could not be followed without starting a new search in repeated tiles. Furthermore, low-performance of NoContext is caused by more frequent glance saccades, as well as more transitions between two or more clusters of fixation points. This complements existing findings for task performance by Chen et al. (2020).
Our results provide implications not only for future torus-based study design for node-link diagrams, but also for the utilization of different levels of torus-based layouts. These implications might provide a starting point for future studies of other types of wrappable visualizations (Chen, 2022), such as cyclic time series where inspecting trends across the visual cuts has been identified as a major problem in (Chen et al., 2021b). A new layout could be derived from a balance of PartialContext and FullContext, where a more space-efficient wrapped visualization is suggested to clip the outer-most repetition rather than at the four corner tiles, to cover effective visual search (informed by the gaze allocation results in this paper as well as the supplementary material).
Similar to existing eye tracking studies on node-link visualizations (Huang et al., 2009; Burch et al., 2013), our analysis approach has similar limitations. We based our visual search behavior analysis on the same type of stimuli aggregated across all the participants. Accordingly, we focused on reporting results from representative stimuli of each layout condition, where their wrapping conditions of the shortest path is on the same basis of a corner wrapping. While we infer a general reading strategies from this particular corner wrapped condition, it is a combination of top–bottom and left–right wrap. Future work can extend it to considering a full range of wrapping conditions. We include aggregated density map visualizations of other wrapping conditions in the supplementary material, including top–bottom wrap, left–right wrap, and no–wrap.
Another limitation of this work is the small sample size (13 participants). Future studies could be conducted with more subjects to fill this gap. Another direction for future research is to investigate whether the visual clutter reduction affordable in a torus-based network layout and the design recommendations informed by gaze allocations might lead to more usable and effective graph layouts compared with traditional non-wrapped representations.
Acknowledgements.
The authors like to thank Hong Gui for the paper writing suggestions, as well as all the anonymous reviewers for their helpful comments on this paper. This research is funded by the Deutsche Forschungsgemeinschaft (DFG, German Research Foundation) – Project-ID 251654672 – TRR 161 and under Germany’s Excellence Strategy – EXC 2120/1 – 390831618.References
- (1)
- Andrienko et al. (2012) Gennady L. Andrienko, Natalia V. Andrienko, Michael Burch, and Daniel Weiskopf. 2012. Visual Analytics Methodology for Eye Movement Studies. IEEE Transactions on Visualization and Computer Graphics 18, 12 (2012), 2889–2898. https://doi.org/10.1109/TVCG.2012.276
- Blascheck et al. (2017) Tanja Blascheck, Markus Schweizer, Fabian Beck, and Thomas Ertl. 2017. Visual Comparison of Eye Movement Patterns. Computer Graphics Forum 36, 3 (2017), 87–97. https://doi.org/10.1111/cgf.13170
- Burch et al. (2013) Michael Burch, Gennady Andrienko, Natalia Andrienko, Markus Höferlin, Michael Raschke, and Daniel Weiskopf. 2013. Visual Task Solution Strategies in Tree Diagrams. In 2013 IEEE Pacific Visualization Symposium (PacificVis). 169–176. https://doi.org/10.1109/PacificVis.2013.6596142
- Burch et al. (2011) Michael Burch, Natalia Konevtsova, Julian Heinrich, Markus Höferlin, and Daniel Weiskopf. 2011. Evaluation of Traditional, Orthogonal, and Radial Tree Diagrams by an Eye Tracking Study. IEEE Transactions on Visualization and Computer Graphics 17, 12 (2011), 2440–2448. https://doi.org/10.1109/TVCG.2011.193
- Chang et al. (2017) Chunlei Chang, Benjamin Bach, Tim Dwyer, and Kim Marriott. 2017. Evaluating Perceptually Complementary Views for Network Exploration Tasks. In Proceedings of the 2017 CHI Conference on Human Factors in Computing Systems. 1397–1407. https://doi.org/10.1145/3025453.3026024
- Chen (2022) Kun-Ting Chen. 2022. It’s a Wrap! Visualisations that Wrap Around Cylindrical, Toroidal, or Spherical Topologies. arXiv preprint arXiv:2209.13251 (2022).
- Chen et al. (2021a) Kun-Ting Chen, Tim Dwyer, Benjamin Bach, and Kim Marriott. 2021a. It’s a Wrap: Toroidal Wrapping of Network Visualisations Supports Cluster Understanding Tasks. In Proceedings of the 2021 CHI Conference on Human Factors in Computing Systems. Article 465, 12 pages. https://doi.org/10.1145/3411764.3445439
- Chen et al. (2021b) Kun-Ting Chen, Tim Dwyer, Benjamin Bach, and Kim Marriott. 2021b. Rotate or Wrap? Interactive Visualisations of Cyclical Data on Cylindrical or Toroidal Topologies. IEEE Transactions on Visualization and Computer Graphics 28, 1 (2021), 727–736. https://doi.org/10.1109/TVCG.2021.3114693
- Chen et al. (2020) Kun-Ting Chen, Tim Dwyer, Kim Marriott, and Benjamin Bach. 2020. DoughNets: Visualising Networks Using Torus Wrapping. In Proceedings of the 2020 CHI Conference on Human Factors in Computing Systems. Article 53, 11 pages. https://doi.org/10.1145/3313831.3376180
- Chen et al. (2022) Kun-Ting Chen, Tim Dwyer, Yalong Yang, Benjamin Bach, and Kim Marriott. 2022. GAN’SDA Wrap: Geographic And Network Structured DAta on surfaces that Wrap around. In Proceedings of the 2022 CHI Conference on Human Factors in Computing Systems. Article 135, 16 pages. https://doi.org/10.1145/3491102.3501928
- Chen et al. (2023) Kun-Ting Chen, Arnaud Prouzeau, Joshua Langmead, Ryan T Whitelock-Jones, Lee Lawrence, Tim Dwyer, Christophe Hurter, Daniel Weiskopf, and Sarah Goodwin. 2023. Gazealytics: A Unified and Flexible Visual Toolkit for Exploratory and Comparative Gaze Analysis. arXiv:2303.17202 [cs.HC]
- Goodwin et al. (2022) Sarah Goodwin, Arnaud Prouzeau, Ryan Whitelock-Jones, Christophe Hurter, Lee Lawrence, Umair Afzal, and Tim Dwyer. 2022. VETA: Visual eye-tracking analytics for the exploration of gaze patterns and behaviours. Visual Informatics 6, 2 (2022), 1–13.
- Huang (2007) Weidong Huang. 2007. Using Eye Tracking to Investigate Graph Layout Effects. In Proceedings of the Asia-Pacific Symposium on Visualisation 2007. 97–100. https://doi.org/10.1109/APVIS.2007.329282
- Huang (2013) Weidong Huang. 2013. Establishing aesthetics based on human graph reading behavior: two eye tracking studies. Personal and Ubiquitous Computing 17, 1 (2013), 93–105. https://doi.org/10.1007/s00779-011-0473-2
- Huang et al. (2009) Weidong Huang, Peter Eades, and Seok-Hee Hong. 2009. A Graph Reading Behavior: Geodesic-Path Tendency. In Proceedings of the IEEE Pacific Visualization Symposium. 137–144. https://doi.org/10.1109/PACIFICVIS.2009.4906848
- Jianu et al. (2014) Radu Jianu, Adrian Rusu, Yifan Hu, and Douglas Taggart. 2014. How to Display Group Information on Node-Link Diagrams: An Evaluation. IEEE Transactions on Visualization and Computer Graphics 20, 11 (2014), 1530–1541. https://doi.org/10.1109/TVCG.2014.2315995
- Kumar et al. (2019) Ayush Kumar, Neil Timmermans, Michael Burch, and Klaus Mueller. 2019. Clustered Eye Movement Similarity Matrices. In Proceedings of the 11th ACM Symposium on Eye Tracking Research & Applications. Article 82, 9 pages. https://doi.org/10.1145/3317958.3319811
- Kurzhals et al. (2017) Kuno Kurzhals, Michael Burch, Tanja Blascheck, Gennady Andrienko, Natalia Andrienko, and Daniel Weiskopf. 2017. A Task-Based View on the Visual Analysis of Eye-Tracking Data. In Eye Tracking and Visualization, Michael Burch, Lewis Chuang, Brian Fisher, Albrecht Schmidt, and Daniel Weiskopf (Eds.). Springer International Publishing, Cham, 3–22.
- Kurzhals et al. (2014) Kuno Kurzhals, Florian Heimerl, and Daniel Weiskopf. 2014. ISeeCube: Visual analysis of gaze data for video. In Proceedings of the Symposium on Eye Tracking Research and Applications. 43–50.
- Munzner (2014) Tamara Munzner. 2014. Visualization Analysis and Design. CRC Press, Boca Raton, FL.
- Netzel et al. (2017) Rudolf Netzel, Bettina Ohlhausen, Kuno Kurzhals, Robin Woods, Michael Burch, and Daniel Weiskopf. 2017. User erformance and reading strategies for metro maps: An eye tracking study. Spatial Cognition & Computation 17, 1-2 (2017), 39–64. https://doi.org/10.1080/13875868.2016.1226839
- Pohl et al. (2009) Mathias Pohl, Markus Schmitt, and Stephan Diehl. 2009. Comparing the Readability of Graph Layouts using Eyetracking and Task-oriented Analysis. In Proceedings of Computational Aesthetics in Graphics, Visualization, and Imaging. 49–56. https://doi.org/10.2312/COMPAESTH/COMPAESTH09/049-056
- Salvucci and Goldberg (2000) Dario D. Salvucci and Joseph H. Goldberg. 2000. Identifying Fixations and Saccades in Eye-Tracking Protocols. In Proceedings of the 2000 Symposium on Eye Tracking Research & Applications. 71–78. https://doi.org/10.1145/355017.355028