galaxies: active — galaxies: elliptical and lenticular, cD — galaxies: ISM — galaxies: jets — galaxies: nuclei
The correlation between the 500 pc scale molecular gas masses and AGN powers for massive elliptical galaxies
Abstract
Massive molecular clouds have been discovered in massive elliptical galaxies at the center of galaxy clusters. Some of this cold gas is expected to flow in the central supermassive black holes and activate galactic nucleus (AGN) feedback. In this study, we analyze archival ALMA data of 9 massive elliptical galaxies, focusing on CO line emissions, to explore the circumnuclear gas. We show that the mass of the molecular gas within a fixed radius (500 pc) from the AGNs (–) is correlated with the jet power estimated from X-ray cavities (–). The mass accretion rate of the circumnuclear gas also has a correlation with . On the other hand, the continuum luminosities at GHz and –300 GHz have no correlation with . These results indicate that the circumnuclear gas is sustaining the long-term AGN activities ( yr) rather than the current ones. The circumnuclear gas mass is a better indicator of the jet power than the continuum luminosity, which probably changes on a shorter time scale. We also study the origin of the continuum emission from the AGNs at –300 GHz and find that it is mostly synchrotron radiation. For low-luminosity AGNs, however, dust emission appears to contaminate the continuum.
1 Introduction
Massive elliptical galaxies are often located at the center of galaxy clusters. They host supermassive black holes, which are observed as active galactic nuclei (AGNs). While the cooling time of the hot gas in the galaxies is much smaller ( yr) than the age of the Universe (Fabian, 1994), the AGNs are expected to serve as heating sources and prevent the development of massive cooling flows (AGN feedback; Churazov et al. (2000); McNamara & Nulsen (2007); Fabian (2012)). Since the galaxies are immersed in the hot gas, it may be natural to assume that the hot gas feeds into the black holes in the form of the Bondi accretion (Bondi, 1952) and stimulates the AGNs. In fact, Allen et al. (2006) found a tight correlation between the Bondi accretion rates and the power emerging from the AGNs in relativistic jets. However, later studies have revealed that the correlation is weak (Russell et al., 2013).
In addition to the hot gas, cold molecular gas has been discovered in the massive elliptical galaxies (e.g. Edge (2001); Salomé & Combes (2003); David et al. (2014); McNamara et al. (2014)). It has been indicated that nebular emission, enhanced star formation, and AGN activities are recognized when the entropy of the hot gas decreases to , or almost equivalently when the radiative cooling time is Gyr (e.g. Cavagnolo et al. (2008); Rafferty et al. (2008); Sanderson et al. (2009); Main et al. (2017)). This suggests that radiative cooling turns the hot gas into cold gas, and the cold gas drives star formation and AGN activity. Recently, Fujita et al. (2022) discussed gas circulation in the massive elliptical galaxies using a semi-analytical model. They indicated that while some of the cold gas is consumed in star formation, the rest flows into the galactic center. Moreover, if a circumnuclear disk is formed around the central black hole, disk instabilities regulate the gas accretion toward the black hole; the overall AGN activity depends on the mass of the disk. We note that the typical size of the circumnuclear disk is –500 pc for the massive elliptical galaxies at the cluster centers (Nagai et al., 2019; Fujita et al., 2022).
In this paper, we analyze Atacama Large Millimeter Array (ALMA) archival data of massive elliptical galaxies in galaxy clusters and seek correlations among the properties of circumnuclear molecular gas and the AGN activity, which may support the idea that the gas fuels the AGNs. We note that Russell et al. (2019) have compared the mass of the circumnuclear molecular gas with the AGN jet power and found a correlation (their Figure 7). However, they measured the mass in a single ALMA synthesized beam centered on the AGNs. Since the physical size of a given beam is larger for more distant objects, the mass inside it tends to be larger, while distant AGNs are observationally biased toward brighter and powerful ones. This could create an artificial correlation. To lessen such biases, we focus on the mass within a fixed physical radius. We also study the mass accretion rates and the radio continuum luminosities of the AGNs to further investigate the fueling process. We assume , , and in this study. All errors are unless otherwise noted.
2 Data Reduction
We analyzed archival ALMA observations of CO line emissions from the cold gas in massive elliptical galaxies at the center of galaxy clusters, and we investigated relations between the cold gas and the AGN activity. Targets were selected from those studied in Olivares et al. (2019) and Russell et al. (2019). From the sample, we chose the ones for which AGN jet powers () have been estimated through observations of X-ray cavities. Moreover, we chose those for which the inner 500 pc (1 kpc in diameter) is resolved with ALMA. The selected sample includes M87 and RXJ 08210752. However, the molecular gas detected in M87 is located in the outer region of the galaxy and has no connection to the AGN (Simionescu et al., 2018), and the data of RXJ 0821+0752 are poorly calibrated because of an issue of water vapor radiometer (Vantyghem et al., 2017). Thus, we did not include them in our sample. The list of the 9 remaining galaxies are shown in table 2. We call the central galaxies by the names of their host clusters. The galaxy redshifts are those determined by optical observations.
The galaxies were observed with ALMA at frequencies corresponding to the CO(J=1-0), CO(J=2-1), or CO(J=3-2) rotational transition lines as well as at additional spectral windows that were used to image the mm/submm (–300 GHz) continuum emission. The observations were single pointing ones centered on the AGNs, and they were calibrated using the appropriate version of Common Astronomy Software Application (CASA) software (McMullin et al., 2007) and ALMA Pipeline used for the quality assurance. Data sets taken in the early ALMA Cycles were calibrated by the EA ALMA Regional Center (EA-ARC) through the request via the ALMA Helpdesk because of unavailability of the recommended CASA version.
The line and underlying continuum emissions were reconstructed using the CASA tclean task down to level. To study the line emissions, we subtracted the continuum using line-free channels with the CASA task uvcontsub (fitorder=1). Following previous studies (Olivares et al., 2019; Russell et al., 2019), we adopted Briggs weighting with a robust parameter of 2 (natural weighting). Each receiver was tuned to cover one of the abovementioned lines. The targets were observed with four spectral windows except for 2A0335+096 and PKS 0745-191 (two windows). Each spectral window has a bandwidth of 1.875 or 2.0 GHz. The synthesized beam size, and rms in each final data-cube are shown in table 2.
Target and observation details.
Target
∗*∗*footnotemark:
CO line
ALMA ID project
Obs. time
Date
Beam
PA
binning
rms††{\dagger}††{\dagger}footnotemark:
(min)
(′′)
(deg)
()
()
NGC 5044
0.00928a
J=2-1
2011.0.00735.S
28
2012-01-13
2.1 1.2
-33
20
1.4
Centaurus
0.0099b
J=1-0
2015.1.01198.S
78
2016-01-27
2.3 1.8
76
30
0.3
Abell 262
0.01619c
J=2-1
2015.1.00598.S
11
2016-06-27
0.95 0.62
12
20
0.6
Abell 3581
0.0218c
J=2-1
2015.1.00644.S
87
2016-05-03
0.69 0.59
-77
20
0.3
Abell 2052
0.03455d
J=2-1
2015.1.00627.S
80
2016-08-11
0.33 0.27
-41
20
0.3
2A0335+096
0.03458e
J=1-0
2012.1.00837.S
71
2014-07-22
1.3 1.1
-26
20
0.5
Hydra A
0.05435f
J=2-1
2016.1.01214.S
45
2016-10-23
0.24 0.17
89
10
0.4
Abell 1795
0.06331d
J=2-1
2015.1.00623.S
70
2016-06-11
0.81 0.61
-15
20
0.4
PKS 0745-191
0.1028c
J=3-2
2012.1.00837.S
25
2014-08-19
0.27 0.19
78
20
0.8
{tabnote}
∗*∗*footnotemark: References of redshifts: () Ogando et al. (2008), () Fouque et al. (1992), () Olivares et al. (2019), () Albareti et al. (2017), () Zaw et al. (2019), and () Rose et al. (2019).
††{\dagger}††{\dagger}footnotemark: A noise level for a channel map with a velocity width of binning.
3 Results
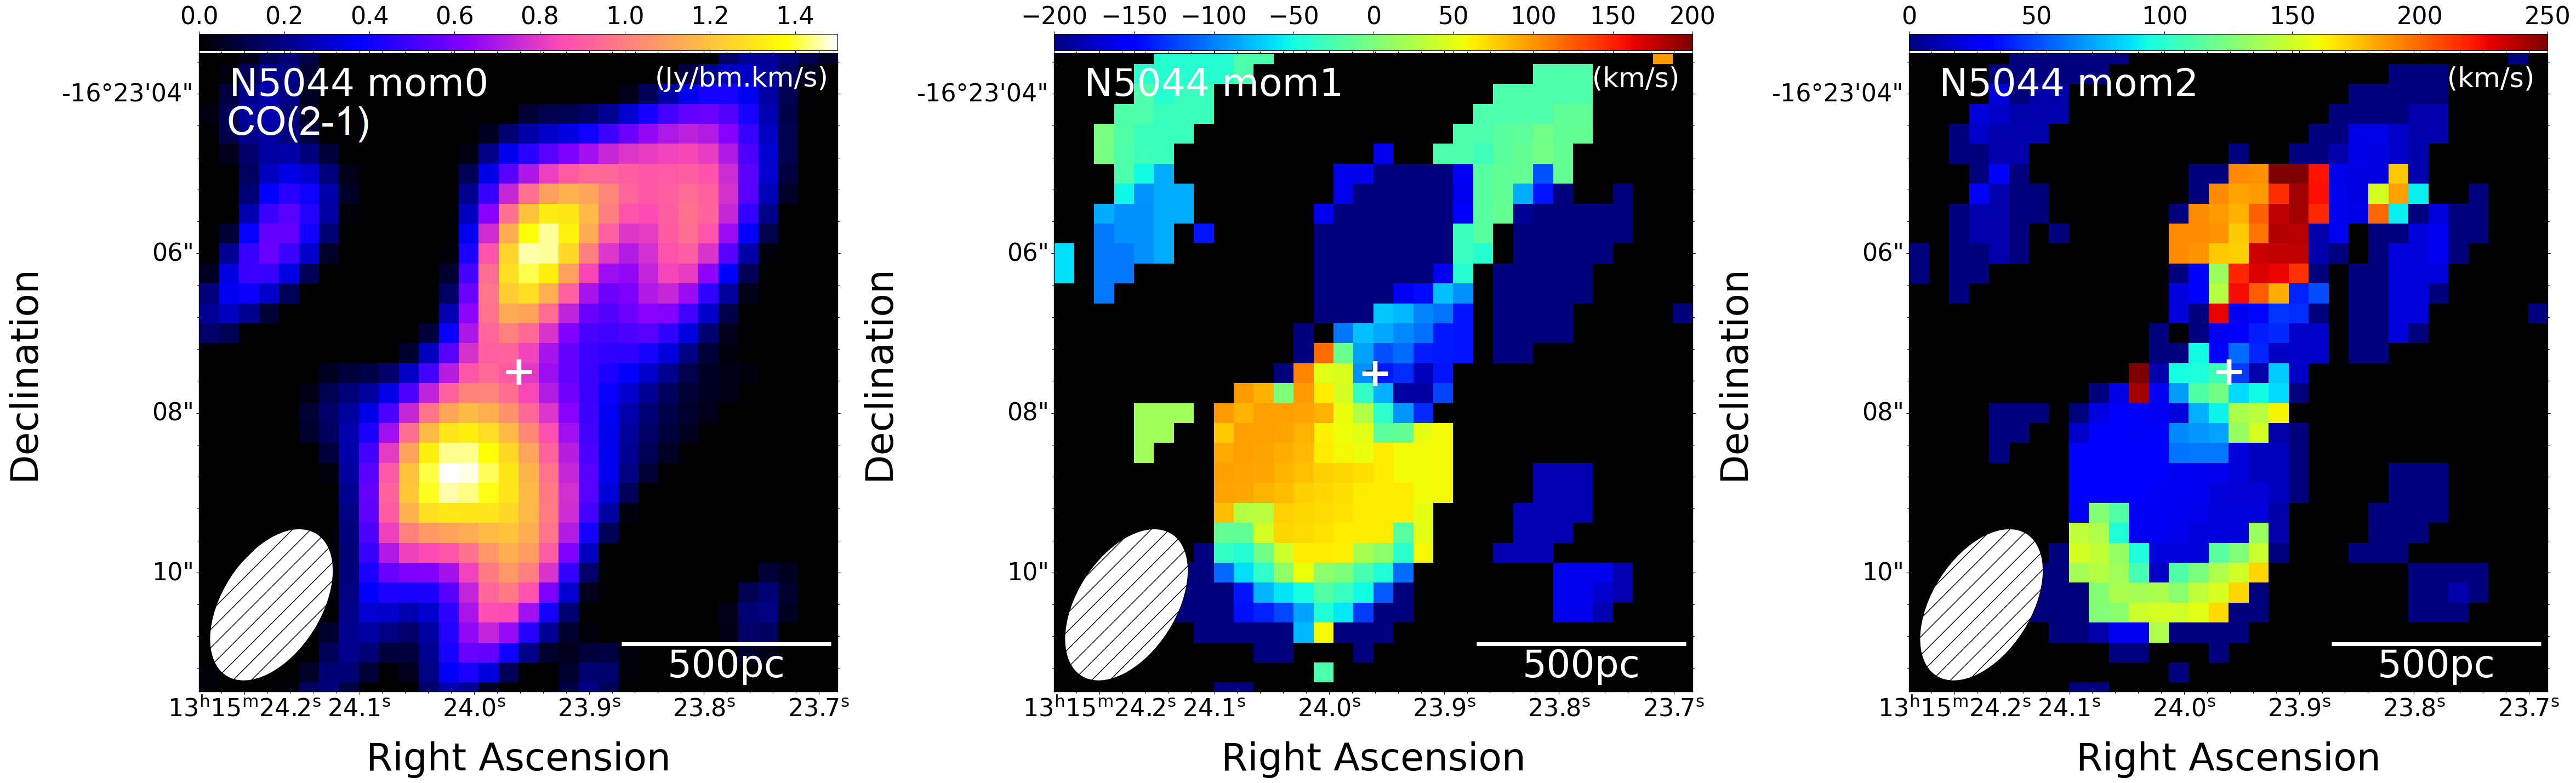
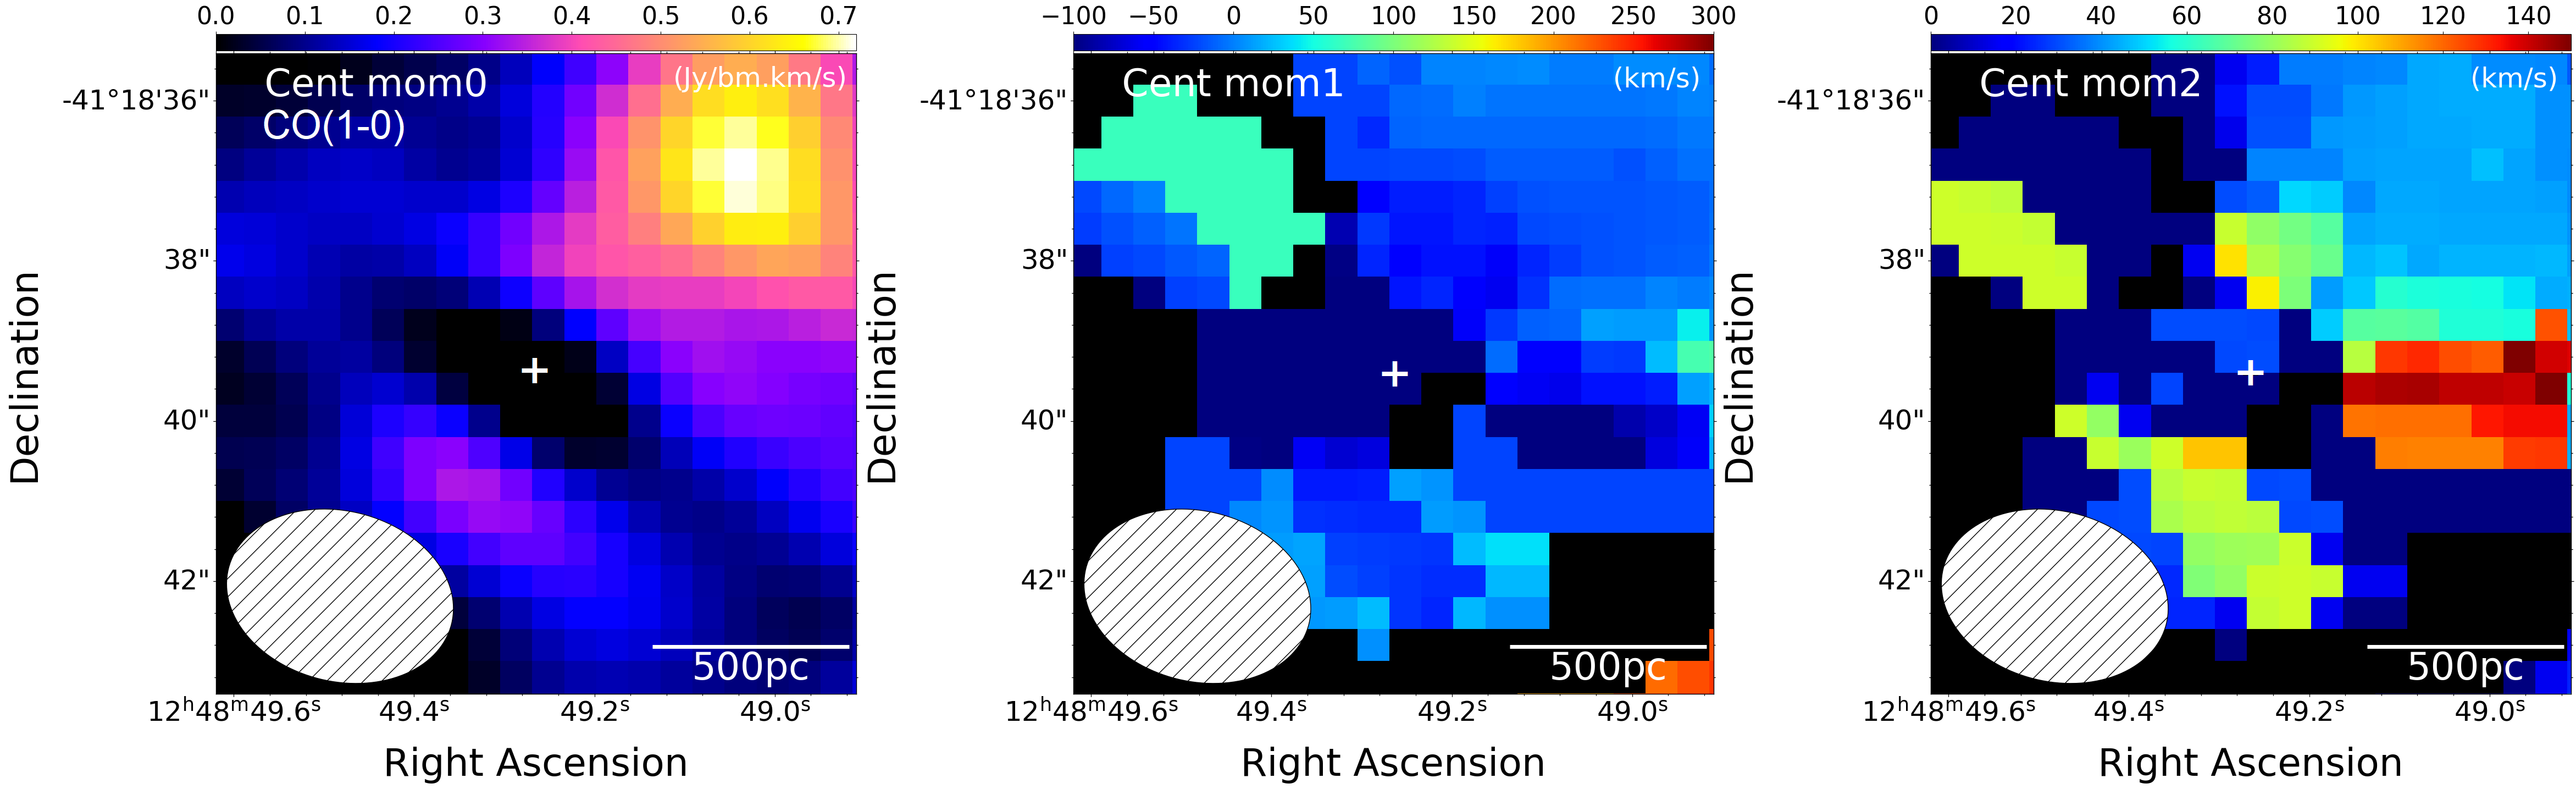
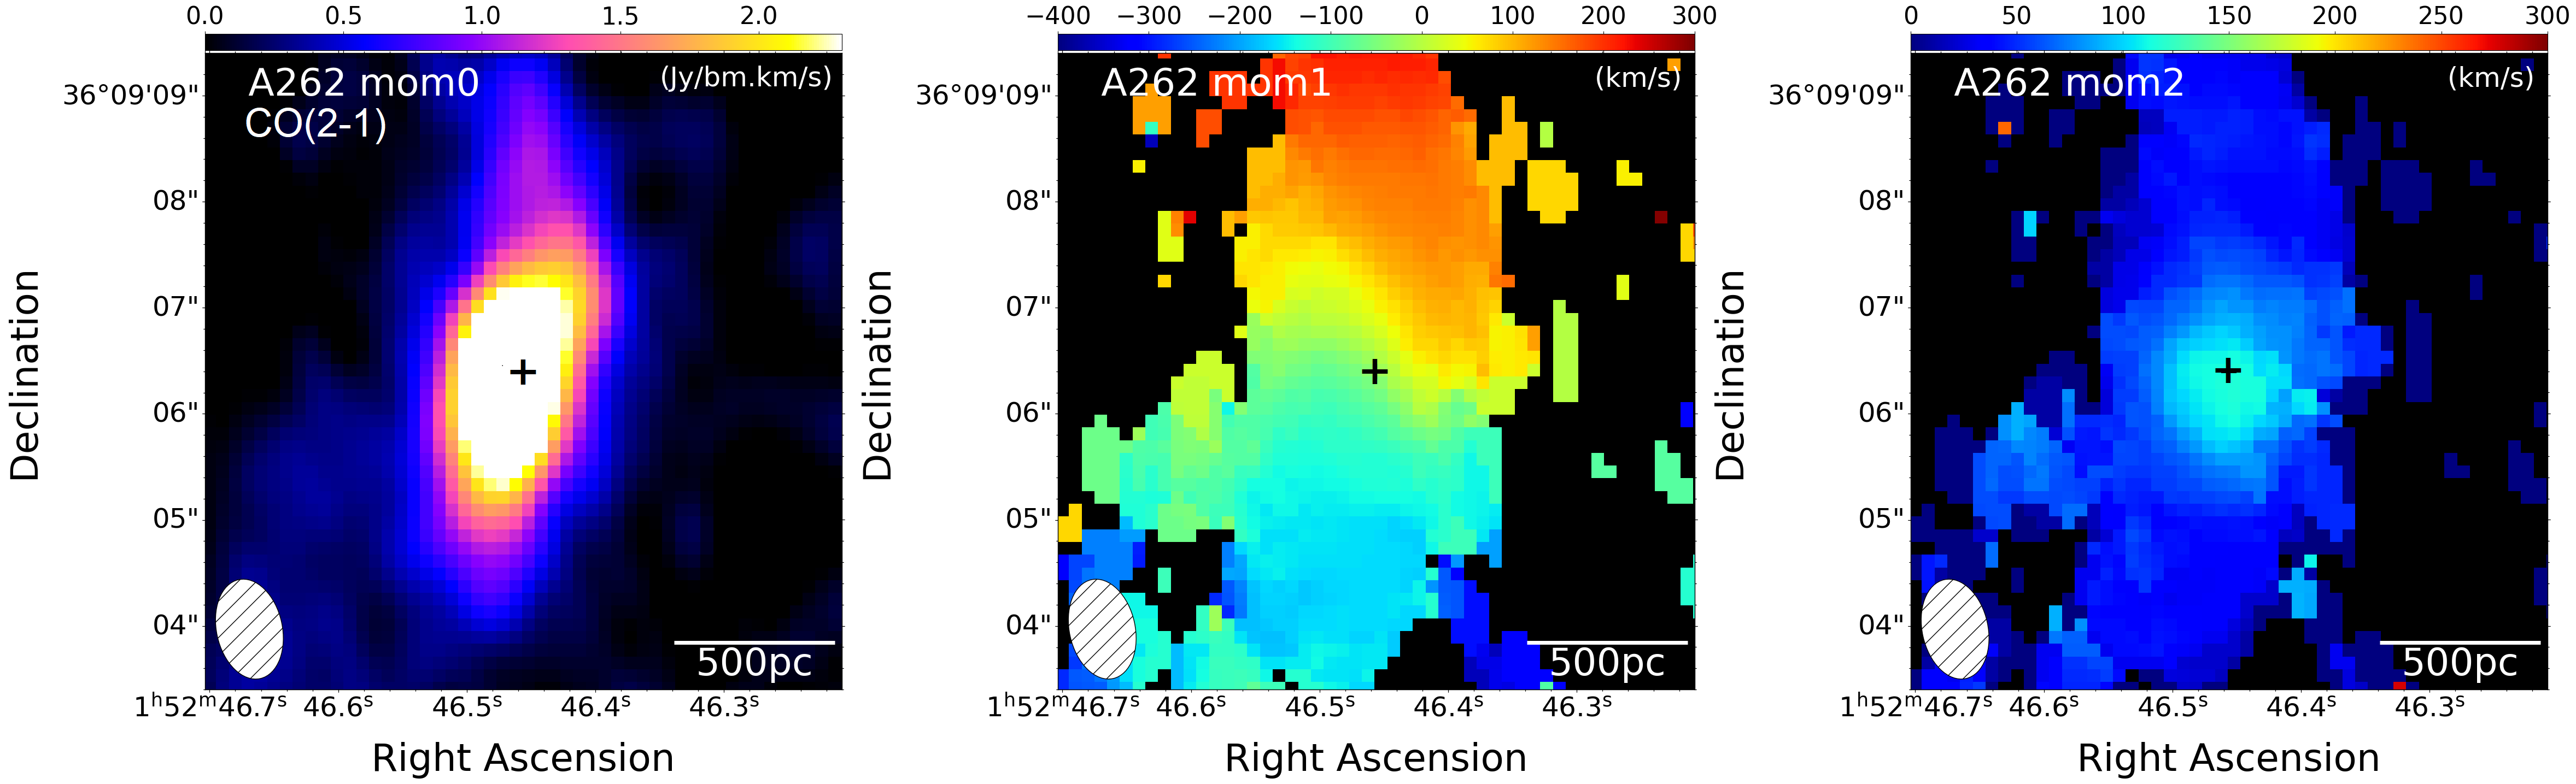
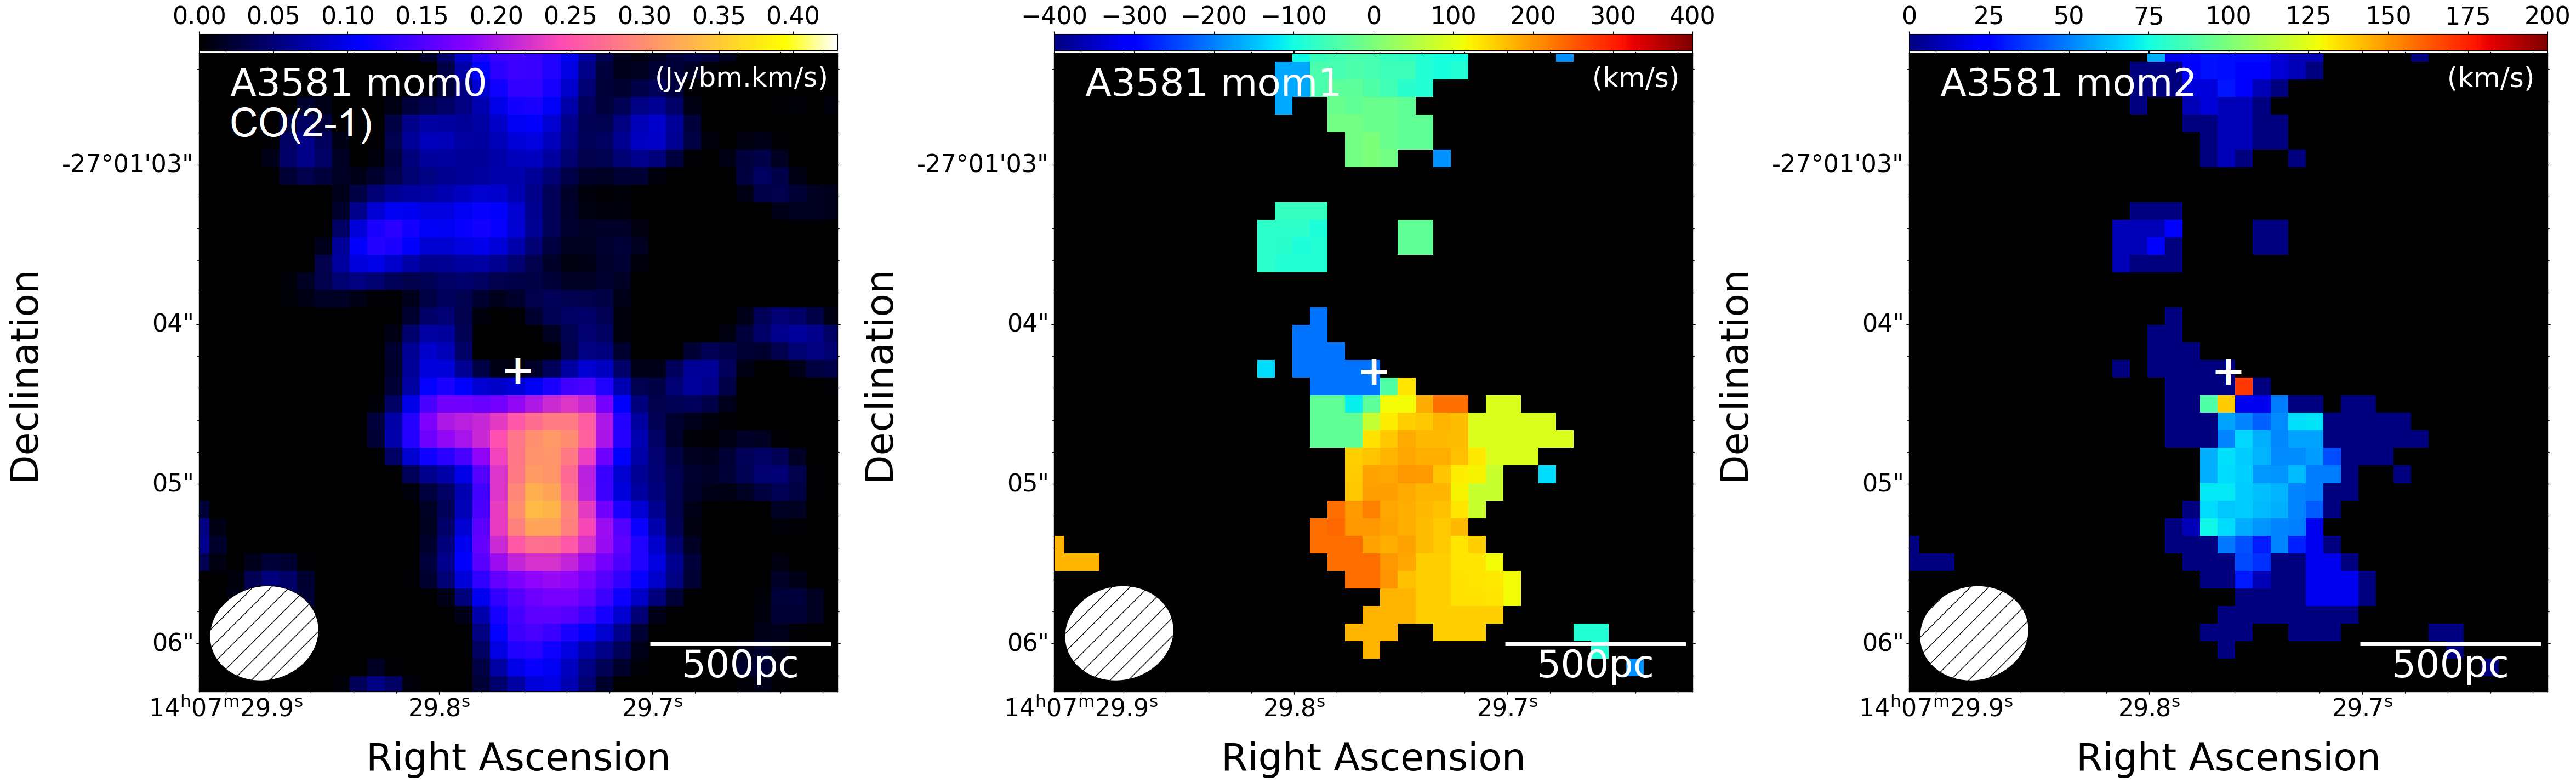
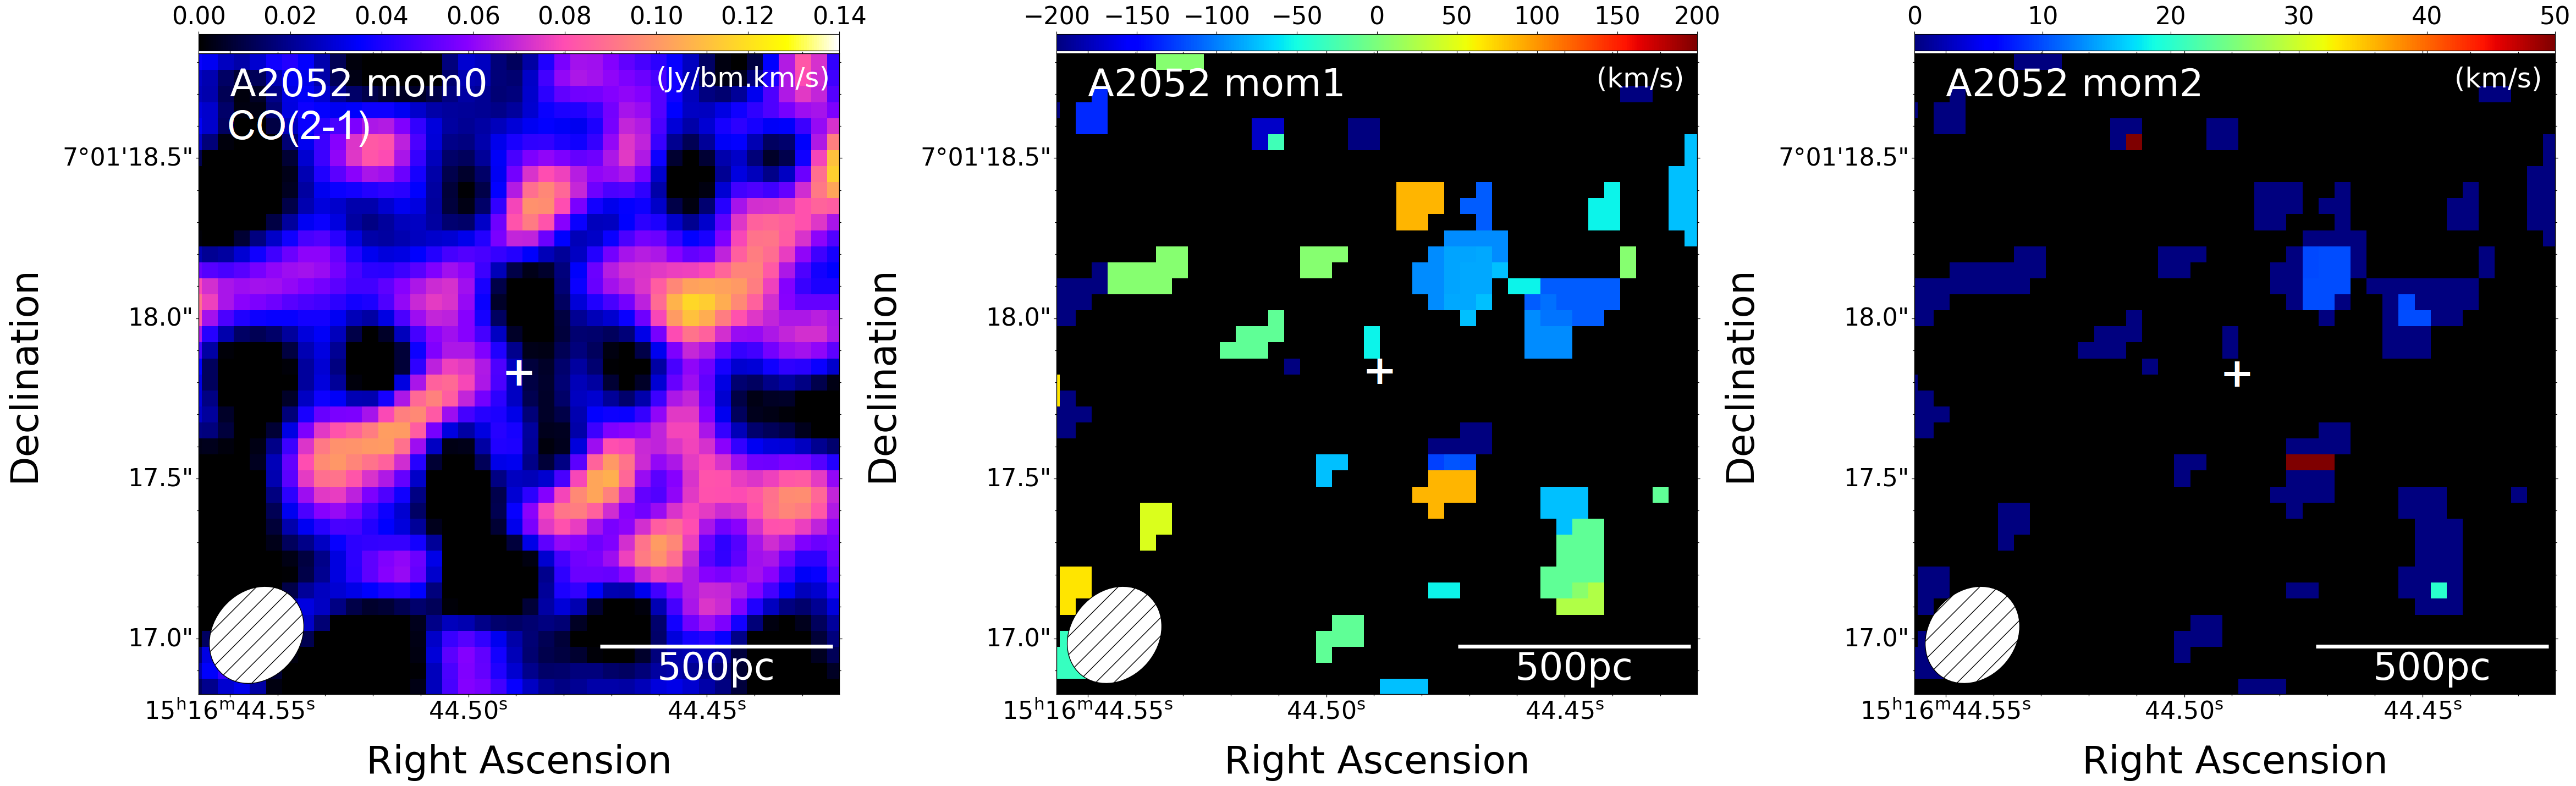
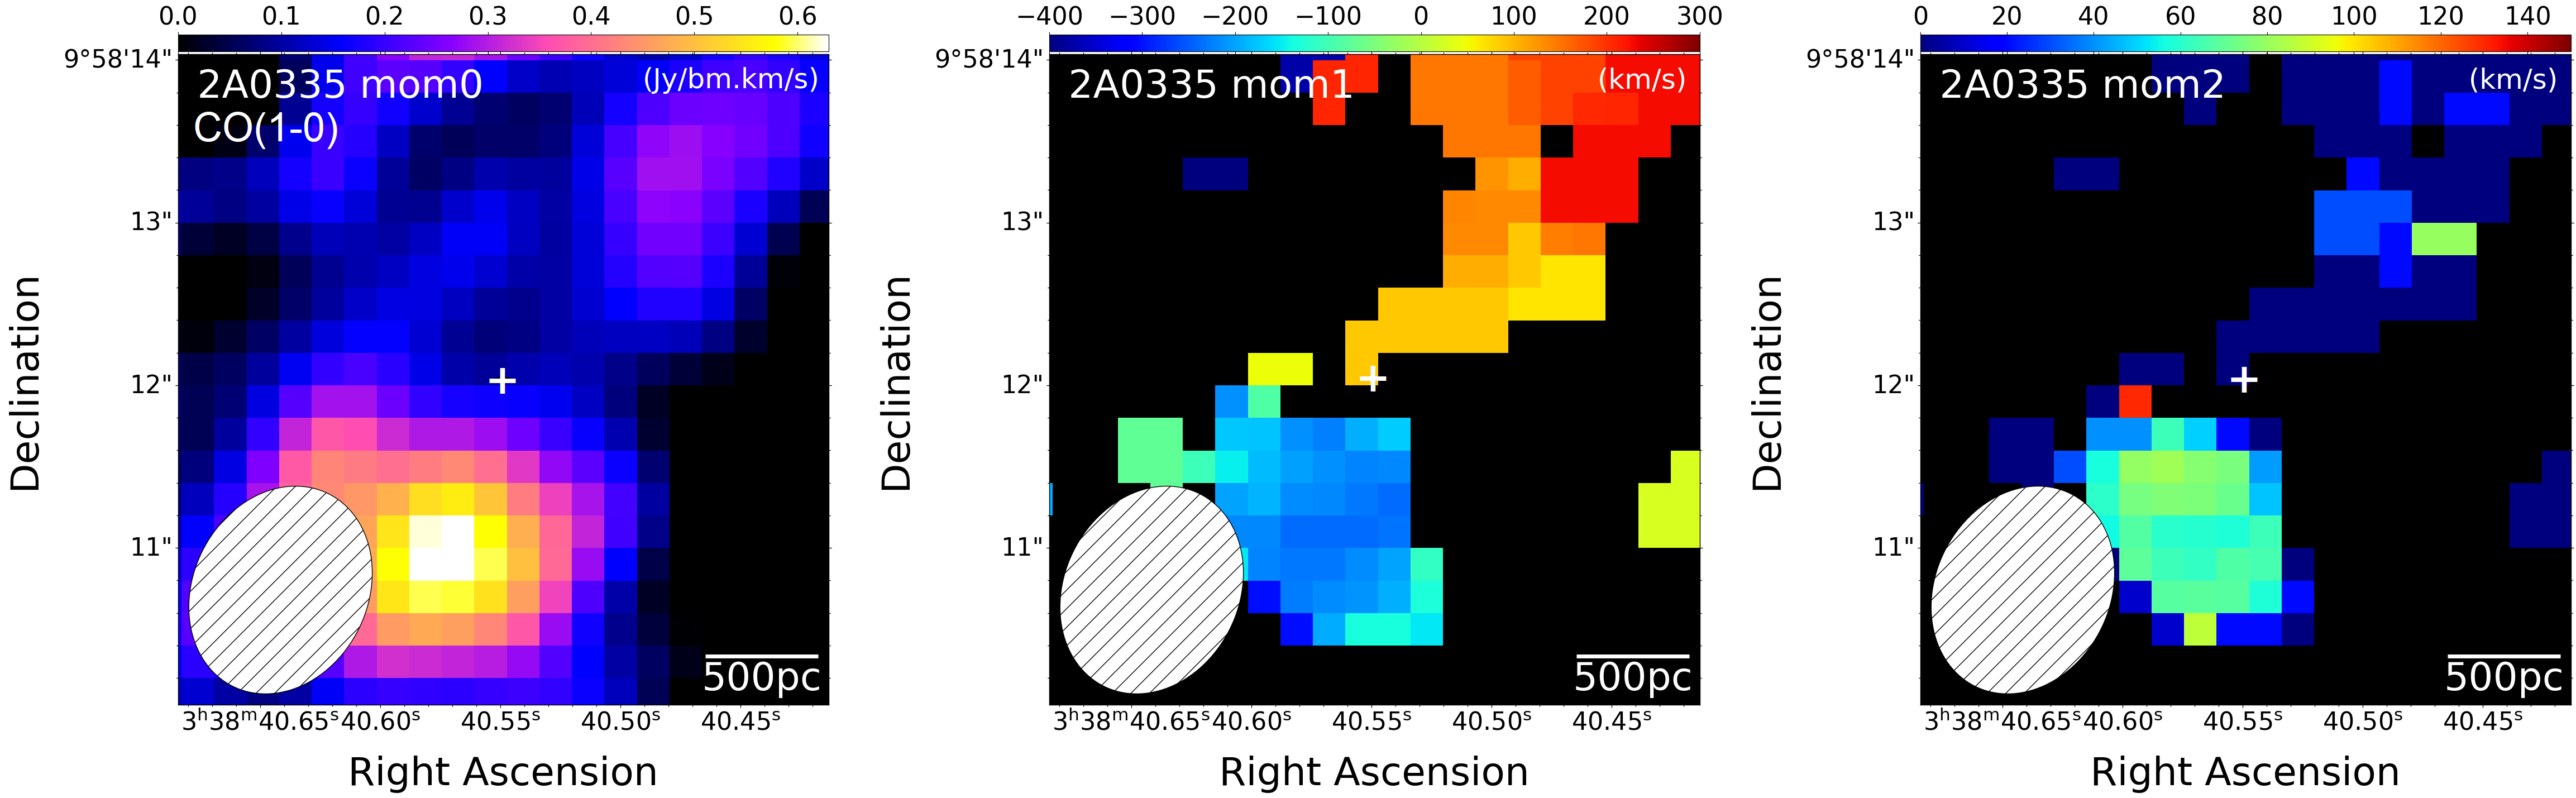
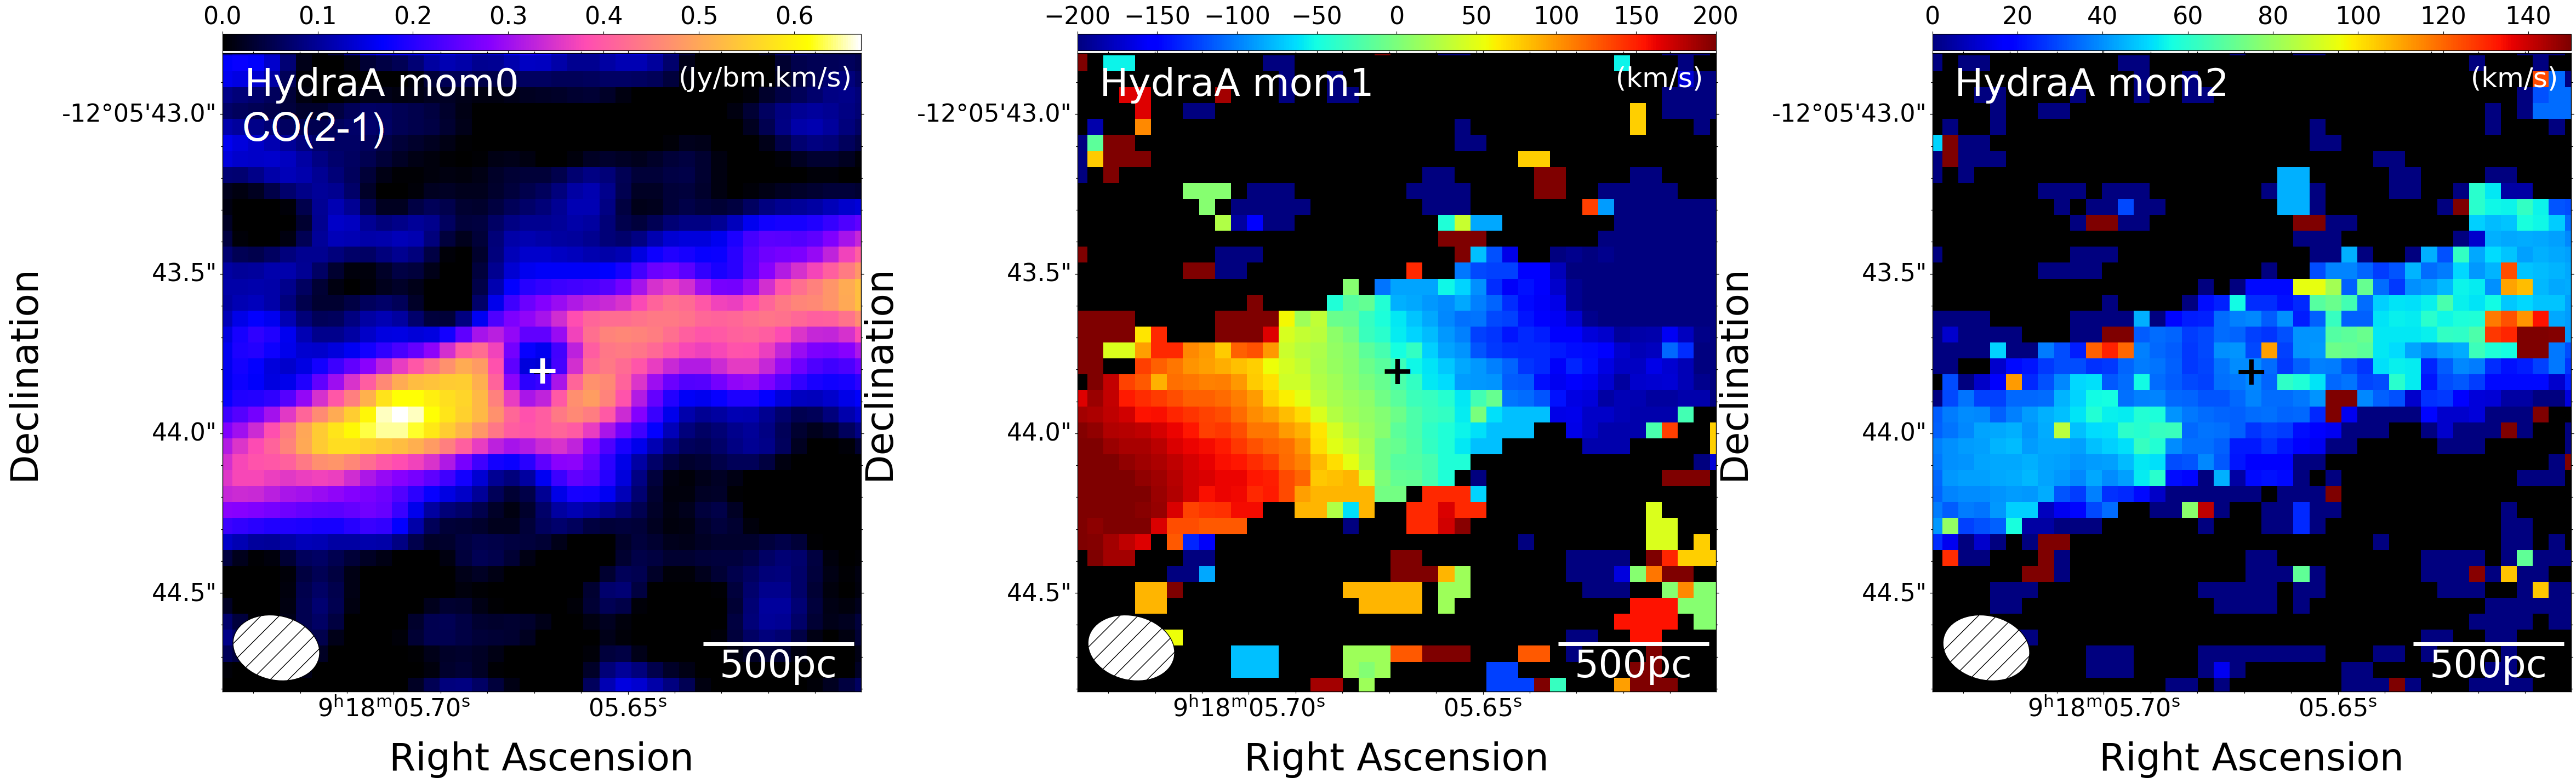
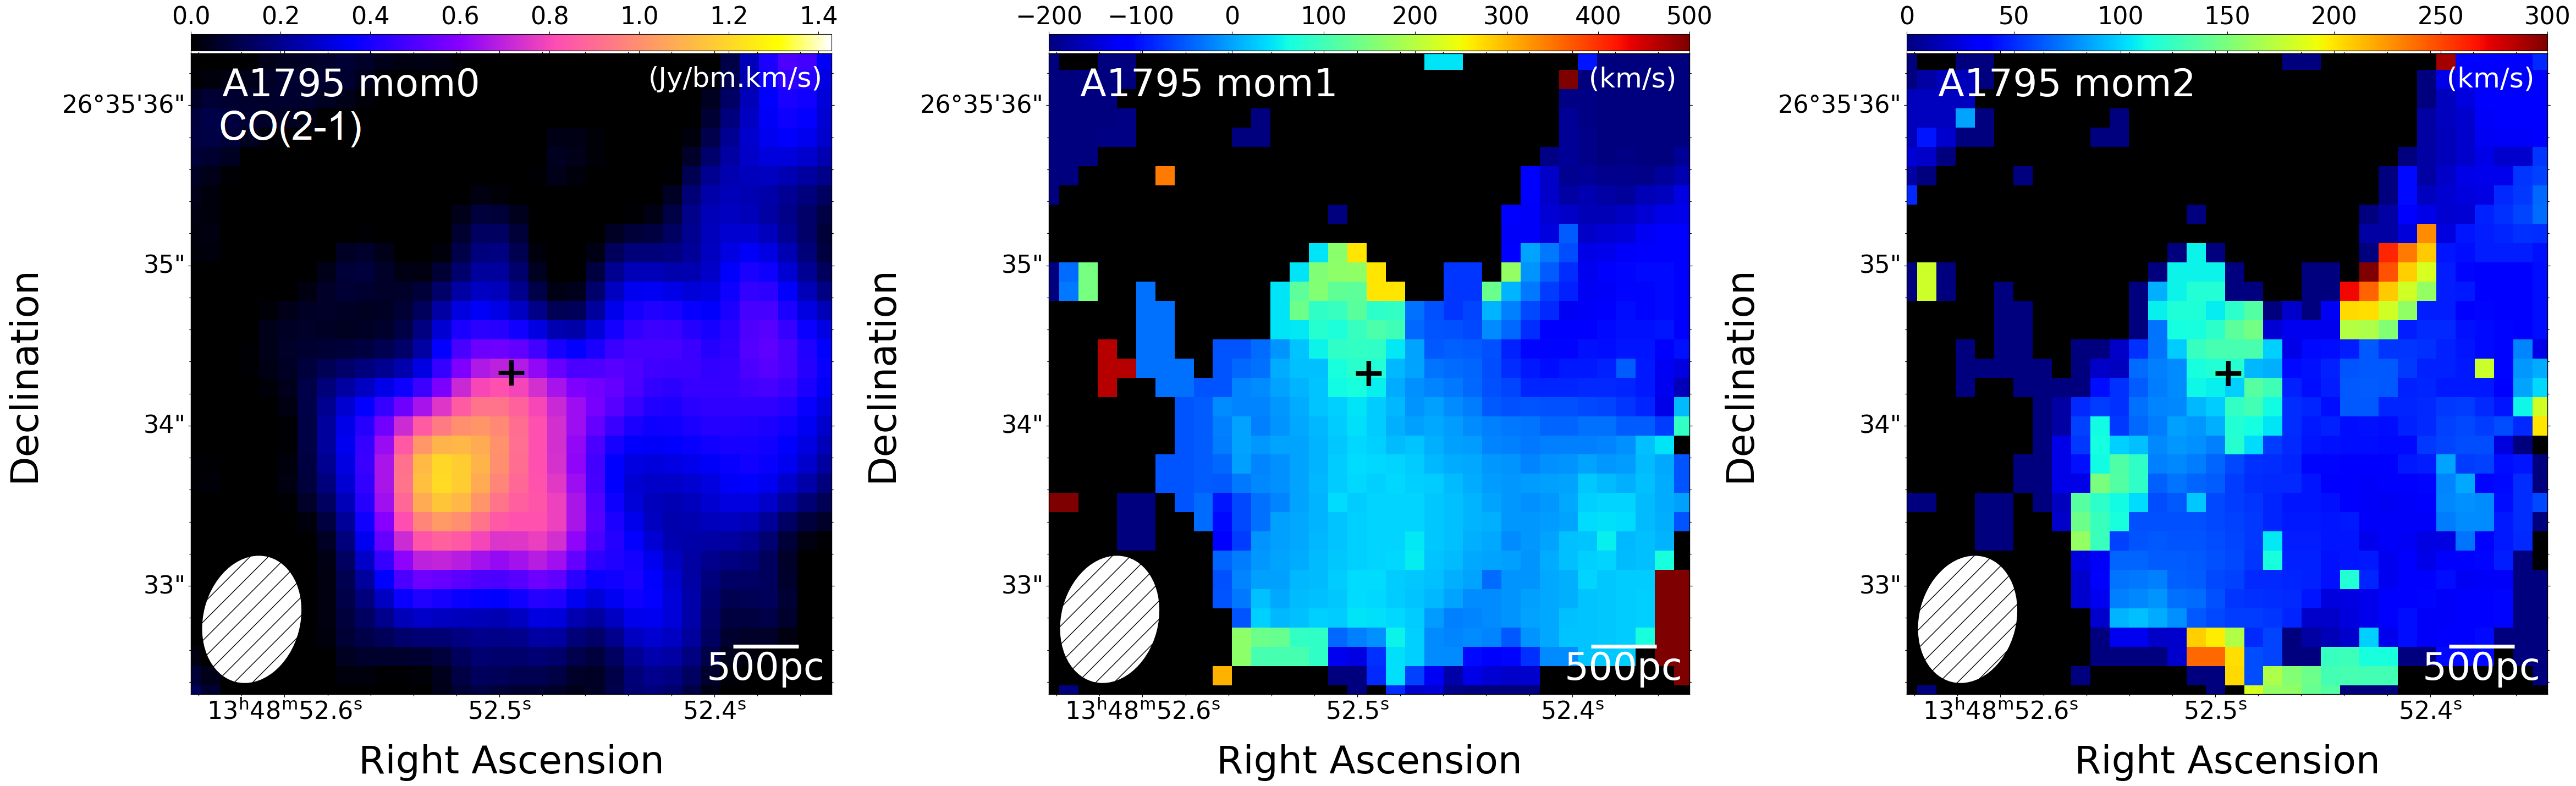
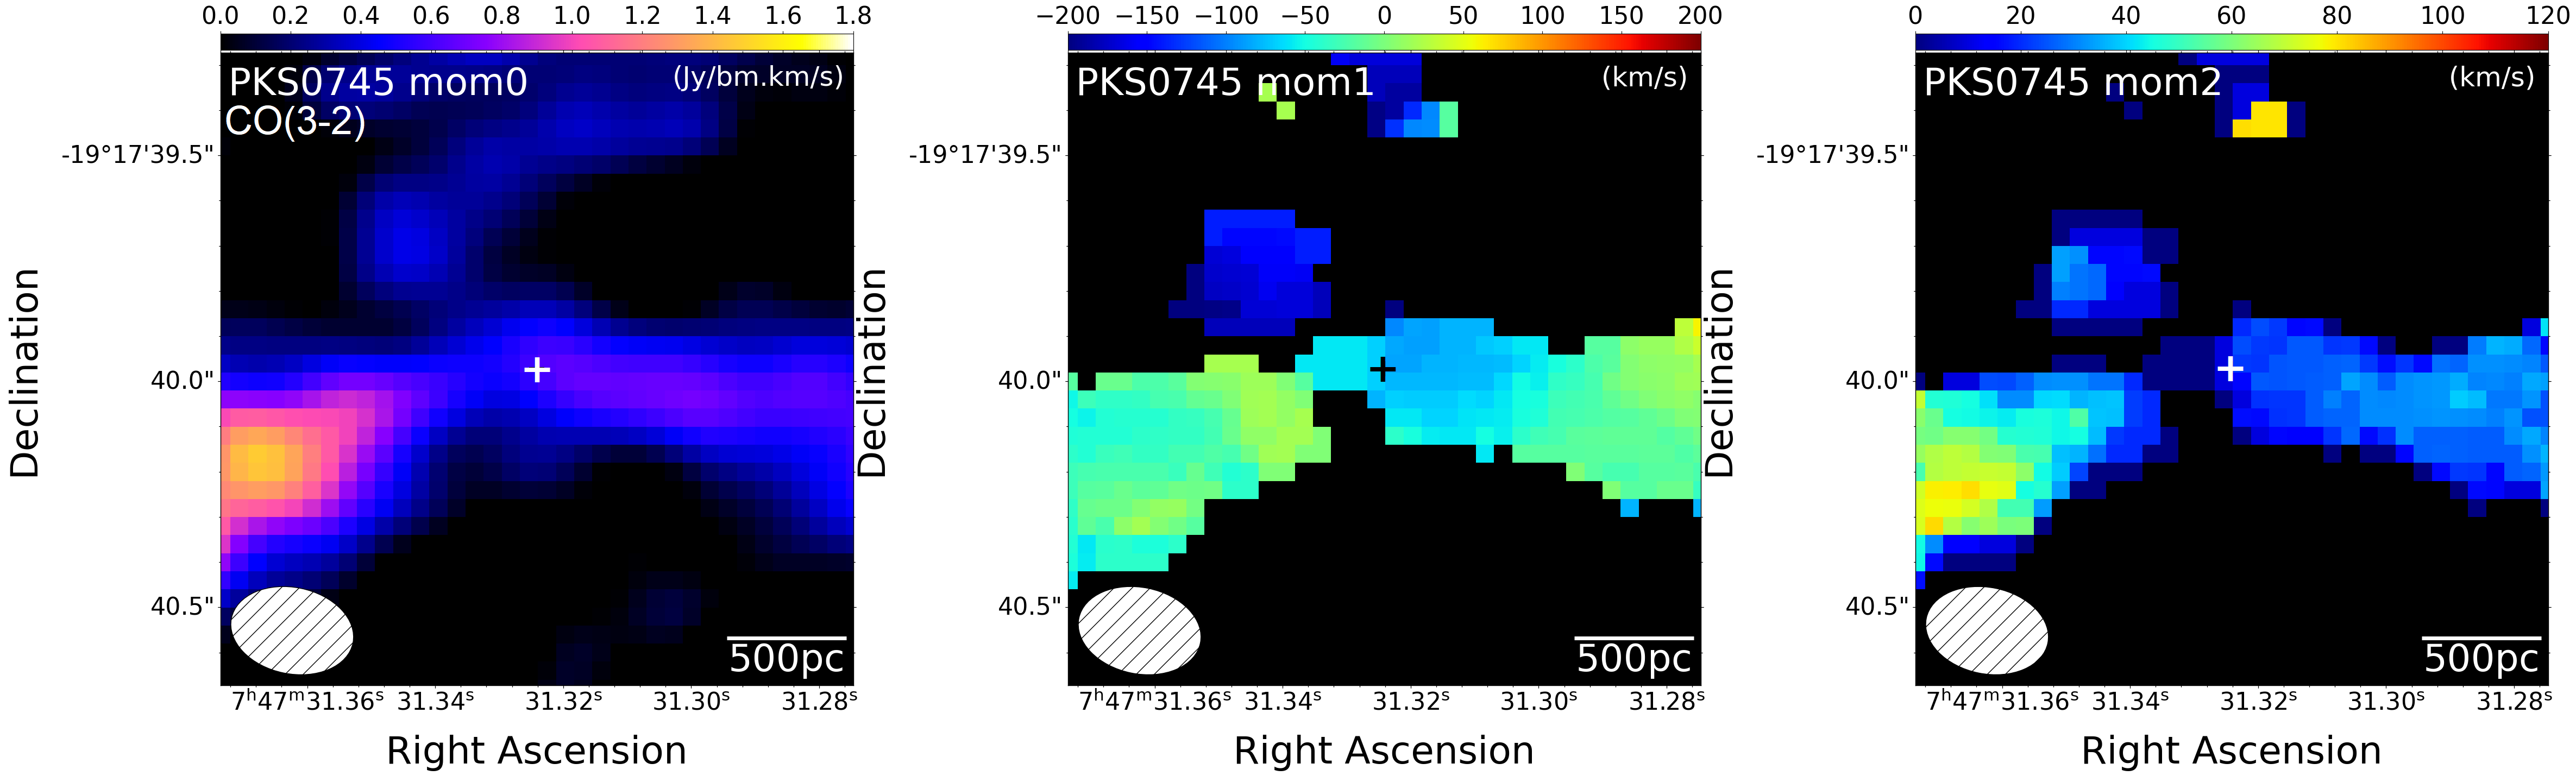
Using the CASA task immoments, images of the integrated intensity, intensity-weighted mean radial velocity (velocity center hereafter), and intensity-weighted mean velocity dispersion (full width at half-maximum or FWHM) were created for the vicinities of the AGNs in the 9 galaxies covering each CO line (figure 1). We extracted spectra from the central 500 pc region centered on the AGNs. We confirmed that the maximum recoverable scales are much larger than 500 pc for all the targets and the missed flux from the 500 pc region should be ignorable. Each spectrum was fitted with a model consisting of one or two Gaussian components (figure 2). The significance levels of those line components are . The best-fitting line center velocity relative to the galaxy rest frame, FWHM, and integrated intensity for each gaussian component are presented in table 3. We ignored line-like features if the line center velocity is because the corresponding gases are unlikely to be bound to the nuclei although they may still reside in the disks of central galaxies. They may be gas blobs that are falling toward or being ejected from the galactic centers. Hydra A has a prominent cold molecular gas disk seen in CO and substantial absorption due to the disk is seen at the line frequency at the position of the AGN (Rose et al. (2019); see figure 1). Thus, we excluded the innermost 160 pc, and we extracted and examined the spectra in the eastern and western regions of the AGN separately (figure 2). The parenthesized FWHM values shown in table 3 are the flux averages of the two gaussian components except for Hydra A, for which it is the flux average of the east and west values.


Observed CO and mm/submm continuum emissions.
Target
∗*∗*footnotemark:
FWHM††{\dagger}††{\dagger}footnotemark:
‡‡{\ddagger}‡‡{\ddagger}footnotemark:
()
()
()
(GHz)
(mJy)
NGC 5044
235.2
()
Centaurus
107.1
Abell 262
235.6
()
Abell 3581
231.8
()
Abell 2052
229.5
2A0335+096
110.5
…
Hydra A
227.6
()
Abell 1795
225.8
()
PKS 0745-191
314.6
…
{tabnote}
∗*∗*footnotemark: The velocity of the line component relative to the systemic velocity of the galaxy.
††{\dagger}††{\dagger}footnotemark: Flux-averaged ones are parenthesized.
‡‡{\ddagger}‡‡{\ddagger}footnotemark: The spectral index of the continuum
emission around , which cannot be constrained for 2A0335+096 and PKS 0745-191 (see text).
3.1 Molecular gas mass
From the CO intensities presented in table 3, we derive the masses of molecular gas within pc from the AGNs using the following relation from Bolatto et al. (2013):
| (1) |
where is the CO-to-H2 conversion factor, and is the luminosity distance. The factor represents the assumption on the CO excitation, which is necessary to estimate CO(J=1-0) flux from higher-J measurements. Specifically, gives a CO(J=2-1)/CO(J=1-0) line ratio in flux density scale, 3.2, and is a CO(J=3-2)/CO(J=1-0) ratio of 7.2 (Rose et al., 2019; Russell et al., 2019). The dispersion of the values among the galaxies is about % (Braine & Combes, 1992; Salomé & Combes, 2003). The conversion factor is not well-understood for elliptical galaxies. Thus, we adopt a standard value of measured in the Milky Way, following previous studies (Olivares et al. (2019); Russell et al. (2019) and see their discussion). The results are shown in table 3.1. When there are two gaussian components in the spectrum, the mass is their summation.
Molecular gas mass and mm/submm continuum luminosity obtained in
this study.
Target
∗*∗*footnotemark:
()
( yr)
()
NGC 5044
4.0
Centaurus
2.9
Abell 262
3.7
Abell 3581
2.3
Abell 2052
3.6
2A0335+096
2.5
Hydra A
4.7
Abell 1795
2.6
PKS 0745-191
3.5
{tabnote}
∗*∗*footnotemark: Calculated from and shown in table 3 using equation (4).
Properties of the targets.
Target
∗*∗*footnotemark:
††{\dagger}††{\dagger}footnotemark:
‡‡{\ddagger}‡‡{\ddagger}footnotemark:
()
(mJy)
()
()
NGC 5044
Centaurus
Abell 262
Abell 3581
Abell 2052
2A0335+096
Hydra A
Abell 1795
PKS 0745-191
{tabnote}
∗*∗*footnotemark: Jet power from Rafferty et al. (2006) and Pulido et al. (2018).
††{\dagger}††{\dagger}footnotemark: 1.4 GHz flux from Condon et al. (1998) except for Centaurus (Kuehr et al., 1981)
‡‡{\ddagger}‡‡{\ddagger}footnotemark: Black hole mass from Rafferty et al. (2006) except for NGC 5044 (David et al., 2009).
3.2 Circumnuclear gas and jet power
Figure 3 shows the relation between the molecular gas mass at pc () and the jet power required to inflate X-ray cavities (). The data of have been taken from the literature (Rafferty et al., 2006; Pulido et al., 2018). A correlation can be seen between and , and the Pearson correlation coefficient on the logarithmic scales is 0.754 with -value 0.019. The correlation can be described by a power-law model of the form:
| (2) |
Using the bivariate correlated errors and intrinsic scatter BCES estimator (Akritas & Bershady, 1996), which accounts for errors in both axes and the presence of possible intrinsic scatter, we obtain and . In other words, the correlation indicates that the jet power is proportional to the average density of the circumnuclear molecular gas because we considered the mass within the fixed radius and . Abell 262 appears to be an outlier of this correlation because it is outside the confidence range (figure 3). If we exclude Abell 262 from the sample, the correlation coefficient increases to 0.906 with -value 0.0020. Abell 262 has a lower AGN activity despite retaining a large amount of gas. Possible reasons will be discussed in section 4.1.

The gas accretion rate may be more directly related to the AGN activity than . The accretion is likely to be induced by the angular momentum transfer by turbulence (Pizzolato & Soker, 2010; Gaspari et al., 2017). In this case, the accretion process can be regarded as a diffusion process of gas clumps, and the diffusion coefficient is , where and is the eddy scale and the velocity of the turbulence, respectively (e.g. Xie et al. (1995)) Thus, the diffusion or the accretion time scale of the gas on the scale of interest () is , and the accretion rate is . We note that this estimation can even be applied to the standard disk (Shakura & Sunyaev, 1973). Since the kinetic viscosity coefficient can be regarded as the diffusion coefficient, the accretion time of a disk on a scale of is also (section 6 of Pringle (1981)). Thus, we adopt the relation of regardless of whether molecular gas has a disk-like structure or not. We assume that and (Shapiro & Teukolsky, 1983), where pc and . For the FWHM, we use the flux averaged values when there are two gaussian components (parenthesized ones in table 3.1). We note that the derived may include a rotational component on a small scale that cannot be spatially resolved (see Nagai et al. (2019)) and it should be regarded as the upper limit. However, the effect of rotation velocity contamination may not be significant. We have investigated the effect within the observing beam, using a cube model code 3D-Barolo 111https://editeodoro.github.io/Bbarolo/ for Abell 262, a galaxy with a spatially resolved CO velocity field. The model fit shows that , which is close to FWHM/2.35 (table 3). We also indicate that not all the in-flowing gas () is eventually swallowed by the black hole because some of it is consumed in star formation (Fujita et al., 2022). The obtained and are shown in table 3.1.
Figure 4 shows the relation between and , which is similar to that between and (figure 3). The correlation coefficient is 0.733 with -value 0.025, and it is 0.871 with -value 0.0049 if we exclude Abell 262 because it is almost at the end of the confidence range. The correlation among the 9 objects can be represented by a power-law model of the form:
| (3) |
The BCES estimator gives and . The similarity between figures 3 and 4 reflects the fact that while FWHM varies only a factor of few, ranges nearly two orders of magnitude. This suggests that the mass of circumnuclear molecular gas is the main factor that determines the jet activity. Thus, the – relation seems to be robust even if we consider potential uncertainties such as the gas morphology (disk-like or not) and the contamination of a rotational velocity component.

3.3 Circumnuclear gas and continuum emission
Since radio continuum emission is observed as a point source at the position of the AGNs, it should come from the vicinity of the AGNs ( pc) and reflect their recent activity. We derive the continuum flux at line-free channels.
We convert fluxes at observed frequencies to those at the rest-frame CO(J=1-0) line frequency ( GHz) assuming that the continuum emission is represented by a power-law , where is the frequency. We adopt a typical spectral index of . For an object at the redshift and observed at the frequency , the radio continuum luminosity at the frequency is estimated to be
| (4) |
where is the observed flux (mJy) and is the line frequency ratios ( for CO(J=1-0), for CO(J=2-1)222Exactly speaking, the continuum flux is not measured right at the frequency of the CO line. However, since the index is , the minor modification does not affect the results., and for CO(J=3-2)), which is required for the flux conversion among different line frequencies. The derived luminosities are presented in table 3.1 and they are compared with in figure 5. The correlation coefficient is 0.386 and the -value is 0.30, which is much larger than the conventional threshold of 0.05. Thus, it is unlikely that that is correlated with . Again, Abell 262 appears to be an outlier because the radio luminosity is extremely small for its large . If we exclude Abell 262 from the sample, the coefficient is 0.740 with -value 0.036, which shows a sign of correlation.

Traditionally, radio emissions at lower frequencies have been used as an indicator of AGN activities (Bîrzan et al., 2004; Pulido et al., 2018). Figure 6 compares the radio luminosity estimated from 1.4 GHz observations (NRAO/VLA Sky Survey333https://www.cv.nrao.edu/nvss/NVSSlist.shtml; Condon et al. (1998)) with the mass of the circumnuclear molecular gas (). The former is derived by
| (5) |
where is GHz, is the observed flux at 1.4 GHz, and . Since our targets are at lower redshifts (), the correction of is insensitive to . The correlation coefficient is 0.556 with -value 0.12. Thus, is unlikely to be correlated with . However, if Abell 262 is ignored, the correlation coefficient is 0.778 with -value 0.023, which may indicate the existence of correlation.

4 Discussion
4.1 Circumnuclear gas and AGN activity
We have shown that the mass of circumnuclear molecular gas () within a fixed radius (500 pc) has a correlation with the jet power estimated from X-ray cavities (; figure 3). This suggests that the circumnuclear molecular gas serves as the fuel for AGN feedback (Fujita et al., 2022). Assuming that the gas accretion is caused by angular momentum transport by turbulence, the accretion rate () is also correlated with (figure 4), although the – relation is virtually the – relation. We conclude that the jet power depends on the average density of the circumnuclear molecular gas because we considered the mass within the fixed radius. Since in equation (2), a simple relation of is acceptable. This fact would be useful when constructing sub-grid models of AGN feedback in numerical simulations, which have often adopted the classical Bondi accretion rate. The correlation between the mass of circumnuclear molecular gas and the AGN activity has been known for disk galaxies (e.g. Izumi et al. (2016), but there is a counter-example, see Kameno et al. (2020)). Thus, the AGN fueling mechanism for elliptical galaxies may be similar to that in the disk galaxies.
In contrast with , the continuum luminosities both at GHz () and –300 GHz () seem to have no correlation with (figures 5 and 6). The difference may be ascribed to the relevant time scales of AGN activities. The jet power is often described by the ratio of the energy required to inflate the cavity to its evolution time () such as the cavity’s buoyancy age (Allen et al. (2006); Rafferty et al. (2006); see also Fujita et al. (2016)). Thus, reflects the AGN activity averaged over on a time scale of , which is estimated to be yr (Rafferty et al., 2006). Interestingly, it is comparable to the gas accretion time (table 3.1). On the other hand, since the mm/submm (–300 GHz) continuum is observed as nuclear point sources coincident with the AGNs, the size of the emitting regions should be pc. Since the light-travel time of the regions is only yr, the emission virtually reflects the current activity of the AGN. The existence of the correlation between and and the non-existence between the continuum luminosities and suggest that the circumnuclear gas is rather persistently fueling the AGN activity on a longer time scale ( yr), while the continuum luminosities vary on a short time scale. However, since is the total luminosity of the galaxy, it may include emissions from larger and older structures such as kpc radio jets and lobes444The angular resolution of the observations is (Condon et al., 1998), which corresponds to 18 kpc at .. Thus, it could be proven that is more strongly correlated with than , once a larger sample becomes available.
In figures 3–6, Abell 262 appears to be an outlier. While it has a large amount of circumnuclear molecular gas (), both the jet power () and the continuum luminosities ( and ) are small. This might be explained if the AGN activity has been gentle for a long time. Thus, there may be an additional factor that affects the activity other than the mass of circumnuclear molecular gas. For example, compared with other galaxies with similar amount of (Abell 1795, Hydra A, and PKS 0745–191), the mass of the black hole () at the center of Abell 262 is small (table 3.1). This may lead to a lower efficiency of power generation, which may explain its peculiarity. Alternatively, the AGN may have been at a “pre-feedback” phase (Ubertosi et al., 2023).
4.2 The origin of the mm/submm continuum emission
So far, the origin of the continuum emission from the AGNs in massive elliptical galaxies has not been much studied in the mm/submm band. We study the spectral index of the continuum emission by comparing the fluxes between the upper and lower sidebands of the CO lines (table 3). For most galaxies, the frequency difference between the sidebands is GHz. However, it is only GHz for 2A0335096 and PKS 0745191, and their indices cannot be well constrained. Table 3 shows that the indices are except for NGC 5044, which indicates that the emission is likely to be dominated by synchrotron radiation and the contribution of dust emission is minor. Thus, the assumption of in section 3.3 seems to be reasonable.
Figure 7 compares the continuum luminosities at GHz () with those at GHz () estimated in section 3.3. Those two luminosities are positively correlated and the correlation coefficient is 0.823 with -value 0.0059. The correlation among the 9 objects can be represented by a power-law model of the form:
| (6) |
The BCES estimator gives and . We have confirmed that there is no correlation between fluxes and (the correlation coefficient is -0.2567 and -value is 0.48). Thus, it is unlikely that the – relation with is due to redshift selection effects (Feigelson & Berg, 1983). The fact that is significantly smaller than one means that the ratio increases as decreases. This suggests that the mm/submm continuum emission from the AGNs with large is pure synchrotron radiation, while that from the AGNs with smaller is contaminated by additional dust emission. Figure 8 shows the ratios and illustrates a possible continuum spectrum (solid line). We assume that the spectrum is simply represented by a combination of power-law (synchrotron) and modified blackbody (dust) components:
| (7) |
where , THz, , and is a blackbody distribution (e.g. Falkendal et al. (2019)). The dust temperature is assumed to be K, which is obtained for massive elliptical galaxies at cluster centers (e.g. Fogarty et al. (2019)). The relatively low temperature may be because the surface area of the molecular gas is small for a given mass and it is well shielded (Fogarty et al., 2019). If K, the peak frequency of dust emission shifts to a higher frequency. The constants and are adjusted to reproduce the observations of NGC 5044. Figure 8 suggests that, except for NGC 5044, the contribution of the dust component at –300GHz is small, which is consistent with observations of local AGNs (Kawamuro et al., 2022).


5 Conclusion
We have studied the relation between the circumnuclear molecular gas and the activities of the AGNs in the massive elliptical galaxies at the center of galaxy clusters. We analyzed ALMA archival data for 9 galaxies and obtained the circumnuclear molecular gas mass at pc from the AGNs. We found that the mass has a correlation with the jet power of the AGNs. Since the jet power is estimated from the size of X-ray cavities, it should be the average power over the cavity formation period. Thus, the correlation indicates that the circumnuclear gas is responsible for long-term AGN activities ( yr). We also estimated the mass accretion rate of the cold gas assuming that the angular momentum transfer is caused by turbulence. We showed that the accretion rate is also correlated with the jet power. On the other hand, radio continuum emissions from the AGNs at 1.4 GHz and –300 GHz are not correlated with the mass of circumnuclear molecular gas. This means that the gas is not directly associated with the current AGN activity. The spectra of the mm/submm (–300 GHz) continuum emission indicate that they are mostly synchrotron radiation. However, comparison with 1.4 GHz luminosity suggests that dust emission is contaminated for lower luminosity AGNs.
We thank the reviewer for helpful comments that improved the paper. We also thank the EA ALMA Regional Center (EA-ARC) for their support. This work was supported by NAOJ ALMA Scientific Research Grant Code 2022-21A, and JSPS KAKENHI Grant Number JP20H00181, JP22H01268, JP22H00158 (Y.F.), JP20K14531, JP21H04496 (T.I.), JP19K03918 (N.K.), JP21H01137, JP18K03709 (H.N.). This paper makes use of the following ALMA data: ADS/JAO.2011.0.00735.S, ADS/JAO.2012.1.00837.S, ADS/JAO.2012.1.00837.S, ADS/JAO.2015.1.00598.S, ADS/JAO.2015.1.00623.S, ADS/JAO.2015.1.00627.S, ADS/JAO.2015.1.00644.S, ADS/JAO.2015.1.01198.S, ADS/JAO.2016.1.01214.S. ALMA is a partnership of ESO (representing its member states), NSF (USA) and NINS (Japan), together with NRC (Canada), MOST and ASIAA (Taiwan), and KASI (Republic of Korea), in cooperation with the Republic of Chile. The Joint ALMA Observatory is operated by ESO, AUI/NRAO and NAOJ. Data analysis was in part carried out on the Multi-wavelength Data Analysis System operated by the Astronomy Data Center (ADC), National Astronomical Observatory of Japan.
References
- Albareti et al. (2017) Albareti, F. D., Allende Prieto, C., Almeida, A., et al. 2017, ApJS, 233, 25. doi:10.3847/1538-4365/aa8992
- Allen et al. (2006) Allen, S. W., Dunn, R. J. H., Fabian, A. C., et al. 2006, MNRAS, 372, 21. doi:10.1111/j.1365-2966.2006.10778.x
- Akritas & Bershady (1996) Akritas, M. G. & Bershady, M. A. 1996, ApJ, 470, 706. doi:10.1086/177901
- Bîrzan et al. (2004) Bîrzan, L., Rafferty, D. A., McNamara, B. R., et al. 2004, ApJ, 607, 800. doi:10.1086/383519
- Bolatto et al. (2013) Bolatto, A. D., Wolfire, M., & Leroy, A. K. 2013, ARA&A, 51, 207. doi:10.1146/annurev-astro-082812-140944
- Bondi (1952) Bondi, H. 1952, MNRAS, 112, 195. doi:10.1093/mnras/112.2.195
- Braine & Combes (1992) Braine, J. & Combes, F. 1992, A&A, 264, 433
- Cavagnolo et al. (2008) Cavagnolo, K. W., Donahue, M., Voit, G. M., et al. 2008, ApJ, 683, L107. doi:10.1086/591665
- Churazov et al. (2000) Churazov, E., Forman, W., Jones, C., et al. 2000, A&A, 356, 788. doi:10.48550/arXiv.astro-ph/0002375
- Condon et al. (1998) Condon, J. J., Cotton, W. D., Greisen, E. W., et al. 1998, AJ, 115, 1693. doi:10.1086/300337
- David et al. (2009) David, L. P., Jones, C., Forman, W., et al. 2009, ApJ, 705, 624. doi:10.1088/0004-637X/705/1/624
- Edge (2001) Edge, A. C. 2001, MNRAS, 328, 762. doi:10.1046/j.1365-8711.2001.04802.x
- David et al. (2014) David, L. P., Lim, J., Forman, W., et al. 2014, ApJ, 792, 94. doi:10.1088/0004-637X/792/2/94
- Fabian (1994) Fabian, A. C. 1994, ARA&A, 32, 277. doi:10.1146/annurev.aa.32.090194.001425
- Fabian (2012) Fabian, A. C. 2012, ARA&A, 50, 455. doi:10.1146/annurev-astro-081811-125521
- Falkendal et al. (2019) Falkendal, T., De Breuck, C., Lehnert, M. D., et al. 2019, A&A, 621, A27. doi:10.1051/0004-6361/201732485
- Feigelson & Berg (1983) Feigelson, E. D. & Berg, C. J. 1983, ApJ, 269, 400. doi:10.1086/161051
- Fogarty et al. (2019) Fogarty, K., Postman, M., Li, Y., et al. 2019, ApJ, 879, 103. doi:10.3847/1538-4357/ab22a4
- Fouque et al. (1992) Fouque, P., Durand, N., Bottinelli, L., Gouguenheim, L., & Paturel, G. 1992, Catalogue of Optical Radial Velocities (Meudon: Observatoire de Paris-Meudon), Vol. 1, 1
- Fujita et al. (2022) Fujita, Y., Kawakatu, N., & Nagai, H. 2022, ApJ, 924, 24. doi:10.3847/1538-4357/ac31a6
- Fujita et al. (2016) Fujita, Y., Kawakatu, N., & Shlosman, I. 2016, PASJ, 68, 26. doi:10.1093/pasj/psw012
- Gaspari et al. (2017) Gaspari, M., Temi, P., & Brighenti, F. 2017, MNRAS, 466, 677. doi:10.1093/mnras/stw3108
- Izumi et al. (2016) Izumi, T., Kawakatu, N., & Kohno, K. 2016, ApJ, 827, 81. doi:10.3847/0004-637X/827/1/81
- Kameno et al. (2020) Kameno, S., Sawada-Satoh, S., Impellizzeri, C. M. V., et al. 2020, ApJ, 895, 73. doi:10.3847/1538-4357/ab8bd6
- Kawamuro et al. (2022) Kawamuro, T., Ricci, C., Imanishi, M., et al. 2022, ApJ, 938, 87. doi:10.3847/1538-4357/ac8794
- Kuehr et al. (1981) Kuehr, H., Witzel, A., Pauliny-Toth, I. I. K., et al. 1981, A&AS, 45, 367
- Main et al. (2017) Main, R. A., McNamara, B. R., Nulsen, P. E. J., et al. 2017, MNRAS, 464, 4360. doi:10.1093/mnras/stw2644
- McNamara & Nulsen (2007) McNamara, B. R. & Nulsen, P. E. J. 2007, ARA&A, 45, 117. doi:10.1146/annurev.astro.45.051806.110625
- McNamara et al. (2014) McNamara, B. R., Russell, H. R., Nulsen, P. E. J., et al. 2014, ApJ, 785, 44. doi:10.1088/0004-637X/785/1/44
- McMullin et al. (2007) McMullin, J. P., Waters, B., Schiebel, D., et al. 2007, Astronomical Data Analysis Software and Systems XVI, 376, 127
- Nagai et al. (2019) Nagai, H., Onishi, K., Kawakatu, N., et al. 2019, ApJ, 883, 193. doi:10.3847/1538-4357/ab3e6e
- Ogando et al. (2008) Ogando, R. L. C., Maia, M. A. G., Pellegrini, P. S., et al. 2008, AJ, 135, 2424. doi:10.1088/0004-6256/135/6/2424
- Olivares et al. (2019) Olivares, V., Salome, P., Combes, F., et al. 2019, A&A, 631, A22. doi:10.1051/0004-6361/201935350
- Pizzolato & Soker (2010) Pizzolato, F. & Soker, N. 2010, MNRAS, 408, 961. doi:10.1111/j.1365-2966.2010.17156.x
- Pringle (1981) Pringle, J. E. 1981, ARA&A, 19, 137. doi:10.1146/annurev.aa.19.090181.001033
- Pulido et al. (2018) Pulido, F. A., McNamara, B. R., Edge, A. C., et al. 2018, ApJ, 853, 177. doi:10.3847/1538-4357/aaa54b
- Rafferty et al. (2008) Rafferty, D. A., McNamara, B. R., & Nulsen, P. E. J. 2008, ApJ, 687, 899. doi:10.1086/591240
- Rafferty et al. (2006) Rafferty, D. A., McNamara, B. R., Nulsen, P. E. J., et al. 2006, ApJ, 652, 216. doi:10.1086/507672
- Rose et al. (2019) Rose, T., Edge, A. C., Combes, F., et al. 2019, MNRAS, 485, 229. doi:10.1093/mnras/stz406
- Russell et al. (2013) Russell, H. R., McNamara, B. R., Edge, A. C., et al. 2013, MNRAS, 432, 530. doi:10.1093/mnras/stt490
- Russell et al. (2019) Russell, H. R., McNamara, B. R., Fabian, A. C., et al. 2019, MNRAS, 490, 3025. doi:10.1093/mnras/stz2719
- Salomé & Combes (2003) Salomé, P. & Combes, F. 2003, A&A, 412, 657. doi:10.1051/0004-6361:20031438
- Sanderson et al. (2009) Sanderson, A. J. R., Edge, A. C., & Smith, G. P. 2009, MNRAS, 398, 1698. doi:10.1111/j.1365-2966.2009.15214.x
- Salomé & Combes (2003) Salomé, P. & Combes, F. 2003, A&A, 412, 657. doi:10.1051/0004-6361:20031438
- Shakura & Sunyaev (1973) Shakura, N. I. & Sunyaev, R. A. 1973, A&A, 24, 337
- Shapiro & Teukolsky (1983) Shapiro, S. L. & Teukolsky, S. A. 1983, A Wiley-Interscience Publication, New York: Wiley, 1983
- Simionescu et al. (2018) Simionescu, A., Tremblay, G., Werner, N., et al. 2018, MNRAS, 475, 3004. doi:10.1093/mnras/sty047
- Ubertosi et al. (2023) Ubertosi, F., Gitti, M., Brighenti, F., et al. 2023, arXiv:2303.04821. doi:10.48550/arXiv.2303.04821
- Vantyghem et al. (2017) Vantyghem, A. N., McNamara, B. R., Edge, A. C., et al. 2017, ApJ, 848, 101. doi:10.3847/1538-4357/aa8fd0
- Xie et al. (1995) Xie, T., Allen, M., & Langer, W. D. 1995, ApJ, 440, 674. doi:10.1086/175305
- Zaw et al. (2019) Zaw, I., Chen, Y.-P., & Farrar, G. R. 2019, ApJ, 872, 134. doi:10.3847/1538-4357/aaffaf