equ[Equation][]
HaptiX: Vibrotactile Haptic Feedback for Communication of
3D Directional Cues
Abstract.
In Human-Computer-Interaction, vibrotactile haptic feedback offers the advantage of being independent of any visual perception of the environment. Most importantly, the user’s field of view is not obscured by user interface elements, and the visual sense is not unnecessarily strained. This is especially advantageous when the visual channel is already busy, or the visual sense is limited. We developed three design variants based on different vibrotactile illusions to communicate 3D directional cues. In particular, we explored two variants based on the vibrotactile illusion of the cutaneous rabbit and one based on apparent vibrotactile motion. To communicate gradient information, we combined these with pulse-based and intensity-based mapping. A subsequent study showed that the pulse-based variants based on the vibrotactile illusion of the cutaneous rabbit are suitable for communicating both directional and gradient characteristics. The results further show that a representation of 3D directions via vibrations can be effective and beneficial.
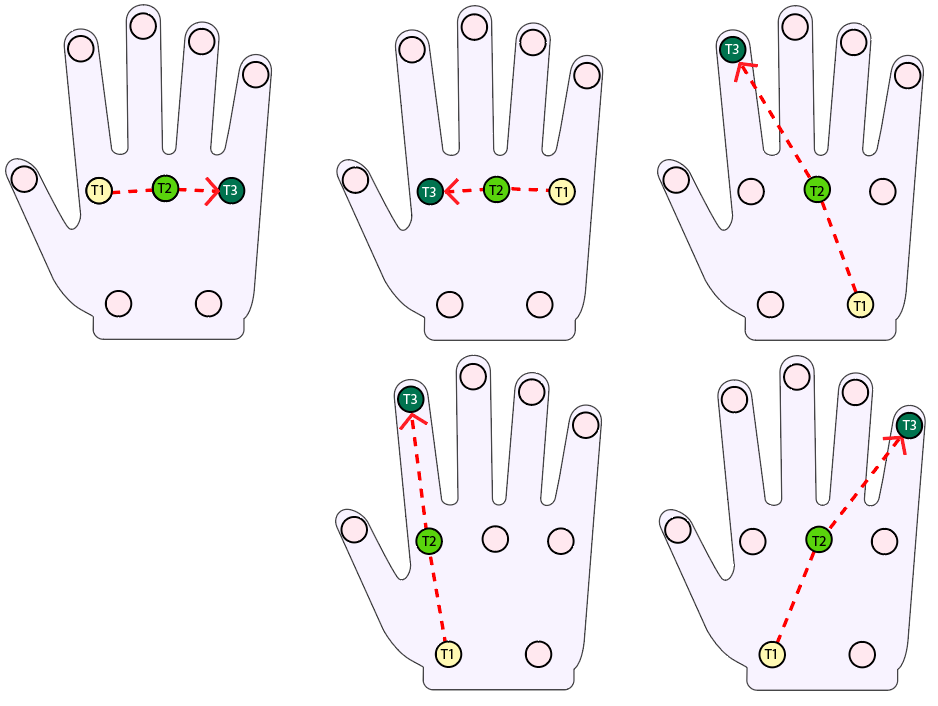
An overview of the gradient coding for the three conditions (three figures in a row). All figures consist of a hand, palm facing downward in a diagram t (Pulses over the duration t) over y (Intensity level S1 – S7). A orange arrow from (0,0) toward the tip of the finger represents the gradient of the directional cue with an intended increase over time. Figure 1a: Rabbit Single: The actuator T1 has two, T2 four, and T3 six pulses, all with the same intensity. Figure 1b: Rabbit Dual: The actuator T1 has two pulses with the intensity S1, T2 four pulses with the intensity S3, and T3 six pulses with the intensity S6. Figure 1c: Motion Intensity: The actuator T1 starts at t = 0 with the intensity S1 and the duration is a third of the whole diagram, overlapping with the actuator T2. The actuator T2 starts with the intensity S4 after a third of the whole time axis in the diagram and the duration is a third of the whole diagram, overlapping with the actuator T3. The actuator T3 starts with the intensity S6 in the last third of the whole time axis in the diagram and the duration is a third of the whole diagram.
1. Introduction
People perceive objects in their environment primarily through their sense of sight. However, this ability can be reduced or not possible at all in certain situations. Objects might be covered by other things / user interface (UI) elements (visual clutter) or be outside the human field of view. In addition, visual perception may be limited or impossible due to visual impairments. Previous research has shown that the haptic modality can, to some extent, compensate for the lack of visual information and outperform audio-based cues (Burke et al., 2006). It can also be applied in combination with other modalities and can offer an additional information channel if, for example, the visual channel is overloaded due to distracting information (Chen et al., 2018; Kaul and Rohs, 2016).
Directing attention, guiding, and transmitting patterns via vibrotactile signals have already been researched and found to be useful feedback modalities (Weber et al., 2011; Günther et al., 2018; Grushko et al., 2021). Barralon et al. studied pattern recognition using a vibrotactile belt with eight actuators and tasked participants to select the corresponding correct visual representation (Barralon et al., 2009). Lee and Starner proposed BuzzWear, a wearable tactile display with three vibration actuators for notification purposes that function by modulating intensity, pattern, direction, and starting point (Lee and Starner, 2010). After 40 minutes of training, subjects could distinguish between the 24 patterns with up to 99% accuracy. Vibrotactile feedback is also used in the context of guidance. Here, a study by Lehtinen et al., used a vibrotactile glove to support a visual search task on a flat plane on a wall (Lehtinen et al., 2012).
However, a common challenge is that tactile displays have a limited resolution. Therefore, researchers have simulated smooth movement patterns with the help of tactile illusions (Cholewiak and Collins, 2000), such as Phantom Sensations (Alles, 1970; Park and Choi, 2018), Apparent Tactile Motion (Burtt, 1917; Kirman, 1974; Sherrick and Rogers, 1966), and Cutaneous Rabbit (Geldard, 1975; McDaniel et al., 2011; Raisamo et al., 2009; Spelmezan et al., 2009). Tan et al. conducted a study using a 3 x 3 tactile display and applied the Cutaneous Rabbit sensation to explore the communication of eight 2D directional cues (north, northeast, east, southeast, south, southwest, west, and northwest) and the successful recognition of these cues (Tan et al., 2003).
While previous work focused on 2D directional cues (e.g., (Tan et al., 2003)) or allowed users to feel directions upon approach with their hand (e.g., (Grushko et al., 2021)), we are not aware of any work that aims to communicate 3D directional cues. In particular, our work differs from approaches such as (Günther et al., 2018), who aim to push or pull the hand toward a known target in 3D space but who therefore do not actually need to encode 3D information for the vibration pattern itself. It also differs from work such as (Wu et al., 2013) which used a Tactile Vision Substitution System (TVSS) to communicate 3D shapes of a static object by directly mapping image features such as contours on a 20 x 20 tactile display.
Our approach builds on the idea of Tan et al. (Tan et al., 2003) to communicate 2D directions. We combine their base with pulse or intensity mapping to simultaneously communicate the gradient. Furthermore, we explore the influences of different haptic illusions (i.e., Cutaneous Rabbit and Apparent Tactile Motion) on the comprehension of directional cues. Our work contributes three specific design proposals for communicating 3D directional cues as well as a study on the effectiveness and subjective experience of this non-visual approach to direction mapping.
2. Concept
Within the scope of our experiment, three variants were developed to map vibrotactile 3D directional cues. For the 2D direction, the vibrotactile illusions of the Cutaneous Rabbit and Apparent Tactile Motion were used. We extended these by a pulse- and intensity-based approach to communicating the gradient of the 3D directional cue (see Figure 1c).
2.1. Rabbit Single: Cutaneous Rabbit with Pulse-based Approach
This condition is based on the Cutaneous Rabbit for communicating 2D direction, a tactical illusion that can influence the design of vibrotactile patterns. This illusion was discovered in 1972 by Geldard (Geldard and Sherrick, 1972). The sequence of taps on different vibrotactile actuators is perceived as a continuous movement between the different points. Each directional cue is abstracted using three control points for the actuators (illustrated as dashed lines in 1c). Depending on the distance resulting from the gradient of the directional cue, the number of pulses triggered at each actuator is determined in a range of 1 – 7 with a Burst Duration (BD) of 125ms, an Inter-Stimulus Interval (ISI) between pulses of 50ms, and an Inter-Burst Interval (IBI) between actuators of 100ms. The closer the control point of the direction cue is to the hand, the higher the number of vibration pulses (see Figure 1a).
2.2. Rabbit Dual: Cutaneous Rabbit with a Pulse- and Intensity-based Combined Approach
Rabbit Dual is based on Rabbit Single but includes a second additional encoding for the gradient of the 3D directional cue. In addition to the number of pulses, we mapped three different intensity levels on the distance of the directional cue to the palm (see Figure 1b). We based the distinct intensity levels on prior work by Gescheider et al., who measured a just noticeable relative difference threshold – Just-Noticeable Difference (JND) – with values of 0.26 at 4 dB above the perceptual threshold (Gescheider et al., 1990). To communicate and distinguish between up- and downward gradients, three distinct intensity levels were selected - a baseline level in the middle and one low- as well as one high-intensity level. The anticipated benefit of this condition was that gradient comprehension would be improved due to the dual encoding.
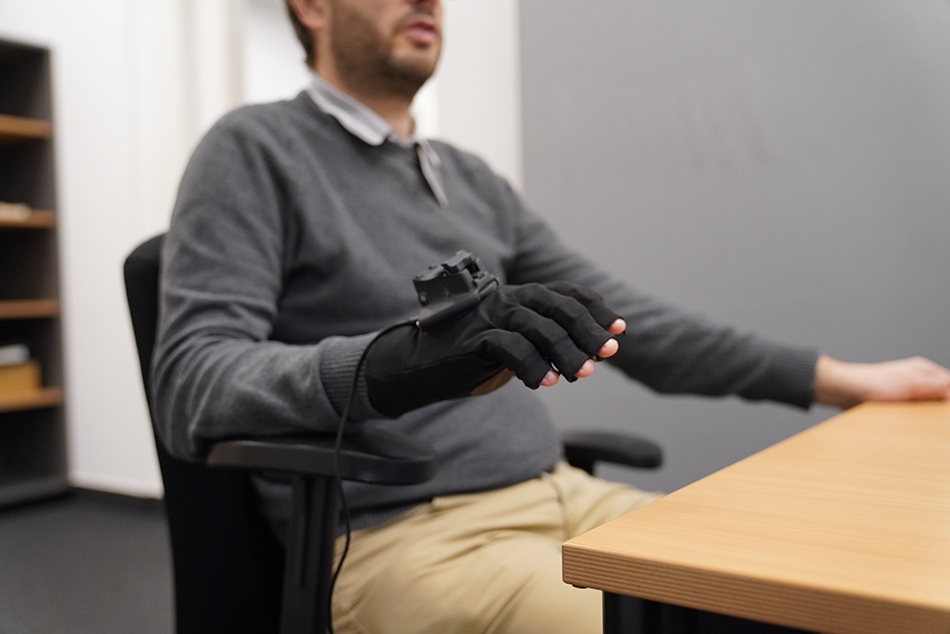
This figures illustrate the actuator placement, 2D directions, and study setup (three figures in a row). Figure 2a: A sketch of a hand with the placement of ten actuators – at each finger and thumb tip (five; V1 – V5), between index and middle finger, middle and ring finger, and ring and pinky finger (three; V6 – V8), and at the left and right bottom of the palm (two; V9 and V10). Figure 2b: Five sketches of the 2D directions with the chronologically activation of three actuators T1 – T3: left to right (V6 -¿ V7 -¿ V8), right to left (V8 -¿ V7 -¿ V6), diagonal rear-right to front-left (V10 -¿ V7 -¿ V2), straight forward (V9 -¿ V6 -¿ V2), and diagonal rear-left to front-right (V9 -¿ V7 -¿ V5). Figure 2c: Study setup: Participant is sitting on a chair in front of a table, wearing the glove on the right hand, resting the arm on the chair’s armrest and facing the palm downward.
2.3. Motion Intensity: Apparent Tactile Motion with Intensity-based Approach
This condition applied the same intensity mapping for the gradient as Rabbit Dual, but without the pulses. In contrast to the Cutaneous Rabbit sensation with distinct pulses as in Rabbit Single and Rabbit Dual, here we applied the vibrotactile illusion of Apparent Tactile Motion. This was first studied in the early 20th century by Burtt (Burtt, 1917) and is commonly referred to as the Phi Phenomenon. The illusion is created by an overlap in the start times of two actuators – Inter-Stimulus Onset Asynchrony (SOA), calculated as , where is the vibration period of an actuator – 450ms. Instead of two individual actuators, a single stimulus is perceived as moving from the position of the first triggered actuator T1 to the second actuator T2 – or from actuator T2 to T3 (see Figure 1c). A potential benefit of this illusion is that it may feel more like a natural movement, as it disguises the limited number of actuators. After pilot tests, a starting intensity value of 0.22 and a JND value of 0.3 were chosen, which made the intensity levels easily distinguishable. Thus, a total of seven possible intensity levels were defined.
2.4. Implementation
To develop our approach, we use the 3D game engine Unreal Engine 4 optimized for usage with a Meta Quest 2 Virtual Reality (VR) Head-Mounted Display (HMD). This allows for the use of a virtual environment in which the participants can concentrate purely on the haptic feedback without being visually distracted. It also provides a simple way to visually explain the directional cues to the participants and record their responses for rating scales. As a haptic display, we chose the SensorialXR glove as a commercially available device with Software Development Kit (SDK) interface to the Unreal Engine 4. With ten actuators – Linear Resonant Actuator (LRA) vibration motors, fixed in place – (see Figure 2a), SensorialXR gloves are among the models with the most vibration motors per hand. Thus, they offer the potential to map the 3D directional cues with the highest possible vibrotactile resolution (Rakkolainen et al., 2021).
3. Study
We conducted a within-subjects experiment with 14 participants to explore and understand the differences and similarities between the three presented designs for vibrotactile feedback (independent variable) regarding their effectiveness in communicating 3D directional cues. As participants were supposed to feel and comprehend directional cues without any additional visual feedback, we conducted the study in person and within a neutral VR environment, which allowed participants to focus entirely on the vibrotactile feedback. The age of participants ranged from 21 to 31 years, with a mean age of 25.71 years (). Four were female, ten were male, and all were university students of various subjects. None of the participants reported any visual impairment, and all were right-handed.
3.1. Procedure
The study was conducted in multiple comparable physical localities. Before commencing, participants were fully informed about the project objective and the various tasks they had to complete. Each participant gave their full and informed consent to partake in the study, have video and audio recordings taken, and have all the relevant data documented. Participants wore a HMD on their head and a vibrotactile glove on the right hand while being asked to keep their right arm rested on an armrest with the palm facing down (see Figure 2c) to avoid any external factors. In the left hand, participants held a controller to control the VR environment.
For each condition, each participant performed six training trials. For each trial, the vibrotactile feedback was repeated three times, and a corresponding visualization was shown to indicate the direction in 3D supporting the participant’s mental model. For the actual task, participants were shown a neutral-colored background in VR without any visual representations of the 3D direction. Participants were able to trigger the start of the trial with the VR motion controller. In total, they completed 30 measured trials per condition, resulting in 90 measured trials per participant and 1,260 measured trials in total. The 30 trials consisted of 2 (blocks) x 5 (2D direction) x 3 (gradient). The variable 2D direction represented a typical set of five possible mappings of straight horizontal, vertical and diagonal directions, which were physically located on the surface of the hand (see Figure 2b). They represented the direction in x-z-coordinates of the overall 3D directional vector. The gradient encoded the direction in y-coordinates: either up, down, or neither any gradient. To counter learning and fatigue effects, we applied a Balanced Latin Square design for the order of the three conditions. The order of trials was randomized within each block. Between each condition, participants were able to rest their hand for five minutes. The average session lasted for 45 minutes and concluded with a debriefing. Non of the participants mentioned any sensory or muscle fatigue. Participants received 15 EUR in compensation.
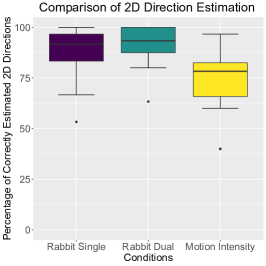
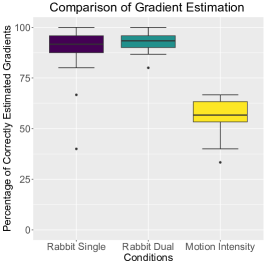
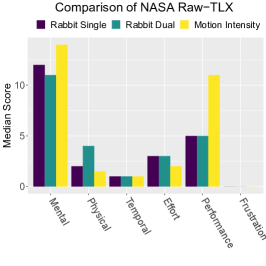
Three figures in a row, illustrating the results of ”Comparison of 2D Direction Estimation” (boxplot), ”Comparison of Gradient Estimation” (boxplot), and ”Comparison of NASA Raw-TLX” (bar graph) for each condition. Figure 3a: Comparison of 2D Direction Estimation (boxplot): Rabbit Dual=93.3% (IQR=12.5%), Rabbit Single=91.7% (IQR=13.3%), and Motion Intensity=78.3% (IQR=16.7%). Figure 3b: Comparison of Gradient Estimation (boxplot): Rabbit Dual=93.3% (IQR=5.8%), Rabbit Single=91.7% (IQR=8.3%), and Motion Intensity=56.7% (IQR=10.0%). Figure 3c: Comparison of NASA Raw-TLX for the sub-scores Mental, Physical, Temporal, Effort, Performance, and Frustration (bar graph).
3.2. Variables and Research Questions
For dependent variables, we measured the accuracy of the comprehension of the 2D direction (x-axis, z-axis) and the gradient (y-axis). We are measuring the two variables (2D direction and gradient) separately, as commonly done within the research community (e.g., estimation of direction and distance for HMDs (Gruenefeld et al., 2017)). The main reasoning here is that orientation in 3D space and especially describing directions in 3D can be challenging for participants and could negatively affect the validity of the measurements. To do so, we presented participants with a UI panel in VR after each trial. The panel showed five pictures with all 2D directions in a top-down view and, subsequently, three pictures of all gradients in a lateral view. Participants used the VR controller to select the fitting representation for each. These two variables were measured with a binary outcome (correct, incorrect) and summarized as percentages of correctly identified outcomes across all trials per person and condition (ratio scale). In addition, we measured mental workload after each condition via the NASA Raw-Task Load Index (NASA RTLX) (Hart and Staveland, 1988) and additional Likert-scale statements regarding the comprehensibility of the directional cue. We also collected qualitative feedback in a semi-structured interview after each condition as well as at the end of the study, which is when we also asked participants to rank the three conditions.
As the study is exploratory in nature, we were interested in finding out more about the specific features of our three feedback conditions. In particular, we were interested in the following research questions:
RQ1: Do multiple encodings of gradient, as in the condition Rabbit Dual, improve the comprehension of gradient information and reduce mental workload?
RQ2: Does apparent movement, as in the condition Motion Intensity, improve comprehension of 2D direction? We assume that to be the case as the transition by overlapping of vibration between the actuators may be easier to comprehend and interpret as a path compared to the sensation of isolated pulses as for the Rabbit conditions.
RQ3: How would participants experience and rate vibrotactile communication of 3D direction overall and with regard to each individual condition?
4. Results
For our applied inferential statistics, we distinguished between ratio and ordinal data. The estimation percentages for 2D direction and gradient are ratio data, while the Likert items – including task load – are ordinal data. For ratio data only, we first applied a Shapiro-Wilk test to check for normality. We found that none of our ratio data is normally distributed. Thus, we treated all our data in the same way and directly applied non-parametric tests, specifically Friedman tests. Thereafter, we conducted Wilcoxon Signed-rank tests with Bonferroni correction for our post-hoc analysis. The effect sizes of the Wilcoxon tests are reported as r (r: 0.1 small, 0.3 medium, and 0.5 large effect).
4.1. Estimation of 2D Direction
We asked participants to estimate the two-dimensional direction on a ground plane. The median (interquartile range) percentages of correct 2D direction estimations for each condition are (in descending order): Rabbit Dual =93.3% (IQR=12.5%), Rabbit Single =91.7% (IQR=13.3%), and Motion Intensity =78.3% (IQR=16.7%). All percentages are compared in Figure 3a. Since our data is not normally distributed (p0.01), we directly ran a Friedman test that revealed a significant effect of condition on 2D direction estimation ((2)=17.70, p0.001, N=14). Post-hoc tests showed significant differences between Rabbit Single and Motion Intensity (W=83, Z=2.62, p0.018, r=0.50) as well as Rabbit Dual and Motion Intensity (W=0, Z=-3.30, p0.001, r=0.62). However, we did not find a significant difference between Rabbit Single and Rabbit Dual (W=15, Z=-1.88, p0.182). Here, we can conclude that both Rabbit Single and Rabbit Dual result in better estimation performance for 2D direction than Motion Intensity.
| Rabbit Single vs. Dual | Rabbit Single vs. Motion Intensity | Rabbit Dual vs. Motion Intensity | ||||||
| Statement | test statistic | p-value | test statistic | p-value | effect size | test statistic | p-value | effect size |
| S1 | Z= 0.00 | p=1.000 | Z=2.89 | p<.001*** | r=0.55 | Z=3.04 | p=.004** | r=0.57 |
| S2 | Z=-0.07 | p=1.000 | Z=2.58 | p=.029* | r=0.49 | Z=2.80 | p=.013* | r=0.53 |
| S3 | Z=-1.17 | p=0.838 | Z=3.06 | p=.003** | r=0.58 | Z=2.97 | p=.003** | r=0.56 |
| S4 | Z=-0.17 | p=1.000 | Z=2.84 | p=.006** | r=0.54 | Z=2.69 | p=.018* | r=0.51 |
4.2. Estimation of Gradient
We asked participants to estimate the gradient behavior of the communicated cue. The median (interquartile range) percentages of correct gradient estimations for each condition are (in descending order): Rabbit Dual =93.3% (IQR=5.8%), Rabbit Single =91.7% (IQR=8.3%), and Motion Intensity =56.7% (IQR=10.0%). All percentages are compared in Figure 3b. Since our data is not normally distributed (p0.001), we ran a Friedman test that revealed a significant effect of condition on gradient estimation ((2)=19.00, p0.001, N=14). Post-hoc tests showed significant differences between Rabbit Single and Motion Intensity (W=102, Z=3.11, p0.002, r=0.59) as well as Rabbit Dual and Motion Intensity (W=0, Z=-3.30, p0.001, r=0.62). However, we did not find a significant difference between Rabbit Single and Rabbit Dual (W=30, Z=-1.42, p0.501). Here, we can conclude that both Rabbit Single and Rabbit Dual result in better gradient estimation performance than Motion Intensity.
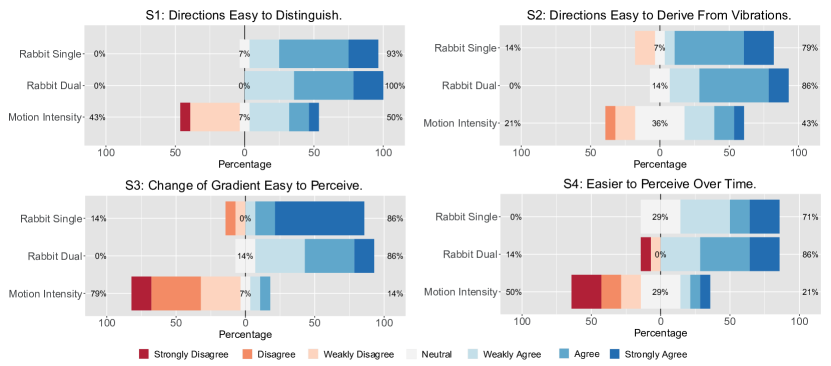
The results (four figures in two rows with two figures per row) of the participant’ statements ”Directions Easy to Distinguish”, ”Directions Easy to Derive From Vibration”, ”Change of Gradient Easy to Perceive”, and ”Easier to Perceive Over Time”, visualized in a stacked bar plot for Likert items.
4.3. Task Load
The results of task load ratings as measured by the NASA RTLX (Hart and Staveland, 1988) are shown in Figure 3c. The median (interquartile range) task load scores for each condition are (in ascending order): Rabbit Single =22.5 (IQR=12.7), Rabbit Dual =24.5 (IQR=7.9), and Motion Intensity =28.3 (IQR=20.0). We ran a Friedman test that revealed a significant effect of condition on task load ((2)=13.50, p0.001, N=14). Post-hoc tests showed a significant difference between Rabbit Dual and Motion Intensity (W=105, Z=3.30, p0.001, r=0.62). However, we did not find any significant differences between Rabbit Single and Rabbit Dual (W=39, Z=0.00, p1.000) or between Rabbit Single and Motion Intensity (W=20, Z=-2.04, p=0.120). Here, we can conclude that Rabbit Dual induces a lower task load than Motion Intensity.
4.4. Individual Statements and Preferences
After each condition, we asked participants to rate four statements, each on a 7-point Likert scale (1=strongly disagree, 7=strongly agree). The results and statements are shown in Figure 4. We found significant main effects for all four statements (N=14; S1: (2)=14.09, p0.001; S2: (2)=11.35, p0.003; S3: (2)=17.08, p0.001; S4:(2)=12.79, p0.002). Pairwise comparisons are shown in Table 1. Here, we can conclude that Rabbit Single and Rabbit Dual are rated significantly more positively than Motion Intensity for all four statements. No difference was found between Rabbit Single and Rabbit Dual. Regarding overall preference, eight participants preferred Rabbit Dual, while six voted for Rabbit Single as their favorite. None of the participants preferred Motion Intensity.
4.5. Interviews
During the interviews, participants were explicitly asked to comment on the duration of the vibration as well as what may have eased or hindered their comprehension. They also had to explain their overall preference and comment on the overall experience and sensation of interpreting 3D directional cues via vibrotactile feedback. For the analysis, the verbal data was first transcribed by one author and then summarized. The statements were then counted for each question. In addition, across all questions, we applied open coding to identify hidden themes. Data from one interview (P2) was not recorded due to a technical issue. Therefore, only the data from 13 participants was included.
Regarding the duration of the vibration, both Rabbit conditions were perceived as having adequate duration (Rabbit Single: 10 vs 3 who thought it could have been longer; Rabbit Dual: 13:0), while 10 participants would have preferred a longer duration for Motion Intensity. For the latter, participants struggled to feel the gradient correctly, as mentioned by five participants (e.g., P7 said that the “[duration was] a little bit short, enough for [2D] direction, but for intensity [gradient] it was really bad.”) The varying strength of the vibration was also an issue, as the most distant control point was criticized as having a too weak vibration, which meant that “some vibrations got lost” (P5). This also interfered with the comprehension of 2D direction. The smooth transition of movement in Motion Intensity was still found to be a pleasant experience, but the mentioned drawbacks regarding the gradient detection prevailed, according to P4 (RQ2). When comparing pulse with intensity for the mapping of gradient, P12 noted an interesting further advantage of pulse, as “One could decide about the gradient in retrospect even if one wasn’t sure before. When the last actuator vibrated many times, then it must have been an upwards gradient.” This also implicitly highlights the problem of immediacy, which required attention and did not allow repetition of the feedback. As P10 put it, “in case you did not fully pay attention, there wasn’t a repeat to make sure.” This sentiment was echoed by P12. Consequently, the dual encoding of a gradient in the Rabbit Dual condition was cited by most as the main reason for preferring that condition (RQ1). P11 noted, “I did not just have the number of pulses, but in addition the intensity and that somehow better stuck in my head.”
5. Discussion
Overall, responses during the interview and the quantitative data are in agreement. They show significant and substantial advantages of Rabbit Single and Rabbit Dual compared to Motion Intensity, which we did not expect in such clarity. The parity between these two then is again visible from all angles, with preference being nearly balanced (8 vs. 6). Still, the interviews showed that for Motion Intensity, participants did like the smooth transition between the individual feedback factors, which however failed to have a measurable advantage (RQ2). A main reason for this may be that we found that the mechanisms to communicate 2D direction and gradient can interfere with one another. In particular, the intensity gradient mapping had a negative effect on the 2D direction mapping in Motion Intensity, as the minimum vibration sometimes “got lost” (P5), when users did not pay close attention. While pre-tests suggested otherwise, individual differences among the perception of our participants as well as potential fitting issues with the glove (see limitations below) may have resulted in this issue. From the comments of participants, we have to assume that Rabbit Dual was affected by this problem as well, although to a lesser degree; the simultaneous pulse mapping implicitly included repeated vibrations of the same actuator at least twice.
Our analysis also showed that the type of feedback may require more training for participants to get accustomed to. P13 summarized this point nicely: “Maybe if you market that […] and someone develops a game for it […], then I might like it, and in a year, no one can imagine a world without it.” Others noted the effort involved, with P10 saying they “found that it was really exhausting since you are not used to it.” Still, the overall experience of using vibrotactile feedback to interpret 3D directional cues was described as “surprisingly good” (P7) and prompted many ideas for use cases, such as medical scenarios (operating table with limited visuals), people with visual impairments in daily life as well as when driving a bike or motorcycle.
Limitations: As an exploratory study, our results should be perceived as preliminary and require further testing and confirmation. In particular, our results may be limited due to the number of participants (14), which also led to the design not being fully balanced. In addition, all participants in our study were right-handed, which could affect our results. We also found that more training may be required to compensate for initial learning effects, as the type of feedback is so unusual and novel for participants. In addition, the SensorialXR glove only provides a fixed setting of the actuators and offers a “one-size-fits-all” size, which showed to be problematic for some users with smaller hands, where the actuators were not always in tight contact with the skin. For future research prototypes adding additional Velcro around the actuators might help.
6. Conclusion
This work aimed to explore different design approaches to communicate three-dimensional directional cues with vibrotactile feedback. We developed two conditions based on the Cutaneous Rabbit illusion and one based on Apparent Tactile Motion to communicate 2D direction. The gradient of the overall 3D direction was then encoded by the number of discrete vibration pulses, the vibration intensity, or a combination of both. Our study showed that three-dimensional directional cues can be communicated by Rabbit Single and Rabbit Dual with a high success rate for both the 2D direction and gradient (median for Rabbit Single: 91.7%, Rabbit Dual: 93.3%) – significantly better compared to Motion Intensity. With respect to our research questions, we found partial evidence for RQ1, as multiple participants specifically mentioned the dual mapping for gradient as a benefit. Still, for the quantitative data, both Rabbit conditions performed more or less identical. RQ2 has to be dismissed at this point. However, as revealed by our qualitative analysis, we believe that the Apparent Tactile Motion illusion can also be a viable option for future designs, as the smooth transition between actuators was appreciated by participants. The challenge will lie in overcoming the inferences we found between 2D directional and gradient intensity mapping.
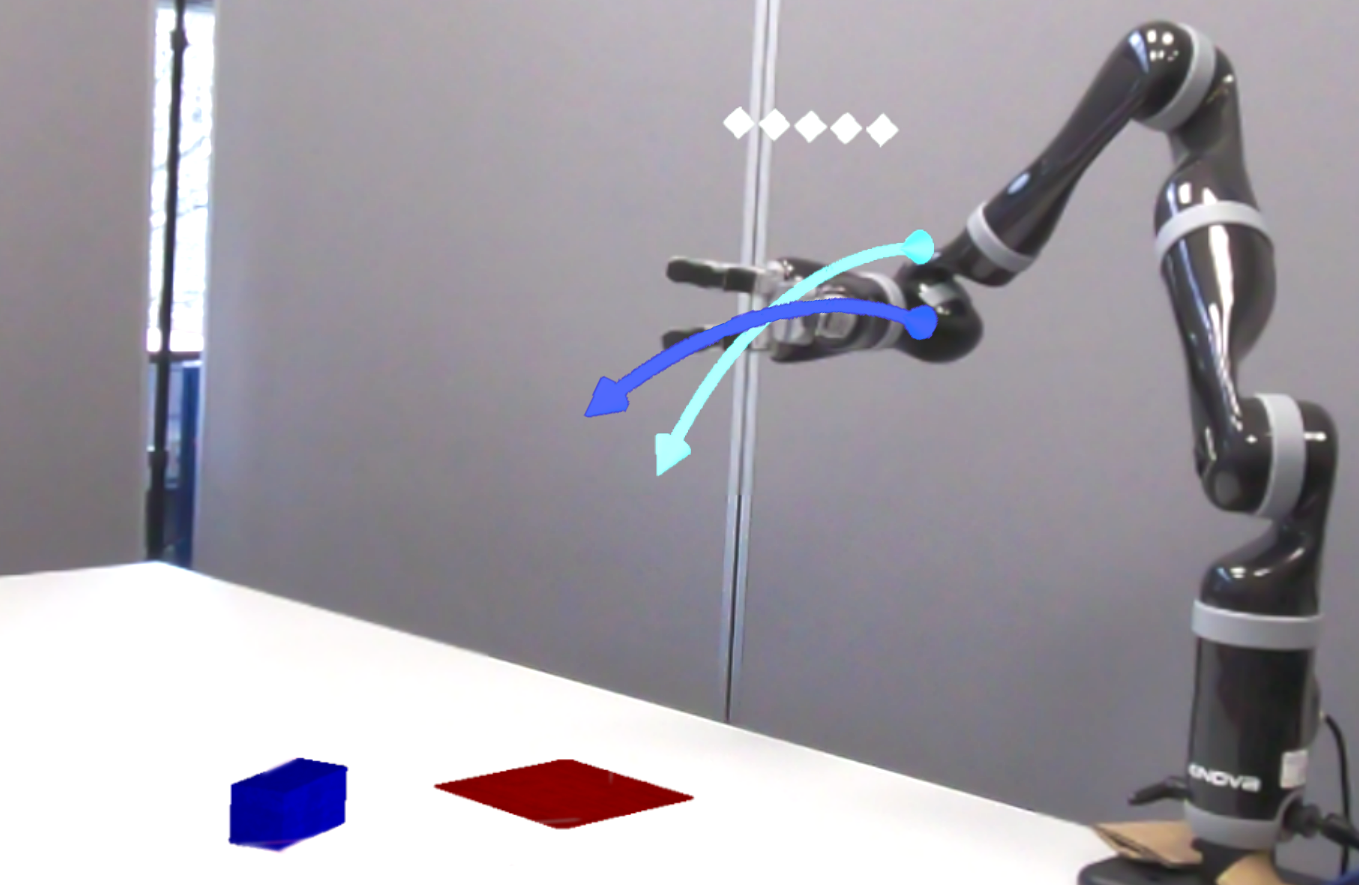
An overview of a human-robot interaction scenario for future work. A robotic arm (Kinova Jaco) is mounted on a table. The robot is trying to grasp a blue object, and a visual cue (blue arrow) illustrates the intended movement direction toward the object. A cyan arrow points more down toward the table surface, missing the object.
Future Research: In our work, we aim to apply this approach to communicate the intended movements (Pascher et al., 2023) of a semi-autonomous robot in collaborative scenarios, where vision alone may not be sufficient to successfully predict robot motion. In Figure 5 an assistive robot arm is illustrated, which is manually controlled by the user but is supported through an Artificial Intelligence (AI) which provides real time directional movement recommendations. Here, our approach could be used to map these directional movement recommendations as vibration input on the hand. Changes in the intensity of the actuators indicate the amount of directional change, thus enabling the user to better imagine the generated trajectory. We also encourage researchers to both replicate our design and study and apply it to different use cases. Future research should also investigate variables such as the effect of higher-resolution tactile displays, different setting of actuators, or other approaches to encode gradient (e.g. through different vibration frequencies, varying linear and non-linear intensity levels), which were not possible with the SensorialXR technology. Furthermore, results of our study should also be evaluated with participants with a dominant left hand or their non-dominant hand.
References
- (1)
- Alles (1970) David S. Alles. 1970. Information Transmission by Phantom Sensations. IEEE Transactions on Man-Machine Systems 11, 1 (1970), 85–91. https://doi.org/10.1109/TMMS.1970.299967
- Barralon et al. (2009) Pierre Barralon, Ginna Ng, Guy A. Dumont, Stephan K. W. Schwarz, and J. Mark Ansermino. 2009. Design of Rhythm-Based Vibrotactile Stimuli Around the Waist: Evaluation of Two Encoding Parameters. IEEE Transactions on Systems, Man, and Cybernetics - Part A: Systems and Humans 39, 5 (2009), 1062–1073. https://doi.org/10.1109/TSMCA.2009.2025026
- Burke et al. (2006) Jennifer L. Burke, Matthew S. Prewett, Ashley A. Gray, Liuquin Yang, Frederick R.B. Stilson, Michael D. Coovert, Linda R. Elliot, and Elizabeth Redden. 2006. Comparing the effects of visual-auditory and visual-tactile feedback on user performance: A meta-analysis. In ICMI’06 (ICMI’06: 8th International Conference on Multimodal Interfaces, Conference Proceeding). 108–117. https://doi.org/10.1145/1180995.1181017 null ; Conference date: 02-11-2006 Through 04-11-2006.
- Burtt (1917) Harold Ernest Burtt. 1917. Tactual illusions of movement. Journal of Experimental Psychology 2 (10 1917), 371–385.
- Chen et al. (2018) Taizhou Chen, Yi-Shiun Wu, and Kening Zhu. 2018. Investigating Different Modalities of Directional Cues for Multi-Task Visual-Searching Scenario in Virtual Reality. In Proceedings of the 24th ACM Symposium on Virtual Reality Software and Technology (Tokyo, Japan) (VRST ’18). Association for Computing Machinery, New York, NY, USA, Article 41, 5 pages. https://doi.org/10.1145/3281505.3281516
- Cholewiak and Collins (2000) R. W. Cholewiak and A. A. Collins. 2000. The generation of vibrotactile patterns on a linear array: influences of body site, time, and presentation mode. Perception & Psychophysics 62, 6 (2000), 1220–1235. https://doi.org/10.3758/bf03212124
- Geldard (1975) Frank A. Geldard. 1975. Sensory saltation : metastability in the perceptual world / Frank A. Geldard. Lawrence Erlbaum Associates ; distributed by the Halsted Press Division of Wiley Hillsdale, N.J. : New York. 133 p. : pages.
- Geldard and Sherrick (1972) Frank A. Geldard and Carl E. Sherrick. 1972. The Cutaneous ”Rabbit”: A Perceptual Illusion. Science 178, 4057 (1972), 178–179. https://doi.org/10.1126/science.178.4057.178 arXiv:https://www.science.org/doi/pdf/10.1126/science.178.4057.178
- Gescheider et al. (1990) George A. Gescheider, Stanley J. Bolanowski, Ronald T. Verrillo, D J Arpajian, and T F Ryan. 1990. Vibrotactile intensity discrimination measured by three methods. The Journal of the Acoustical Society of America 87 1 (1990), 330–8.
- Gruenefeld et al. (2017) Uwe Gruenefeld, Dag Ennenga, Abdallah El Ali, Wilko Heuten, and Susanne Boll. 2017. EyeSee360. In Proceedings of the 5th Symposium on Spatial User Interaction. ACM. https://doi.org/10.1145/3131277.3132175
- Grushko et al. (2021) Stefan Grushko, Aleš Vysocký, Dominik Heczko, and Zdenko Bobovský. 2021. Intuitive Spatial Tactile Feedback for Better Awareness about Robot Trajectory during Human-Robot Collaboration. Sensors (Basel, Switzerland) 21, 17 (2021). https://doi.org/10.3390/s21175748
- Günther et al. (2018) Sebastian Günther, Florian Müller, Markus Funk, Jan Kirchner, Niloofar Dezfuli, and Max Mühlhäuser. 2018. TactileGlove: TactileGlove: Assistive Spatial Guidance in 3D Space through Vibrotactile Navigation. In Proceedings of the 11th PErvasive Technologies Related to Assistive Environments Conference. ACM, New York, NY, USA, 273–280. https://doi.org/10.1145/3197768.3197785
- Hart and Staveland (1988) Sandra G. Hart and Lowell E. Staveland. 1988. Development of NASA-TLX (Task Load Index): Results of Empirical and Theoretical Research. In Advances in Psychology. Elsevier, Amsterdam, The Netherlands, 139–183. https://doi.org/10.1016/s0166-4115(08)62386-9
- Kaul and Rohs (2016) Oliver Beren Kaul and Michael Rohs. 2016. HapticHead: 3D Guidance and Target Acquisition through a Vibrotactile Grid. Proceedings of the 2016 CHI Conference Extended Abstracts on Human Factors in Computing Systems (2016).
- Kirman (1974) Jacob H. Kirman. 1974. Tactile apparent movement: The effects of interstimulus onset interval and stimulus duration. Perception & Psychophysics 15, 1 (1974), 1–6. https://doi.org/10.3758/BF03205819
- Lee and Starner (2010) Seungyon Claire Lee and Thad Starner. 2010. BuzzWear: Alert Perception in Wearable Tactile Displays on the Wrist. In Proceedings of the SIGCHI Conference on Human Factors in Computing Systems (Atlanta, Georgia, USA) (CHI ’10). Association for Computing Machinery, New York, NY, USA, 433–442. https://doi.org/10.1145/1753326.1753392
- Lehtinen et al. (2012) Ville Lehtinen, Antti Oulasvirta, Antti Salovaara, and Petteri Nurmi. 2012. Dynamic Tactile Guidance for Visual Search Tasks. Association for Computing Machinery, New York, NY, USA, 445–452. https://doi.org/10.1145/2380116.2380173
- McDaniel et al. (2011) Troy McDaniel, Morris Goldberg, Daniel Villanueva, Lakshmie Narayan Viswanathan, and Sethuraman Panchanathan. 2011. Motor learning using a kinematic-vibrotactile mapping targeting fundamental movements. In Proceedings of the 19th ACM international conference on Multimedia. ACM.
- Park and Choi (2018) Gunhyuk Park and Seungmoon Choi. 2018. Tactile Information Transmission by 2D Stationary Phantom Sensations. In Proceedings of the 2018 CHI Conference on Human Factors in Computing Systems (Montreal QC, Canada) (CHI ’18). Association for Computing Machinery, New York, NY, USA, 1–12. https://doi.org/10.1145/3173574.3173832
- Pascher et al. (2023) Max Pascher, Uwe Gruenefeld, Stefan Schneegass, and Jens Gerken. 2023. How to Communicate Robot Motion Intent: A Scoping Review. In Proceedings of the 2023 CHI Conference on Human Factors in Computing Systems - CHI ’23. https://doi.org/10.1145/3544548.3580857
- Raisamo et al. (2009) Jukka Raisamo, Roope Raisamo, and Veikko Surakka. 2009. Evaluating the effect of temporal parameters for vibrotactile saltatory patterns. In Proceedings of the 2009 international conference on Multimodal interfaces. ACM. https://doi.org/10.1145/1647314.1647381
- Rakkolainen et al. (2021) Ismo Rakkolainen, Ahmed Farooq, Jari Kangas, Jaakko Hakulinen, Jussi Rantala, Markku Turunen, and Roope Raisamo. 2021. Technologies for Multimodal Interaction in Extended Reality - A Scoping Review. Multimodal Technologies and Interaction 5, 12 (2021). https://doi.org/10.3390/mti5120081
- Sherrick and Rogers (1966) Carl E. Sherrick and Ronald Rogers. 1966. Apparent haptic movement. Perception & Psychophysics 1 (1966), 175–180.
- Spelmezan et al. (2009) Daniel Spelmezan, Mareike Jacobs, Anke Hilgers, and Jan Borchers. 2009. Tactile Motion Instructions for Physical Activities. In Proceedings of the SIGCHI Conference on Human Factors in Computing Systems (Boston, MA, USA) (CHI ’09). Association for Computing Machinery, New York, NY, USA, 2243–2252. https://doi.org/10.1145/1518701.1519044
- Tan et al. (2003) Hong Z. Tan, Robert Gray, J. Jay Young, and Ryan Traylor. 2003. A Haptic Back Display for Attentional and Directional Cueing. Vol.3.No.1.,Haptics-e, 11-June-2003 (2003).
- Weber et al. (2011) B. Weber, S. Schatzle, T. Hulin, C. Preusche, and B. Deml. 2011. Evaluation of a vibrotactile feedback device for spatial guidance. In 2011 IEEE World Haptics Conference. IEEE, 349–354. https://doi.org/10.1109/WHC.2011.5945511
- Wu et al. (2013) Juan Wu, Yu Ding, Dejing Ni, Guangming Song, and Wei Liu. 2013. Vibrotactile Representation of Three-Dimensional Shape and Implementation on a Vibrotactile Pad. Sensors and Materials (2013), 79–97. https://doi.org/10.18494/sam.2013.855