2021
These authors contributed equally to this work.
These authors contributed equally to this work.
[1,2]\fnmChristian Marius \surLillelund https://orcid.org/0000-0002-2520-3774
1]\orgdivDepartment of Electrical and Computer Engineering, \orgnameAarhus University, \orgaddress\streetFinlandsgade 22, \postcodeDK-8200, \cityAarhus N, \countryDenmark
Computationally Efficient Labeling of Cancer Related Forum Posts by Non-Clinical Text Information Retrieval
Abstract
An abundance of information about cancer exists online, but categorizing and extracting useful information from it is difficult. Almost all research within healthcare data processing is concerned with formal clinical data, but there is valuable information in non-clinical data too. The present study combines methods within distributed computing, text retrieval, clustering, and classification into a coherent and computationally efficient system, that can clarify cancer patient trajectories based on non-clinical and freely available information. We produce a fully-functional prototype that can retrieve, cluster and present information about cancer trajectories from non-clinical forum posts. We evaluate three clustering algorithms (MR-DBSCAN, DBSCAN, and HDBSCAN) and compare them in terms of Adjusted Rand Index and total run time as a function of the number of posts retrieved and the neighborhood radius. Clustering results show that neighborhood radius has the most significant impact on clustering performance. For small values, the data set is split accordingly, but high values produce a large number of possible partitions and searching for the best partition is hereby time-consuming. With a proper estimated radius, MR-DBSCAN can cluster 50000 forum posts in 46.1 seconds, compared to DBSCAN (143.4) and HDBSCAN (282.3). We conduct an interview with the Danish Cancer Society and present our software prototype. The organization sees a potential in software that can democratize online information about cancer and foresee that such systems will be required in the future.
keywords:
Text retrieval, Clustering, Classification, Distributed computing1 Introduction
The three predominating types of diseases in today’s world are cancers, respiratory disorders, and cardiovascular diseases. These diseases entail a predictable trajectory for the patients, caretakers, and relatives, which can be summarized as jensen_2017_1 ; murray_2005_1 :
Each of the four sequential steps are however complex and encompass a range of concerns, for example life expectancy, patterns of decline, probable interactions with health related services, treatment plans, medical side effects, palliative care, and more. It is difficult, but important to clarify and communicate these complex trajectories to the patient, caretakers, and the relatives. Better informed individuals have better treatment outcomes due to proper disease management and democratized trajectories can lead to better clinical decisions being made, fewer side effects of treatments and fewer re-admissions. Improving the overall care can be done by estimating, clarifying and communicating patient-specific disease trajectories.
Relevant but unused information about diseases and continuity of care is freely available in online communities and forum posts. This information could benefit cancer patients, relatives, or caretakers. Approximately one third of the world’s population receive a cancer diagnosis during their lifetime kraeftens_bekaempelse . This creates a large field of potential users that would like to learn more about their diagnosis from others. A cancer diagnosis leads to many different reactions, but most tend to seek information online about the trajectory prognosis. A popular trend is to write and communicate on online forums about health issues Umefjord01042006 ; medical2016consulations . On such forums, people write freely on a given topic. On cancer forums, people usually write about their frustrations, experiences, emotions, feelings, and personal preferences regarding any cancer related topic. The established health care systems do not leverage all of this non-clinical information. Some of it may be of clinical relevance, and some only of personal relevance. However, both kinds of information can empower patients, caretakers and relatives by for example strengthening their understanding of a cancer diagnosis, build self-confidence, and establish online or physical communities.
The objective of this present study is to clarify and communicate cancer patient trajectories by information retrieval and subsequent clustering using three common techniques: MR-DBSCAN, DBSCAN, and HDBSCAN. The methods are evaluated on training sets of various sizes (5000 to 25000 posts) in terms of computational efficiency and Rand measure. To our knowledge, this study is the first to perform text retrieval, clustering and classification of cancer patient trajectories in non-clinical texts. The end result is a software prototype that can sift, filter and present cancer information in a visually appealing manner, as we demonstrate with a graphical user-inference. We als oconducted an interview with the Danish Cancer Society kraeftens_bekaempelse , who saw a great potential in the presented software prototype and stressed the importance of patient-empowerment. Currently, the digital adoption rate for elderly people in Europe and the US is generally low, but digital maturity is expected to increase in the coming years.
1.1 Related Work
Existing research with various objectives, methods and data backgrounds have been addressing the idea of mining data for clarifying and estimating disease trajectories; e.g., natural language processing has a transformative potential within this area (e.g. Wang2018 ; Luque2019 ; Simpson2012 ). In 2005, Murray et al. murray_2005_1 carried out a clinical review that describes three typical disease trajectories, namely: cancer, organ failure (heart and lung focus) and frail elderly (dementia focus) and in 2008 Meystre et al. Meystre2008 did a review on research within information extraction from clinical notes in narrative style. Studies have shown, that even for data normally viewed as highly distinct, e.g., lab records, a portion of relevant information may only be available as part of clinical text Demner-Fushman2009 . In a 2010 study, Ebadollahi et al. ebadollahi_2010_1 predict patient trajectories from temporal physiological data, and in a 2014 study by Jensen et al. jensen_2014_1 disease observations across a span of fifteen years from a large patient population were translated into disease trajectories. In 2016 Ji et al. ji_2016_1 developed prediction models for health condition trajectories and co-morbidity relationships based on social health records, and in 2017 Jensen et al. jensen_2017_1 conducted a text mining study on electronic health records in order to automatically identify cancer patient trajectories. In 2019 Assale et al. assale2019 reviewed and documented the potential of leveraging the unstructured content in electronic health records. In 2021 Nehme et al. Nehme2021 did a study on natural language processing in the domain of gastroenterology primarily focusing on structured text within endoscopy, inflammatory bowel disease, pancreaticobiliary, and liver diseases.
None of the above mentioned studies deal with text information retrieval, distributed clustering, and classification for identifying cancer patient trajectories from non-clinical texts, i.e. online forum posts.
Frunza et al. Frunza:2011:MLA did a related study in 2011; in their study, they automatically extract sentences from clinical papers about diseases and/or treatments. Based on the extracted sentences, semantic relations between diseases and associated treatments are then identified. Another related study was done by Rosario et al. Rosario:2004:CSR:1218955.1219010 in 2004. The focus of their work was to recognize text-entities containing information about diseases and treatments. They use Hidden Markov Models and Maximum Entropy Models to perform the entity and disease-treatment relationship recognition. Compared to the Frunza et al. Frunza:2011:MLA and the Rosario et al. studies Rosario:2004:CSR:1218955.1219010 that focus mostly on classification, the present study focuses also on text retrieval and clustering. Further, the present study focuses especially on cancer trajectories where the other studies have a broader perspective and aim to cover diseases in general.
In the 2011 study by Yang et al. yang2011analyzing , Density-Based Clustering was used to identify topics within online forum threads on social media. They also developed a visualization tool to provide an overview over the identified topics. The purpose of their tool was to extract topics with sensitive information related to terrorism or other crime activities; however, it might also be tailored to extract other topics. Besides using DBSCAN, the study proposed a related clustering method, namely SDC (Scalable Density based Clustering). The structure of the Yang et al. study is, to some extent, similar to the present study; specifically, in the present study, topics are also extracted from online forum posts, density based clustering is also used, and result visualization capabilities are also provided.
1.2 Reading guide
Section 2 presents the overall system architecture. Section 3 presents text information retrieval methods. Section 4 presents the clustering techniques used in this study. In section 5, we detail how further filtering of the clusters are performed as we split them into five categories (Cure, No cure, Disease, Treatment, Side effect and Irrelevant). The results and discussion are presented in sections 6 and 7, respectively.
2 System Architecture
2.1 Overview
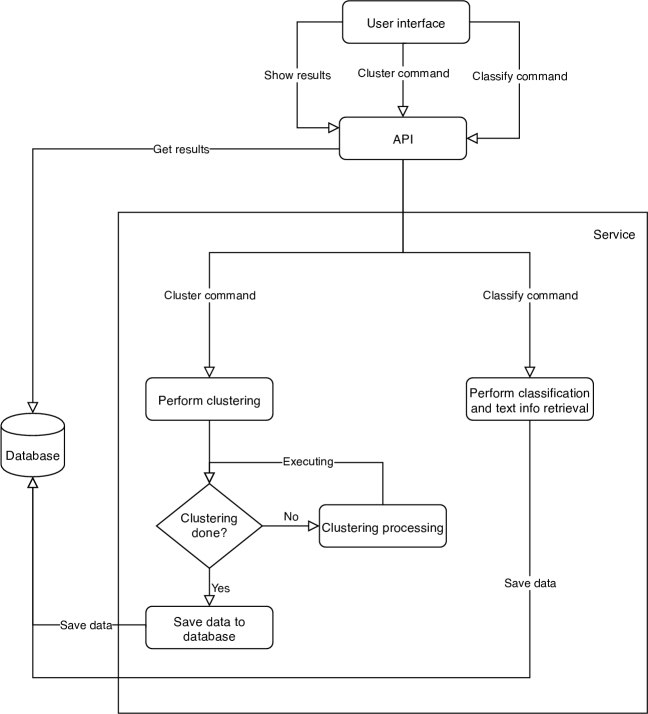
The present study’s developed software solution consists of four components including a database component for storage of clusters. The solution has been designed in a micro-service architecture with one process per component. Figure 1 provides a static overview in terms of a component diagram and figure 2 provides a dynamic overview in terms of an activity diagram.

The User interface (UI) component handles end-user interaction; this is detailed further in section 2.2. The purpose of the API component is primarily to enable easy access for the UI to the Database and the Service components. The Database persists all gathered forum posts and the computed results, e.g. clusters, classes and cancer-trajectories. The Service component is handling the computationally burdensome data processing; the micro-service architecture enables scaling of this component only. By implementing the service component as a scalable unit, it becomes well-suited for the application of a distributed computing approach. Especially the clustering calculations are burdensome and needs to be made efficient. Currently, the text retrieval and classification calculations do not need to be scaled as they are much faster than the clustering.
2.2 User Interface
Having a tool to visualize data is helpful for effective exploration of results. The developed user interface is useful for exploring the collected data set of forum posts and to show information from an area of interest. For instance, a user is able to select a cluster, i.e. a cancer-type, of interest, e.g. breast cancer, and only receive posts within that particular cluster. In addition, a user can also choose a class-label, e.g. side effect, and thereby see all posts from the breast cancer cluster that contains information about side effects. Such a tool is both relevant for scientific use and for cancer patients and caretakers.
The user interface consists of five main views, namely Search, Posts, Statistics, Clusters, and Tools (figure 1). Edited excerpts from the views Search, Posts and Statistics are seen in figures 3, 4 and 5 respectively. In the Search view, a user can search the entire collection of forum posts; the identified clusters, i.e. cancer-types, are displayed along with treatments mentioned in the posts. By clicking a cancer-type cluster, all posts associated with that particular cancer-type cluster are displayed in the Posts view. Users can browse through the posts within a cancer-type cluster, and by selecting a class-label, i.e. Disease, Treatment, Side effect, Cure, or No cure, only the posts within the cancer-type cluster and with the selected label are displayed. In the Statistics view, all cancer-type clusters are displayed along with their class-label distributions. Also, a histogram showing posts per cancer-type cluster is displayed along with absolute counts of posts, clustered posts, clusters, and class-labels. Thereby, the Statistics view provides a useful overview for the end-user; such an overview is very hard to obtain for any regular end-user reading through forum posts.
2.3 Validation
In this study, all developed software has been evaluated against five out of the eight properties defined in the software product quality model specified in the ISO 25010 standard iso_25010 . Concretely, the validation has focused on the following properties and sub-properties:
-
1.
Functional suitability: (a) Appropriateness, (b) Correctness
-
2.
Performance: (a) Time behavior, (b) Resource utilization
-
3.
Compatibility: (a) Interoperability, (b) Co-existence
-
4.
Maintainability: (a) Modularity, (b) Modifiability
-
5.
Portability: (a) Installability
All properties and sub-properties were met by the present study’s software.
3 Text Information Retrieval
3.1 Data Collection
The data consists of automatically collected posts from a set of
publicly available cancer related forums; the posts are written by
medical laypersons. Typically, the posts contain some combination of
diagnoses, symptoms, experiences, questions, side-effects, treatments
and/or treatment outcomes. In this study, each post is saved in the
following self explanatory structure:
[ thread_id, author, title, date, content ]
The most interesting piece of information in each post is stored in the content attribute. This attribute contains all of a post’s text, and based on this text, information retrieval is done and relevant features for the cancer-type clustering are extracted. Often, the post-texts contain rather detailed descriptions of a particular cancer-type and a received treatment. For example, a user on Cancer Survivors Network csn_cancer wrote the following about thyroid cancer:
Hi, everyone I was diagnosed with Papillary Thyroid Caner a little more than a year ago. It was right before Christmas last year and I went in to get all of my thyroid removed. It was a 5 hour surgery and I stayed in the hospital for 3 days because of complications with my levels. But, they didn’t look at the lymph nodes and the last two ultrasounds I have had revealed lymph nodes in my neck and one in my throat that have gotten bigger. I need some advice for thos who have had their thyroid cancer come back. My treatment of thyrogen shots, lab work, and scans start April 1st, 2013. I know this cancer is the easiest to treat but I’m wondering what happens if it has in fact spread to my lymph nodes and in my body? Does that change the prognosis or treatment or staging? Thanks for the help!
Although this representative example text is written by a layperson, it still contains relevant health and cancer related information that might be useful for other patients or caretakers.
3.2 Text Retrieval Preprocessing
In order to perform the actual text information retrieval successfully, the text needs to be preprocessed. In this study, we have conducted three preprocessing steps: 1. cleansing, 2. stemming, and 3. tokenization.
In the cleansing part, unwanted characters, e.g. HTML tags, emojis and ASCII-artwork, are removed. This is a non-trivial task when dealing with forum posts as people express themselves quite informally.
In the stemming part, inflected and derived words are reduced to their word stem Introduction_to_information_retrieval . Several different algorithms for stemming exists, e.g. the Lovins Stemmer lovins1968development , the Paice Stemmer chris1990another , and the predominant Porter Stemmer porter1980algorithm . All of these stemming algorithms are best suited for English; in the present study, the Porter Stemmer is used. The Porter Stemming algorithm is based on five steps, and in each step, a specified set of rules are applied to the word being processed; for instance, table 1 shows the processing rules of the first step porter1980algorithm .
| Rules | Examples | |||||
| sses | ss | caresses | caress | |||
| ies | i | difficulties | difficulti | |||
| ss | ss | caress | caress | |||
| s | ␣ | treatments | treatment␣ | |||
In the tokenization part, character and word sequences are sliced into tokens. Typically, the tokens are words or terms, but in this study, tokens are only words. After the tokenization, stop words are removed.
3.3 Text Retrieval
For the subsequent clustering of posts into cancer-type clusters to be accurate, information from all the posts’ content attribute needs to retrieved. This is done by using text retrieval together with a predefined feature vector containing names of a range of cancer types.
In this study, we use the Term Weighting approach. This approach uses Term Frequency and Inverse Document Frequency to yield Term Frequency - Inverse Document Frequency which is the final weight of a term.
The purpose of Term Frequency (tf) is to measure how often a term occurs in a specific document, i.e. in this study tf is simply an unadjusted count of term appearances.
Definition 1.
Term Frequency simple-proven-approaches-to-text-retrieval .
tf occurrences of term in document .
Clearly, documents vary in length which entails a bias in tf; that is, a term is likely to appear more often in a long document than in a short document, given the documents are similar in content On_term_selection_for_query_expansion . Whenever a term is frequent in a document it is likely to be important to that specific document.
The purpose of Inverse Document Frequency (idf) is to measure the weight of a term in a collection of documents; a rare term is often more valuable than a frequent term in a collection of documents UnderstandingInverseDocument .
Definition 2.
Inverse Document Frequency simple-proven-approaches-to-text-retrieval .
idf.
Where is the number of documents in collection , and is
the number of documents in in which term appears.
Term Frequency - Inverse Document Frequency (tf-idf) is a measure of how important a word is to a specific document in a collection of documents. A large tf-idf weight is obtained whenever: 1. the term frequency is high for the specific document, and 2. the document frequency is low for the term across the collection of documents. The combination of the and weights tend to filter out common terms that do not carry much information.
Definition 3.
Term Freq. - Inverse Document Freq. A_statistical_interpretation_of_term_specificity .
tf-idf tf idf.
4 Clustering
4.1 DBSCAN Clustering
Clustering is the process of splitting an unlabeled data set into clusters of observations with similar traits such that intra-cluster variation is minimized and inter-cluster variation is maximized. A cluster in this study is a collection of similar posts in terms of cancer-type.
Density-Based Spatial Clustering of Applications with Noise (DBSCAN) is a clustering algorithm based on the density of data points (also known as observations). It creates clusters from regions that have a sufficiently high density of data points and in doing so, it allows clusters of any shape even if it contains noise or outliers. This allows DBSCAN to create non-convex and non-linearly separated clusters, contrary to many other clustering algorithms Jain2010651 ; Campello2013 . Also, the algorithm is able to find clusters of arbitrary size data_mining_concepts ; mrdbscan2011 and it does not require the number of clusters beforehand Ester96adensity_based ; data_mining_concepts ; mrdbscan2011 . Moreover, DBSCAN (variants thereof) is horisontally scalable such that efficient computing can be achieved via a distributed or cluster computing setup which is attractive, and in some cases even necessary, for large scale text data processing. Before outlining the DBSCAN algorithm, a number of associated definitions need to be in place.
Definition 4.
DBSCAN related definitions Ester96adensity_based .
The -neighborhood of point
is defined by the points within a radius of .
If a point ’s -neighborhood contains at least
number of points, the point is called a core
point.
A point is directly density-reachable from a point
if is within the -neighborhood of and is a
core point.
A point is density-reachable from a point with
regard to and if there is a chain of points,
, where and such that
is directly density-reachable from .
A point is density-connected to a point with
regard to and if there is a point such that
both and are density-reachable from .
A point is a border point if ’s
-neighborhood contains less than and is
directly density-reachable from a core point.
All points not reachable from any other point are outliers called noise points.
A cluster is a non-empty set that satisfies the following two conditions for all point pairs : 1. if is in and is density-reachable from , then is also in ; and 2. if is in , then is density-connected to .
To establish a cluster, DBSCAN starts with an arbitrary point and finds all density-reachable points from with respect to and . If is a core point a new cluster with as a core point is created. If is a border point DBSCAN visits the next point in the data collection. DBSCAN may merge two clusters into one, if the clusters are density-reachable Ester96adensity_based . The algorithm terminates when no new points can be added to any cluster data_mining_concepts .
4.2 MR-DBSCAN Clustering
Clustering with DBSCAN is computationally burdensome both with regard to run-time and memory consumption xu1999fast . To achieve run-time efficiency, MR-DBSCAN (MapReduce-DBSCAN) mrdbscan2011 ; mrdbscan:He2014 is used rather than DBSCAN. Besides distributing computations via MapReduce, the two clustering algorithms are equivalent. Figure 6 outlines the steps in MR-DBSCAN.

4.2.1 Partitioning
To maximize parallelism and thus the run-time efficiency gain, data must be well balanced such that data, and thus the computational work-load, can be evenly distributed on the compute-nodes. However, data in real life applications are often unbalanced and this needs to be addressed with a suitable data partitioning strategy; such a strategy is part of MR-DBSCAN.
One possible partitioning strategy is to recursively split the entire data set into smaller sets, i.e. partitions, until a stop criterion is met, e.g. all partitions contain less than a given number of points or a given number of partitions have been made. According to definition 4, the geometry of a cluster, and therefore sensibly also a partition, cannot be smaller than , so when splitting a partition, the geometry must remain extended beyond . When splitting a partition into two in MR-DBSCAN mrdbscan2011 , all possible splits are considered. The split that minimizes the cost in one of the sub-partitions are chosen. Here, cost is the difference between the number of points in sub-partition-1 and half of the number of points in sub-partition-2. Each partition is given a key and associated with a reducer.
4.2.2 Local DBSCAN
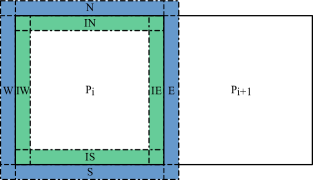
A reducer is given a partition and all its associated data points. Therefore, the mapper must prepare all data related to a partition for every single partition. That is, for instance, a partition , the related data within , but also the data within ’s -width extended partition that overlap the bordering partitions. In case of a 2D-grid partitioning those bordering sets are: North (N, IN), South (S, IS), East (E, IE), and West (W, IW) (figure 7).
Local DBSCAN uses the same principles as DBSCAN to perform its clustering. It starts with an arbitrary data point and finds all density-reachable points from with respect to and . If is a core point, the -neighborhood will be explored. If Local DBSCAN finds a point in the outer margin that is directly-density-reachable from a point in the inner margin, it is added to the merge-candidate set. If a core point is located in the inner margin, it is also added to the merge-candidate set. Each clustered point is given a local cluster ID, which is generated from the partition ID and the label ID from the local clustering: (partitionID, localclusterID). The output of a reducer is the clustered data points and the merge candidate set.
4.2.3 Mapping Profile
After each partition has undergone clustering and merge candidate lists have been generated, the merge candidate lists are collected to a single merge candidate list. The basics of merging the clusters from the different partitions are: 1. Execute a nested loop on all points in the collected merge candidate lists to see if the same data points exists with different local cluster IDs; 2. If found, then merge the clusters.
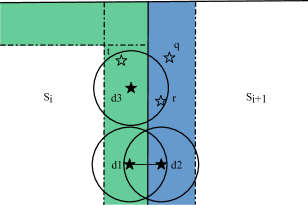
Figure 8 illustrates two examples of cluster-merge propositions. Example 1: the points and are core points and is directly density-reachable from ; thus, should merge with . Example 2: The point is a core point and is a border point; thus, should not merge with .
As it was seen in the Local DBSCAN step (subsection 4.2.2), the output of each Local DBSCAN is a merge-candidate list consisting of two types of points, namely: 1. the core points in the inner margin, and 2. directly-density-reachable points in the outer margin. Clearly, this is suitable for the present Mapping Profile step where the purpose is to create a profile that maps clusters that should be merged. The algorithm for generating the mapping profile is shown in the algorithm in figure 9.
The output of the algorithm is a list of pairs of local clusters to be merged (denoted MP) and a list of border points (denoted BP); a point is at least a border point in a merged cluster (this is taken care of in the next step).
4.2.4 Merge
The previous step resulted in a list of pairs of clusters to be
merged. The IDs of the local clusters should be changed into a unique
global ID after merging. Thus, a global perspective of all local
clusters is build (algorithm in figure 10). The
algorithm generates the map:
(partitionID, localclusterID) globalclusterID.
Lastly, as mentioned in the previous step, noise points are set to border points.
5 Classification
The result of the clustering is a set of cancer-type clusters. To enable further filtering possibilities for the end-user, a within-cluster classification is conducted such that each post within a cancer-type cluster is labeled with one of the six labels illustrated in table 2. This allows an end-user to filter the forum posts such that, for instance, only posts with breast cancer (cluster) treatments (class) are shown.
| Class label | Class description with example post in italics |
| Cure | About cancer curing treatments. After 16 chemo sessions my cancer was gone. |
| No cure | About cancer non-curing treatments. My husband went through chemo since he had bladder cancer. Sadly he passed. |
| Disease | About cancer without mentioning treatments. I was diagnosed with breast cancer a few weeks ago. |
| Treatment | About treatments without mentioning cancer. Has anyone tried being treated with Stem Cells? |
| Side effect | Side effects of disease or treatment. The chemo makes it really hard for me to swallow and a hard time eating. |
| Irrelevant | About none of the above. I am so sorry to hear that. Love Lea. |
We have chosen to classify with a Naive Bayes classifier trained with a manually created training set augmented with the freely available set from The BioText Project, UC, Berkeley training_set_bio . The Frunza et al. study also uses a Naive Bayes classifier with promising results Frunza:2011:MLA . However, they classified abstracts from scientific articles which is a somewhat different data-domain than the present study’s non-clinical texts.
The time complexity for training a Naive Bayes classifier is , where is the number of training observations and is the number of features; thus, disregarding the constant, the complexity is in terms of observations . When testing, Naive Bayes is also linear which is optimal for a classifier.
6 Results
6.1 Clustering: DBSCAN and MR-DBSCAN Verification
MR-DBSCAN is a distributed extension of DBSCAN and they use the same principles for clustering. Thus, given the same input, the two clustering methods should yield exactly the same output. The results in this section show that this is indeed the case and we thereby consider the implementations of MR-DBSCAN and DBSCAN to be verified in terms of correctness of logical output. The actual implementations do not share code so it seems fair to disregard the odd risk of having both implementations wrong in a manner that lead to the same output.
For comparing the clusterings of DBSCAN and MR-DBSCAN, the Adjusted Rand Index (ARI) Hubert1985 is used. The index is a similarity measure between two clusterings and it is obtained by counting the number of identical labels assigned to the same clusters vs. the number of identical labels assigned to different clusters. If the label assignments coincide fully, the index is 1, and if they do not coincide at all, the index is 0. If DBSCAN and MR-DBSCAN are implemented correctly, the ARI must be 1 regardless of: 1. the number of points in the data set, 2. the number of partitions in MR-DBSCAN, and 3. the parameter settings for and . In addition, the number of partitions (#P) in MR-DBSCAN, the coverage percentage (%C), and the number of labels (#L) in DBSCAN and MR-DBSCAN have been recorded. The results show (table 3) that the ARI is 1 in all 18 test cases; a necessary condition for this to happen, is that both MR-DSBCAN and DBSCAN yield the same number of labels in all the tests which is also the case (table 3).
Also, MR-DBSCAN has been partitioning its data into 3-8 partitions (table 3), which means that even though the data has been split and clustered individually per partition, the merging works as intended and yields the same clustering as DBSCAN. The coverage percentage value is also identical for the two clusterings in all test cases.
| Posts | DBSCAN | MR-DBSCAN | ARI | |||||
| #L | %C | #L | %C | #P | ||||
| 15000 | 5 | 10 | 3.34 | 10 | 3.34 | 8 | 1 | |
| 15000 | 50 | 2 | 2.99 | 2 | 2.99 | 8 | 1 | |
| 15000 | 100 | 1 | 2.66 | 1 | 2.66 | 8 | 1 | |
| 15000 | 5 | 10 | 3.34 | 10 | 3.34 | 7 | 1 | |
| 15000 | 50 | 2 | 2.99 | 2 | 2.99 | 7 | 1 | |
| 15000 | 100 | 1 | 2.66 | 1 | 2.66 | 7 | 1 | |
| 15000 | 5 | 11 | 3.37 | 11 | 3.37 | 3 | 1 | |
| 15000 | 50 | 2 | 2.99 | 2 | 2.99 | 3 | 1 | |
| 15000 | 100 | 1 | 2.66 | 1 | 2.66 | 3 | 1 | |
| 25000 | 5 | 23 | 2.92 | 23 | 2.92 | 7 | 1 | |
| 25000 | 50 | 2 | 2.37 | 2 | 2.37 | 7 | 1 | |
| 25000 | 100 | 1 | 2.02 | 1 | 2.02 | 7 | 1 | |
| 25000 | 5 | 23 | 2.92 | 23 | 2.92 | 6 | 1 | |
| 25000 | 50 | 2 | 2.37 | 2 | 2.37 | 6 | 1 | |
| 25000 | 100 | 1 | 2.02 | 1 | 2.02 | 6 | 1 | |
| 25000 | 5 | 24 | 2.94 | 24 | 2.94 | 3 | 1 | |
| 25000 | 50 | 2 | 2.37 | 2 | 2.37 | 3 | 1 | |
| 25000 | 100 | 1 | 2.02 | 1 | 2.02 | 3 | 1 | |
6.2 Run-Time Analysis: MR-DBSCAN
The purpose of this experiment is to demonstrate the run-time of each of the MR-DBSCAN steps under variations in: 1. the number of forum posts, and 2. the neighborhood radius . Clearly, these two parameters have the largest influence on the MR-DBSCAN’s run-time. The parameter is used when partitioning the data set and therefore it has a direct influence on the beneficial effects of MapReduce.
In all tests, the lower point-count threshold for establishing a core point, , is fixed to 5 points. This is done as the parameter only has very little run-time influence and this influence is isolated to the DBSCAN step, i.e. it does not highlight run-time differences between DBSCAN and MR-DBSCAN.
|
Posts [] |
[1] |
Partition [s] |
DBSCAN [s] |
Map [s] |
Merge [s] |
Total [s] |
#P |
| 5 | 0.41 | 3.82 | 0.00 | 0.02 | 11.16 | 1 | |
| 5 | 0.62 | 3.79 | 0.00 | 0.02 | 11.35 | 3 | |
| 5 | 1.55 | 1.94 | 0.00 | 0.02 | 12.24 | 7 | |
| 5 | - | - | - | - | - | - | |
| 5 | - | - | - | - | - | - | |
| 5 | - | - | - | - | - | - | |
| 10 | 0.86 | 10.44 | 0.00 | 0.04 | 18.15 | 1 | |
| 10 | 1.31 | 10.35 | 0.00 | 0.05 | 18.78 | 3 | |
| 10 | 2.48 | 3.12 | 0.00 | 0.04 | 13.84 | 7 | |
| 10 | 50.64 | 2.73 | 0.00 | 0.03 | 61.85 | 8 | |
| 10 | 130.68 | 2.75 | 0.00 | 0.03 | 142.29 | 8 | |
| 10 | - | - | - | - | - | - | |
| 15 | 1.17 | 21.49 | 0.00 | 0.06 | 31.96 | 1 | |
| 15 | 1.86 | 17.86 | 0.00 | 0.07 | 25.74 | 3 | |
| 15 | 3.26 | 3.68 | 0.00 | 0.06 | 14.75 | 7 | |
| 15 | 66.89 | 3.38 | 0.00 | 0.05 | 78.34 | 8 | |
| 15 | 187.76 | 3.39 | 0.00 | 0.05 | 199.11 | 8 | |
| 15 | - | - | - | - | - | - | |
| 20 | 1.65 | 40.17 | 0.00 | 0.09 | 51.23 | 1 | |
| 20 | 2.29 | 30.58 | 0.00 | 0.09 | 38.98 | 3 | |
| 20 | 3.86 | 4.18 | 0.00 | 0.08 | 15.544 | 6 | |
| 20 | 66.51 | 4.63 | 0.00 | 0.07 | 78.39 | 7 | |
| 20 | 182.58 | 4.20 | 0.00 | 0.07 | 194.22 | 7 | |
| 20 | - | - | - | - | - | - | |
| 25 | 2.43 | 105.83 | 0.00 | 0.10 | 127.76 | 1 | |
| 25 | 2.89 | 98.96 | 0.00 | 0.09 | 110.63 | 3 | |
| 25 | 4.71 | 5.18 | 0.00 | 0.10 | 16.83 | 6 | |
| 25 | 78.75 | 5.93 | 0.00 | 0.08 | 90.76 | 7 | |
| 25 | 202.71 | 5.85 | 0.00 | 0.09 | 214.82 | 7 | |
| 25 | - | - | - | - | - | - |
For all 30 test cases (table 4), mapping takes almost no time at all; merging has also only little effect on run-time. For relatively large values of , i.e. 1 and 0.1, compared to the data span, MR-DBSCAN is not able to partition the data set well. Clearly, this affects the run-time as the clustering then is performed on a single partition (or very few) and no MapReduce improvements are achieved. For relatively small values of , i.e. 0.001 and 0.0005, the data set is split well into partitions, but due to the low value of there is a large number of possible partitions, and a lot of time is spent in search of the the best partitioning. Thus, as the results show, the partitioning becomes slower when decreases, but the local DBSCAN becomes faster. Hence, needs to be set with care to strike a balance and minimize the total run-time of MR-DBSCAN. In our experiments, the balance is (table 4 and figure 11). At this point, the partitioning run-time is relatively low and likewise for the local DBSCAN; this results in a relatively low total run-time.
Decreasing even further to made the partitioning exceed the set max limit of total run-time of 16 minutes (see the grayed-out rows in table 4). Entries are also missing (table 4 and figure 11) at posts and and as proper equidistributed partitioning cannot be done when both the number of posts and are relatively low.

6.3 Run-Time Contrast: DBSCAN, MR-DBSCAN, HDBSCAN
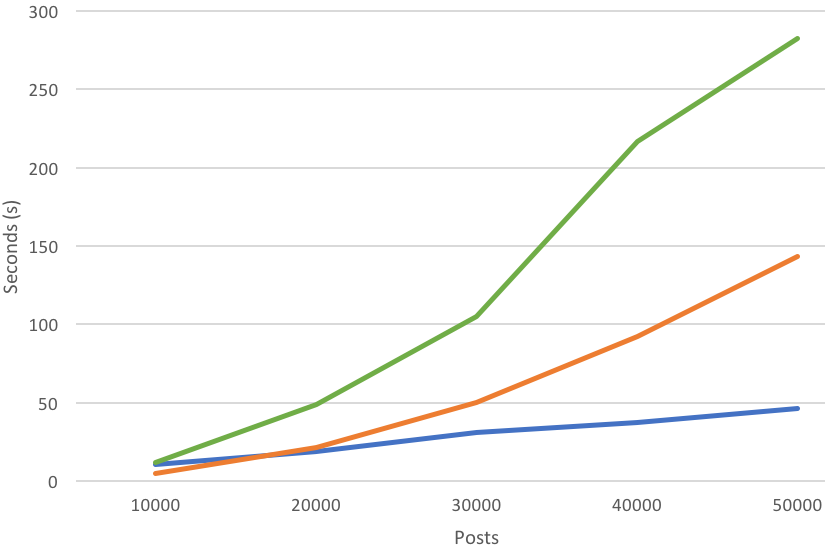
The purpose of this experiment is to compare run-time as a function of number of forum posts of the three different clustering algorithms DBSCAN, MR-DBSCAN, and HDBSCAN hdbscan_original . Algorithm parameters are fixed and equal across the tests in order not to bias the results. Specifically, the lower point-count threshold for establishing a core point and the neighborhood radius for all tests. Note that the setting was previously found (section 6.2) to be a suitable choice for MR-DBSCAN. The data set in this experiment is various subsets of the collected forum posts; the number of tf-idf features has been limited to 1000. The results of all tests are reported in table 5 and figure 12.
| # | Posts | MR-DBSCAN [s] | DBSCAN [s] | HDBSCAN [s] |
| 1 | 10000 | 10.696 | 4.755 | 11.969 |
| 2 | 20000 | 18.994 | 21.167 | 48.731 |
| 3 | 30000 | 31.115 | 50.237 | 105.007 |
| 4 | 40000 | 37.321 | 92.392 | 217.033 |
| 5 | 50000 | 46.185 | 143.405 | 282.358 |
| 6 | 60000 | 53.235 | ||
| 7 | 70000 | 66.240 | ||
| 8 | 80000 | 83.283 | ||
| 9 | 90000 | 92.393 | ||
| 10 | 100000 | 113.077 |
MR-DBSCAN is slower than DBSCAN in the first test case with 10.000 posts, but from this point on it is executing much faster. When DBSCAN and HDBSCAN stopped executing due to memory exhaustion of the test computer, MR-DBSCAN continued; thus, the gray cells in table 5 and the x-axis limit in figure 12. The memory exhaustion when running DBSCAN and HDBSCAN is mainly due to the growth of the tf-idf matrix which holds a forum post per row. This is simply not a feasible implementation when clustering problems become large. Clearly, divide and conquer by MapReduce help circumvent this problem.
7 Discussion
We argue that the information hidden in non-clinical texts is valuable and worth retrieving and activating. In the present study, the activation is done via a decision support system that helps cancer patients and caretakers to stay informed about cancer trajectories, i.e. associated symptoms, diagnoses, treatments, and outcomes, and to make informed arguments and decisions regarding treatment plans.
Concretely, the presented system analyzes non-clinical forum posts’ contents by using text retrieval, clustering, and classification methods. The methods are executed in a distributed computing setup, specifically MapReduce, to achieve computational efficiency via utilization of multi-cores in modern computers. Indeed, the computational burdensome clustering was significantly improved in terms of run-time by MapReduce; thus, the clustering method MR-DBSCAN is recommendable for large clustering challenges.
Moreover, the presented system provides an interactive graphical user interface that allows end-users to mine the valuable information and to get an overview over cancer trajectories. Hopefully, the proposed system and systems alike will also help build patient/caretaker communities by leveraging the soft information not hitherto used by the established health care systems, e.g. information about emotions, feelings, or personal preferences.
The present study can be extended in several different ways. Adding, refining, and benchmarking more clustering and classification methods would yield a more comprehensive comparison that might lead to even better results, i.e. more accurate clusterings and classifications, and thus, ultimately, a better end-user service. For the classification it would especially be of interest to collect and use a larger training set. With regard to DBSCAN and HDBSCAN clustering, we experienced memory exhaustion problems on our local development machines when executing the algorithms on large sets of posts, i.e. around 50.000 posts. It is of interest to address these memory consumption challenge by redesigning the algorithms such that upper bounds on memory consumption can be guaranteed.
Lastly, it would be interesting to generalize the presented system such that it readily can be applied in other domains besides cancer; this would require an easy way of loading new data-sets and associated feature-vectors.
Acknowledgments
We would like to acknowledge Kim Svendsen (Stibo Accelerator, Højbjerg, Denmark) and Jacob Høy Berthelsen and Bo Thiesson (Enversion, Aarhus, Denmark) for inspiring discussions. We would also like to thank Enversion for providing a web crawler suitable for collecting cancer forum posts.
Declarations
Ethics approval
Not applicable.
Data availability
The data that support the findings of this study come from the private Danish company Enversion and is not publicly available. It is however available from the authors upon reasonable request.
Competing interests
The authors declare that they have no known competing financial interests or personal relationships that could have appeared to influence the work reported in this paper.
Funding
No funding was received for this study.
Authors’ contributions
J. Agerskov and K. Nielsen conceived the presented idea, implemented the prototype and documented the experiments. C. M. Lillelund assisted with writing the introduction chapter and prepare the manuscript in accordance with Springer guidelines. C. F. Pedersen supervised the project. All authors discussed the results and contributed to the final manuscript.
References
- \bibcommenthead
- (1) Jensen, K., Soguero-Ruiz, C., Mikalsen, K.O., Lindsetmo, R.-O., Kouskoumvekaki, I., Girolami, M., Skrovseth, S.O., Augestad, K.M.: Analysis of free text in electronic health records for identification of cancer patient trajectories. Scientific Reports 7(46226) (2017). https://doi.org/10.1038/srep46226
- (2) Murray, S.A., Kendall, M., Boyd, K., Sheikh, A.: Illness trajectories and palliative care. British Medical Journal 330 (2005). https://doi.org/10.1136%2Fbmj.330.7498.1007
- (3) The Danish Cancer Society. www.cancer.dk. Accessed: 9-11-2017
- (4) Umefjord, G., Hamberg, K., Malker, H., Petersson, G.: The use of an internet-based ask the doctor service involving family physicians: Evaluation by a web survey. Family Practice 23(2), 159–166 (2006). https://doi.org/10.1093/fampra/cmi117
- (5) Umefjord, G., Sandström, H., Malker, H., Petersson, G.: Medical text-based consultations on the internet: A 4-year study. International Journal of Medical Informatics 77(2), 114–121 (2008). https://doi.org/10.1016/j.ijmedinf.2007.01.009
- (6) Wang, Y., Wang, L., Rastegar-Mojarad, M., Moon, S., Shen, F., Afzal, N., Liu, S., Zeng, Y., Mehrabi, S., Sohn, S., et al.: Clinical information extraction applications: a literature review. Journal of biomedical informatics 77, 34–49 (2018). https://doi.org/10.1016/j.jbi.2017.11.011
- (7) Luque, C., Luna, J.M., Luque, M., Ventura, S.: An advanced review on text mining in medicine. WIREs Data Mining and Knowledge Discovery 9(3) (2019). https://doi.org/10.1002/widm.1302
- (8) Simpson, M.S., Demner-Fushman, D.: Biomedical text mining: a survey of recent progress. In: Aggarwal, C., Zhai, C. (eds) Mining Text Data. Springer, Boston, MA. (2012). https://doi.org/10.1007/978-1-4614-3223-4_14
- (9) Meystre, S.M., Savova, G.K., Kipper-Schuler, K.C., Hurdle, J.F.: Extracting information from textual documents in the electronic health record: a review of recent research. Yearbook of medical informatics 17(01), 128–144 (2008). https://doi.org/10.1055/s-0038-1638592
- (10) Demner-Fushman, D., Chapman, W.W., McDonald, C.J.: What can natural language processing do for clinical decision support? Journal of biomedical informatics 42(5), 760–772 (2009). https://doi.org/10.1016/j.jbi.2009.08.007
- (11) Ebadollahi, S., Sun, J., Gotz, D., Hu, J., Sow, D., Neti, C.: Predicting patient’s trajectory of physiological data using temporal trends in similar patients: A system for near-term prognostics. In: Amia Annual Symposium (2010)
- (12) Jensen, A.B., Moseley, P.L., Oprea, T.I., Ellesøe, S.G., Eriksson, R., Schmock, H., Jensen, P.B., Jensen, L.J., Brunak, S.: Temporal disease trajectories condensed from population-wide registry data covering 6.2 million patients. Nature Communications 5(4022) (2014). https://doi.org/10.1038/ncomms5022
- (13) Ji, X., Chun, S.A., Geller, J.: Predicting comorbid conditions and trajectories using social health records. IEEE Transactions on NanoBioscience 15(4) (2016). https://doi.org/10.1109/tnb.2016.2564299
- (14) Assale, M., Dui, L.G., Cina, A., Seveso, A., Cabitza, F.: The revival of the notes field: Leveraging the unstructured content in electronic health records. Frontiers in Medicine (2019). https://doi.org/10.3389%2Ffmed.2019.00066
- (15) Nehme, F., Feldman, K.: Evolving role and future directions of natural language processing in gastroenterology. Digestive diseases and sciences 66(1), 29–40 (2021). https://doi.org/10.1007/s10620-020-06156-y
- (16) Frunza, O., Inkpen, D., Tran, T.: A machine learning approach for identifying disease-treatment relations in short texts. IEEE Transactions on Knowledge and Data Engineering 23(6), 801–814 (2011). https://doi.org/%****␣sn-article.bbl␣Line␣300␣****10.1109/TKDE.2010.152
- (17) Rosario, B., Hearst, M.A.: Classifying semantic relations in bioscience texts. In: ACL, Annual Meeting of the Association for Computational Linguistics, Stroudsburg, PA, USA (2004). https://doi.org/10.3115/1218955.1219010
- (18) Yang, C.C., Ng, T.D.: Analyzing and visualizing web opinion development and social interactions with density-based clustering. IEEE Transactions on Systems, Man, and Cybernetics – Part A: Systems and Humans 41(6), 1144–1155 (2011). https://doi.org/10.1109/TSMCA.2011.2113334
- (19) ISO/IEC JTC 1/SC 7: ISO/IEC 25010:2011, systems and software engineering – systems and software quality requirements and evaluation (square) – system and software quality models. Technical Report 1, ISO/IEC (March 2011). ICS 35.080
- (20) American Cancer Society: Cancer Survivors Network. csn.cancer.org. Accessed: 7-11-2017
- (21) Manning, C., Raghavan, P., Schütze, H.: Introduction to Information Retrieval. Cambridge University Press, Cambridge, United Kingdom (2008). https://doi.org/10.1017/CBO9780511809071
- (22) Lovins, J.B.: Development of a stemming algorithm. Technical report, Electronic Systems Laboratory, MIT, Cambridge, Massachusetts, USA (1968)
- (23) Paice, C.D.: Another stemmer. ACM, SIG on Information Retrieval FORUM 24(3), 56–61 (1990). https://doi.org/10.1145/101306.101310
- (24) Porter, M.: An algorithm for suffix stripping. Program 14(3), 130–137 (1980). https://doi.org/10.1108/eb046814
- (25) Robertson, S.E., Spärck Jones, K.: Simple, proven approaches to text retrieval. Technical Report UCAM-CL-TR-356, University of Cambridge, Computer Laboratory, Cambridge, UK (December 1994)
- (26) Robertson, S.: On term selection for query expansion. Journal of Documentation 46(4), 359–364 (1990). https://doi.org/10.1108/eb026866
- (27) Robertson, S.: Understanding inverse document frequency: On theoretical arguments for IDF. Journal of Documentation 60(5), 503–520 (2004). https://doi.org/10.1108/00220410410560582
- (28) Jones, K.: A statistical interpretation of term specificity and its applications in retrieval. Journal of Documentation 28(1), 11–21 (1972). https://doi.org/10.1108/eb026526
- (29) Jain, A.: Data clustering: 50 years beyond k-means. Elsevier, Pattern Recognition Letters 31(8), 651–666 (2010). https://doi.org/10.1016/j.patrec.2009.09.011
- (30) Campello, R., Moulavi, D., Sander, J.: Density-based clustering based on hierarchical density estimates. In: PAKDD, Advances in Knowledge Discovery and Data Mining, pp. 160–172. Springer, Gold Coast, Australia (2013). https://doi.org/10.1007/978-3-642-37456-2_14
- (31) Han, J., Kamber, M., Pei, J.: Data Mining: Concepts and Techniques, 3rd edn. Morgan Kaufmann Publishers, Burlington, Massachusetts, USA (2011). https://doi.org/10.1016/C2009-0-61819-5
- (32) He, Y., Tan, H., Luo, W., Mao, H., Ma, D., Feng, S., Fan, J.: MR-DBSCAN: An efficient parallel density-based clustering algorithm using MapReduce. In: IEEE, International Conference on Parallel and Distributed Systems, Tainan, Taiwan, pp. 473–480 (2011). https://doi.org/%****␣sn-article.bbl␣Line␣525␣****10.1109/ICPADS.2011.83
- (33) Ester, M., Kriegel, H.-P., Sander, J., Xu, X.: A density-based algorithm for discovering clusters in large spatial databases with noise. In: ACM, Conference on Knowledge Discovery and Data Mining (KDD), pp. 226–231. AAAI Press, Portland, Oregon, USA (1996)
- (34) Xu, X., Jäger, J., Kriegel, H.-P.: A fast parallel clustering algorithm for large spatial databases. Data Mining and Knowledge Discovery 3(3), 263–290 (1999). https://doi.org/10.1023/A:1009884809343
- (35) He, Y., Tan, H., Luo, W., Feng, S., Fan, J.: MR-DBSCAN: A scalable MapReduce-based DBSCAN algorithm for heavily skewed data. Springer, Frontiers of Computer Science 8(1), 83–99 (2014). https://doi.org/%****␣sn-article.bbl␣Line␣575␣****10.1007/s11704-013-3158-3
- (36) Data for research on relations between DISEASE/TREATMENT entities. http://biotext.berkeley.edu/dis_treat_data.html. Accessed: 16-11-2017
- (37) Hubert, L., Arabie, P.: Comparing partitions. Springer, Journal of Classification 2(1), 193–218 (1985). https://doi.org/10.1007/BF01908075
- (38) Campello, R., Moulavi, D., Zimek, A., Sander, J.: Hierarchical density estimates for data clustering, visualization, and outlier detection. ACM Transactions on Knowledge Discovery from Data 10(1) (2015). https://doi.org/10.1145/2733381