Improvement of variables interpretability in kernel PCA
Abstract
Kernel methods have been proven to be a powerful tool for the integration and analysis of high-throughput technologies generated data. Kernels offer a nonlinear version of any linear algorithm solely based on dot products. The kernelized version of Principal Component Analysis is a valid nonlinear alternative to tackle the nonlinearity of biological sample spaces. This paper proposes a novel methodology to obtain a data-driven feature importance based on the KPCA representation of the data. The proposed method, kernel PCA Interpretable Gradient (KPCA-IG), provides a data-driven feature importance that is computationally fast and based solely on linear algebra calculations. It has been compared with existing methods on three benchmark datasets. The accuracy obtained using KPCA-IG selected features is equal to or greater than the other methods’ average. Also, the computational complexity required demonstrates the high efficiency of the method. An exhaustive literature search has been conducted on the selected genes from a publicly available Hepatocellular carcinoma dataset to validate the retained features from a biological point of view. The results once again remark on the appropriateness of the computed ranking. The black-box nature of kernel PCA needs new methods to interpret the original features. Our proposed methodology KPCA-IG proved to be a valid alternative to select influential variables in high-dimensional high-throughput datasets, potentially unravelling new biological and medical biomarkers.
Keywords Kernel PCA Relevant variables Unsupervised learning Kernel methods
1 Introduction
The recent advancement in high-throughput biotechnologies is making large multi-omics datasets easily available. Bioinformatics has recently entered the Big Data era, offering researchers new perspectives to analyse biological systems to discover new genotype-phenotype interactions.
Consequently, new ad-hoc methods to optimise post-genomic data analysis are needed, considering the high complexity and heterogeneity involved. For instance, multi-omics datasets pose the additional difficulty of dealing with a multilayered framework making data integration extremely challenging.
In this context, kernel methods offer a natural theoretical framework for the high dimensionality and heterogeneous nature of omics data, addressing their peculiar convoluted nature (Schölkopf et al., 2003). These methods facilitate the analysis and the integration of various types of omics data, such as vectors, sequences, networks, phylogenetic trees, and images, through a relevant kernel function. Using kernels enables the representation of the datasets in terms of pairwise similarities between sample points, which is helpful for handling high-dimensional sample spaces more efficiently than using Euclidean distance alone. Euclidean distance can be inadequate in complex scenarios, as stated in Duda et al. (2000), but kernels can help overcome this limitation.
Moreover, kernel methods have the advantage of providing a nonlinear version of any linear algorithm which relies solely on dot products. For instance, Kernel Principal Component Analysis, (Schölkopf et al., 1997), Kernel Canonical Correlation Analysis (Bach and Jordan, 2003), Kernel Discriminant Analysis (Roth and Steinhage, 1999) and Kernel Clustering (Girolami, 2002) are all examples of nonlinear algorithms enabled by kernel transformations.
This work will focus on the kernelised version of Principal Component Analysis, KPCA, that provides a nonlinear alternative to the standard PCA to reduce the sample space dimensions.
However, one of the drawbacks of KPCA and kernel methods, in general, is that they pose new challenges in interpretability. The so-called pre-image problem arises since data points are only addressed through the kernel function, causing the original features to be lost during the data embedding process. The initial information contained in the original variables is summarised in the pairwise kernel similarity scores among data sample points.
Thus, retrieving the original input dimensions is highly challenging when it comes to identifying the most prominent features.
Even if it is possible for certain specific kernels to solve the pre-image problem through a fixed-point iteration method, the provided solution is typically numerically unstable since it involves a non-convex optimisation problem (Schölkopf et al., 1998). Moreover, in most cases, the exact pre-image does not even exist (Mika et al., 1998).
However, it is possible to find works that aim at finding the pre-image problem solution, like the pre-image based on distance constraints in the feature space in Kwok and Tsang (2004) or local isomorphism as in Huang et al. (2011).
Instead, this article concentrates on unsupervised feature selection based on kernel PCA. More specifically, we propose a method to identify the most influential variables for the kernel principal components that account for the majority of the variability of the data. This procedure provides a computationally fast and stable feature ranking to identify the most prominent original variables. Unimportant descriptors can be thus ignored, refining the kernel procedure whose similarity measure can be influenced by irrelevant dimensions (Brouard et al., 2022).
1.1 Existing approaches to facilitate feature interpretability in the unsupervised setting
The literature on unsupervised feature selection is generally less extensive than its supervised learning counterpart. One of the main reasons for this disparity is that the selection is made without a specific prediction goal, making it difficult to evaluate the quality of a particular solution. In the same way, the unsupervised feature selection field that takes advantage of the kernel framework has been found to be less explored than kernel applications with classification purposes. As mentioned earlier, interpreting kernel PCA requires additional attention as the kernel principal component axes themselves are only defined by the similarity scores of the sample points. However, the literature has limited attempts to explain how to interpret these axes after the kernel transformation. Therefore, feature selection methods based on KPCA are rare.
Among others, Reverter et al. (2014) proposed a method to visualize the original variables into the kernel PCs plot. For every sample point projected in the KPCA axes, they propose to display the original variables as arrows representing the vector field of the direction of maximum growth for each input variable or combination of them. This algorithm does not provide variable importance ranking, requiring previous knowledge about which variables to display.
On the contrary, Mariette and
Villa-Vialaneix (2017) proposed a variable importance selection method to identify the most influential variables for every principal component based on random permutation. The procedure is performed for all variables, selecting the ones that result in the largest Crone-Crosby (Crone and Crosby, 1995) distance between kernel matrices, i.e. the variables whose permutations of the observations lead to a significant change in the kernel Gram matrix values.
However, the method does not come with a variable representation and can be computationally expensive. This method will be denoted as KPCA-permute in the rest of the article.
Another method that takes advantage of the kernel framework is the unsupervised method UKFS with its extension UKFS-KPCA in Brouard et al. (2022) where the authors propose to select important features through a non-convex optimization problem with a penalty for a Frobenius norm distortion measure.
As exhaustively described in the overview presented in Li et al. (2017), there are different approaches to assess variable importance in an unsupervised setting not based on the kernel framework. Among others, we can mention two methodologies that are based on the computation of a score, the Laplacian Score lapl in He et al. (2005) and its extension Spectral Feature Selection SPEC in Zhao and Liu (2007).
Other alternatives are the Multi-Cluster Feature Selection MCFS in Cai et al. (2010), the Nonnegative Discriminative Feature Selection NDFS in Li et al. (2021), and the Unsupervised Discriminative Feature Selection UDFS in Yang et al. (2011). These methods aim to select features by keeping only the ones that best represent the implicit nature of the clustered data.
Then, Convex Principal Feature Selection CPFS Masaeli et al. (2010) adopts a distinct approach to feature selection, focusing on selecting a subset of features that can best reconstruct the projection of the data on the initial axes of the Principal Component Analysis.
As mentioned, the present study introduces a novel contribution to the interpretability of variables in kernel PCA, assuming that the first kernel PC axes contain the most relevant information about the data. The newly proposed method follows and extends the idea proposed by Reverter et al. (2014), with the fundamental difference that it gives a data-driven features importance ranking. Moreover, contrarily KPCA-permute in Mariette and
Villa-Vialaneix (2017), it does not have a random nature while being considerably faster.
From now on, it will be referred to as KPCA-IG, which stands for KPCA Interpretable Gradient.
2 Methods
This section presents the formulation behind our proposed method KPCA-IG, starting with describing the kernel framework.
2.1 Kernel PCA
Given a dataset of observations with
, a function k defined as k:
is a valid kernel if it is symmetric and positive semi-definite i.e. and c’c 0, , where is the kernel matrix containing all the data pairwise similarities .
The input set
does not require any assumption. In this work we consider it to be
.
Every kernel function is associated with an implicit function :
which maps the input points into a generic feature space , with possibly an infinite dimensionality, with the expression
. This relation allows to compute the dot products in the feature space, implicitly applying the kernel function to the input objects, without explicitly computing the mapping function .
Principal Component Analysis is a well-established linear algorithm to extract the data structure in an unsupervised setting (Hastie et al., 2009).
However, it is commonly accepted that in specific fields, such as bioinformatics, assuming a linear sample space may not help to capture the data manifold adequately (Reverter et al., 2014). In other words, the relationships between the variables may be nonlinear, making linear methods unsuitable. Hence, with high-dimensional data such as genomic data, where the number of features is usually much larger than the number of samples, nonlinear methods like kernel methods can provide a valid alternative for data analysis.
A compelling approach to overcome this challenge is through kernel PCA, which was introduced in Schölkopf et al. (1997). Kernel PCA applies PCA in the feature space generated by the kernel, and as PCA relies on solving an eigenvalue problem, its kernelized version operates under the same principle. The algorithm requires the data to be centered in the feature space, and the diagonalization of the centered covariance matrix in the feature space is equivalent to the eigendecomposition of the kernel matrix .
The data coordinates in the feature space are unknown as is not explicitly computed. Consequently, the required centering of variables in the feature space cannot be done explicitly. However, it is possible to compute the centered Gram matrix as with a vector with length n and for all entries.
If we express the eigenvalues of with and the corresponding set of eigenvectors , the principal component axes can be expressed as with and orthonormal in with .
Thus solving , it is possible to compute the projection of the points into the subspace of the feature space spanned by the eigenvectors. The projection of a test point into the -th eigenvector becomes then
.
Likewise, utilizing the concise, explicit form of the centered gram matrix , it is possible to express the projection of an arbitrary point onto the -th kernel principal component as follows:
As we observe, the kernel PCA algorithm can be mathematically represented using only the entries of the kernel matrix. This means that the algorithm operates entirely on the original input data without requiring the computation of new data coordinates in the feature space. This technique effectively resolves the issue of potentially high computational complexity by allowing the input points to be implicitly mapped into the feature space. However, it also introduces new challenges in terms of interpretation. Determining which input variables have the most significant impact on the kernel principal components can be highly challenging, making it difficult to interpret them in terms of the original features. In other words, since the kernel function maps the data to a higher-dimensional feature space, it can be hard to understand how the original features contribute to the newly obtained kernel principal components. In the previous section, we have mentioned the few techniques available in the literature that can be used to gain insight into the original input variables that had the most influence on the KPCA solution. The following section presents our contribution to providing practitioners with a data-driven and faster variable ranking methodology.
2.2 Improvement of variable interpretability in KPCA
It is known that gradient descent is one of the most common algorithms for the training phase of most neural networks (Ruder, 2016). In this framework, the norm of the cost function gradient plays a crucial role as it determines the step size of the update at each iteration. Together with the direction, its magnitude is a measure of the steepness of the cost function at a particular point in the parameter space. If the gradient magnitude is high, the cost function changes rapidly; thus, the parameters must be updated with a larger step size. Conversely, if the gradient magnitude is low, it indicates that the cost function is changing slowly, and therefore, the parameters need to be adjusted with a smaller step size.
In the same way, we propose to compute at each sample point the norm of the partial derivative of every feature curve projected into the eigenspace of the Gram matrix. When the norm of the partial derivative of a variable is high, it means that the variable substantially affects the position of the sample points in the kernel PC axes. Conversely, when the norm of the partial derivative of a variable is small, the variable can be deemed negligible for the kernel principal axes.
Thus, the main idea is to compute the lengths of the gradient vectors for every variable at each sample point as they represent how steep the direction given by the partial derivative of the induced curve is.
Some works in the neuroimaging and earth system sciences domain have also shown that kernel derivatives may indicate the influence carried by the original variables as in Rasmussen et al. (2011) and Johnson et al. (2020).
Followingly in this work, we apply this intuition to the KPCA framework.
Analytically, Reverter et al. (2014) and Sanz et al. (2018) showed how every variable can be represented in the input space with a real-valued function representing the position of the every sample point in the input space
. This function will be simply addressed as for the rest of the work.
We are interested in the projection of these functions onto the linear subspace of the feature space induced by the kernel. First, we can express the projection of in the feature space through the implicit map as .
In the previous section, we showed how to represent the projection of every mapped sample point into the subspace spanned by the eigenvectors of in Equation (2.1).
Similarly, every function can be further projected from the feature space into the subspace of the kernel PCA.
with the number of kernel PCs.
In order to assess the influence of the -th variable on the coordinates of the data points into the kernel principal axes, we first compute the derivative of with respect to the -th variable at each sample point.
Formally, the partial derivative of the projected curves of computed at the generic point can be defined as follows:
As said, the direction of maximal variation associated with the variable is given by this partial derivative of the projected curve as exploited in (Reverter et al., 2014).
If represents the input variable locally in the kernel PC axes, is the matrix giving the direction and length of the gradient associated with the -th variable for each input point. The mean value of the norm of this partial derivative computed for all the sample points suggests this variable’s influence. Analytically:
Thus, is the mean of the norm vectors of the partial derivative of among all the sample points, giving an indication of the overall influence of the -th variable on the points.
Finally, we can group all the means in a sorted vector representing the ranking of the original features proposed by the method, i.e. . Every entry of is a score that indicates the impact of every variable on the kernel PCA representation of the data, from the most influential to the least important.
The method is non-iterative, and it only requires linear algebra. Thus, it is not susceptible to numerical instability or local minimum problems.
It is computationally very fast, and it can be applied to any kernel function that admits a first-order derivative.
The described procedure has been implemented on R, and the code can be available upon request to the authors.
3 Results
We conducted experiments on three benchmark datasets from the biological domain to assess the accuracy of the proposed unsupervised approach for feature selection. These datasets include two microarray datasets, named Carcinom and Glioma, which are available in the Python package scikit-feature Li et al. (2017) and the gene expression data from normal and prostate tumour tissues Chandran et al. (2007), GPL93 from the GEO, a public functional genomics data repository.
Glioma contains the gene expression of for patients, while Carcinom for individuals. Both datasets have already been used as a benchmark in numerous studies including several methods comparisons, such as Li et al. (2017) and Brouard et al. (2022). Then, the dataset GPL93 contains the expression of genes for patients, and it has been chosen for its complexity and higher dimensionality.
The idea is to compare the proposed methodology KPCA-IG with existing unsupervised feature selection methods from diverse frameworks, as conducted in Li et al. (2017) and Brouard et al. (2022):
-
•
From He et al. (2005), lapl to include one method that relies on the computation of a score
-
•
NDFS Li et al. (2021), to add one of the methods primarily designed for clustering. It is based on the implicit assumption that samples are structured into subgroups and demands the a priori definition of the number of clusters.
-
•
KPCA-permute in Mariette and Villa-Vialaneix (2017) available in the mixKernel R package to include another methodology from the context of kernel PCA.
To evaluate the selected features provided by the four methods, we measured the overall accuracy (ACC) and normalized mutual information (NMI) (Danon et al., 2005) based on k-means cluster performance. For each method, the k-means clustering ACC and NMI have been obtained using several subsets with a different number of selected features, with . Thus, the relevance of the selected values has been estimated according to their ability to reconstruct the clustered nature of the data. More specifically, the three datasets Glioma, Carcinom and GPL93 are characterized by , and groups respectively. Thus, the k-means clustering was computed using the correct number of clusters in the datasets to obtain a metric for the capability of the selected features to keep this nature.
| lapl | NDFS | KPCA-permute | KPCA-IG | |
|---|---|---|---|---|
| Glioma ( | ||||
| ACC(10) | (0.02) | 0.37 (0.04) | 0.48 (0.03) | 0.42 (0.01) |
| NMI(10) | (0.02) | 0.13 (0.03) | 0.31 (0.02) | 0.21 (0.01) |
| ACC(150) | (0.03) | 0.53 (0.04) | 0.54 (0.04) | |
| NMI(150) | (0.02) | 0.41 (0.03) | 0.48 (0.02) | 0.36 (0.05) |
| ACC(300) | 0.54 (0.04) | 0.55 (0.04) | 0.52 (0.03) | (0.05) |
| NMI(300) | (0.03) | 0.41 (0.03) | 0.45 (0.02) | 0.35 (0.05) |
| CPU time | 0.4 | 84.6 | 620.9 | 2.9 |
| Carcinom ( | ||||
| ACC(10) | 0.27 (0.02) | 0.47 (0.04) | 0.48 (0.02) | (0.01) |
| NMI(10) | 0.23 (0.01) | 0.48 (0.03) | 0.43 (0.01) | (0.02) |
| ACC(150) | 0.61 (0.03) | 0.68 (0.04) | 0.67 (0.03) | (0.02) |
| NMI(150) | 0.62 (0.03) | (0.03) | 0.69 (0.03) | 0.70 (0.03) |
| ACC(300) | 0.69 (0.04) | 0.69 (0.04) | (0.048) | 0.69 (0.03) |
| NMI(300) | 0.73 (0.03) | (0.03) | 0.71 (0.03) | 0.70 (0.02) |
| CPU time | 1.4 | 391.8 | 7937.6 | 30.5 |
| GPL93 ( | ||||
| ACC(10) | 0.38 (0.01) | 0.41 (0.01) | (0.01) | 0.40 (0.01) |
| NMI(10) | 0.08 (0.01) | 0.109 (0.07) | 0.11 (0.01) | (0.01) |
| ACC(150) | 0.38 (0.01) | 0.45 (0.01) | (0.02) | 0.58 (0.01) |
| NMI(150) | 0.07 (0.01) | 0.18 (0.02) | (0.01) | 0.29 (0.01) |
| ACC(300) | 0.37 (0.01) | 0.49 (0.03) | 0.56 (0.05) | (0.01) |
| NMI(300) | 0.07 (0.01) | 0.22 (0.02) | 0.22 (0.01) | (0.01) |
| CPU time | 2.1 | 1277.4 | 17691.4 | 39.8 |
Note that only the NDFS method is implemented to explicitly obtain an optimum solution in terms of clustering, also requiring in advance the number of groups in the data. For each method, the k-means clustering was run 20 times to obtain a mean of the overall accuracy and normalized mutual information for each of the subsets of selected features. Both our novel method KPCA-IG and KPCA-permute have been employed with a Gaussian kernel with a sigma value depending on the dataset. The selected features are, in both cases, based on the first 3, 5 and 3 kernel PC axes for Glioma, Carcinom and GPL93, respectively. The CPU time in seconds required to obtain the feature ranking for all the methods has also been observed. The experiment was conducted on a standard laptop Intel Core with RAM.
3.1 Evaluation on benchmarks datasets
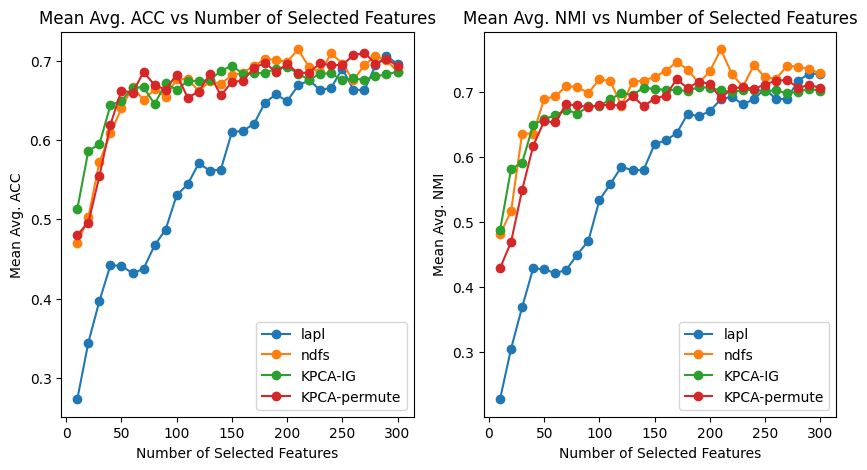
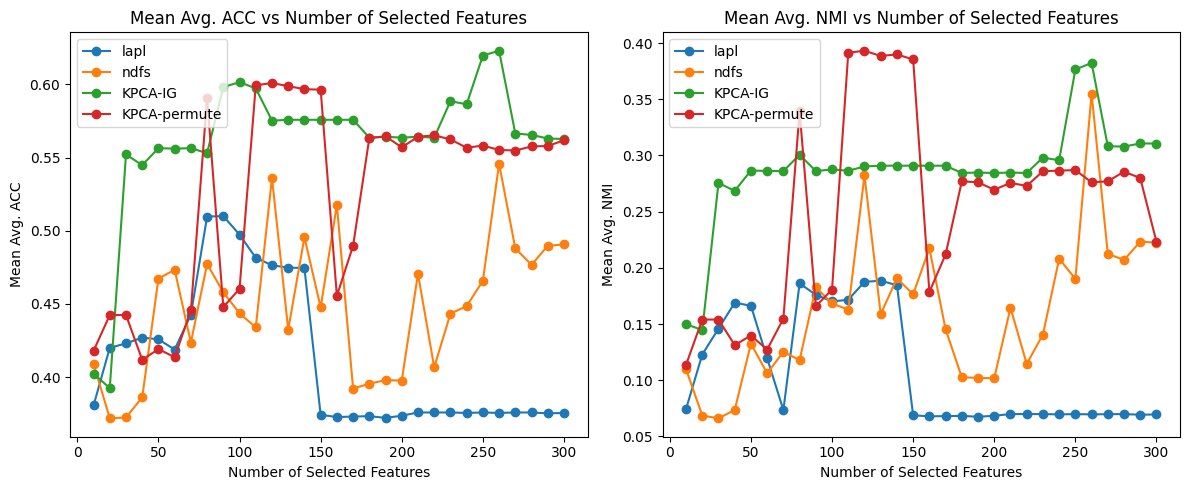
In Table 1, we can see the results in terms of mean Accuracy and NMI over runs for different numbers of retained features . For the first dataset Glioma lapl seems to show the best performance in terms of NMI and AUC, except when where the Accuracy obtained with KPCA-IG is the highest, even if all the methods seem to behave very similarly in terms of ACC. Analyzing the results for the other two datasets Carcinom and GPL93 that are considerably bigger and possibly more complex in terms of sample space manifold, the two methods based on the kernel framework exhibit to surpass the lapl and NDFS approaches, especially in the GPL93 datasets. The comparison of the different approaches in terms of NMI and ACC of these two datasets can also be observed in Figure 1 and Figure 2.
Moreover, as shown in Brouard et al. (2022) NDFS and the other cluster-based methods like MCFS and UDFS suffer if the user selects an incorrect decision for the a priori number of clusters. In our case, we show that the proposed methodology behaves similarly or even better to a method like NDFS that is specifically optimized for this cluster setting.
The two kernel-based approaches, namely KPCA-permute and our novel method KPCA-IG, reveal an excellent performance in this setting, once again displaying the appropriateness of the kernel framework in the context of complex biological datasets. However, KPCA-IG can provide these above-average performances with a considerably lower CPU time.
Only lapl seems as fast as KPCA-IG while showing poorer results in the more complex scenario represented in this case by the GPL93 dataset. Other methods, such as the concrete autoencoder in Abid et al. (2019), have proven successful in this context. The results obtained with the concrete autoencoder, as demonstrated in Brouard et al. (2022), were comparable or even inferior in terms of accuracy and NMI. Furthermore, the computational time required to achieve these results was on the order of days. As a result, we opted not to include it in our simulations.
4 Application on Hepatocellular carcinoma dataset
Liver cancer is a global health challenge, and it is estimated that there will be over million cases by . Hepatocellular carcinoma (HCC) is the most common type of liver cancer, accounting for around of cases (Llovet et al., 2021). The most significant risk factors associated with HCC are, among others, chronic hepatitis B and C infections, nonalcoholic fatty disease, and chronic alcohol abuse (Morse et al., 2019). To analyse the use of the KPCA-IG method, we used the expression profiling by array of an HCC dataset from the Gene expression Omnibus (series GSE102079).
It contains the gene expression microarray profiles of groups of patients. First, patients with HCC who were treated with hepatic resection between and at Tokyo Medical and Dental University Hospital. Then, the gene expression of normal liver tissues of patients as control (Chiyonobu et al., 2018). The third group contains the gene expression of patients with liver cancer but of non-tumorous liver tissue. The total expression matrix for the patients contains the expression of genes, and the data has been normalised by robust multichip analysis (RMA) as in Gautier et al. (2004) and scaled and centered before applying KPCA. To show the potentiality of KPCA-IG, we first perform kernel PCA with radial basis kernel with , which was set heuristically to maximize the explained variance and obtain a clear two dimension data representation.
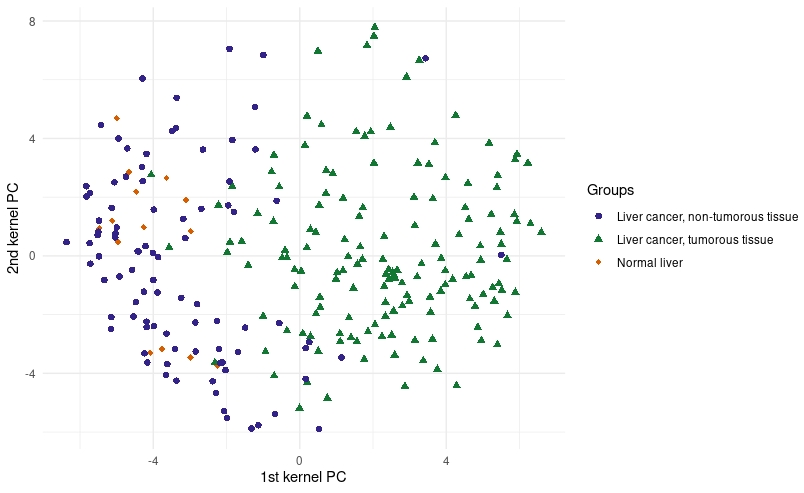
In Figure 3, it is possible to see the application of kernel Principal Component on the HCC dataset. Even if detecting groups is not the optimization criterion of kernel PCA, it is possible to see that the algorithm catches the dataset’s clustered structure. For this reason, applying a method like the proposed KPCA-IG can enlighten the kernel component axes, possibly giving an interpretation of the genes’ influence on the sample points representation. The KPCA-IG provides a feature ranking based on the KPCA solution, in this case, based on the first kernel Principal Components.
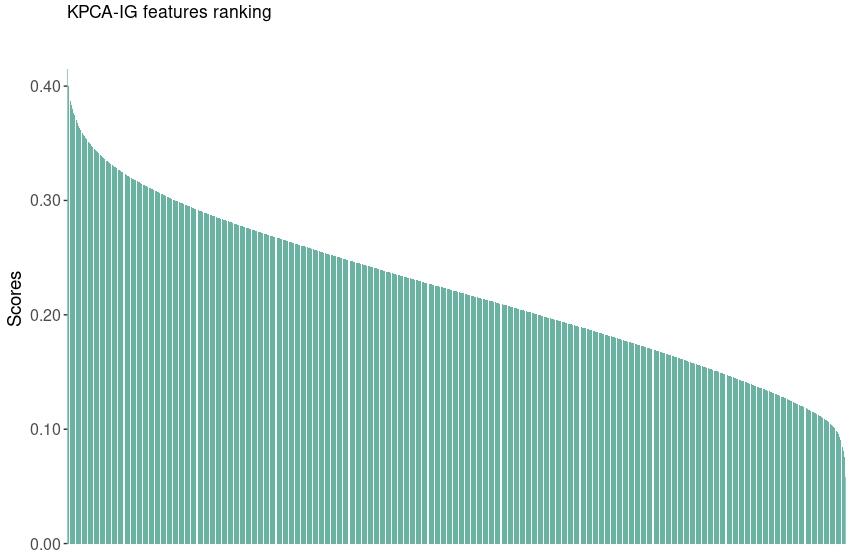
As mentioned before, one of the main advantages of the proposed method is the fast computational time required, as with this high-dimensional dataset, the CPU time was seconds. Table 2 presents the first genes and Figure 4 the distribution of the variables scores.
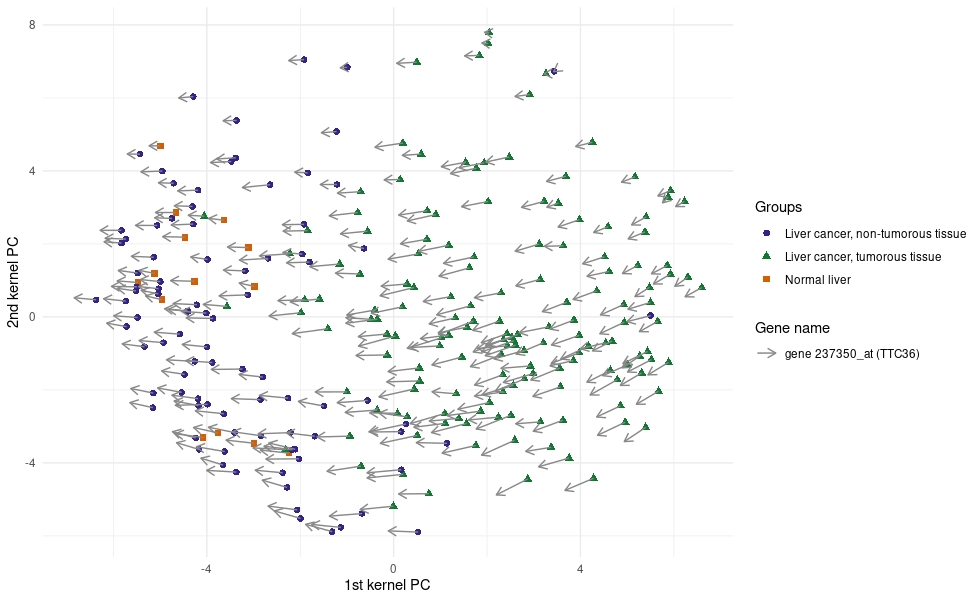
One possible way to assess the relevance of the obtained ranking is first to visualize the genes with the method proposed by Reverter et al. (2014) to see if the bio-medical community has already found the retained genes. For instance, Figure 5 displays the representation of the variable 237350_at (TTC36), the second gene in the ranking provided by KPCA-IG. The direction of the arrows suggests an upper expression of the gene towards the cluster of patients that do not have liver cancer or patients whose liver tissue is not tumorous.
| Genes | Score | Symbol |
|---|---|---|
| 1555797_a_at | 0.427972 | ARPC5 |
| 237350_at | 0.426140 | TTC36 |
| 1559573_at | 0.424048 | LINC01093 |
| 230478_at | 0.420690 | OIT3 |
| 203213_at | 0.417682 | CDK1 |
| 205019_s_at | 0.417597 | VIPR1 |
| 1559065_a_at | 0.417234 | CLEC4G |
| 205984_at | 0.417234 | CRHBP |
| 220114_s_at | 0.416410 | STAB2 |
| 202604_x_at | 0.416228 | ADAM10 |
| 220496_at | 0.415608 | CLEC1B |
| 205866_at | 0.414893 | FCN3 |
| 214895_s_at | 0.414887 | ADAM10 |
| 240963_x_at | 0.413698 | PLXDC1 |
| 234304_s_at | 0.413574 | IPO11 |
| 222077_s_at | 0.412939 | RACGAP1 |
| 223341_s_at | 0.411044 | SCOC |
| 214710_s_at | 0.410616 | CCNB1 |
| 218009_s_at | 0.410610 | PRC1 |
| 219918_s_at | 0.410460 | ASPM |
| 226524_at | 0.410119 | C3orf38 |
| 201890_at | 0.410097 | RRM2 |
| 207804_s_at | 0.409962 | FCN2 |
| 210481_s_at | 0.409839 | CLEC4M |
| 209470_s_at | 0.409759 | GPM6A |
| … | … | |
| 229461_x_at | 0.0520878 | NEGR1 |
| 230538_at | 0.0520119 | SHC4 |
| 206145_at | 0.0507935 | RHAG |
To validate the procedure, we selected relevant literature about the gene TTC36. This gene, also known as HBP21, is a protein encoder gene. It has been shown that this gene’s encoded protein may function as a tumour suppressor in hepatocellular carcinoma (HCC) since it promotes apoptosis while it has been proven to be downregulated in HCC cases (Jiang et al., 2015).
Another gene that shows differential expression in the two groups is 203213_at (CDK1). In this case, Figure 6 suggests that this gene seems to be upregulated in the presence of cancer tissue.
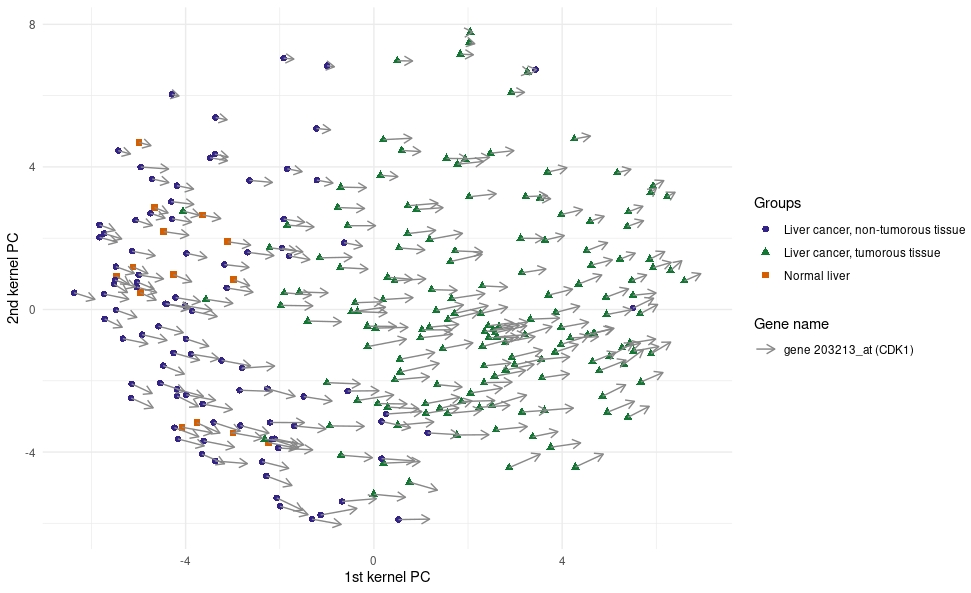
The indication found in multiple studies is that the increased expression of this gene is indeed linked with a poorer prognosis or outcome, such as high tumour grade, invasion of lymphovascular or muscularis propria, and the presence of distant metastasis Heo et al. (2022), Li et al. (2020), Sofi et al. (2022), Li et al. (2020). Liu et al. (2022).
In the same way, another of the most critical genes, according to KPCA-IG, that seems to be prominent in the case of an HCC patient reflecting the same indication in the medical literature, is (ADAM10), known to be involved in the RIPing and shedding of numerous substrates leading to cancer progression and inflammatory disease Krzystanek et al. (2016), and indicated as a target for cancer therapy Moss et al. (2008), Crawford et al. (2009), while being upregulated in metastasis cancers
Lee et al. (2010), Gavert et al. (2007).
Rac GTPase activating protein gene RACGAP1 (222077_s_at) selected by KPCA-IG shares a similar behaviour with ADAM10 and CDK1. The literature concerning this gene is also broad, where it has been marked as a potential prognostic and immunological biomarker in different types of cancer, such as gastric cancer Saigusa et al. (2014), uterine carcinosarcoma Mi et al. (2016), breast cancer Pliarchopoulou
et al. (2012) or colorectal cancer Imaoka et al. (2015) among many others.
CCNB1 (202604_x_at) has also been indicated to be an oncogenic factor in the proliferation of HCC cells Chai et al. (2018), showing a significant impact on the patient’s survival time Ding et al. (2014), Zhuang et al. (2018) and thus has been targeted for cancer treatments Fang et al. (2014). PRC1 has revealed upper expression in other cancer tissues such as, among others, invasive cervical carcinomas Santin et al. (2005), papillary renal cell carcinoma Yang et al. (2005),
pediatric adrenocortical tumour West et al. (2007), while yet not being studied in depth as compared to CCNB1, ADAM10 or RACGAP1.
ASPM (219918_s_at) was known initially as a gene involved in the control of the human brain development and in the cerebral cortical size Zhang (2003), Bond et al. (2002) whose mutations may lead to primary autosomal recessive microcephaly Kouprina et al. (2005), more recently its overexpression has also been linked with tumour progression as in Wang et al. (2013), Xu et al. (2018).
Lastly, for the group of upregulated genes in HCC, RRM2 (201890_at) has also been linked with low overall survival Chen et al. (2019), Jin et al. (2020),
leading to exhaustive cancer research suggesting targeting its inhibition for different types of tumour treatments Rahman et al. (2012),Wang et al. (2014), Osako et al. (2019), Ohmura et al. (2021).
On the other hand, the selected genes that manifest down-regulation in cancerous HCC tissues are LINC01093, OIT3, VIPR1, CLEC4G, CRHBP, STAB2, CLEC1B, FCN3, FCN2 and CLEC4M.
The literature regarding these genes indicates that they work as suppressors in different cancerous situations, once again endorsing the selection provided by KPCA-IG for the upregulated genes.
The few genes in the first 25 selected by KPCA-IG that do not exhibit differential expression using Reverter et al. (2014) method (ARPC5, IPO11, C3orf38, SCOC) are potential genes that explain much variability in the data or that share a possibly nonlinear interaction with the differential expressed genes. Since the ultimate goal of KPCA is not to discriminate groups, it is expected that some of the variables found by the novel method are not linked with a classification benefit. However, further follow-up on the function of these genes may be done in cooperation with an expert in the field.
5 Conclusion
We have seen how the unsupervised feature selection literature is narrower than its supervised counterpart. Moreover, algorithms that use the kernel Principal Component Analysis for feature selection are reduced to a few works.
In the present work, we have introduced a novel method to enhance variables’ interpretability in kernel PCA. Using benchmark datasets, we have proven the comparability in terms of accuracy with already existing and recognized methods, where the efficiency of KPCA-IG has proven to be competitive. The application on the real-life Hepatocellular carcinoma dataset and the validation obtained from the comparison of the selected variables by the method with the bio-medical literature have confirmed the effectiveness and strengths of the proposed methodology.
In future works, further in-depth analysis will be realized to assess the impact of the choice of the kernel function on the feature ranking obtained by KPCA-IG. Moreover, the method will be adapted to other linear algorithms that are solely based on dot-products hence supporting a kernelized version, such as kernel Discriminant Analysis or kernel Partial Least-Squares Discriminant Analysis.
Abbreviations
KPCA: Kernel principal component analysis; KPCA-IG: Kernel principal component analysis Interpretable Gradient; HCC: Hepatocellular carcinoma; SPEC: Spectral Feature Selection; MCFS: Multi-Cluster Feature Selection; NDFS: Nonnegative Discriminative Feature Selection; UDFS: Unsupervised Discriminative Feature Selection; CPFS: Convex Principal Feature Selection; lapl: Laplacian score
Funding
This work was funded by e-MUSE MSCA-ITN-2020 European Training Network under the Marie Sklodowska-Curie grant agreement No 956126. The funding did not influence the study’s design, the interpretation of data, or the writing of the manuscript.
Availability of data and materials
Glioma and Carcinoma datasets are freely available at https://github.com/jundongl/scikit-feature/tree/master/skfeature/data,
GPL93 is freely available at https://www.ncbi.nlm.nih.gov/geo/query/acc.cgi?acc=GPL93
HCC datatset is freely available at https://www.ncbi.nlm.nih.gov/geo/query/acc.cgi?acc=GSE102079
References
- Abid et al. (2019) Abid, A., Balin, M.F., Zou, J.: Concrete Autoencoders for Differentiable Feature Selection and Reconstruction. arXiv (2019). doi:10.48550/ARXIV.1901.09346. https://arxiv.org/abs/1901.09346
- Bach and Jordan (2003) Bach, F., Jordan, M.: Kernel independent component analysis. Journal of Machine Learning Research 3, 1–48 (2003). doi:10.1162/153244303768966085
- Bond et al. (2002) Bond, J., Roberts, E., Mochida, G.H., Hampshire, D.J., Scott, S., Askham, J.M., Springell, K., Mahadevan, M., Crow, Y.J., Markham, A.F., Walsh, C.A., Woods, C.G.: ASPM is a major determinant of cerebral cortical size. Nature Genetics 32(2), 316–320 (2002). doi:10.1038/ng995
- Brouard et al. (2022) Brouard, C., Mariette, J., Flamary, R., Vialaneix, N.: Feature selection for kernel methods in systems biology. NAR Genomics and Bioinformatics 4(1) (2022). doi:10.1093/nargab/lqac014
- Cai et al. (2010) Cai, D., Zhang, C., He, X.: Unsupervised feature selection for multi-cluster data. Proceedings of the 16th ACM SIGKDD international conference on Knowledge discovery and data mining (2010)
- Chai et al. (2018) Chai, N., Xie, H.-h., Yin, J.-p., Sa, K.-d., Guo, Y., Wang, M., Liu, J., Zhang, X.-f., Zhang, X., Yin, H., Nie, Y.-z., Wu, K.-c., Yang, A.-g., Zhang, R.: FOXM1 promotes proliferation in human hepatocellular carcinoma cells by transcriptional activation of CCNB1. Biochemical and Biophysical Research Communications 500(4), 924–929 (2018). doi:10.1016/j.bbrc.2018.04.201
- Chandran et al. (2007) Chandran, U.R., Ma, C., Dhir, R., Bisceglia, M., Lyons-Weiler, M., Liang, W., Michalopoulos, G., Becich, M., Monzon, F.A.: Gene expression profiles of prostate cancer reveal involvement of multiple molecular pathways in the metastatic process. BMC Cancer 7(1) (2007). doi:10.1186/1471-2407-7-64
- Chen et al. (2019) Chen, W., Yang, L.-g., Xu, L.-y., Cheng, L., Qian, Q., Sun, L., Zhu, Y.-l.: Bioinformatics analysis revealing prognostic significance of rrm2 gene in breast cancer. Bioscience Reports 39(4) (2019). doi:10.1042/bsr20182062
- Chiyonobu et al. (2018) Chiyonobu, N., Shimada, S., Akiyama, Y., Mogushi, K., Itoh, M., Akahoshi, K., Matsumura, S., Ogawa, K., Ono, H., Mitsunori, Y., Ban, D., Kudo, A., Arii, S., Suganami, T., Yamaoka, S., Ogawa, Y., Tanabe, M., Tanaka, S.: Fatty acid binding protein 4 (FABP4) overexpression in intratumoral hepatic stellate cells within hepatocellular carcinoma with metabolic risk factors. The American Journal of Pathology 188(5), 1213–1224 (2018). doi:10.1016/j.ajpath.2018.01.012
- Crawford et al. (2009) Crawford, H., Dempsey, P., Brown, G., Adam, L., Moss, M.: ADAM10 as a therapeutic target for cancer and inflammation. Current Pharmaceutical Design 15(20), 2288–2299 (2009). doi:10.2174/138161209788682442
- Crone and Crosby (1995) Crone, L.J., Crosby, D.S.: Statistical applications of a metric on subspaces to satellite meteorology. Technometrics 37(3), 324–328 (1995). doi:10.1080/00401706.1995.10484338
- Danon et al. (2005) Danon, L., Duch, J., Diaz-Guilera, A., Arenas, A.: Comparing community structure identification (2005). doi:10.48550/ARXIV.COND-MAT/0505245
- Ding et al. (2014) Ding, K., Li, W., Zou, Z., Zou, X., Wang, C.: CCNB1 is a prognostic biomarker for ER+ breast cancer. Medical Hypotheses 83(3), 359–364 (2014). doi:10.1016/j.mehy.2014.06.013
- Duda et al. (2000) Duda, R.O., Hart, P.E., Stork, D.G., 2nd edn. (2000)
- Fang et al. (2014) Fang, Y., Yu, H., Liang, X., Xu, J., Cai, X.: Chk1-induced CCNB1 overexpression promotes cell proliferation and tumor growth in human colorectal cancer. Cancer Biology & Therapy 15(9), 1268–1279 (2014). doi:10.4161/cbt.29691
- Gautier et al. (2004) Gautier, L., Cope, L., Bolstad, B.M., Irizarry, R.A.: affy—analysis of Affymetrix GeneChip data at the probe level. Bioinformatics 20(3), 307–315 (2004). doi:10.1093/bioinformatics/btg405
- Gavert et al. (2007) Gavert, N., Sheffer, M., Raveh, S., Spaderna, S., Shtutman, M., Brabletz, T., Barany, F., Paty, P., Notterman, D., Domany, E., Ben-Ze'ev, A.: Expression of l1-CAM and ADAM10 in human colon cancer cells induces metastasis. Cancer Research 67(16), 7703–7712 (2007). doi:10.1158/0008-5472.can-07-0991
- Girolami (2002) Girolami, M.: Mercer kernel-based clustering in feature space. IEEE Transactions on Neural Networks 13(3), 780–784 (2002). doi:10.1109/tnn.2002.1000150
- Hastie et al. (2009) Hastie, T., Tibshirani, R., Friedman, J.H.: The Elements of Statistical Learning: Data Mining, Inference, and Prediction. Springer series in statistics, (2009). https://books.google.co.uk/books?id=eBSgoAEACAAJ
- He et al. (2005) He, X., Cai, D., Niyogi, P.: Laplacian score for feature selection. In: Proceedings of the 18th International Conference on Neural Information Processing Systems. NIPS’05, pp. 507–514. MIT Press, Cambridge, MA, USA (2005)
- Heo et al. (2022) Heo, J., Lee, J., Nam, Y.J., Kim, Y., Yun, H., Lee, S., Ju, H., Ryu, C.-M., Jeong, S.M., Lee, J., Lim, J., Cho, Y.M., Jeong, E.M., Hong, B., Son, J., Shin, D.-M.: The CDK1/TFCP2l1/ID2 cascade offers a novel combination therapy strategy in a preclinical model of bladder cancer. Experimental & Molecular Medicine 54(6), 801–811 (2022). doi:10.1038/s12276-022-00786-0
- Huang et al. (2011) Huang, D., Tian, Y., De la Torre, F.: Local isomorphism to solve the pre-image problem in kernel methods. In: CVPR 2011, pp. 2761–2768 (2011). doi:10.1109/CVPR.2011.5995685
- Imaoka et al. (2015) Imaoka, H., Toiyama, Y., Saigusa, S., Kawamura, M., Kawamoto, A., Okugawa, Y., Hiro, J., Tanaka, K., Inoue, Y., Mohri, Y., Kusunoki, M.: RacGAP1 expression, increasing tumor malignant potential, as a predictive biomarker for lymph node metastasis and poor prognosis in colorectal cancer. Carcinogenesis 36(3), 346–354 (2015). doi:10.1093/carcin/bgu327
- Jiang et al. (2015) Jiang, L., Kwong, D.L.-W., Li, Y., Liu, M., Yuan, Y.-F., Li, Y., Fu, L., Guan, X.-Y.: HBP21, a chaperone of heat shock protein 70, functions as a tumor suppressor in hepatocellular carcinoma. Carcinogenesis 36(10), 1111–1120 (2015). doi:10.1093/carcin/bgv116
- Jin et al. (2020) Jin, C.-Y., Du, L., Nuerlan, A.-H., Wang, X.-L., Yang, Y.-W., Guo, R.: High expression of RRM2 as an independent predictive factor of poor prognosis in patients with lung adenocarcinoma. Aging 13(3), 3518–3535 (2020). doi:10.18632/aging.202292
- Johnson et al. (2020) Johnson, J.E., Laparra, V., Pérez-Suay, A., Mahecha, M.D., Camps-Valls, G.: Kernel methods and their derivatives: Concept and perspectives for the earth system sciences. PLOS ONE 15(10), 0235885 (2020). doi:10.1371/journal.pone.0235885
- Kouprina et al. (2005) Kouprina, N., Pavlicek, A., Collins, N.K., Nakano, M., Noskov, V.N., Ohzeki, J.-I., Mochida, G.H., Risinger, J.I., Goldsmith, P., Gunsior, M., Solomon, G., Gersch, W., Kim, J.-H., Barrett, J.C., Walsh, C.A., Jurka, J., Masumoto, H., Larionov, V.: The microcephaly ASPM gene is expressed in proliferating tissues and encodes for a mitotic spindle protein. Human Molecular Genetics 14(15), 2155–2165 (2005). doi:10.1093/hmg/ddi220
- Krzystanek et al. (2016) Krzystanek, M., Moldvay, J., Szüts, D., Szallasi, Z., Eklund, A.C.: A robust prognostic gene expression signature for early stage lung adenocarcinoma. Biomarker Research 4(1) (2016). doi:10.1186/s40364-016-0058-3
- Kwok and Tsang (2004) Kwok, J.T.-Y., Tsang, I.W.-H.: The pre-image problem in kernel methods. IEEE Transactions on Neural Networks 15(6), 1517–1525 (2004). doi:10.1109/tnn.2004.837781
- Lee et al. (2010) Lee, S.B., Schramme, A., Doberstein, K., Dummer, R., Abdel-Bakky, M.S., Keller, S., Altevogt, P., Oh, S.T., Reichrath, J., Oxmann, D., Pfeilschifter, J., Mihic-Probst, D., Gutwein, P.: ADAM10 is upregulated in melanoma metastasis compared with primary melanoma. Journal of Investigative Dermatology 130(3), 763–773 (2010). doi:10.1038/jid.2009.335
- Li et al. (2020) Li, J., Wang, Y., Wang, X., Yang, Q.: CDK1 and CDC20 overexpression in patients with colorectal cancer are associated with poor prognosis: evidence from integrated bioinformatics analysis. World Journal of Surgical Oncology 18(1) (2020). doi:10.1186/s12957-020-01817-8
- Li et al. (2017) Li, J., Cheng, K., Wang, S., Morstatter, F., Trevino, R.P., Tang, J., Liu, H.: Feature selection feature selection: a data perspective. ACM Computing Surveys 50(6), 1–45 (2017). doi:10.1145/3136625
- Li et al. (2020) Li, M., He, F., Zhang, Z., Xiang, Z., Hu, D.: CDK1 serves as a potential prognostic biomarker and target for lung cancer. Journal of International Medical Research 48(2), 030006051989750 (2020). doi:10.1177/0300060519897508
- Li et al. (2021) Li, Z., Yang, Y., Liu, J., Zhou, X., Lu, H.: Unsupervised feature selection using nonnegative spectral analysis. Proceedings of the AAAI Conference on Artificial Intelligence 26(1), 1026–1032 (2021). doi:10.1609/aaai.v26i1.8289
- Liu et al. (2022) Liu, X., Wu, H., Liu, Z.: An integrative human pan-cancer analysis of cyclin-dependent kinase 1 (CDK1). Cancers 14(11), 2658 (2022). doi:10.3390/cancers14112658
- Llovet et al. (2021) Llovet, J.M., Kelley, R.K., Villanueva, A., Singal, A.G., Pikarsky, E., Roayaie, S., Lencioni, R., Koike, K., Zucman-Rossi, J., Finn, R.S.: Hepatocellular carcinoma. Nature Reviews Disease Primers 7(1) (2021). doi:10.1038/s41572-020-00240-3
- Mariette and Villa-Vialaneix (2017) Mariette, J., Villa-Vialaneix, N.: Unsupervised multiple kernel learning for heterogeneous data integration. Bioinformatics 34(6), 1009–1015 (2017). doi:10.1093/bioinformatics/btx682
- Masaeli et al. (2010) Masaeli, M., Yan, Y., Cui, Y., Fung, G., Dy, J.G.: Convex principal feature selection. In: SDM (2010)
- Mi et al. (2016) Mi, S., Lin, M., Brouwer-Visser, J., Heim, J., Smotkin, D., Hebert, T., Gunter, M.J., Goldberg, G.L., Zheng, D., Huang, G.S.: RNA-seq identification of RACGAP1 as a metastatic driver in uterine carcinosarcoma. Clinical Cancer Research 22(18), 4676–4686 (2016). doi:10.1158/1078-0432.ccr-15-2116
- Mika et al. (1998) Mika, S., Schölkopf, B., Smola, A., Müller, K.-R., Scholz, M., Rätsch, G.: Kernel pca and de-noising in feature spaces. In: NIPS (1998)
- Morse et al. (2019) Morse, M.A., Sun, W., Kim, R., He, A.R., Abada, P.B., Mynderse, M., Finn, R.S.: The role of angiogenesis in hepatocellular carcinoma. Clinical Cancer Research 25(3), 912–920 (2019). doi:10.1158/1078-0432.ccr-18-1254
- Moss et al. (2008) Moss, M., Stoeck, A., Yan, W., Dempsey, P.: ADAM10 as a target for anti-cancer therapy. Current Pharmaceutical Biotechnology 9(1), 2–8 (2008). doi:10.2174/138920108783497613
- Ohmura et al. (2021) Ohmura, S., Marchetto, A., Orth, M.F., Li, J., Jabar, S., Ranft, A., Vinca, E., Ceranski, K., Carreño-Gonzalez, M.J., Romero-Pérez, L., Wehweck, F.S., Musa, J., Bestvater, F., Knott, M.M.L., Hölting, T.L.B., Hartmann, W., Dirksen, U., Kirchner, T., Cidre-Aranaz, F., Grünewald, T.G.P.: Translational evidence for RRM2 as a prognostic biomarker and therapeutic target in ewing sarcoma. Molecular Cancer 20(1) (2021). doi:10.1186/s12943-021-01393-9
- Osako et al. (2019) Osako, Y., Yoshino, H., Sakaguchi, T., Sugita, S., Yonemori, M., Nakagawa, M., Enokida, H.: Potential tumor-suppressive role of microRNA-99a-3p in sunitinib-resistant renal cell carcinoma cells through the regulation of RRM2. International Journal of Oncology (2019). doi:10.3892/ijo.2019.4736
- Pliarchopoulou et al. (2012) Pliarchopoulou, K., Kalogeras, K.T., Kronenwett, R., Wirtz, R.M., Eleftheraki, A.G., Batistatou, A., Bobos, M., Soupos, N., Polychronidou, G., Gogas, H., Samantas, E., Christodoulou, C., Makatsoris, T., Pavlidis, N., Pectasides, D., Fountzilas, G.: Prognostic significance of RACGAP1 mRNA expression in high-risk early breast cancer: a study in primary tumors of breast cancer patients participating in a randomized hellenic cooperative oncology group trial. Cancer Chemotherapy and Pharmacology 71(1), 245–255 (2012). doi:10.1007/s00280-012-2002-z
- Rahman et al. (2012) Rahman, M.A., Amin, A.R.M.R., Wang, X., Zuckerman, J.E., Choi, C.H.J., Zhou, B., Wang, D., Nannapaneni, S., Koenig, L., Chen, Z., Chen, Z.G., Yen, Y., Davis, M.E., Shin, D.M.: Systemic delivery of siRNA nanoparticles targeting RRM2 suppresses head and neck tumor growth. Journal of Controlled Release 159(3), 384–392 (2012). doi:10.1016/j.jconrel.2012.01.045
- Rasmussen et al. (2011) Rasmussen, P.M., Madsen, K.H., Lund, T.E., Hansen, L.K.: Visualization of nonlinear kernel models in neuroimaging by sensitivity maps. NeuroImage 55(3), 1120–1131 (2011). doi:10.1016/j.neuroimage.2010.12.035
- Reverter et al. (2014) Reverter, F., Vegas, E., Oller, J.M.: Kernel-PCA data integration with enhanced interpretability. BMC Systems Biology 8(S2) (2014). doi:10.1186/1752-0509-8-s2-s6
- Roth and Steinhage (1999) Roth, V., Steinhage, V.: Nonlinear discriminant analysis using kernel functions. In: NIPS, pp. 568–574 (1999). http://papers.nips.cc/paper/1736-nonlinear-discriminant-analysis-using-kernel-functions
- Ruder (2016) Ruder, S.: An overview of gradient descent optimization algorithms. arXiv (2016). doi:10.48550/ARXIV.1609.04747. https://arxiv.org/abs/1609.04747
- Saigusa et al. (2014) Saigusa, S., Tanaka, K., Mohri, Y., Ohi, M., Shimura, T., Kitajima, T., Kondo, S., Okugawa, Y., Toiyama, Y., Inoue, Y., Kusunoki, M.: Clinical significance of RacGAP1 expression at the invasive front of gastric cancer. Gastric Cancer 18(1), 84–92 (2014). doi:10.1007/s10120-014-0355-1
- Santin et al. (2005) Santin, A.D., Zhan, F., Bignotti, E., Siegel, E.R., Cané, S., Bellone, S., Palmieri, M., Anfossi, S., Thomas, M., Burnett, A., Kay, H.H., Roman, J.J., O'Brien, T.J., Tian, E., Cannon, M.J., Shaughnessy, J., Pecorelli, S.: Gene expression profiles of primary HPV16- and HPV18-infected early stage cervical cancers and normal cervical epithelium: identification of novel candidate molecular markers for cervical cancer diagnosis and therapy. Virology 331(2), 269–291 (2005). doi:10.1016/j.virol.2004.09.045
- Sanz et al. (2018) Sanz, H., Valim, C., Vegas, E., Oller, J.M., Reverter, F.: SVM-RFE: selection and visualization of the most relevant features through non-linear kernels. BMC Bioinformatics 19(1) (2018). doi:10.1186/s12859-018-2451-4
- Schölkopf et al. (1998) Schölkopf, B., Knirsch, P., Smola, A., Burges, C.: Fast approximation of support vector kernel expansions, and an interpretation of clustering as approximation in feature spaces. In: Mustererkennung 1998. Informatik aktuell, pp. 125–132. Springer, Berlin, Germany (1998). Max-Planck-Gesellschaft
- Schölkopf et al. (1997) Schölkopf, B., Smola, A., Müller, K.-R.: Kernel principal component analysis. In: Artificial Neural Networks — ICANN’97, pp. 583–588. Springer, Berlin, Heidelberg (1997)
- Schölkopf et al. (2003) Schölkopf, B., Tsuda, K., Vert, J.-P.: Kernel methods in computational biology. (2003)
- Sofi et al. (2022) Sofi, S., Mehraj, U., Qayoom, H., Aisha, S., Almilaibary, A., Alkhanani, M., Mir, M.A.: Targeting cyclin-dependent kinase 1 (CDK1) in cancer: molecular docking and dynamic simulations of potential CDK1 inhibitors. Medical Oncology 39(9) (2022). doi:10.1007/s12032-022-01748-2
- Wang et al. (2014) Wang, N., Zhan, T., Ke, T., Huang, X., Ke, D., Wang, Q., Li, H.: Increased expression of RRM2 by human papillomavirus e7 oncoprotein promotes angiogenesis in cervical cancer. British Journal of Cancer 110(4), 1034–1044 (2014). doi:10.1038/bjc.2013.817
- Wang et al. (2013) Wang, W., Hsu, C., Wang, T., Li, C., Hou, Y., Chu, J., Lee, C., Liu, M., Su, J.J.–., Jian, K., Huang, S., Jiang, S., Shan, Y., Lin, P., Shen, Y., Lee, M.T.–., Chan, T., Chang, C., Chen, C., Chang, I., Lee, Y., Chen, L., Tsai, K.K.: A gene expression signature of epithelial tubulogenesis and a role for ASPM in pancreatic tumor progression. Gastroenterology 145(5), 1110–1120 (2013). doi:10.1053/j.gastro.2013.07.040
- West et al. (2007) West, A.N., Neale, G.A., Pounds, S., Figueredo, B.C., Galindo, C.R., Pianovski, M.A.D., Filho, A.G.O., Malkin, D., Lalli, E., Ribeiro, R., Zambetti, G.P.: Gene expression profiling of childhood adrenocortical tumors. Cancer Research 67(2), 600–608 (2007). doi:10.1158/0008-5472.can-06-3767
- Xu et al. (2018) Xu, Z., Zhang, Q., Luh, F., Jin, B., Liu, X.: Overexpression of the ASPM gene is associated with aggressiveness and poor outcome in bladder cancer. Oncology Letters (2018). doi:10.3892/ol.2018.9762
- Yang et al. (2005) Yang, X.J., Tan, M.-H., Kim, H.L., Ditlev, J.A., Betten, M.W., Png, C.E., Kort, E.J., Futami, K., Furge, K.A., Takahashi, M., Kanayama, H.-o., Tan, P.H., Teh, B.S., Luan, C., Wang, K., Pins, M., Tretiakova, M., Anema, J., Kahnoski, R., Nicol, T., Stadler, W., Vogelzang, N.G., Amato, R., Seligson, D., Figlin, R., Belldegrun, A., Rogers, C.G., Teh, B.T.: A molecular classification of papillary renal cell carcinoma. Cancer Research 65(13), 5628–5637 (2005). doi:10.1158/0008-5472.can-05-0533
- Yang et al. (2011) Yang, Y., Shen, H.T., Ma, Z., Huang, Z., Zhou, X.: l2, 1-norm regularized discriminative feature selection for unsupervised learning. In: International Joint Conference on Artificial Intelligence (2011)
- Zhang (2003) Zhang, J.: Evolution of the human aspm gene, a major determinant of brain size. Genetics 165(4), 2063–2070 (2003). doi:10.1093/genetics/165.4.2063
- Zhao and Liu (2007) Zhao, Z., Liu, H.: Spectral feature selection for supervised and unsupervised learning. In: Proceedings of the 24th International Conference on Machine Learning. ICML ’07, pp. 1151–1157. Association for Computing Machinery, New York, NY, USA (2007). doi:10.1145/1273496.1273641
- Zhuang et al. (2018) Zhuang, L., Yang, Z., Meng, Z.: Upregulation of BUB1b, CCNB1, CDC7, CDC20, and MCM3 in tumor tissues predicted worse overall survival and disease-free survival in hepatocellular carcinoma patients. BioMed Research International 2018, 1–8 (2018). doi:10.1155/2018/7897346