Distribution and Kinematics of H I through Raman He II Spectroscopy of NGC 6302
Abstract
The young planetary nebula NGC 6302 is known to exhibit Raman-scattered He II features at 6545 Å and 4851 Å. These features are formed through inelastic scattering of He II 1025 and 972 with hydrogen atoms in the ground state, for which the cross sections are and , respectively. We investigate the spectrum of NGC 6302 archived in the ESO Science Portal. Our Gaussian line fitting analysis shows that the Raman-scattered He II features are broader and more redshifted than the hypothetical model Raman features that would be formed in a cold static H I medium. We adopt a simple scattering geometry consisting of a compact He II emission region surrounded by a H I medium to perform Monte Carlo simulations using the radiative transfer code STaRS. Our simulations show that the H I region is characterized by the H I column density with the random speed component expanding with a speed from the He II emission region. Based on our best fit parameters, we estimate the H I mass of the neutral medium , pointing out the usefulness of Raman He II spectroscopy as a tool to trace H I components.
1 Introduction
NGC 6302 is a young planetary nebula exhibiting a well-known butterfly morphology. The two main lobes are divided by an equatorial torus composed of atomic, molecular, and dusty material (Matsuura et al., 2005; Kastner et al., 2022). With high helium and nitrogen abundances, NGC 6302 is classified as a Type I planetary nebula according to the classification scheme proposed by Peimbert (1978). It belongs to the highest excitation class with prominent emission lines including N V1238, 1243, C IV1548, 1551 and Ne VI at (Feibelman, 2001; Pottasch et al., 1985). Many researchers investigated NGC 6302 for the internal kinematics and various components, including the ionized, atomic, molecular and dust components.
Meaburn et al. (2008) investigated the proper motions of the outflowing knots to propose that the distance to NGC 6302 is 1.17 kpc. They also derived a kinematic age of 2200 years from their analysis of the Hubble-type expansion (e.g., Szyszka et al., 2011). Dinh-V-Trung et al. (2008) proposed that the molecular torus is expanding with a speed of from their measurement using the Submillimeter Array. Santander-García et al. (2017) conducted a kinematical analysis using ALMA data to confirm the Hubble type expansion.
With recent history of significant mass loss, a young planetary nebula is expected to harbor abundant H I behind the ionization front, which is expanding with respect to the central hot source. The hyperfine structure 21 cm line is regarded as currently the most effective spectroscopic tracer of atomic hydrogen. The first successful detection of a neutral component in planetary nebulae was made by Rodriguez & Moran (1982), who conducted radio observations of NGC 6302 using the Very Large Array. CO and H I components were also detected from radio observations for a number of planetary nebulae (e.g., Gussie & Taylor, 1995). However, severe confusion from the Galactic emission prevents one from investigating the distribution and the kinematics of the H I components in planetary nebulae.
For young planetary nebulae, a very unique and useful spectroscopic probe is provided by the Raman scattering process of far UV line radiation with atomic hydrogen. In young planetary nebulae, far UV He II lines can be Raman scattered by atomic hydrogen to form broad features blueward of hydrogen Balmer lines (Nussbaumer et al., 1989). The first report of Raman-scattered He II features was made for the young planetary nebula NGC 7027 by Péquignot et al. (1997), who identified the broad feature at 4852 Å as Raman-scattered He II. Groves et al. (2002) found the same feature in NGC 6302 while they investigated the extinction in the nebula. Subsequently, Raman-scattered He II at 6545 Å was detected in the young planetary nebulae IC 5117, NGC 6790, NGC 6881, and NGC 6886 (Lee et al., 2006; Kang et al., 2009; Choi & Lee, 2020).
Raman-scattered He II features are clearly detected in the high resolution optical spectrum of NGC 6302 provided by the ESO Science Archive Facility. In this paper, we investigate the physical properties of H I in NGC 6302 using these features. The paper is organized as follows. In Section 2, we briefly explain the basic atomic physics of Raman scattering with atomic hydrogen. In Section 3, we analyze Raman-scattered He II features at 4851 Å as well as at 6545 Å. We present the results from our Monte Carlo simulations in Section 4. A brief summary and discussions are presented in the final section.
2 Atomic Physics
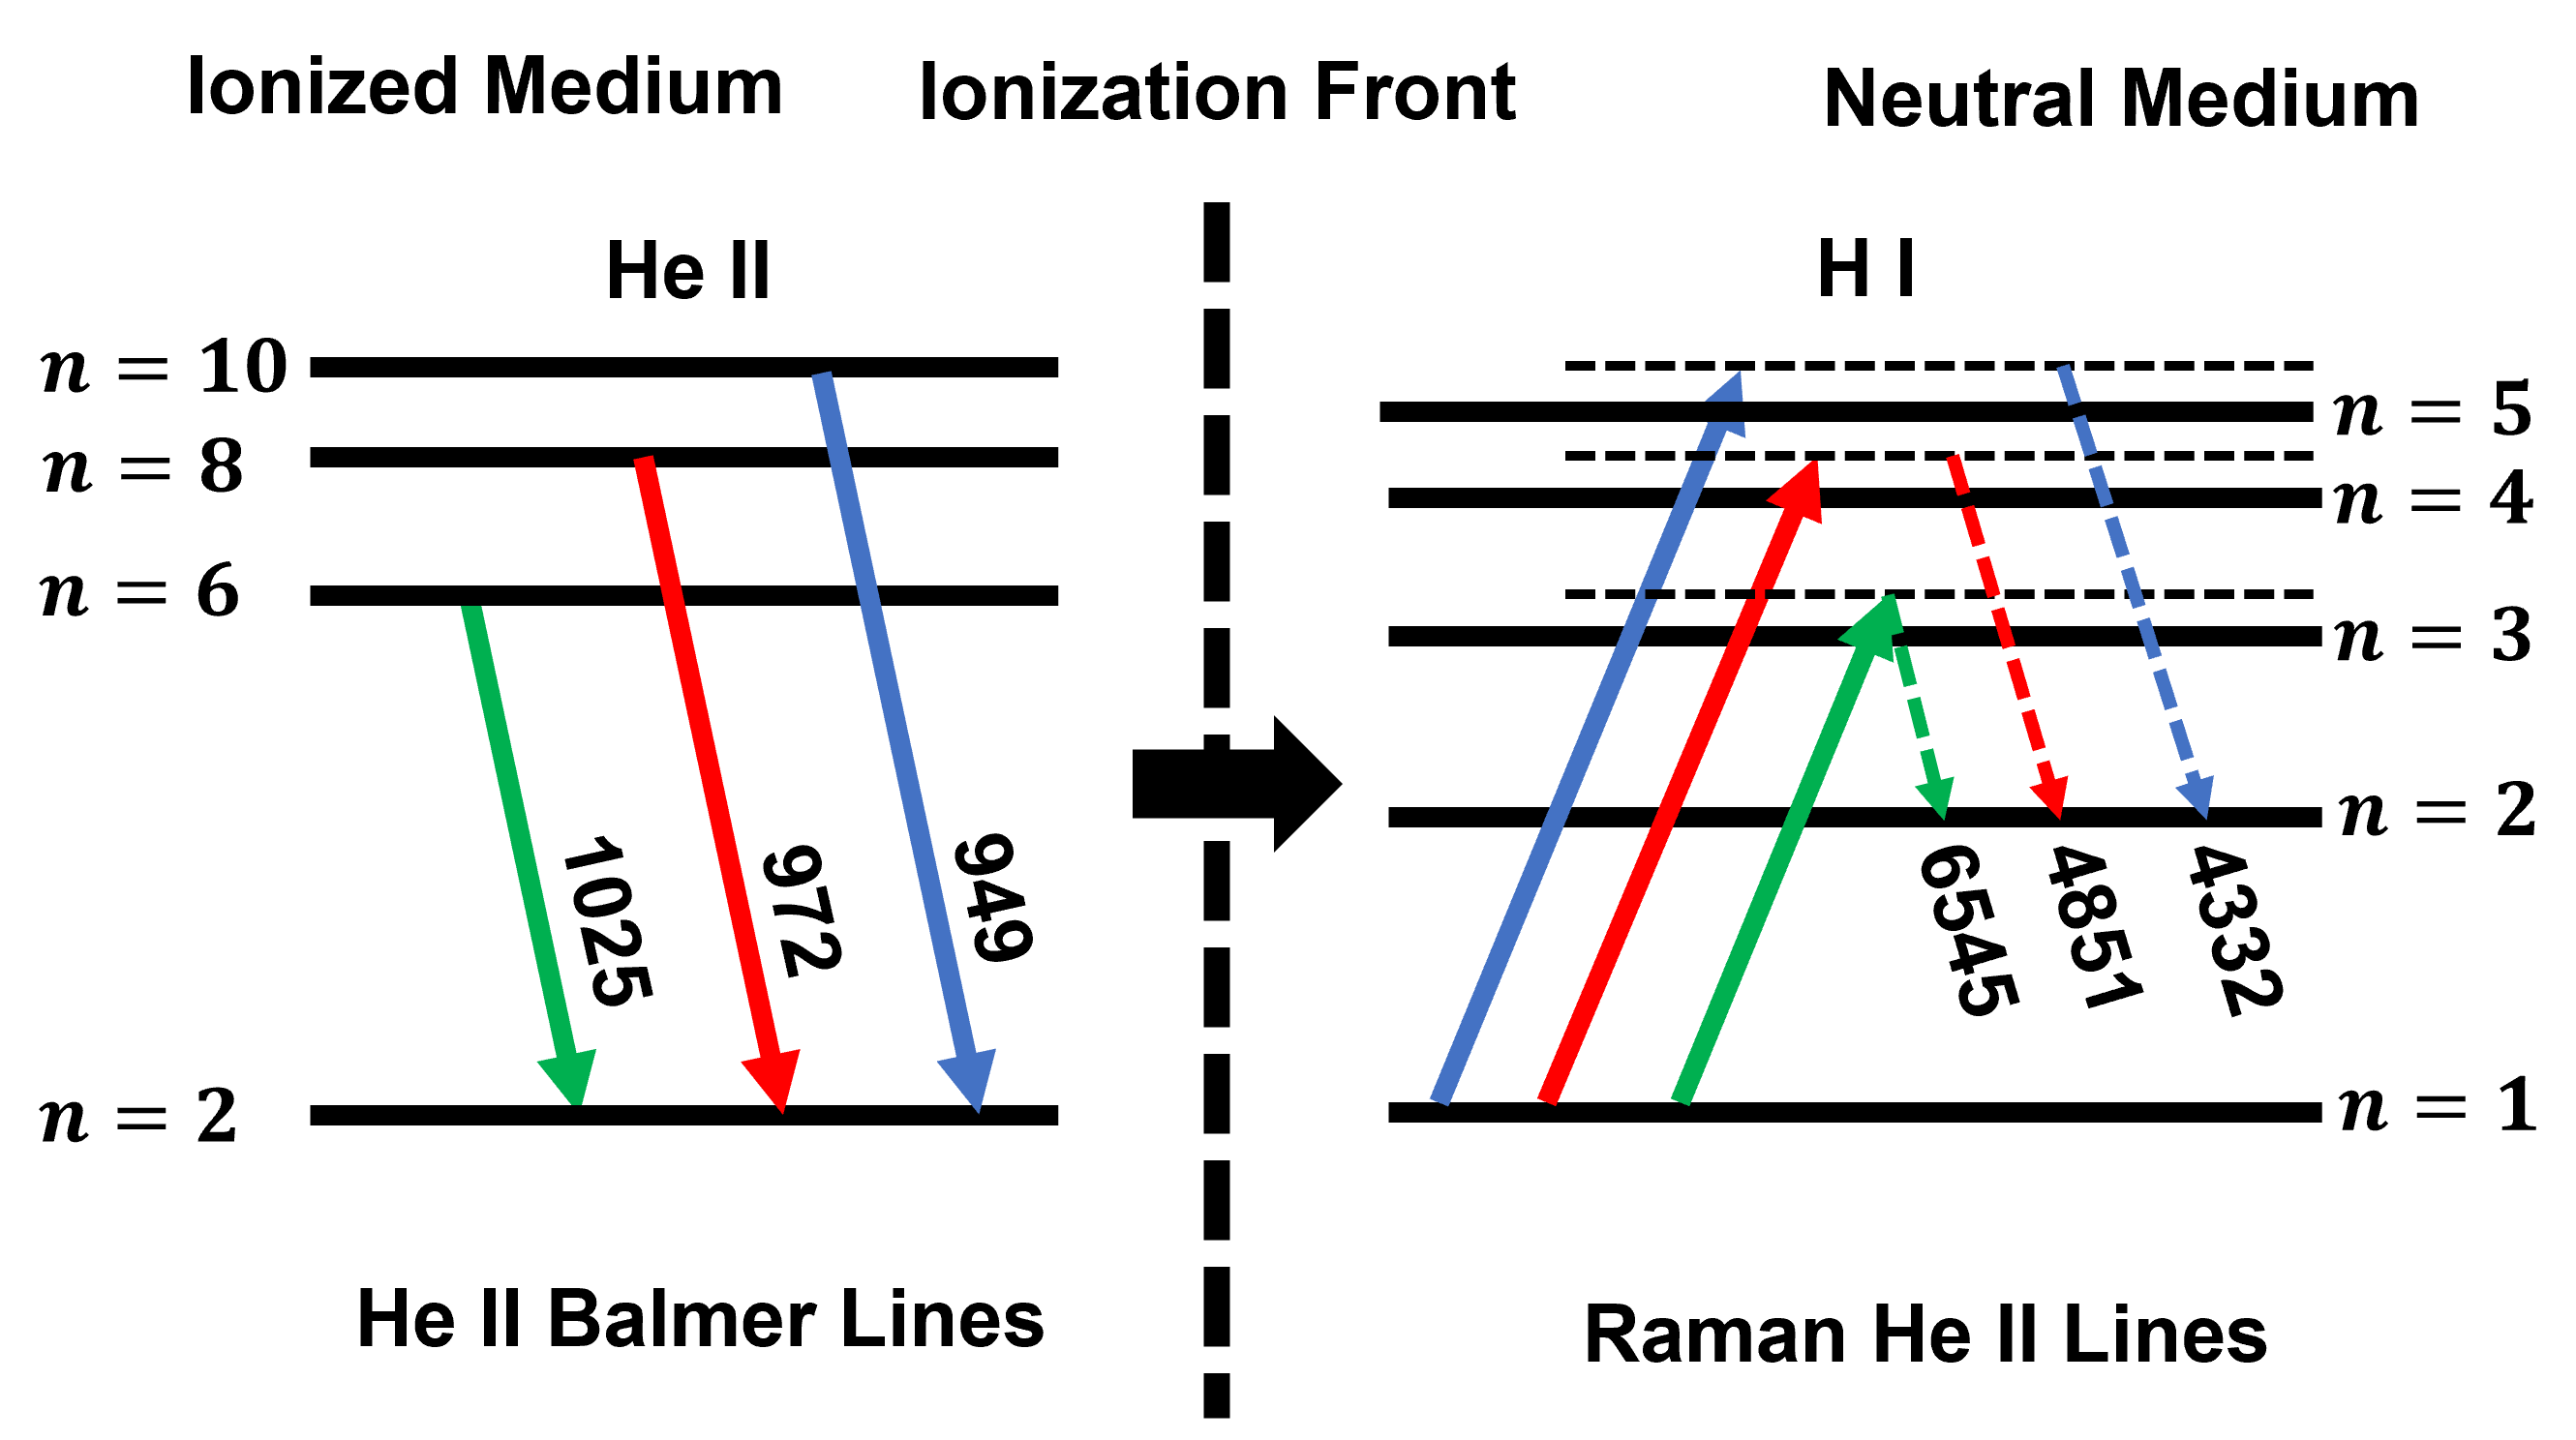
Schmid (1989) proposed that the broad emission features at 6825 Å and 7082 Å that appear in about a half of symbiotic stars are formed through inelastic scattering processes of the far UV resonance doublet lines O VI1032 and 1038. When a far UV photon blueward of Ly incident on a hydrogen atom in the ground state can be converted into a lower energy photon by an amount of 10.2 eV, the energy of a Ly photon, then the hydrogen atom makes a final de-excitation into the excited state instead of the initial ground state.
Additional examples are provided from far UV He II lines. He II 1025 arising from transitions of is Raman scattered with atomic hydrogen to form an optical spectral feature at 6545 Å, blueward of He II 6560, which is associated with transitions . Similarly, Raman scattering of He II 972 and yields spectral features at 4851 Å and 4332 Å, respectively (Nussbaumer et al., 1989; Lee, 2012).
Figure 1 shows a schematic illustration of the Raman scattering process expected to operate in young planetary nebulae, when far UV He II line photons enter the neutral region behind the ionization front. The atomic line center wavelengths for far UV He II emission lines and their optical Raman lines are shown in Table 1, where the cross sections and for Rayleigh and Raman scattering are also available (e.g., Lee, 2012; Chang et al., 2015).
The energy conservation requires
| (1) |
where and are frequencies of the incident, Raman-scattered and Ly photons, respectively. One may immediately note that the line widths of the incident and the Raman-scattered radiation are related by
| (2) |
which shows that the Raman He II features blueward of Balmer lines are broadened by the factor . The line broadening effect associated with the inelasticity of Raman scattering allows one to readily identify Raman-scattered features (Schmid, 1989).
| Transition | of He II Emissiona [Å] | of Raman He II b [Å] | [] | [] |
|---|---|---|---|---|
| 1025.28 | 6544.70 | |||
| 972.13 | 4851.30 | |||
| 949.32 | 4331.74 | |||
| a vacuum wavelength, b air wavelength |
3 Observation
3.1 Data

We retrieved the spectra of NGC 6302 taken with UV-Visual Echelle Spectrograph (UVES) attached on ESO Very Large Telescope (VLT) from ESO Science Archive111http://archive.eso.org/scienceportal/home under the ESO programme 65.I-0465 (P.I. Casassus). NGC 6302 was observed on May 24, 2000 through a 0.3 arcsec slit, resulting in spectral resolution of . A total of 4 spectra were obtained. The exposure times are 1200 seconds for the first 2 spectra and 2400 seconds for the other 2 spectra. The median signal-to-noise ratio of each exposure ranges from 7.1 to 11.5.
The 1-D and wavelength-calibrated spectrum covers the spectral range from 4727 Å to 6835 Å. In Figure 2, we show the full UVES spectrum of NGC 6302. The strong lines of H, H, [O III]4959, 5007 and [N II]6548, 6583 are all severely saturated in this spectrum. The presence of He II emission lines at 6560 Å and 4859 Å is barely noticed in the scale.
In the inset of the upper panel of Figure 2, we show a part around H to show clearly the broad feature at 4851 Å, which is identified as Raman-scattered He II. In a similar way, the inset of the lower panel shows a part of the spectrum near H, where we find a broad feature blended with [N II]6548. The intrinsic flux ratios of [N II] as well as of [O III] is fixed to be 3 due to the fact that they arise from the same excited state. Hence, if the broad weak emission feature near [N II]6548 is due to N II, then it implies the presence of a more conspicuous broad feature by a factor 3 near [N II]6583. No such broad feature is apparent near [N II]6583, which confirms that the broad feature around [N II]6548 is not associated with [N II] but is to be identified with Raman-scattered He II.
3.2 Gaussian Fitting
In this subsection, we provide a quantitative profile analysis of He II emission lines and Raman-scattered He II lines. In addition to He II 6560 and He II 4859, we also consider He II 6527, which is formed from transitions between and . This emission line is very convenient because Raman He II 6545 is located redward of He II 6527 with comparable strength. The atomic line centers of these He II 4859, 6527 and 6560 are 4859.32 Å, 6527.10 Å, 6560.10 Å, respectively (e.g., Lee et al., 2006; Hyung & Feibelman, 2004).
The He II emission lines and Raman-scattered features of NGC 6302 appear to be well-fitted using a single Gaussian function in the form given by
| (3) |
where and are the wavelength of line center and the line width, respectively.
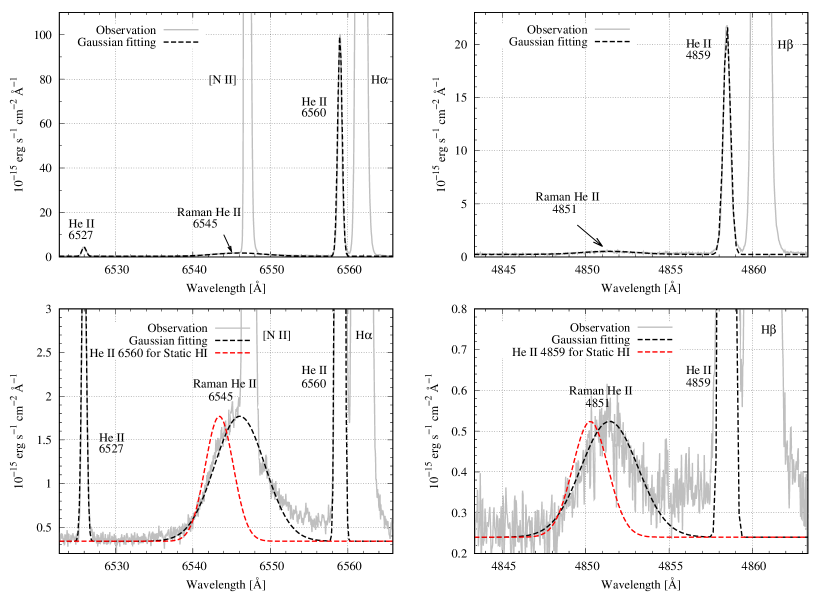
In Figure 3, we show the result of our single Gaussian fits. The observational data are shown with the solid gray lines, and the Gaussian fitting results are shown with the black dashed lines. In the two left panels, the results for He II 6527 and 6560 and Raman He II 6545 are shown, and the right panels show the results for the counterparts blueward of H. The left lower panel shows the Raman He II 6545, which is severely blended with [N II]6548. The right lower panel shows the Raman He II 4851.
Table 2 provides the fitting parameters used for the results that are shown with the black dashed lines in Figure 3. The widths of the two He II emission lines 6560 and 6527 near H are 0.283 Å, and that of He II 4859 is 0.212 Å. In contrast, the line width of Raman He II 6545 is 11.5 times wider than those of He II 6527 and 6560. In the case of Raman He II 4851, the line width Å is wider than that of He II 4859 by a factor of 8.02. These factors exceed the line broadening factor due to the inelasticity of Raman scattering given in Eq. (2). This is consistent with the proposal that the Raman-scattered He II features of NGC 6302 are formed in expanding neutral regions, where the expansion provides additional line broadening (e.g. Jung & Lee, 2004; Choi et al., 2020).
| Line | He II 6560 | Raman He II 6545 | He II 6527 | He II 4859 | Raman He II 4851 |
|---|---|---|---|---|---|
| [Å] | 6559.00 | 6546.06 | 6525.98 | 4858.45 | 4851.45 |
| [Å] | 0.283 | 3.25 | 0.283 | 0.212 | 1.70 |
| F [] | 7.08 | 1.17 | 0.292 | 1.16 | 0.121 |
| [ km s-1 ] | 12.9 | 23.4a | 12.9 | 13.09 | 21.03a |
| [ km s-1 ] | - | 17.86b1 | - | - | 12.88b2 |
a: corrected for Raman broadening, b1 & b2: velocity offset from He II 6560 & 4859
3.3 Line Ratio of He II 6560 & 4859
The observed flux ratio of H/H is regarded as an extinction indicator, because the Case B recombination theory predicts the flux ratio of (e.g. Osterbrock, 1989; Storey & Hummer, 1995). However, H and H in the UVES spectra are saturated near the line center, preventing one from estimating the extinction. Instead, the nearby emission lines He II 6560 and 4859 can be used for the same purpose.
According to Case B recombination theory for He II, the intrinsic line ratio of He II 6560 and 4859 is , whereas it is observed to be from the UVES spectra (Storey & Hummer, 1995). By adopting the dust model of our Galactic interstellar medium provided by Draine (2003), the observed line ratio of He II 6560 and 4859 is consistent with corresponding to .
3.4 Line Broadening
Raman He II lines are broadened significantly due to inelasticity of Raman scattering, which is illustrated in Eq. (2). Therefore, a correction factor of is required in order to yield the velocity width in the parent UV spectral space, where and are the wavelengths of the incident UV He II emission and the corresponding Raman scattered feature, respectively. The velocity width of Raman-scattered He II is calculated by
| (4) |
where is an apparent velocity width of Raman He II. For example, the apparent width for Raman He II 6545 is converted to instead of .
Our single Gaussian fit analysis shows that and for Raman He II 6545 and 4851, respectively. These values of for Raman He II lines are broader than those of He II emission lines by . In the lower two panels of Figure 3, we show the hypothetical profiles of Raman scattered features, which would be formed in a static H I medium with . In Section 4, we use a Monte Carlo approach to find that the difference of between Raman He II and He II emission lines originates from the random motion of scattering medium.
3.5 Line Center Shift
In the bottom row of Table 2, we show the velocity offset of Raman He II lines relative to nearby optical He II emission lines. The apparent velocity line shift is given by
| (5) |
where is the atomic line center wavelength. In turn, the velocity offset of Raman He II 6545 is calculated by
| (6) |
The wavelengths , and are defined analogously. In the case of Raman He II 4851, the velocity offset is obtained with and replacing and , respectively.
From our line fit analysis, km s-1 and 13.10 km s-1 for Raman He II 6545 and 4851, respectively. In the bottom panels of Figure 3, the Raman He II features are clearly displayed redward of the hypothetical features shown in the red dashed lines. This redward line shift of Raman He II indicates that the H I medium is moving away from the He II emission region (e.g. Choi et al., 2020).
3.6 Raman Conversion Efficiency
In this subsection, we present the Raman conversion efficiency (RCE), which is defined as the ratio of the number of Raman-scattered photons divided by that of the incident far UV photons. Explicitly, RCE of Raman He II 6545 is given by
| (7) | |||||
where is the energy of a photon with wavelength . RCE of Raman He II 4851 is also given in an analogous way by replacing 1025 and 6560 by 972 and 4859.
Firstly, the ratio of Raman and neighboring optical He II line fluxes, or , is obtained using the observed values presented in Table 2. Secondly, the flux ratio of the neighboring optical He II and directly unavailable incident far UV He II lines, or , is deduced, assuming that Case B recombination is valid. According to Storey & Hummer (1995), and also . Combining these results, we obtain RCE and RCE.
4 Monte Carlo Approach
Raman He II lines carry important physical information of the H I region. The line center, profile width and the strength of Raman-scattered He II can be used to put strong constraints on the distribution and kinematics of the H I component near the He II emission nebula (e.g., Nussbaumer et al., 1989). Due to the difference in scattering cross sections of He II 1025 and He II 972, the Raman conversion efficiencies also differ so that much detailed information can be obtained if both Raman-scattered features are secured with sufficient data quality. In particular, Choi et al. (2020) investigated the line formation of Raman-scattered He II in an expanding H I region to show that the redward shift of the line center of Raman-scattered He II features is conspicuously enhanced due to the sharp rise of the cross section toward H I Lyman line centers (see also Jung & Lee, 2004). In this section, we adopt a Monte Carlo approach to propose a simple scattering geometry consistent with the observed spectrum considered in this work.
The Monte Carlo code ’STaRS’ developed for radiative transfer in thick neutral regions by Chang & Lee (2020) is used to simulate the formation of Raman-scattered He II and find the best fitting parameters. In this simulation, we set the numbers of the incident far UV He II 1025 and 972 photons to be . The ratio of the two UV lines is in accordance with Case B recombination. Because optical Raman-scattered He II features are subject to dust extinction after leaving the H I region, the Raman conversion efficiency is computed using the optical Raman photons before dust extinction. However, the final line fitting of Raman-scattered He II is carried out after correction for dust extinction. The incident far UV He II photons are assumed to be described by a single Gaussian profile with a velocity width corresponding to the widths of He II 6560 and 4859 as illustrated in Table 2.
4.1 Scattering Geometry
The central region of NGC 6302 is highly obscured and can be probed with high angular resolution observations achievable by radio interferometry. Peretto et al. (2007) investigated the kinematics of the molecular torus to report the expansion velocity of . Wright et al. (2011) presented their 3D photoionization computation to propose that the inner and outer radii of the circumstellar disk are and , respectively, based on their best-fitting model result. Furthermore, the circumstellar disk is geometrically thin with a half-opening angle .
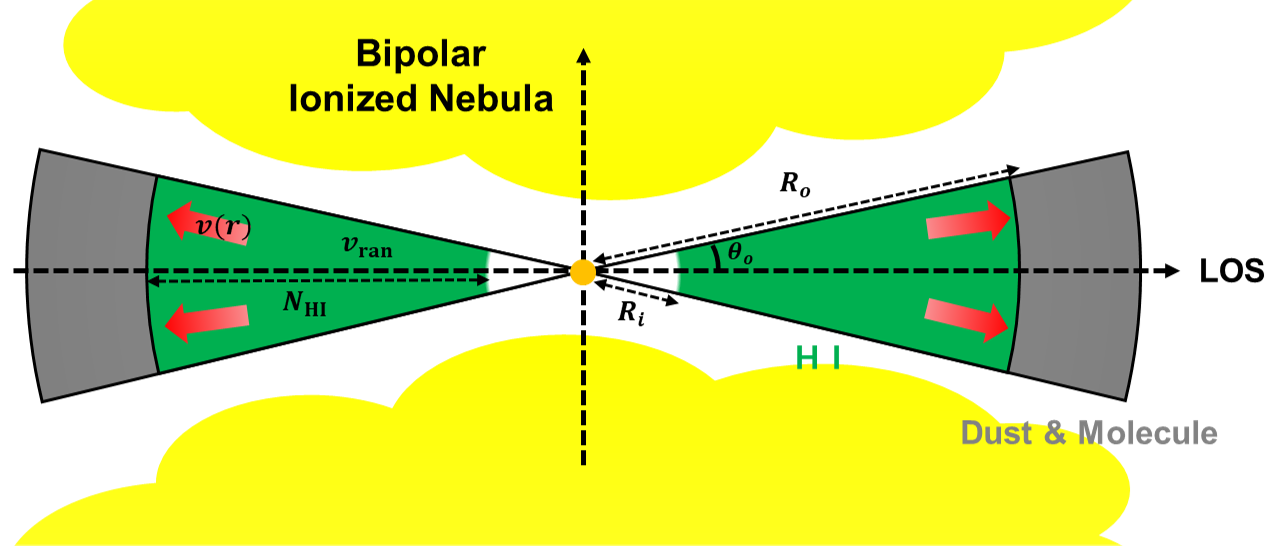
In our Monte Carlo simulation, the He II emission region is assumed to be an unresolved compact source surrounded by a circumstellar disk, where Raman scattering takes place. Figure 4 shows a schematic illustration of the scattering geometry considered in this work. For the sake of simplicity, the neutral region is assumed to take the form of a disk with the inner and outer radii and and also characterized by the half opening angle of the H I disk with respect to the point-like central He II region. The neutral region is of uniform H I density , where is H I column density.
The H I medium is assumed to move away from the central He II emission region in the radial direction. In addition, we denote by the random motion component contributed by the thermal motion. A Hubble-type outflow is chosen in this work in accordance with the observations of the ionized and molecular components by Szyszka et al. (2011) and Santander-García et al. (2017), respectively. Specifically, the radial velocity at a distance from the He II source is chosen to follow
| (8) |
where the parameter is the expansion velocity at the outer radius .
In our simulation, we collect Raman scattered photons escaping along the line of sight, which coincides with the direction specified by the polar angle = , in view of the fact that the central star of NGC 6302 is highly obscured by dust (Kastner et al., 2022). Thus, we consider dust extinction in the line of sight, which is coincident with the equatorial direction of the scattering medium. In Figure 4, a dust component is added outside the neutral region so that optical Raman He II photons are subject to dust extinction before reaching the detector. The dust optical depth is chosen to be consistent with the reddening found in the line ratio of He II 6560 and 4859 discussed in Section 3.3. The central He II emission region is assumed to inject far UV He II line photons with a profile described by a single Gaussian and strengths in accordance with the Case B recombination theory.
4.2 Simulated Raman Conversion Efficiency
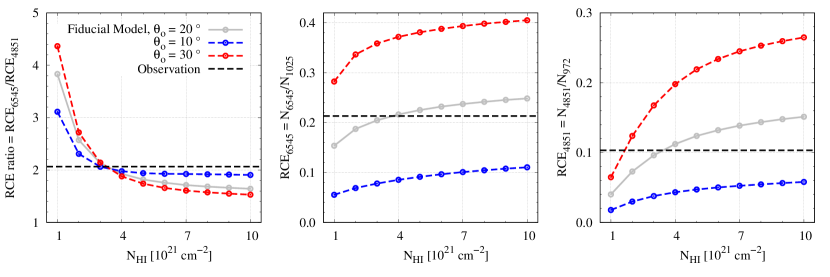
In Figure 5, the Raman conversion efficiencies for Raman-scattered He II at 6545 Å and 4851Å are shown in the middle and right panels for three values of the half opening angle = 10, 20, and 30∘ and for a range of H I column densities . Here, we fix the expansion speed and the random speed according to the best fitting result (see Appendix A). The horizontal dotted lines indicate RCEs of 0.21 and 0.10 for Raman-scattered He II at 6545 and 4851, respectively, presented in Section 3.6. In the left panel, the ratio of the two Raman conversion efficiencies is shown. The horizontal dotted line represents the ratio of the two RCEs .
In the range of H I column density considered in Figure 5, the Raman conversion efficiency is nearly proportional to the half opening angle . However, in contrast, the ratio of the two Raman conversion efficiencies is relatively insensitive to and decreases as increases. In this range of , too small RCEs are obtained from the cases for = and those with = lead to much larger RCEs to account for the measured values. In view of this, we propose that the measured RCEs are consistent with the scattering geometry characterized by and = .
4.3 Best Fit Profiles
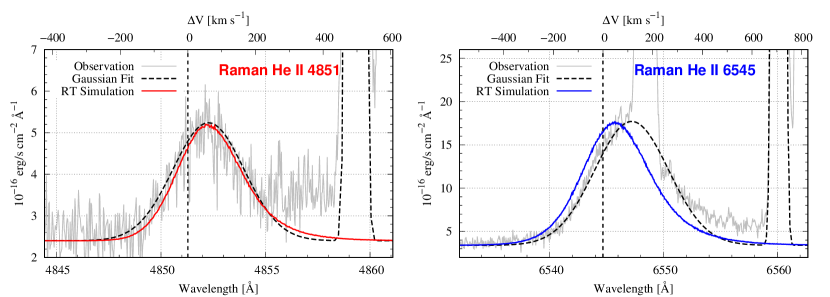
In the left panel of Figure 6, we show the best line fit to the observed spectrum of Raman He II 4851, for which the parameters adopted are = 13 km s-1 and = 10 km s-1 in addition to and . The red line shows the best fit and the black dotted line is the Gaussian fit to the observed data.
Using our best fit parameters, the H I number density is estimated to , from which we estimate the total mass of the H I disk . Taylor et al. (1990) investigated the H I mass of several planetary nebulae from 21 cm radio observations. For example, they propose that the planetary nebula BD + 30⋅3639 has the H I mass of . The random speed of H I medium corresponds to the thermal speed at , which is also consistent with the excitation temperature deduced from 21 cm radio observations.
We use the same set of parameters to show the fitting result for the Raman He II 6545 by the blue line in the right panel. The fit quality of Raman He II 6545 is slightly poorer than of Raman He II at 4851 Å. More specifically, the simulated profile is shifted blueward of the observed data by an amount of . Because of the severe blending of Raman He II 6545 with N II6548, we consider it a more appropriate strategy to focus on the Raman He II 4851 in the determination of the best fit parameters pertinent to NGC 6302. In Appendix A, we show the dependence of spectral profile on parameters, demonstrating the best fit convincingly.
5 Summary and Discussion
Using the archived UVES spectrum of NGC 6302, we have carried out profile analyses of He II emission lines and Raman-scattered He II at 6545 Å and 4851 Å. Raman He II features are found to be broader and more redshifted than the hypothetical Raman features that would be formed in a static H I medium. The Monte Carlo simulation code ’STaRS’ (Chang & Lee, 2020) is used to produce satisfactory line fits to the Raman-scattered He II features. For our Monte Carlo approach, the He II emission region is assumed to be compact near the hot central star surrounded by the H I region with H I column density = and a half opening angle . The kinematics of the H I region is characterized by the expansion speed and a random speed of . The physical properties of H I region are imprinted in Raman He II features via scattering.
In this work, dust particles are assumed to be distributed outside the neutral medium, presuming that those inside the neutral region are completely destroyed by strong UV radiation from the central star. However, additional complications are expected if we introduce a considerable amount of dust in the H I medium. In a sophisticated model involving a dusty neutral medium, the formation of Raman He II 4851 would be more suppressed than that of Raman He II 6545, because He II 972 has the Raman cross section smaller almost by an order of magnitude than He II 1025. A line photon of He II 972 has to traverse a longer dusty path in order to yield a Raman optical photon than He II 1025 so that dust extinction is more effective for He II 972 than He II 1025. We defer the formation of Raman features in a dusty neutral medium for future work.
On the observational side, we expect that Raman-scattered He II feature at 4332 Å can be obtained from very deep spectroscopic observations. Raman He II 4332 was reported in the symbiotic stars, including V1016 Cygni and RR Telescopii, and also in young planetary nebulae including NGC 7027 (e.g., Lee, 2012; van Groningen, 1993; Péquignot et al., 1997). With the future availability of Raman He II 4332, strong constraints on the scattering geometry and the amount of dust extinction will be placed.
Appendix A Monte Carlo Profile Fitting
The expanding velocity and random speed of H I are mainly responsible for the center shift and line broadening of Raman He II, respectively. However, the line profiles of Raman-scattered He II are determined in a complicated way involving the multiple scattering effect and sharply varying cross sections as a function of wavelength in addition to the scattering geometry and the kinematics. For example, when the covering factor of the neutral scattering region is significant, far UV He II photons that escape through Rayleigh scattering may re-enter the scattering region, introducing an additional line broadening effect to the final Raman-scattered He II (e.g., Choi et al., 2020). However, the half opening angle of deduced from Figure 5 is not big enough to enhance the line broadening through the re-entry effect. For this reason, we consider the random speed component of the H I medium in our simulation as the main factor affecting the broadened Raman-scattered He II.
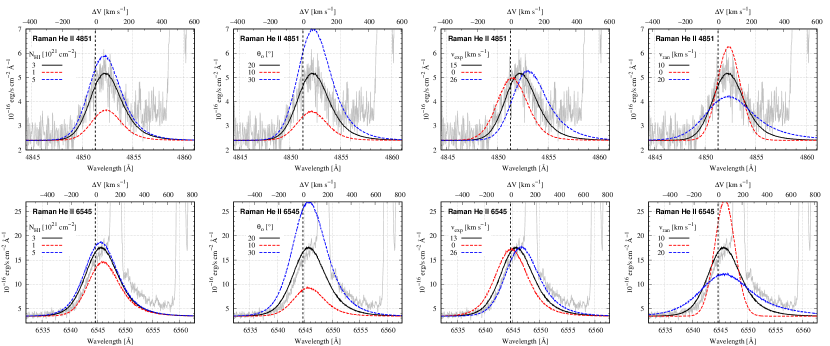
In Figure 7, we show line profiles obtained from our Monte Carlo simulations adopting the scattering geometry illustrated in Figure 4. In particular, we show the dependence of the Raman line profiles on the parameters a H I column density , an half opening angle , an expansion velocity , and a random speed . The upper and lower panels show the results for Raman He II 4851 and Raman He II 6545, respectively.
In the two left panels, we investigate the effect of , where the three cases for and 5 are shown. The other parameters are fixed to the best fit values, i.e., , and . Because of the best fit value corresponding to Raman optical depth exceeding unity for He II 1025, the Raman conversion efficiency increases only slightly compared to that for He II 972.
The next two panels show the effect of , where the three values of and are considered. The Raman conversion efficiency is nearly proportional to , which determines the covering factor of the scattering region with respect to the He II emission region.
The third two panels show the dependence of , which mainly affects the line center location of the Raman-scattered He II. The line centers move redward as increases. It is particularly notable that Raman He II 4851 becomes stronger as increases. This is due to the increase of Raman scattering cross section as He II photons get redshifted toward the hydrogen resonance, while the Raman optical depth is less than unity (e.g., Jung & Lee, 2004; Choi et al., 2020). No such conspicuous increase is seen in the case of Raman He II 6545 because the Raman optical depth exceeds unity.
In the right two panels, the simulated line profiles for three values of and are illustrated. The line profile becomes broader with increasing . Because the He II emission region is assumed to be characterized by a random velocity corresponding to the width of He II emission lines in Table 2, the resultant profiles are significantly affected by choice of in the range 0-20 km s-1 . In view of the profile fit quality, we may safely conclude that the random velocity component in the neutral region is .
We conclude that the best fitting parameters are obtained from the fitting of Raman He II 4851 and the blueward of Raman He II 6545. In the third two panels, the simulated spectra of Raman He II 6545 for = 13 and 26 km s-1 provide well-fitted features in the blueward and redward, respectively. We set = 13 km s-1 since the strong [N II] emission above Raman He II 6545 can affect the spectral profile in the redward of 6545 Å.
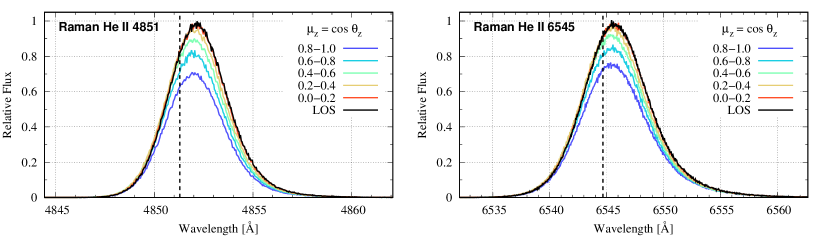
Figure 8 shows the simulated line spectra for various values of escaping direction , where is the angle of the emergent photon making with the symmetry axis. The spectra for the line of sight () in our simulation are stronger than those for other directions with . This behavior is explained by the fact that both Raman and Rayleigh processes prefer scattering in the forward and backward directions to lateral directions, where the phase function of the two scattering processes is given by
| (A1) |
Here, is the cosine of the angle between the wavevectors and of the incident and scattered photons, respectively (Chang & Lee, 2020).
References
- Chang et al. (2015) Chang, S.-J., Heo, J.-E., Di Mille, F., et al. 2015, ApJ, 814, 98, doi: 10.1088/0004-637X/814/2/98
- Chang & Lee (2020) Chang, S.-J., & Lee, H.-W. 2020, Journal of Korean Astronomical Society, 53, 169, doi: 10.5303/JKAS.2020.53.6.169
- Choi et al. (2020) Choi, B.-E., Chang, S.-J., Lee, H.-G., & Lee, H.-W. 2020, ApJ, 889, 2, doi: 10.3847/1538-4357/ab61f9
- Choi & Lee (2020) Choi, B.-E., & Lee, H.-W. 2020, ApJ, 903, L39, doi: 10.3847/2041-8213/abc559
- Dinh-V-Trung et al. (2008) Dinh-V-Trung, Bujarrabal, V., Castro-Carrizo, A., Lim, J., & Kwok, S. 2008, ApJ, 673, 934, doi: 10.1086/524373
- Draine (2003) Draine, B. T. 2003, ARA&A, 41, 241, doi: 10.1146/annurev.astro.41.011802.094840
- Feibelman (2001) Feibelman, W. A. 2001, ApJ, 550, 785, doi: 10.1086/319798
- Groves et al. (2002) Groves, B., Dopita, M. A., Williams, R. E., & Hua, C.-T. 2002, PASA, 19, 425, doi: 10.1071/AS02010
- Gussie & Taylor (1995) Gussie, G. T., & Taylor, A. R. 1995, MNRAS, 273, 801, doi: 10.1093/mnras/273.3.801
- Hyung & Feibelman (2004) Hyung, S., & Feibelman, W. A. 2004, ApJ, 614, 745, doi: 10.1086/423660
- Jung & Lee (2004) Jung, Y.-C., & Lee, H.-W. 2004, MNRAS, 355, 221, doi: 10.1111/j.1365-2966.2004.08311.x
- Kang et al. (2009) Kang, E.-H., Lee, B.-C., & Lee, H.-W. 2009, ApJ, 695, 542, doi: 10.1088/0004-637X/695/1/542
- Kastner et al. (2022) Kastner, J. H., Moraga Baez, P., Balick, B., et al. 2022, ApJ, 927, 100, doi: 10.3847/1538-4357/ac51cd
- Lee (2012) Lee, H.-W. 2012, ApJ, 750, 127, doi: 10.1088/0004-637X/750/2/127
- Lee et al. (2006) Lee, H.-W., Jung, Y.-C., Song, I.-O., & Ahn, S.-H. 2006, ApJ, 636, 1045, doi: 10.1086/498143
- Matsuura et al. (2005) Matsuura, M., Zijlstra, A. A., Molster, F. J., et al. 2005, MNRAS, 359, 383, doi: 10.1111/j.1365-2966.2005.08903.x
- Meaburn et al. (2008) Meaburn, J., Lloyd, M., Vaytet, N. M. H., & López, J. A. 2008, MNRAS, 385, 269, doi: 10.1111/j.1365-2966.2007.12782.x
- Nussbaumer et al. (1989) Nussbaumer, H., Schmid, H. M., & Vogel, M. 1989, A&A, 211, L27
- Osterbrock (1989) Osterbrock, D. E. 1989, Astrophysics of gaseous nebulae and active galactic nuclei
- Peimbert (1978) Peimbert, M. 1978, in Planetary Nebulae, ed. Y. Terzian, Vol. 76, 215–224
- Péquignot et al. (1997) Péquignot, D., Baluteau, J. P., Morisset, C., & Boisson, C. 1997, A&A, 323, 217
- Peretto et al. (2007) Peretto, N., Fuller, G., Zijlstra, A., & Patel, N. 2007, A&A, 473, 207, doi: 10.1051/0004-6361:20066973
- Pottasch et al. (1985) Pottasch, S. R., Preite-Martinez, A., Olnon, F. M., et al. 1985, A&A, 143, L11
- Rodriguez & Moran (1982) Rodriguez, L. F., & Moran, J. M. 1982, Nature, 299, 323, doi: 10.1038/299323a0
- Santander-García et al. (2017) Santander-García, M., Bujarrabal, V., Alcolea, J., et al. 2017, A&A, 597, A27, doi: 10.1051/0004-6361/201629288
- Schmid (1989) Schmid, H. M. 1989, A&A, 211, L31
- Storey & Hummer (1995) Storey, P. J., & Hummer, D. G. 1995, MNRAS, 272, 41, doi: 10.1093/mnras/272.1.41
- Szyszka et al. (2011) Szyszka, C., Zijlstra, A. A., & Walsh, J. R. 2011, MNRAS, 416, 715, doi: 10.1111/j.1365-2966.2011.19087.x
- Taylor et al. (1990) Taylor, A. R., Gussie, G. T., & Pottasch, S. R. 1990, ApJ, 351, 515, doi: 10.1086/168489
- van Groningen (1993) van Groningen, E. 1993, MNRAS, 264, 975, doi: 10.1093/mnras/264.4.975
- Wright et al. (2011) Wright, N. J., Barlow, M. J., Ercolano, B., & Rauch, T. 2011, MNRAS, 418, 370, doi: 10.1111/j.1365-2966.2011.19490.x