AD-YOLO: You Look Only Once in training
Multiple Sound Event Localization and Detection
Abstract
Sound event localization and detection (SELD) combines the identification of sound events with the corresponding directions of arrival (DOA). Recently, event-oriented track output formats have been adopted to solve this problem; however, they still have limited generalization toward real-world problems in an unknown polyphony environment. To address the issue, we proposed an angular-distance-based multiple SELD (AD-YOLO), which is an adaptation of the “You Only Look Once” algorithm for SELD. The AD-YOLO format allows the model to learn sound occurrences location-sensitively by assigning class responsibility to DOA predictions. Hence, the format enables the model to handle the polyphony problem, regardless of the number of sound overlaps. We evaluated AD-YOLO on DCASE 2020-2022 challenge Task 3 datasets using four SELD objective metrics. The experimental results show that AD-YOLO achieved outstanding performance overall and also accomplished robustness in class-homogeneous polyphony environments.
Index Terms— sound event localization and detection, you only look once, angular distance, polyphony environment
1 Introduction
Given a multi-channel audio input, sound event localization and detection (SELD) combines sound event detection (SED) along the temporal progression and the identification of the direction-of-arrival (DOA) of the corresponding sounds. The combining of two sub-tasks can perform a key role in automatic audio surveillance [1, 2], navigation [3], and crime-safety applications [4]. Recently, neural-network-based approaches to solving the SELD problem have made progress via several competitions such as the DCASE challenge [5]. As many prior studies [6, 7, 8, 9, 10, 11, 12] have been conducted on SELD, various approaches have been proposed to tackle the problem.
Several works [6, 7, 8, 9, 10] have adopted a two-branch output format, considering SELD as the performing of two separate sub-tasks from each branch, SED and DOA (SED-DOA). On the other hand, [11, 12] solve the task in a single-branch output through a Cartesian unit vector (proposed as ACCDOA [11]), combining SED and DOA representations, where the zero-vector represents none. However, all have in common adopting a track output format which is an event-oriented approach.
In terms of handling the polyphony, [6, 7, 9, 11] allow a single track per event class. Therefore, it is clear that the class-wise output format has limitations when same-class overlapping occurs. In the meantime, [8, 10] design the network architectures to output the desired number of tracks regardless of event class, where one and two are set for the maximum overlaps respectively. [12] suggests allowing multiple tracks, implementally up to three, per event class and utilizing class-wise track permutation learning (ADPIT).
Given the labeled data, the maximum polyphony can be considered, however, the maximum is priorly unknown under the real-world circumstance or the unlabeled. Thus, the event-oriented track output formats intrinsically contain the limitation of presetting the number of tracks, constraining the generality and expandability of the method itself.
In this paper, we propose a novel approach for SELD, undisturbed by the unknown number of polyphony by performing location-oriented detection, out of the event-oriented perspective. We adapt the framework of ”You Only Look Once” (YOLO) [13], renowned for multiple object detection from images, to the SELD by using the notion of angular distance, namely proposing angular-distance-based YOLO (AD-YOLO). The results of an experiment using the series of DCASE 2020-2022 Task 3 (SELD) datasets [14, 15, 16] demonstrated that AD-YOLO outperformed existing SELD formats in both overall evaluation and polyphonic circumstances.
2 Proposed Method
2.1 Training SELD in YOLO
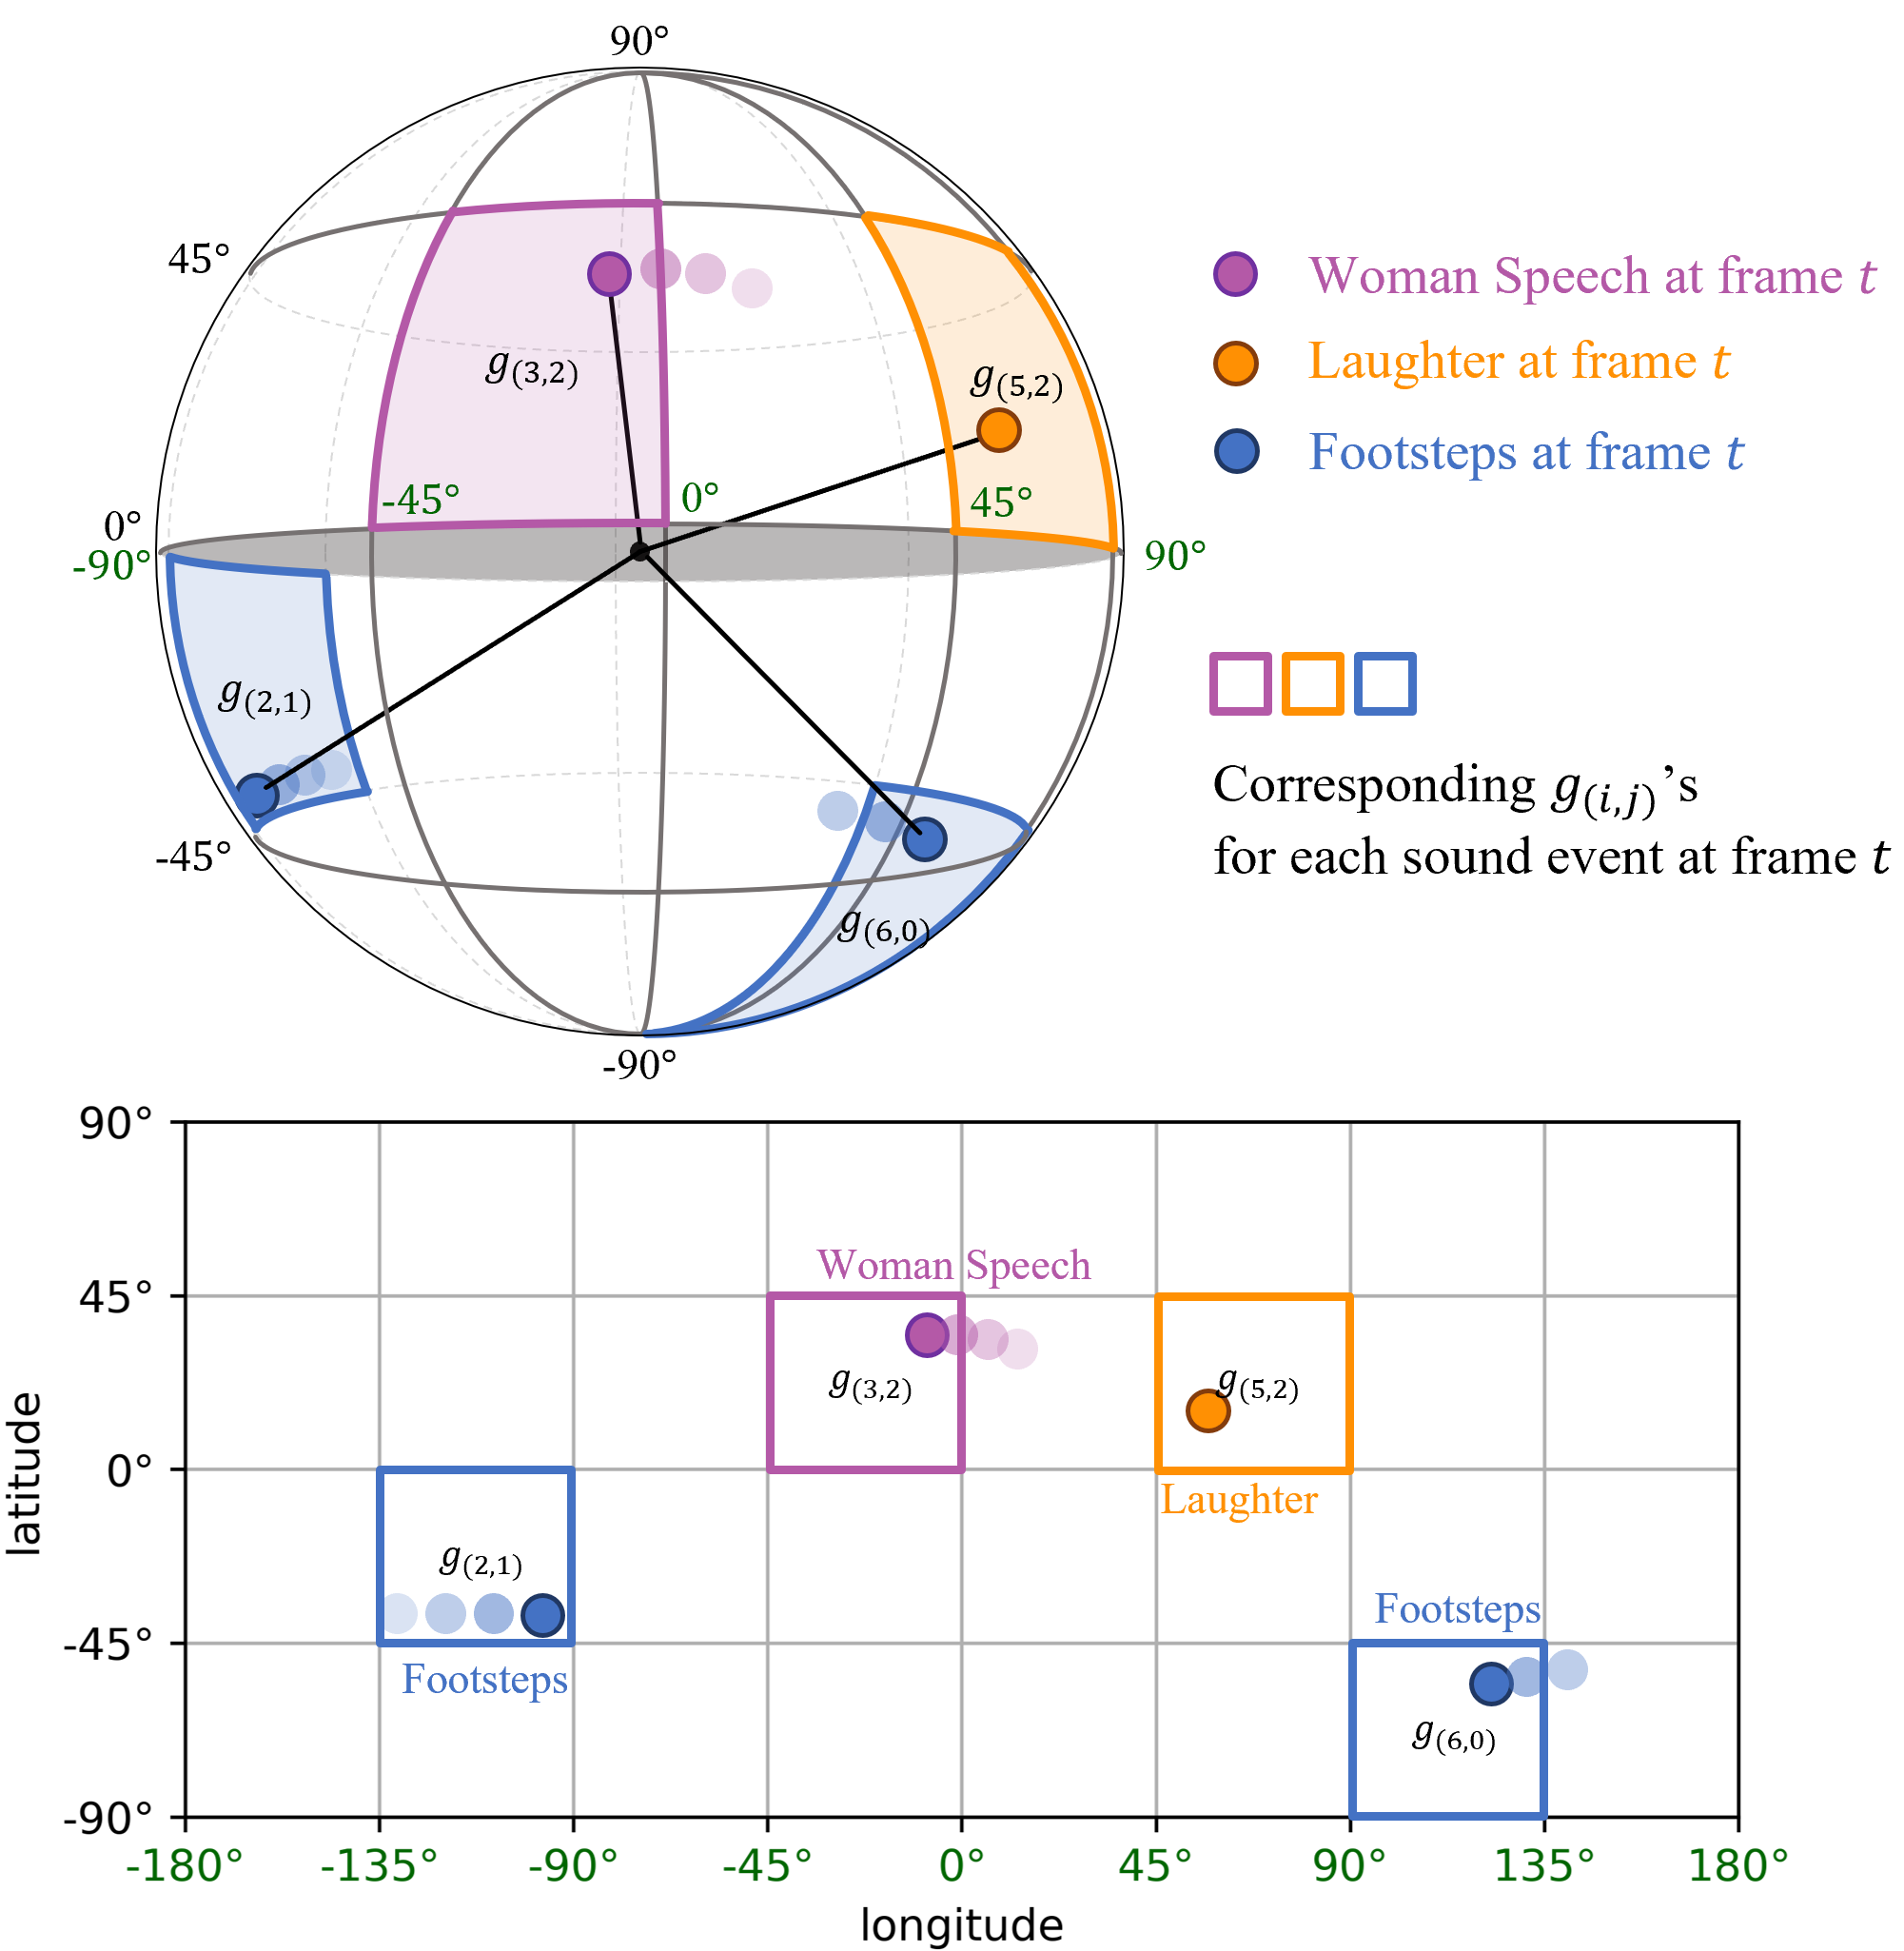
Given a sound source corresponding to time frames, we let sound event targets exist at the frame . The reference target, among events at any time , can be defined by , where denotes the class of the corresponding sound, and () tuple, represented by a polar coordinate system, indicate the location of the sound source at time . By dividing a spherical surface into grids, any polar system coordinate can have a corresponding area; therefore, we redefine the format using the indices of the grid. , where indicates the area depending on and among the spatially-uniformly divided areas in terms of longitude and latitude. Then, we can depict the reference data as , where , and each row contains the indicator of time , corresponding grid , active class , and DOA . Fig. 1 shows an example of the reference label tagged with the corresponding grid areas on the spherical surface.
We let the backbone network transform the multi-channel acoustic feature into the embedding space representation with the parameters . , , and denote the number of channels, time frames, and dimensions of the acoustic feature input respectively, and is the size of the embedding space. Then, is followed by a single fully connected layer (FC), estimating both SED and DOA with the parameters .
| (1) |
where the estimation consists of predictions for grids, and each prediction contains class-wise confidence scores, the score for sound existence, and the DOA prediction .
During training, we determine the responsible predictions for each reference in using an angular distance as follows:
| (2) | ||||
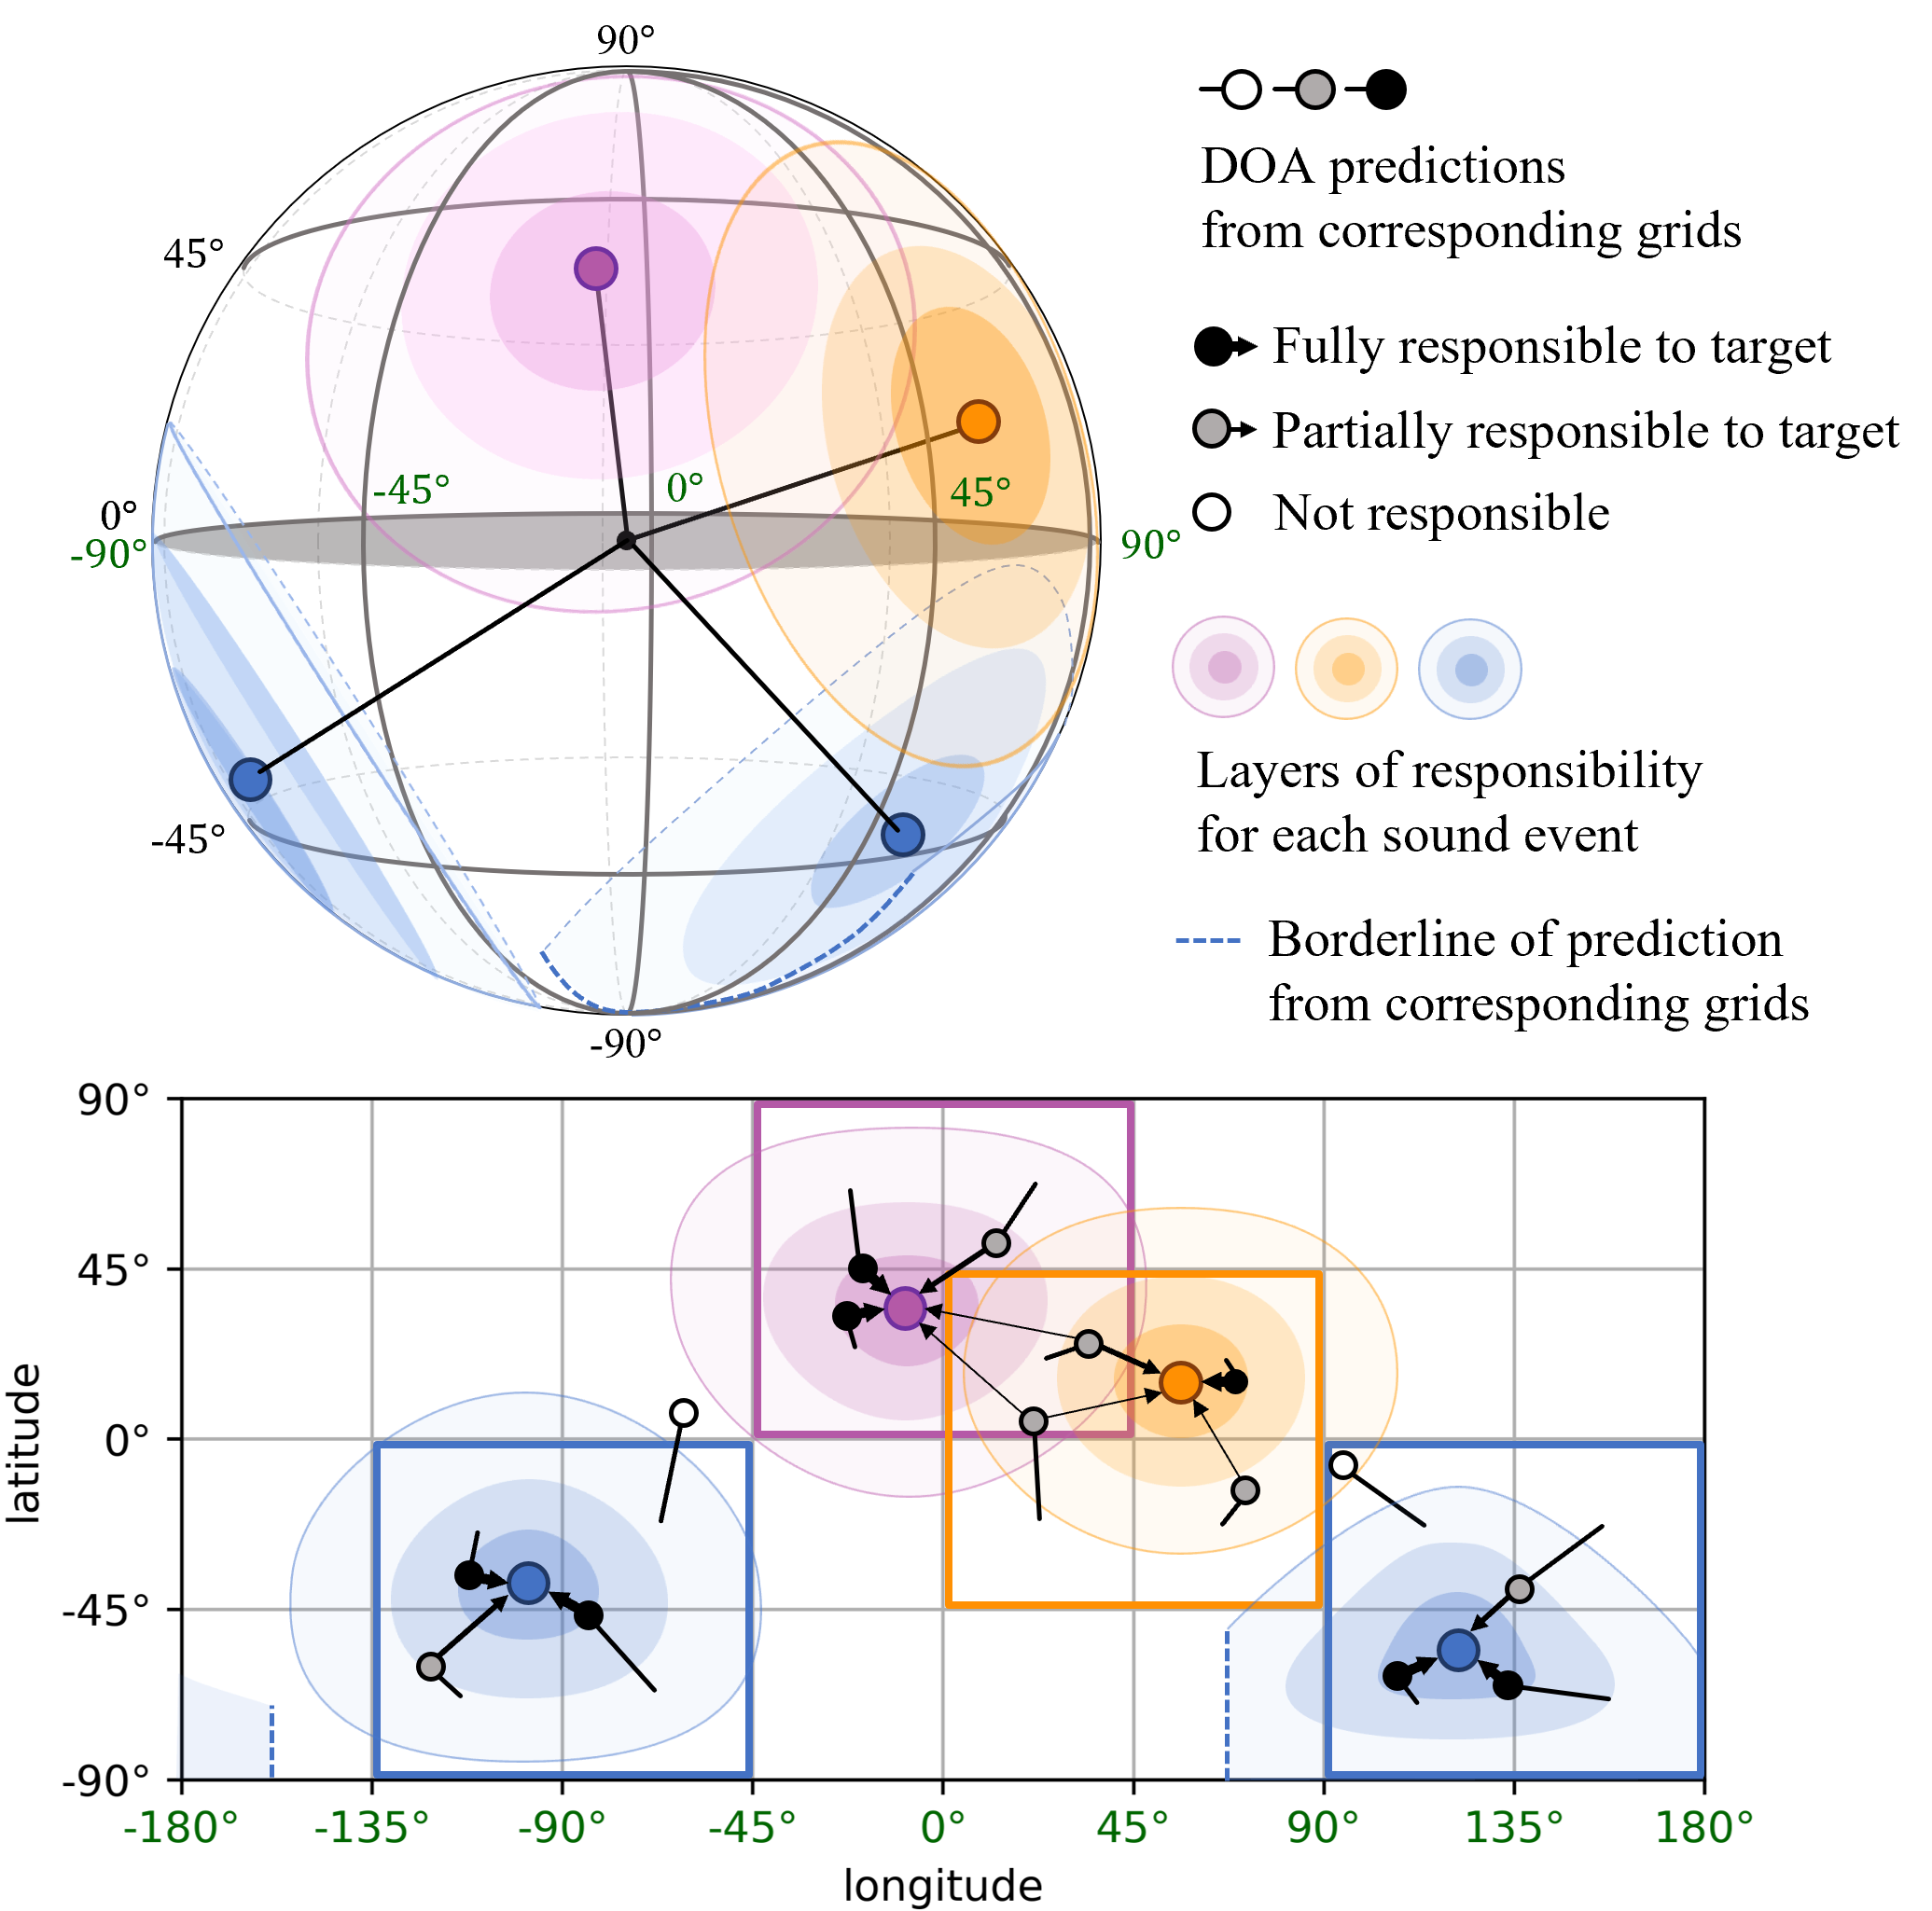
where indexes the rows from the matrix , corresponds to referenced DOA, and is the estimated DOA of prediction from the reference time and grid . Given a training threshold , responsibility is assigned to the prediction if . We use multiple thresholds to layer the responsibility according to the distance. Also, the overlaps between grid spaces are allowed to track the continuity of DOA trajectories crossing multiple areas. Fig. 2 shows an example of responsibility assignment, where and the allowance for overlapping grid was set to 50%. As shown in the figure, the allowance extends the corresponding grids of each target, and the thickness of the arrow from the predictions indicates the level of responsibility toward each target.
The loss function for training the network can be formulated based on the identification of responsibilities. First, we compose the logical matrix as follows:
| (3) |
where combines the indices respectively, and indexes the row from the reference matrix as mentioned earlier.
Then, the loss between responsible DOA estimations and each reference DOA is defined as follows:
| (4) |
where denotes the number of non-zero values in the matrix. Considering the distortion between representations on a 2-dimensional and a spherical surface, as shown in the responsible boundaries, Fig. 2, we minimize the angular distance directly rather than using the squared error of the conventional YOLO mechanism.
Subsequently, merging becomes the target for the probabilistic estimation of sound source existence conditioned on its DOA, regardless of classes. Hence, the losses can be written as:
| (5) | ||||
We use binary cross entropy (BCE) for the probabilistic comparison, where denotes the estimated probability of sound existence indexed by from the network output .
By further expanding the concept to class-wise responsibility, we define the logical matrix as and assign 1 to where can be referenced from . Therefore, the classification loss for the responsible predictions is formulated as:
| (6) |
The classification loss is averaged by the number of unique responsible predictions , and the merging of class-wise logical elements is denoted as .
Finally, the formulation of the integrated loss function of AD-YOLO, layering responsibilities with a set of multiple thresholds , is described as follows:
| (7) |
where balancing parameters that weigh each term are empirically given as in this study.
2.2 Inference
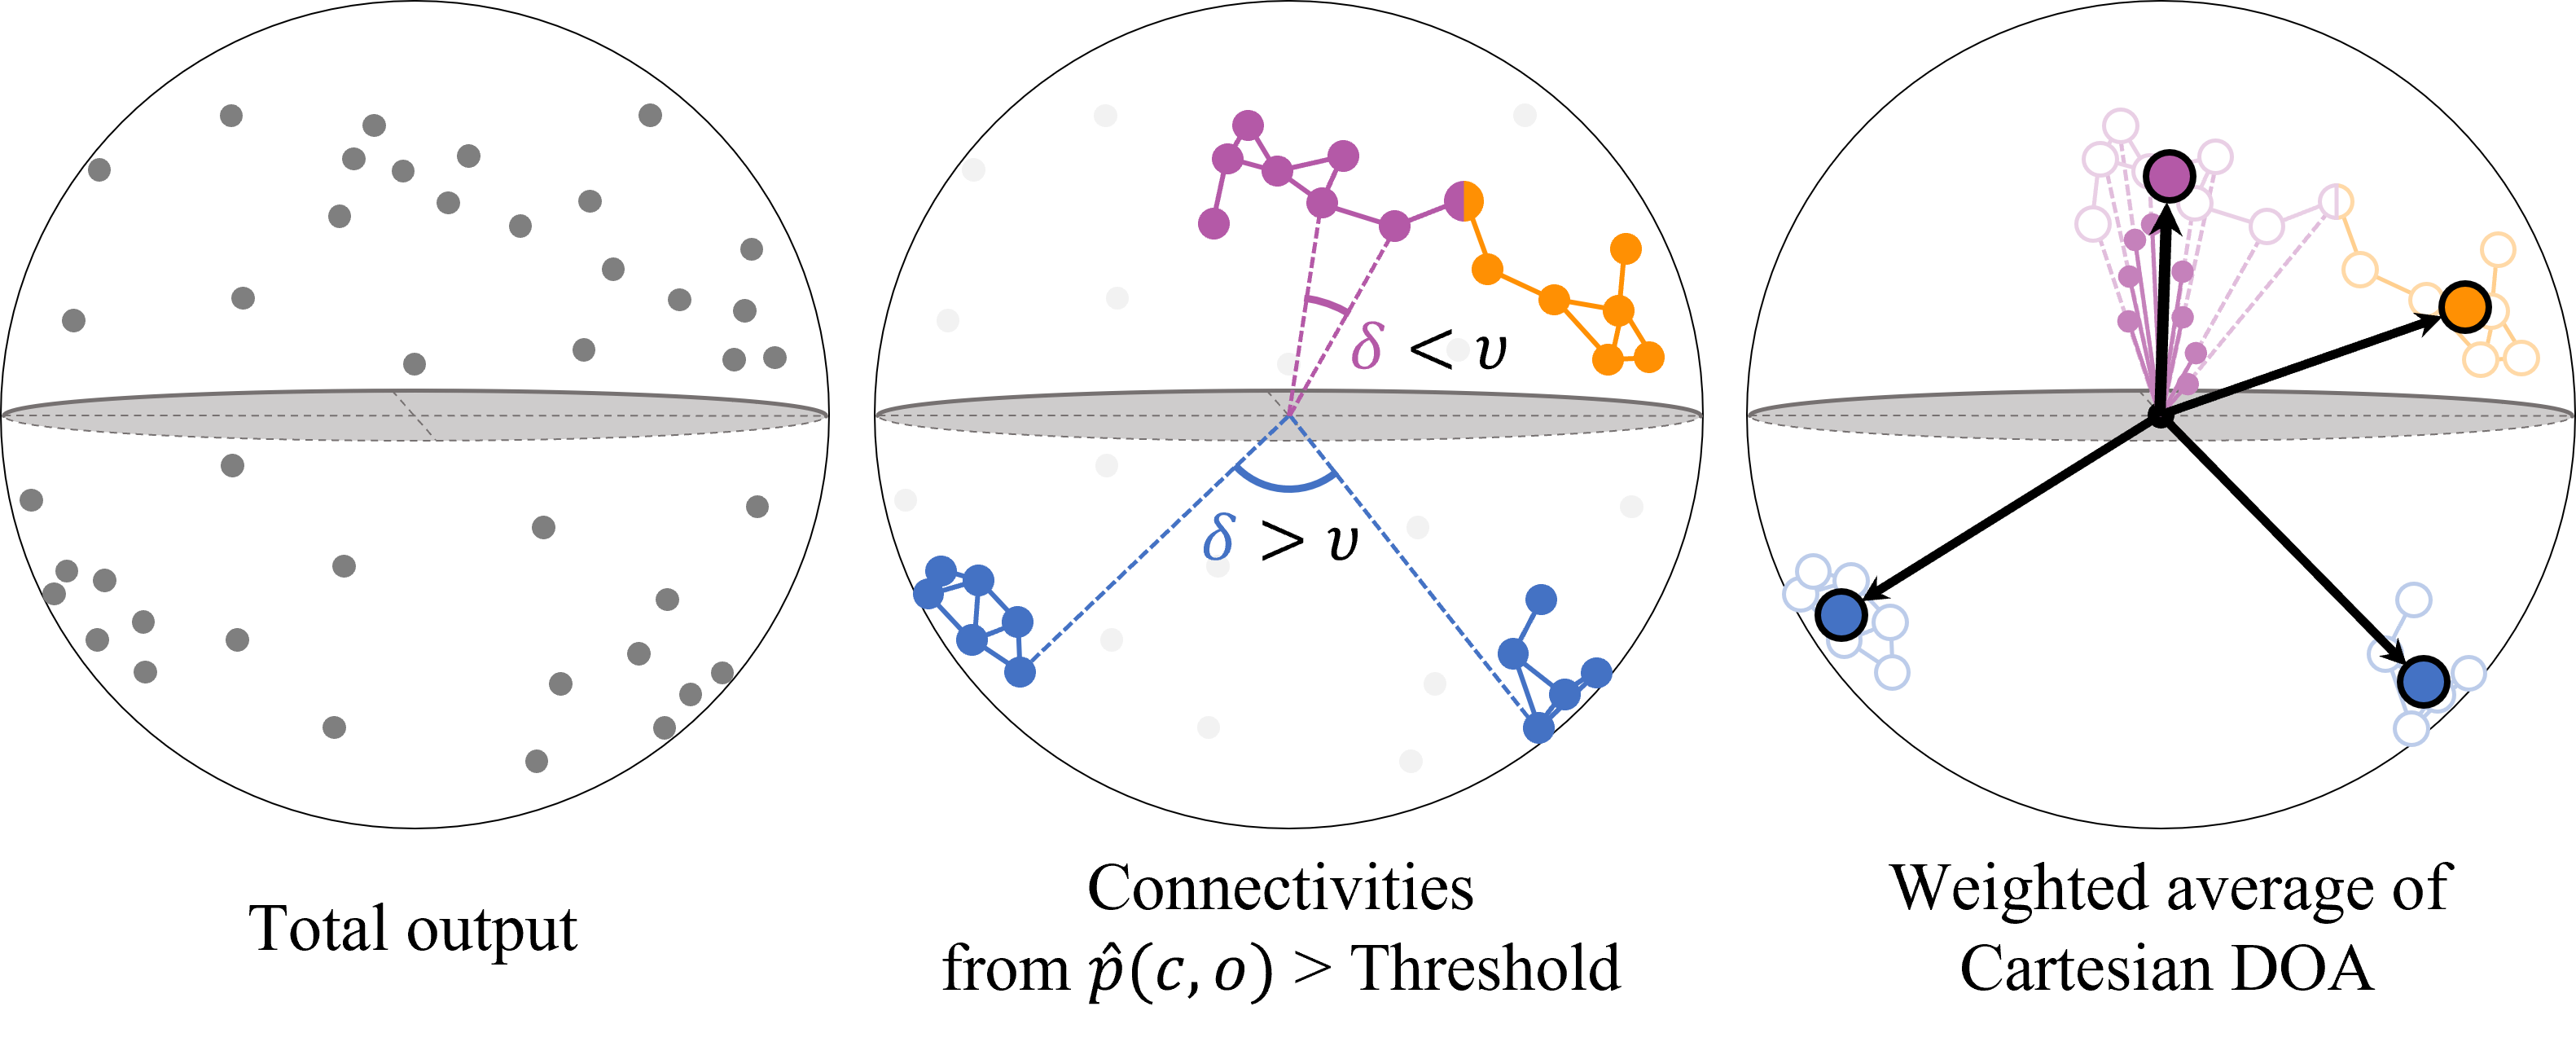
Non-maximal suppression (NMS) can be adapted for the frame-wise SELD output using the angular distance measure. Inspired by the ensemble technique suggested for SELD in [17], connectivity-based unification is devised, clustering the predictions similar to the DBSCAN [18] algorithm. Considering the predictions of the conditional class probabilities beyond the threshold of 0.5, we unify the predictions based on the estimated DOAs within the angular threshold . Subsequently, the weighted average of the Cartesian DOAs from the class-wise cluster determines the unified DOA estimation, where the weights are described as:
| (8) |
The weight vector comprises elements that are proportional to the confidence scores of each prediction. An example of a connectivity-based NMS is shown in Fig. 3.
3 Experiments
| Format | Unify Threshold () | DCASE 2022 | DCASE 2021 | DCASE 2020 | ||||||||||||
| SED-DOA [6] | - | 0.9619 | 11.40 | 31.01∘ | 42.18 | 0.6496 | 0.6150 | 36.60 | 21.39∘ | 56.50 | 0.4507 | 0.4768 | 59.87 | 9.50∘ | 65.17 | 0.3198 |
| ACCDOA [11] | - | 0.7758 | 16.98 | 30.00∘ | 52.44 | 0.5621 | 0.5872 | 40.31 | 20.65∘ | 63.36 | 0.4163 | 0.5278 | 50.73 | 16.61∘ | 73.74 | 0.3439 |
| ADPIT [12] | 0.8035 | 14.93 | 30.96∘ | 51.87 | 0.5769 | 0.5990 | 39.50 | 19.63∘ | 64.49 | 0.4170 | 0.5193 | 52.59 | 16.36∘ | 75.17 | 0.3332 | |
| 0.7999 | 14.94 | 30.94∘ | 51.84 | 0.5760 | 0.5894 | 39.70 | 19.61∘ | 64.39 | 0.4144 | 0.5161 | 52.76 | 16.36∘ | 75.16 | 0.3320 | ||
| 0.7993 | 14.96 | 30.93∘ | 51.81 | 0.5759 | 0.5887 | 39.70 | 19.60∘ | 64.35 | 0.4143 | 0.5158 | 52.77 | 16.36∘ | 75.15 | 0.3319 | ||
| AD-YOLO | 0.8123 | 27.36 | 24.59∘ | 53.17 | 0.5359 | 0.5897 | 52.42 | 13.45∘ | 65.25 | 0.3719 | 0.5297 | 59.98 | 8.48∘ | 69.82 | 0.3197 | |
| (proposed) | 0.7870 | 27.54 | 24.63∘ | 52.71 | 0.5303 | 0.5359 | 53.98 | 13.45∘ | 64.84 | 0.3556 | 0.4927 | 60.94 | 8.56∘ | 69.81 | 0.3082 | |
| 0.7802 | 27.59 | 24.69∘ | 52.62 | 0.5288 | 0.5185 | 54.35 | 13.54∘ | 64.70 | 0.3508 | 0.4818 | 61.27 | 8.60∘ | 69.75 | 0.3048 | ||
3.1 Experimental setups
We adopted the development sets of DCASE Task 3 from 2020 to 2022 [14, 15, 16] to compare the proposed method with other SELD approaches [6, 11, 12]. Each includes 14, 12, and 13 sound event classes respectively, which are loosely shared. The 2020 and 2021 data comprise one-minute sound scene emulation, where 400 training, 100 validation, and 100 test recordings are explicitly provided. Whereas polyphony was considered in 2020, the 2021 dataset contains polyphony recordings, including non-target interference.
The 2022 dataset comprises manually annotated real-world sound scenes between 30 s to 5 min duration. It contains 67 training and 54 test clips. Real recordings are fairly common to multiple overlaps, where the maximum is five. By considering the challenge objective in 2022, we exploited 1,200 simulated scenes111DOI: 10.5281/zenodo.6406873 as a training split, which was used for the baseline training of the year. Correspondingly, the training and test splits of the 2022 development dataset were considered for validation and testing, respectively, in this setup. The baseline data were emulated in the same manner as in 2020, where polyphony was allowed.
A first-order ambisonic format was used in the experiment, and every sound scene recording was sampled at 24 kHz. For training, we segmented audio recordings into 20 s duration with 1 s shifting. Mel-spectrogram and intensity vectors were used as the network inputs, where the acoustic features were extracted using 50 ms Hanning window, 25 ms hop length, and 64 mel-scale bins. Augmentations of spectrogram masking [19] and 16-pattern rotation [8] were applied to train the same SE-ResNet[20]–BiGRU[21] architecture in [17]. Adam optimizer of learning rate was adopted, and 500 iterations with 16 batch size learning were set in 200 training epochs. For the AD-YOLO, we used a grid size with overlap extension and . from AD-YOLO and the number of tracks in ADPIT were set to , the maximum polyphony of the training data.
3.2 Evaluation metrics
We adopted four metrics for the evaluation [22]. Considering the predictions as true positives when the angular distance to the reference was less than , the location-sensitive error rate () and F-score () were measured. The localization recall () measured the class-wise true-positive ratio. The class-sensitive localization error () averaged the angular distance between the references and the class predictions in degrees. In addition, the SELD error averaged the errors in the aforementioned measurements.
3.3 Experimental results
Table 1 presents the performances of several approaches to solving SELD problems. In processing multiple predictions to address class-homogeneous overlapping, ADPIT and AD-YOLO were evaluated using multiple thresholds. The variance in scores between datasets indicates that the different task setups significantly affected the system. Nevertheless, AD-YOLO outperformed the other approaches in all setups, particularly in terms of and .
Table 2 summarizes the performances evaluated exclusively for the same-class overlapping, and denotes the change from which in Table 1. In the 2022 and 2020 setups, where only polyphony was offered in training, all formats experienced performance degradation. AD-YOLO proved its robustness in class-homogeneous polyphony in terms of the minimum degradation of the performance. Simultaneously, AD-YOLO outperformed the others in the absolute performance itself. In the 2021 setup, as more polyphonic () instances were trained and validated, the degradations were mitigated. While the others still suffered from the degradation in this setup, AD-YOLO achieved the maintenance and demonstrated the best performance again.
| Format | Unify Threshold () | () | ||
| DCASE 2022 | DCASE 2021 | DCASE 2020 | ||
| SED-DOA [6] | - | 0.7730 (+0.12) | 0.5259 (+0.08) | 0.6713 (+0.35) |
| ACCDOA [11] | - | 0.7742 (+0.21) | 0.4691 (+0.05) | 0.6608 (+0.32) |
| ADPIT [12] | 0.7315 (+0.15) | 0.4632 (+0.05) | 0.6985 (+0.37) | |
| 0.7316 (+0.16) | 0.4593 (+0.04) | 0.6999 (+0.37) | ||
| 0.7313 (+0.16) | 0.4590 (+0.04) | 0.7002 (+0.37) | ||
| AD-YOLO | 0.6011 (+0.07) | 0.3654 (-0.01) | 0.5623 (+0.24) | |
| (proposed) | 0.6093 (+0.08) | 0.3613 (+0.01) | 0.5557 (+0.25) | |
| 0.6142 (+0.09) | 0.3623 (+0.01) | 0.5571 (+0.25) | ||
3.4 The influences of SELD adaptations in AD-YOLO
Table 3 presents the influences of the main SELD adaptations of AD-YOLO. The first was to regress the angular loss to the mean squared error (MSE) of the relative coordinates as the YOLO. The other removed the sound existence losses , such that the class scores managed the presence of each event. The results show that both adaptations significantly affected the AD-YOLO performance. Furthermore, the result from 2021 suggests that learning the condition when the target class exists has a major role in AD-YOLO under interference.
| w/o. Adaptation | |||
| DCASE 2022 | DCASE 2021 | DCASE 2020 | |
| 0.5743 | 0.4288 | 0.3559 | |
| None | 0.5824 | 0.7348 | 0.3664 |
| AD-YOLO | 0.5359 | 0.3719 | 0.3197 |
4 Conclusion
We proposed an angular-distance-based YOLO (AD-YOLO) approach to perform sound event localization and detection (SELD) on a spherical surface. AD-YOLO assigns multi-layered responsibilities, which are based on the angular distance from the target events, to predictions according to each estimated direction of arrival. Avoiding the primal format of the event-oriented track output, AD-YOLO addresses the SELD problem in an unknown polyphony environment. In a series of evaluations on the data given in DCASE 2020 to 2022 Task 3, the model trained using the AD-YOLO approach exhibits outstanding performance and also proves its robustness in a class-homogeneous polyphony environment.
References
- [1] M. Crocco, M. Cristani, A. Trucco, and V. Murino, “Audio surveillance: A systematic review,” ACM Computing Surveys, vol. 48, no. 4, pp. 1–46, 2016.
- [2] X. Chang, C. Yang, X. Shi, P. Li, Z. Shi, and J. Chen, “Feature extracted doa estimation algorithm using acoustic array for drone surveillance,” in Proc. of IEEE VTC Spring, 2018, pp. 1–5.
- [3] P. Foggia, N. Petkov, A. Saggese, N. Strisciuglio, and M. Vento, “Audio surveillance of roads: A system for detecting anomalous sounds,” IEEE Trans. on Intelligent Transportation Systems, vol. 17, no. 1, pp. 279–288, 2015.
- [4] G. Valenzise, L. Gerosa, M. Tagliasacchi, F. Antonacci, and A. Sarti, “Scream and gunshot detection and localization for audio-surveillance systems,” in Proc. of IEEE AVSS, 2007, pp. 21–26.
- [5] A. Politis, A. Mesaros, S. Adavanne, T. Heittola, and T. Virtanen, “Overview and evaluation of sound event localization and detection in dcase 2019,” IEEE/ACM Trans. on ASLP, vol. 29, pp. 684–698, 2020.
- [6] S. Adavanne, A. Politis, J. Nikunen, and T. Virtanen, “Sound event localization and detection of overlapping sources using convolutional recurrent neural networks,” IEEE JSTSP, vol. 13, no. 1, pp. 34–48, 2018.
- [7] Y. Cao, Q. Kong, T. Iqbal, F. An, W. Wang, and M. D. Plumbley, “Polyphonic sound event detection and localization using a two-stage strategy,” in Proc. of DCASE Workshop, 2019.
- [8] L. Mazzon, Y. Koizumi, M. Yasuda, and N. Harada, “First order ambisonics domain spatial augmentation for dnn-based direction of arrival estimation,” in Proc. of DCASE Workshop, 2019.
- [9] M. Yasuda, Y. Ohishi, and S. Saito, “Echo-aware adaptation of sound event localization and detection in unknown environments,” in Proc. of IEEE ICASSP, 2022, pp. 226–230.
- [10] Y. Cao, T. Iqbal, Q. Kong, F. An, W. Wang, and M. D. Plumbley, “An improved event-independent network for polyphonic sound event localization and detection,” in Proc. of IEEE ICASSP, 2021, pp. 885–889.
- [11] K. Shimada, Y. Koyama, N. Takahashi, S. Takahashi, and Y. Mitsufuji, “Accdoa: Activity-coupled cartesian direction of arrival representation for sound event localization and detection,” in Proc. of IEEE ICASSP, 2021, pp. 915–919.
- [12] K. Shimada, Y. Koyama, S. Takahashi, N. Takahashi, E. Tsunoo, and Y. Mitsufuji, “Multi-accdoa: Localizing and detecting overlapping sounds from the same class with auxiliary duplicating permutation invariant training,” in Proc. of IEEE ICASSP, 2022, pp. 316–320.
- [13] J. Redmon, S. Divvala, R. Girshick, and A. Farhadi, “You only look once: Unified, real-time object detection,” in Proc. of CVPR, 2016.
- [14] A. Politis, S. Adavanne, and T. Virtanen, “A dataset of reverberant spatial sound scenes with moving sources for sound event localization and detection,” arXiv preprint arXiv:2006.01919, 2020.
- [15] A. Politis, S. Adavanne, D. Krause, A. Deleforge, P. Srivastava, and T. Virtanen, “A dataset of dynamic reverberant sound scenes with directional interferers for sound event localization and detection,” arXiv:2106.06999, 2021.
- [16] A. Politis, K. Shimada, P. Sudarsanam, S. Adavanne, D. Krause, Y. Koyama, N. Takahashi, S. Takahashi, Y. Mitsufuji, and T. Virtanen, “Starss22: A dataset of spatial recordings of real scenes with spatiotemporal annotations of sound events,” arXiv:2206.01948, 2022.
- [17] J. S. Kim, H. J. Park, W. Shin, and S. W. Han, “A robust framework for sound event localization and detection on real recordings,” Tech. Rep., DCASE Challenge, 2022.
- [18] M. Ester, H.-P. Kriegel, J. Sander, X. Xu, et al., “A density-based algorithm for discovering clusters in large spatial databases with noise.,” in kdd, 1996, vol. 96, pp. 226–231.
- [19] D. S. Park, W. Chan, Y. Zhang, C.-C. Chiu, B. Zoph, E. D. Cubuk, and Q. V. Le, “SpecAugment: A Simple Data Augmentation Method for Automatic Speech Recognition,” in Proc. of Interspeech, 2019, pp. 2613–2617.
- [20] J. Hu, L. Shen, and G. Sun, “Squeeze-and-excitation networks,” in Proc. of CVPR, 2018, pp. 7132–7141.
- [21] K. Cho, B. Van Merriënboer, C. Gulcehre, D. Bahdanau, F. Bougares, H. Schwenk, and Y. Bengio, “Learning phrase representations using RNN encoder-decoder for statistical machine translation,” in Proc. of EMNLP, 2014, pp. 1724–1734.
- [22] A. Mesaros, S. Adavanne, A. Politis, T. Heittola, and T. Virtanen, “Joint measurement of localization and detection of sound events,” in Proc. of IEEE WASPAA, 2019, pp. 333–337.