[table]capposition=top
Nested Skills in Labor Ecosystems: A Hidden Dimension of Human Capital
Abstract
Modern economies, characterized by their vast output of goods and services, operate through globally interconnected networks. As economies become more complex, so do these networks, coordinating increasingly diverse portfolios of specialized efforts and knowledge. In this study, we analyze U.S. survey data (2005–2019) to infer an underlying interdependency tree within the fabric of skill portfolios. Hierarchically constructed, this skill tree starts from widely needed, foundational abilities, constituting the root, and extends to highly specialized, niche skills required by select jobs at the extremities. The directionality is defined by the asymmetrical conditional probabilities of the presence of one skill given the existence of another. Examining 70 million job transitions in resumes and national surveys, we observe that individuals tend to delve deeper into these nested specialization paths as they ascend the career ladder to enjoy higher wage premiums. Nevertheless, the role of foundational skills for such ascent remains pivotal; without reinforcing them, the anticipated wage premiums may vanish. Hence, we further differentiate nested skills from others, with the former building on common prerequisites while the latter does not, and analyze disparities in these skill gaps across different geographic locations, genders, and racial/ethnic groups, observing how these variations in absorptive capacity impact wage premiums. Our analysis reveals a growing and concerning fragmentation in the divide between these two skill groups over the past two decades, suggesting further polarization within the job landscape [1]. Our findings highlight the critical role of robust foundational skills as a stepping stone to specialization and the economic advantages it can confer, reinforcing the need for balanced skill development strategies in complex economies [2].
Introduction
Complexity and specialization are two defining characteristics of economic growth [3, 4, 5, 6, 7, 8]. From the time humans shaped the first stone tool, the growth in technological complexity has snowballed to the point where creating and maintaining societal artifacts no longer rests within the realm of individual capabilities. This paradigm shift is exemplified by everyday items such as smartphones, toasters, and even pencils. The assembly of an iPhone, for instance, engages over 200 suppliers, each with its own workforce [9]. Likewise, the Toaster Project vividly demonstrates the limitations faced by an individual when tasked with building a simple toaster from scratch in today’s economy [10]. This daunting complexity isn’t a recent phenomenon. Indeed, as far back as 1958, the humble pencil served as a powerful testament to the intricate interdependence of global manufacturers in the creation of even the simplest items [11, 12].
The socio-economic complexity demands a continuous progression towards greater specialization of skills and knowledge and eventually coordination with countless other specialized individuals in expansive, complex global networks [7, 13, 14, 15, 16, 17, 18]. This ongoing evolution of the division of labor and knowledge lays the groundwork for the dynamic reconfiguration of skill dependencies, and sophisticated technologies that integrate individual inputs, thus relieving us from the need to acquire specific embedded skills [19]. As such, work has inevitably transitioned into a collective enterprise. The coordinated efforts of many, harnessed within global networks, contribute to the creation of the countless products and services that underpin our daily lives.
Though the collective nature of work isn’t new to us, the growing complexity and its resulting impacts on individuals remain an ongoing area of exploration. To meet the socio-economic complexity, we find ourselves not only increasing investments in education and training to sharpen our skills but also scrambling to acquire the right set of skills, knowledge, and abilities to participate effectively in these productive networks and bargain for a fair share of the output they create [20, 21, 22, 23, 24]. In this effort, certain skills can be gained without any prerequisites, hinging on the repetition and routinization of narrowly defined tasks, while other skills are not immediately attainable, requiring a sequential and cumulative learning path conditional on an individual’s previous attainments. The prerequisites for understanding calculus, for instance, are grounded in the knowledge of algebra and geometry. Similarly, professional skills are accrued systematically over a career [25, 26, 27, 28, 29, 30]. These inherent dependencies, evident in our educational and career trajectories, provide a roadmap for our learning journeys and consequently shape our social and economic structures [1, 31, 32, 33]. This leads to research questions: What does the structure of these interdependencies look like? And, more importantly, what implications does this structure carry? Though the framework may seem intuitive, it is essential to note that the hierarchical layout of skills reflected in job roles has often been assumed rather than empirically evidenced, as have its implications for individuals and society at large.
In this study, we analyze skill portfolios and their underlying structures using national surveys. Initially, we distinguish the generality of skills—those demanded by select occupations and those widely required—and differentiate a general skill group from a specific skill group based on their demand distribution profiles (Fig. 1). Next, we determine the asymmetrical conditional probabilities of the presence of one skill given the existence of another, thereby inferring a dependency direction between the two [34]. By aggregating these dependency relationships, we construct a nested hierarchical structure where the gradient from general to specific skills is vertically embedded (Fig. 2). The resulting structure presents an unbalanced tree, revealing its partially nested architecture [35, 36]. Indeed, as mentioned earlier, not all skills necessitate a dense web of dependencies. Therefore, we further differentiate between nested skills, which are underpinned by dense prerequisites, and those without such foundational support.
We examine three different datasets (median occupational ages, synthetic cohorts of individuals, and 70 million job transitions in resumes) and observe that as individuals progress up the career ladder, they tend to explore deeper into nested specialization paths and enjoy higher wage premiums (Fig. 3 and Fig. 4). Interestingly, these nested specialization paths, unlike the unnested ones, involve strengthening their foundational, general prerequisite skills. The distinction between nested and un-nested skills proves pivotal when predicting the level of education, experience, and wages associated with an occupation. It also indicates spatial labor division across U.S. regions and consequential disparities of race/ethnicity and gender (Fig. 5 and Fig. 6). Furthermore, given the significance of nested and un-nested skills for future career developments and wage premiums, structural changes in the hierarchical tree network over two decades are concerning, as they reveal an economy growing more nested and specialized (Fig. 7), with an increasingly widening gap between the two.
Results
Skill Generality (Individual Occurrences)
We first group skills into categories of generality, determined by the distribution of demand across occupations, ranging from niche skills required by a select few occupations to skills broadly demanded. The conceptual distinction between general and specialized skills is well-documented, though a systematic demonstration has been lacking due to limited data availability [21, 37, 38, 39, 40, 41, 42, 43, 44]. Ideal empirical data for our purpose would record how individuals acquire skills over time, the aggregate of which will uncover the structure of skills’ interdependency. This structure, however, is latent and not readily observed in reality. Instead, our study turns to publicly available surveys conducted by the U.S. Bureau of Labor Statistics (BLS), which record the importance and intensity of each skill, knowledge, or ability required in detailed occupational categories.
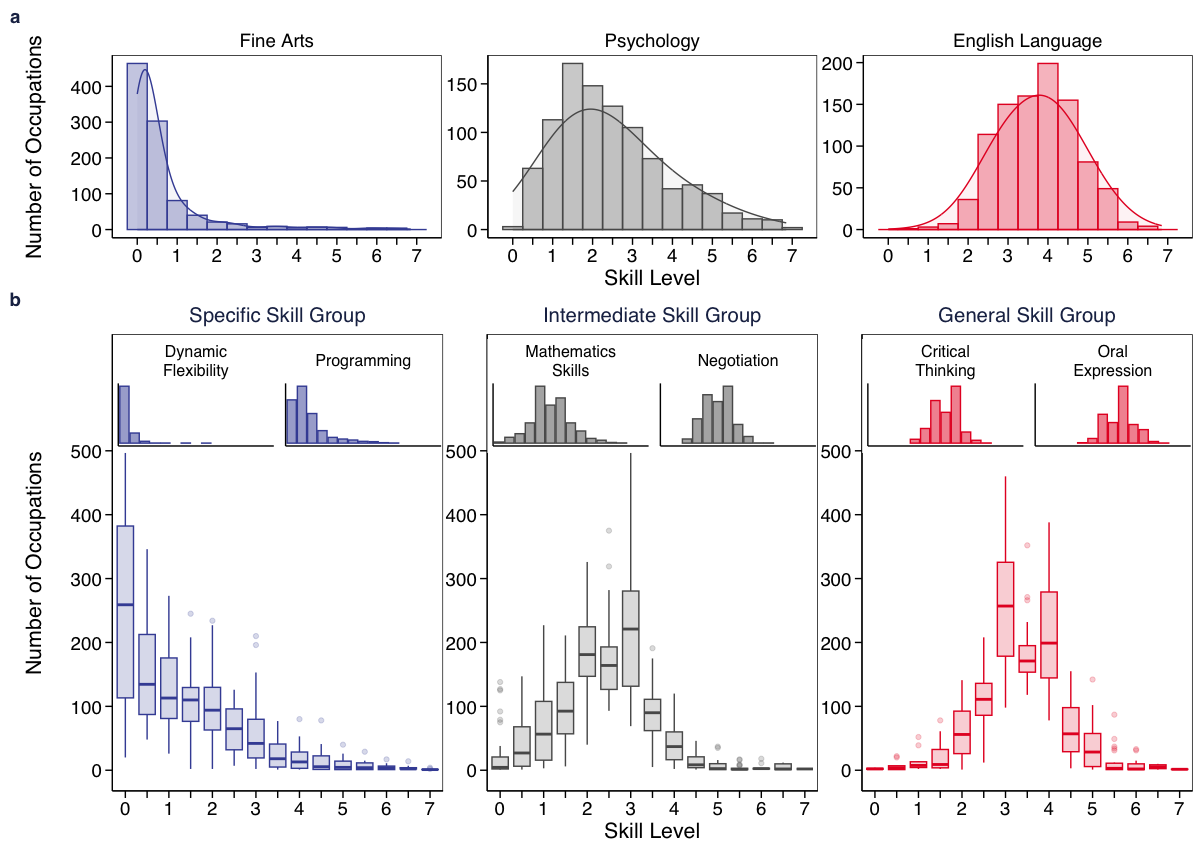
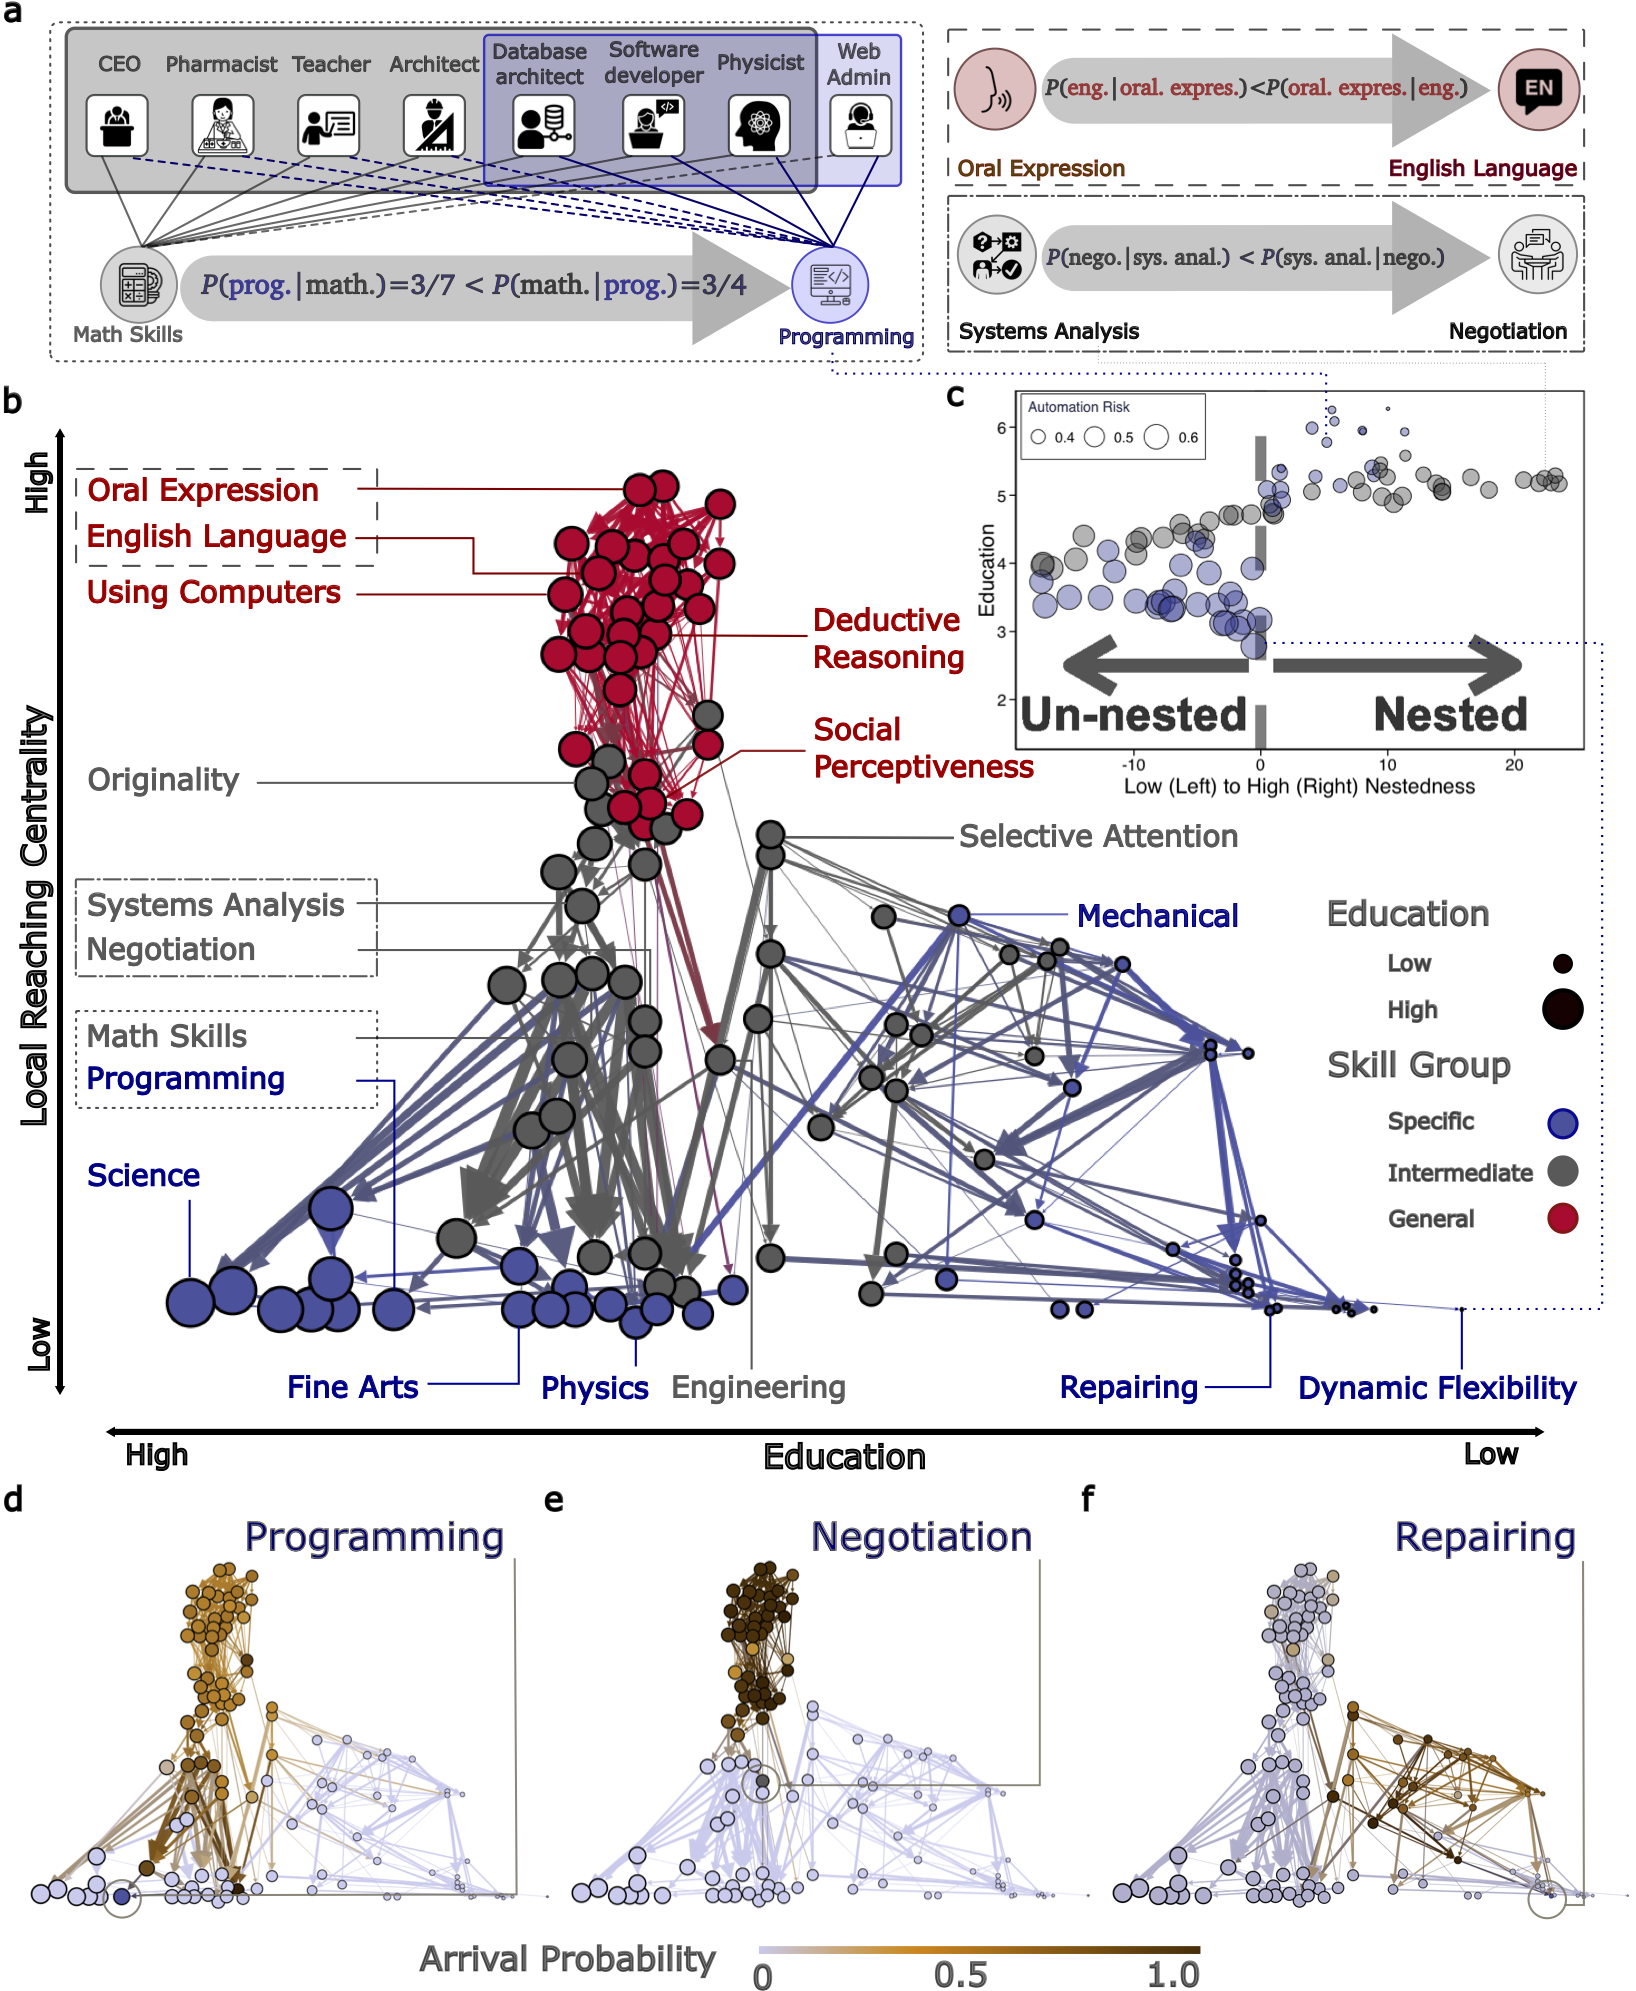
To empirically distinguish these skills, we proceed with the assumption that general skills experience ubiquitous demand across the economy compared to specialized skills. For instance, Fig. 1 (a) demonstrates that while only a handful of jobs require high-level Fine Arts skills, a significant level of English proficiency is universally necessary across many occupations. Therefore, we classify skills into categories of generality based on their demand profile shapes. Figure 1 shows the aggregated shapes in each category as the average occupation counts for given skill levels accompanied by quartile boxes (see Methods and SI for details). Insets present additional examples for each category, including dynamic flexibility and programming in the specific skill group, mathematics and negotiation in the intermediate, and critical thinking and oral expressions in the general group. The full list of each category in SI seems overall in good agreement with conventionally defined basic and specialized skills. Furthermore, increasing medians of the demand profiles in the skill categories are also consistent with the skill generality—0.87 for specific, 2.37 for intermediate, and 3.34 for general skills. In addition, we provide local reaching centrality as an alternative measure for generality in the next section, which is consistent with the measures above. Finally, we test our results against different group sizes and different clustering algorithms to ensure the robustness of our findings (see SI for details).
Skill Hierarchy and Nestedness (interdependency)
The extent to which general versus specific skills are relevant in many occupations is a longstanding topic of discussion in fields like labor economics, sociology, and management [21, 50, 51, 37, 38, 39, 40, 41, 42, 43, 44, 52, 53, 54]. From our experience, it is conceivable, and thus we propose here, that certain general skills serve as the foundation for acquiring a wide range of specific skills, as reflected in the structure of most college curricula where fundamental courses precede specialized ones. Figure 1 (b) provides select examples of these potential interdependencies. Take negotiation, for instance. The development of negotiation skills in the intermediate group hinges on improving one’s general skills of critical thinking and oral expression, classified under the general skill group. Similar prerequisite chains extend from critical thinking to math to programming encompassing all three skill groups depicted in Fig 1 (b). Allocation of skills across our empirically derived classes resembles certain biological mutualistic interactions wherein specialist species preferentially interact with generalists, suggesting integrations of general skills with more specialized ones under a nested structure [55, 35, 56]. Nevertheless, not every skill is perfectly nested. Certain specialized skills, such as dynamic flexibility (also in Fig. 1 inset), don’t conform to a nested structure. Furthermore, certain skills that are highly relevant to specific occupations may hold no value in others. These intricate dependencies across skill categories hint at a nuanced, hierarchical structure within these relationships.
As such, we build a vertical hierarchical tree, extending from general to specialized skills, incorporating dependencies and their respective directions. Figure 2 (a) illustrates the inferred weighted dependencies between pairs of skills and, consequently, their directionalities by leveraging the asymmetrical conditional probabilities of skills within occupations, given the existence of another [34]. Aggregating these dependencies across all potential skill pairings yields a nested hierarchical structure whose backbone network is shown in Fig. 2 (b). Nodes are colored according to their assigned groups and positioned relative to their educational requirements (horizontal) and local reaching centralities (vertical), illustrating the gradient from general to specialized skills. The local reaching centrality is defined as the proportion of the nodes in the hierarchy structure that is reachable from the focal node via outgoing edges, indicating how much other skills are dependent on the focal skill [45]. As such, this measure offers additional indicators of skill generality to the average level, and the correlation between the two is as high as 0.71.
The resultant structure manifests as an uneven tree, thereby hinting at a partially nested architecture [35, 36]. Indeed, as previously noted, not all skills necessitate a dense web of dependencies. Certain intermediate and specific skills in the left branch appear to rely more heavily on general skills than their counterparts in the right branch, whose coarsening structure of two clusters is consistent with the findings from previous seminal studies [24, 26, 57, 58, 59, 60]. However, the additional dimension of directionality reveals an important aspect of career development that may impact job disparity, as shown in the next section.
Much like nested mutualistic interactions in ecology [35, 56], where specialist species engage preferentially with generalists [55], skills may also exist within a nested, with more general types of human capital serving as the foundation for acquiring more specific ones. It is perhaps those skills that make the labor ecosystem distinctively nested, manifested as vertically deeper dense dependencies for fruitful nested specializations in terms of wages, education, demographic, and regional disparity (see the next Sections for details) [61]. To test this premise, we calculate to what extent a specific skill (blue nodes in Fig. 2 b) contributes to the nested structure of the occupation-skill ecosystem and divide them into those that contribute a lot (nested), and those that do not (unnested).
A skill’s individual contribution to the nested structure, , is defined as a deviation from a null expectation in which links of a focal node are randomly re-assigned, . is an observed nestedness, and and are the means and standard deviations of ’s counterfactual nestedness [35]. For each focal skill, , we run 5,000 iterations of the null model [62]. And for , we employ the overlap index (), checkerboard score, Temperature, and NODF, nestedness commonly used in ecology, to quantify nestedness [63, 63, 35] (See SI ). Figure 2 (c) presents skills’ nestedness contribution and required education levels, divided by the vertical line at the threshold into two subtypes: the nested and unnested skills. Correspondingly, these groups predominantly appear in the left and right branches in Fig 2 (b). In figurative terms, nested skills are akin to offshoots sprouting from a deeply rooted, sturdy trunk (a dense network of common prerequisites), whereas unnested skills lack such foundational support.
Figure 2 (d-f) highlights the influence of nested dependencies on skills such as programming, negotiation, and repairing, by color-coding nodes according to their reachabilities, calculated as arrival probabilities, to the focal skill nodes [49] (see Methods). Unlike the well-nested programming and negotiation skills, only a handful of other skills are reachable from repairing skills, which are mostly in the unnested parts of the skill tree. In the following sections, we differentiate nested from un-nested skills, with the former building on general skills while the latter do not, and examine their implications for individuals’ career development, wage premiums, and skill gaps across geographic locations, genders, and racial/ethnic groups.
Skill Categories in Career Trajectories
We now examine how the derived skill structure uncovers individual career trajectories through three empirical observations: median ages for occupations, synthesized cohorts from individual surveys, and job transitions in resumes. Each data source provides its unique strengths and weaknesses, which, when combined, complement each other and sketch a coherent picture of career paths. We begin our analysis with occupational ages because the assumption is that specializations are likely to demand a substantial investment of time and a dense set of prerequisites. Thus, it is reasonable to expect them to correlate closely with age.
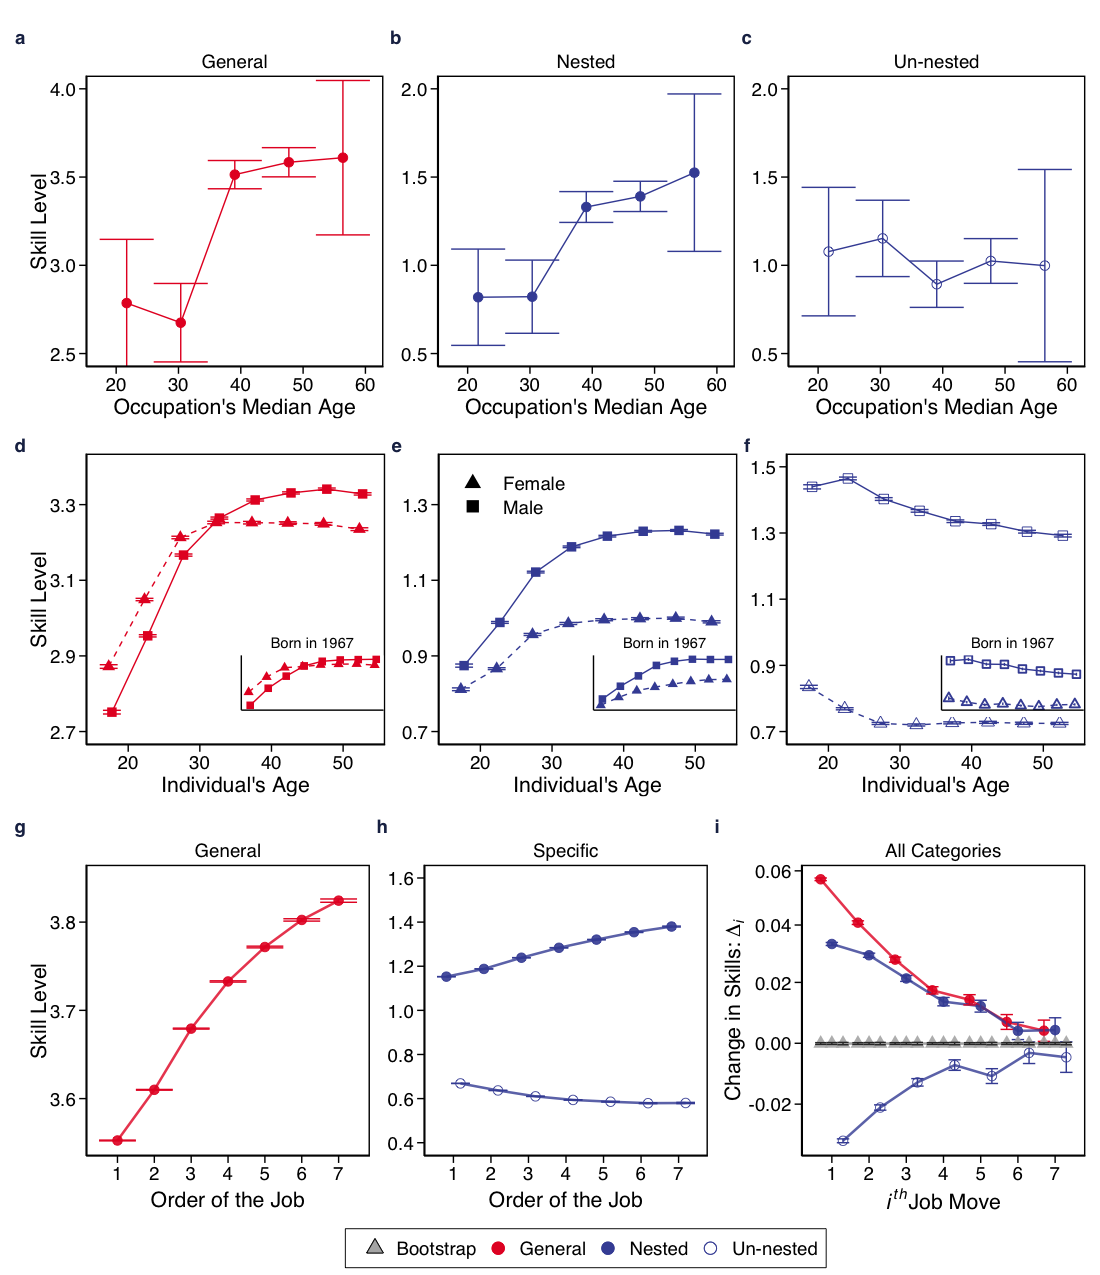
Accordingly, we compute the median age for each occupation using the Current Population Survey (CPS) and the levels of general, nested, and unnested skills in occupations, segmented by their median ages (see Methods). As shown in Fig. 3 (a-c), the outcomes align consistently with our predictions. Occupations with median ages of over 30 demand high levels of both general and nested skills, while unnested skills, supposedly lacking interdependencies, do not demonstrate any significant correlations with ages, as shown in Fig. 3 (c).
We examine if our results hold true across career trajectories by constructing synthetic cohorts using the CPS microdata. The data provide yearly repeated cross-sectional surveys, but respondents cannot be longitudinally traced. Therefore, we construct a “synthetic panel” that mimics the career trajectories of respondents, by connecting snapshots of surveys through their birth years. Suppose we construct a 1967 cohort for Fig. 3 (d-f) insets. We first identify all observations of individuals born in 1967 from the dataset and sort them as if we observed the same individuals as they aged. We repeat this for different birth cohorts, excluding observations of respondents of non-full-time and below age 17 or above 55.
Figure 3 (d-f) shows the skill composition of synthetic cohorts from 1980 to 2022, with insets for the 1967 cohort. Consistent with the findings in Fig. (a-c), the outcomes from the synthetic cohorts provide further insights. Age 30 is again a significant transition point. General and nested skills concurrently increase sharply until around 30, when unnested skills experience a moderate decrease. Over the age of 30, the rise in overall skill levels stabilizes.
The advantage of this second dataset is that it includes not only the age of individuals but also other demographic information, allowing us to decompose our findings by gender. Differentiating skill trends of men and women uncovers a gender gap in specializations that emerges around 30. Men continue to grow their general and nested skills until well into their 40s, whereas, for women, the increase in these skills hits a plateau in their early 30s, the typical age range for first-time mothers in the US. These findings are robust to conditioning out yearly economic conditions, as shown in SI . In the following Sections and in SI , we offer more detailed breakdowns of these gender disparity trends with respect to race and ethnicity.
Lastly, we complement our findings using additional datasets sourced from resumes that record individual job transitions. The data encompass over 70 million job transitions documented in over 20 million resumes, eliminating the need for synthetic cohorts by providing a direct record of job sequences of individual workers. However, this dataset does not include age or gender information for detailed analyses and is known for its biased sampling, favoring more nested job roles. Hence, while these data are valuable for corroborating the previous findings, they cannot replace previous datasets.
Figure 3 (g-h) shows the average skill levels required in job sequences held across career paths in which jobs are ordered by date, and Fig. 3 (i) displays changes in skill requirements for the th job transition, , excluding job transitions within the same occupation, because in these transitions by construction. On aggregate, career journeys unfold with increasing stocks of both general and nested skills over their careers, in a way that suggests that nested specialization paths require simultaneous increases in nested specific skills along with their dependency skills. In addition, skill portfolios typically stabilize within the first five job transitions, namely, . In the first three jobs (), nested skills require more general skills than later, that is, , after which they become comparable . This continued growth in general skills across career paths is intriguing, suggesting that these skills need to be continuously enhanced regardless of how advanced we are in our career journeys. As a benchmark, we create bootstrapped job sequences denoted in gray marks around zero, which randomize the order of jobs as if there is no career development. We confirm that the empirically observed trends indeed are attributed to career developments (see SI for details).
All three empirical observations consistently depict nested specializations (i.e., growth in both general and nested skills) throughout career trajectories, while unnested skills are left relatively underdeveloped. However, the final analysis of resumes in Fig. 3 offers the first direct evidence of a recurring yet counterintuitive pattern previously observed in occupational age and synthetic cohorts: specialization goes hand in hand with generalization. This suggests that the conventional model, where basic general skills precede advanced specialized skills, is not entirely accurate. Instead, career paths tend to unfold with increasing emphasis on general skills and their dependent, nested skills.
One might argue that our findings are driven by management/administration jobs, which are typically undertaken later in careers with higher wages. However, even after repeating the entire analysis without these jobs, we found consistent results (see SI ). Furthermore, we repeated the entire analysis, excluding social skills, to determine if they were driving our findings. Once again, our results remained robust, suggesting that our findings are attributed to the intrinsic structure of skills rather than the influence of particular social skills or managerial jobs (see SI ).

Skill Categories and Wage Premiums
The differentiation between general and nested/unnested skills turns out to be vital when predicting the levels of education, experience, and wages associated with a given occupation. Figure. 4 (a-b) shows that the required education for occupations and their return as average annual wages tend to rise (fall) in tandem with their nested (unnested) specializations. Aligned with our premise of wage premiums for nested specializations, the results are not entirely surprising. However, these observed wage premiums (blue bars) in Fig. 4 (c) almost fully disappear when required general skills are controlled (shaded bars), while the observed wage penalty for unnested skills turns into a comparable wage premium, suggesting the driving force of general skills behind the wage effect of nested skills. Further analyses in the SI show that our findings are robust to adding control variables for experience, training, and workplace experiments, persist across major occupational groups, and are not driven by managerial occupations or social skills (see SI )
These findings support a labor market model in which the primary educational investment and wage rewards for specializations presuppose simultaneous accumulated and refined general skills. Without such strengthening of general skills, specialization (now in specific skills) does not yield higher wages. The development of general skills is perhaps instrumental to accruing absorptive capacity [64], enhancing further skill accumulation in later periods. Having already established absorptive capacity in a specific domain, gathering additional knowledge required in future periods becomes easier. This cumulative process is essential to taking advantage of any key external knowledge that may become accessible and necessitate further education to achieve future wage premiums. In addition, results support the significant emphasis placed on early childhood education as a cornerstone for future academic achievement and labor market success [27].

Disparity in Geographic and Demographic Groups
We examine skill categories across various demographic groups to gain a more comprehensive understanding of their roles in inequalities. Figure 5 (a) compares skill, education, and wage differences across race/ethnic groups with White peers as the baseline group, suggesting disparities for Black and Hispanic workers are mainly attributed to lower nested specializations. In addition, greater unnested specializations for Hispanic employees also account for this disparity. These findings suggest that closing wage gaps for blacks requires different solutions than for Hispanics.
Next, Fig. 5 (b) shows marked differences in gender gaps across social groups. The most pronounced disparities are seen in both nested and unnested specializations, which contribute to the wage gap between men and women. Encouragingly, this gap has been narrowing over time, as demonstrated in SI . Nevertheless, the disconnection between education and wages is puzzling. Women invest more in education with higher accumulated general skills than men do, with Asian women being a notable exception, but they do not seem to translate well into higher wages. This disconnect is perhaps attributed to a lack of occupational specializations, either nested or unnested. These analyses highlight that traditional approaches focusing solely on skill gaps with educational attainment may overlook all relevant aspects of skill disparities. Although a deeper analysis of the causes and consequences of these disparities is beyond the scope of the current paper, given the complex interaction between wages and skill types, such an analysis may provide valuable insights for labor market policies, considering the intricate interplay between wages and skill types.
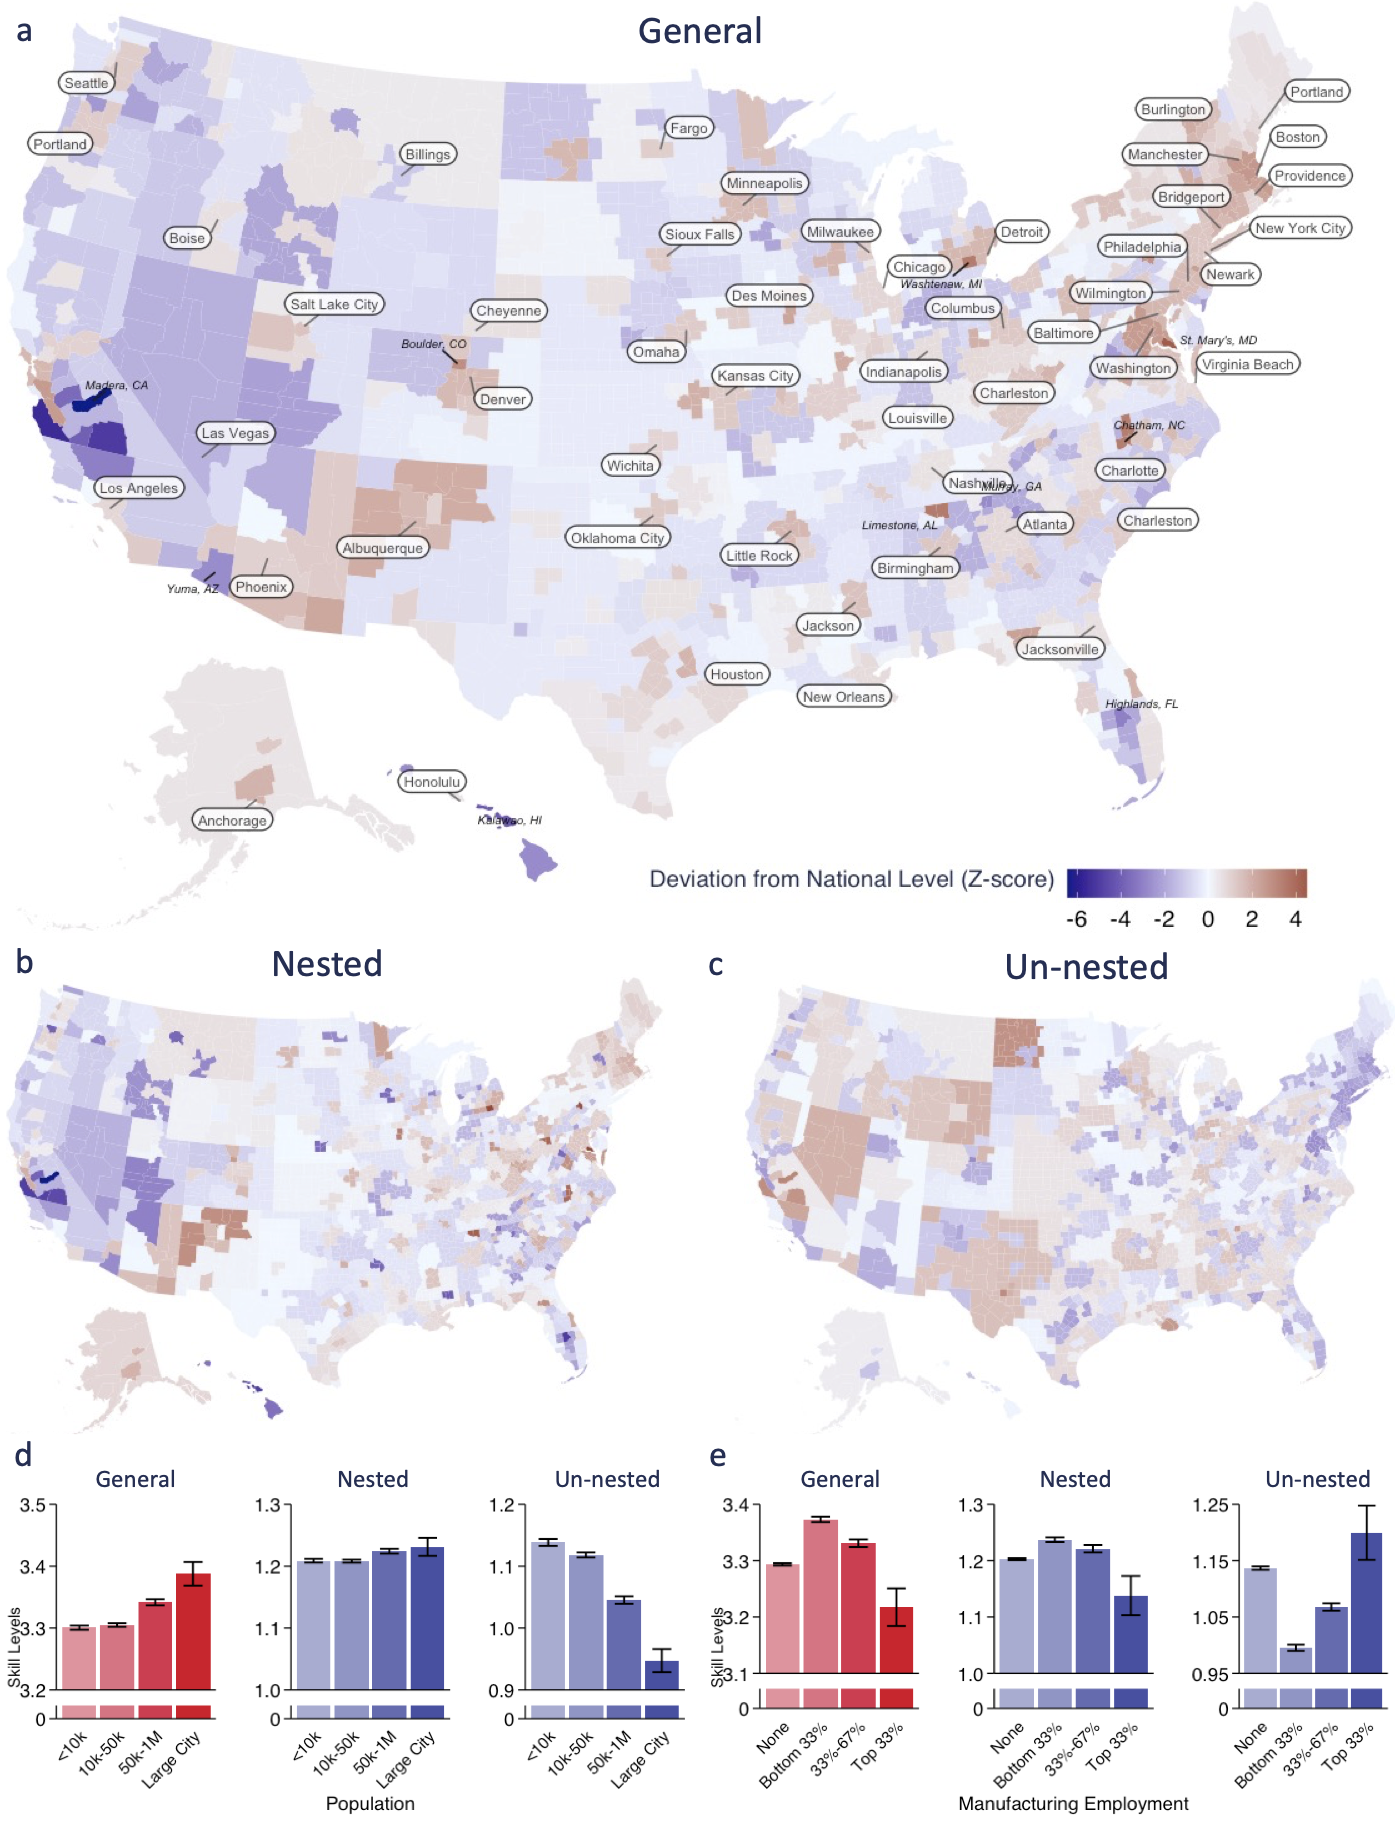
Lastly, we present skill maps in Fig. 6 with the distributions of general, nested, and unnested specific skills across U.S. counties (a-c), cities of various sizes (d), and cities with different concentrations of manufacturing (e) (see Methods). Broadly speaking, the maps show a clear concentration of general skills in densely populated urban areas, reflecting the diverse and complex economic activities found in these locales [65, 66, 67, 68, 69, 70]. Large cities tend to have higher levels of general and nested skills. However, the starkest disparities between smaller and larger cities are seen in the prevalence of unnested skills, which are significantly less common in cities with over a million inhabitants, a known threshold for cities transitioning towards innovative economic specializations [67].
Upon grouping cities by manufacturing employment relative to the national average, we find that cities highly specialized in manufacturing tend to exhibit lower levels of nested specialization but higher levels of unnested specializations. This shows that cities indeed specialize in distinct directions. Interestingly, skill patterns shift in a non-linear fashion across cities with increasing concentrations of manufacturing employment. Both a strong dependence on and a complete absence of, manufacturing correlate with adverse skill bases, i.e., skill bases dominated by unnested skills and a lower prevalence of general and nested skills. Conversely, skills that typically command high wage premiums are overrepresented in cities with intermediate levels of manufacturing activity.

Widening gap in the skill structures
Figure 7 paints a somewhat concerning picture, given the important roles that nested and unnested specializations play in both career progression and demographic and regional disparity. Fig. 7 (a) indicates an increased demand for general skills (the shift from dotted to solid distribution) and higher wage premiums over recent decades (see SI ). Moreover, the seemingly static distribution of specific skills belies a countervailing specialization pressure in the opposite direction, an increase in nested specializations, and a decrease in unnested specializations, shown in Fig. 7. At the same time, the skill structure has become even more nested, decreasing the checkerboard score and temperature from 438.67 to 356.4 and from 40.07 and 31.89, respectively, and increasing NODF and from 39.06 and 573,873 to 41.72 and 651,030, respectively, between the years 2005 and 2019 [71, 72]. Note that the lower the checkerboard score and the higher NODF indicate the more nested the structure. As a result, the skill dependency structure in Fig. 7 (c) illustrates a wider gap between the nested and unnested branches over the decades. The nested branches widen horizontally with increasing depth, suggesting an increased complexity and interdependency in specializations [73, 74].
Echoing previous studies, over the last two decades, the chasm between the two types of specializations has alarmingly broadened within the educational domain [75, 76, 2]. Given the significance of nested and un-nested specializations for future career developments and wage premiums, structural changes in the hierarchical tree network are concerning, as they reveal an economy growing more nested and specialized with an increasingly widening gap between the two, implying strongly rooted chronic disparity.
Discussion
The hierarchical structure and its inherent directionalities add a new dimension to the rising field of economic complexity, providing a deeper understanding of how knowledge is accumulated within a population and how it is expressed in the economic activities of a firm, city, region, or country [4, 77, 68, 78, 79, 80, 81, 82, 83, 84]. Their specializations, contingent on their unique existing capabilities and circumstances, will thus lead to idiosyncratic paths. And yet, observed developmental paths seem to recapitulate the universal path of related diversification of so-called product or industry spaces [67]. In addition, while the network representations in these studies are mostly undirected, diversification seems to follow a direction, increasing in complexity [85, 77, 86, 87]. The directional dependencies that we propose break the symmetry in traditional co-occurrence networks for a better understanding of structural changes in economic complexity.
In increasingly complex, large teams, social skills become crucial when specialization necessitates workers to coordinate with team members possessing different specialized skills [13, 88, 24, 89, 90]. Indeed, social skills and managerial occupations have been increasingly valuable, especially later in one’s career with higher wage expectations [91, 92, 93, 94, 95, 96, 97, 98, 18]. Our framework identifies and locates them in the skill structure along with general and nested skills (see SI ), explaining their recent growths and significant role in wage premiums (see SI ). Nevertheless, our results go beyond what social skills and managerial occupations contribute to wage premium, meaning the results are robust to their absence in analyses (see SI ). Therefore, social skills are valuable not just because of their role in sociality but because of their structural importance serving as foundational building blocks of human capital, thus increasing the absorptive capacity to enable further valuable specialization and thus more complex organizations [99].
The nested structural categories also add a new dimension to the theory of human capital [100]. By differentiating general human capital into a structured spectrum, from the most foundational and general to the most specialized, human capital is comparable at different scales of organizations, which is essential for policy implications. More importantly, nested structure reiterates valuable insight that skills are not acquired in isolation. This perspective challenges the simplified view of acquiring general skills early in life, later supplemented by specialized skills. Life-long learning requires more than just acquiring new specialized skills; it necessitates complementing such investments with deepening one’s general skills, a point echoed by recent recommendations from Stanford and Harvard bringing back math courses over applied alternatives like data science and statistics [101]. To learn from someone you interact with, you must know the foundational knowledge as a prerequisite for the knowledge being learned with fluid reasoning abilities, known as the “Flynn Effect” [102, 103].
Finally, just as skill acquisition at the individual level is embedded in a hierarchical web of prerequisite dependencies, so may capability acquisition at the macro level of economies such as firms, cities, and nations. This perspective bridges the micro-level of jobs and wages with the macro-level of the economic system as a whole. This intrinsic learning sequence suggests that economies may be unable to follow optimal growth trajectories [104, 105, 106]. As a result, it uncovers structural disparity across different social groups that would have remained underappreciated, had we relied on information on educational attainment or wages [61].
Throughout the paper, we implicitly assumed that the additional dimension of directedness is uncovered without relying on other occupational characteristics, such as required education, wages, or regional and demographic factors. This is partially true for practical purposes and requires further scrutiny with detailed data and qualitative complementary studies. The dependency structure is incomplete and could be confounded by extraneous factors for skills to co-occur in occupations, providing a limited mechanistic explanation. The comprehensive understanding calls for detailed observations of individuals’ skill endowments, for example, by conducting extensive surveys of employees rather than jobs asking how they navigate a delicate balance accounting for the required complexity, complementarity, and coordination among heterogeneous skills, while also considering the ease of skill acquisition by individuals [102]. In addition, our data primarily describe the U.S. labor market, which has idiosyncracies in its education system, industrial composition, and urban structure. How well these findings generalize to other work settings and economies, especially those at different stages of development, remains a task for future research [107].
Data and Methods
Skill Generality Categories
The Occupational Information Network (O*NET) includes survey records of job-oriented attributes and worker-oriented descriptors [108]. Job-oriented attributes include wage, employment, educational requirement, workplace experience, and training. Worker-oriented descriptors include 120 work-relevant knowledge, abilities, and skills (labeled skills throughout the text for brevity). Each occupation includes a list of skills with their sophistication levels (or intensity) and the importance of those requirements, each resulting in an occupation-skill matrix. Although we chose the former because of our hypothesis of skill progression and hierarchy, the two measures are highly correlated (0.94); thus, the results are robust to the choice of measurements.
Each skill, therefore, lists the required levels for each occupation whose distribution shape illustrates its generality across occupations, shown in Fig. 1 (a). As such, we group skills by their similar distribution shapes by -mean clustering algorithms with correlation metrics. Figure 1 (b) shows the characteristic shapes of each skill group. We provide three statistical tests for optimal and show the findings are qualitatively robust to some variations (see SI ). Throughout analyses, we mainly analyze the effects of general and specific skills to filter possible noises.
In addition to shapes and averaged skill levels (see the main text), we provide local reaching centrality as an alternative measure for skill generality, and use them to vertically embed nodes in Fig. 2 (b). The local reaching centrality is defined as the proportion of the skill hierarchy structure that is reachable from a skill via outgoing edges [45]. The higher reaching centrality in the hierarchy structure is, therefore, the more interdependent skills. As such, this measure offers additional indicators of skill generality.
Conditional Probabilities for Skill Hierarchy Structure
The conditional probability that infers the directionality operates on binary values, but skill levels are recorded in continuous variables. We, therefore, apply the disparity filter (statistically significant links keeping heterogeneity of node degrees) to an occupation-skill matrix whose entry is a required skill level for each occupation [109]. Parameters are chosen such that i) the rank of skill terms in the strength (from the weighted network) and degree (in the binary network) is preserved, ii) the rank of occupations’ skills of each category in the weighted network is preserved in the binary network (see SI ) discusses details and compares the state of data before and after the transformation.
We then calculate conditional probabilities of every pair of skills in the matrix to infer directions between two skills, as illustrated in Fig. 2 (a). Figure 2 (b) presents a backbone structure of the aggregated all skill pairs, according to [34]. Please see SI and [34] for the detailed procedures and choices of parameters and thresholds.
Reacheability with Arrival Probability
To quantify what are the chances of getting to the focal skill given the pre-requisite skill , we calculate reachability from one skill to a focal skill. It is basically arrival probability, or a version of hitting probability, of a random walk arriving at from node given the weighted skill dependency network [49]. For source and target skills , this is numerically equivalent to first deriving the probability of random walks of length by raising the weighted-directed adjacency matrix (skill dependency network in Fig. 2), , to power , and then calculating . We obtain the final arrival probability by summing over a sufficient number of path lengths until reaching saturation points. To compute arrival probabilities for focal skills (such as programming, negotiation, and repairing) in Fig 2 (b-f), we apply the R package markovchain [110].
Nested and Unnested Skill Categories
Nestedness is a structural characteristic that describes interactions in an ecological system, where specialist species often interact with a subset of generalists. Unlike ecological systems, however, in SI we show the skill-occupation matrix is a noisy nested structure far from the perfect upper-left triangle when sorted by marginal totals (fills). This imperfect nested structure may account for the constraints on occupations (limited carrying capacity), introducing severe competition between skill species. Indeed, in SI we show unlike broad skill generality, occupation’s scope is narrowly distributed, indicating that the total amount of skill levels embodied in an occupation is not much different from each other, regardless of how much they are paid and how advanced education is needed (see SI ).
We attribute occupations’ limited scope of skills to the limited attention and cognition/physiological capacity that individual workers can offer. There is only so much a single person can equip and do for a single job [7, 111]. Thus, individuals’ capacity restricts how many skills an occupation can bundle. This constraint explains the process of specializations needed for a complex job. The structure now includes not only nested structure but also mutually exclusive presences, possibly due to competition between skills within an occupation. In contrast to occupations, skills do not have such constraints. Therefore, for limited occupation scope, we only consider the skills’ contribution to nested structure.
This constraint distinguishes the nestedness of extensive economies such as nations, regions, and urban areas from the nestedness of occupations in that specializations dominate the evolution labor market while others are dominated by diversification. As a result, the skill-occupation matrix is expected to be modular as well as nested with mutually exclusive modules. Nested-modular matrix is a complicated structure and will be beyond our current scope [112, 113]. Here, we will focus on individual skills’ contributions to the nested structure and differentiate skills that contribute to the nested structure from those that do not.
Therefore, we quantify a skill’s contribution to the nested structure, , defined as a deviation from a null model where the edges of a focal node to occupations are randomly reassigned, that is, . is a nestedness score, and and are the means and standard deviation derived from the null model [35]. For each focal skill , we run 5,000 iterations for each skill [62]. We employ the overlap index checkerboard score, Temperature, and NODF, nestedness scores commonly used in ecology, to quantify nestedness [63, 71, 114, 35]. In addition, we only consider skill’s contribution and do not occupation’s contribution.
Figure 2-(c) shows of specific skills (blue nodes in Fig 2-b) with the divide between the two groups, those that contribute to the nestedness (nested) and those that do not (unnested). Only specific skills are considered in this differentiation in order to compare skills at the same generality level to avoid comparing apples to oranges. It is not fair for specific skills to be compared with general skills as they have more edges.
Skill Categories and Educations
Education variables in O*NET are categorized into twelve discrete grades, ranging from below high school (1) to post-doctorate (12). Each occupation includes the proportion to which corresponding sampled employees had to have a given educational level to be hired. With this information, we calculated an occupation’s associated education variable as a weighted average of the employees. For instance, Chief Executives’ expected education variable is calculated as where is a fraction of CEO whose education is , and is a corresponding value of education category, ranging 1 for below high school to 12 for post-doctorate. For an educational requirement to a skill , , we average the skill’s education levels of occupations, , weighted by the importance of skill, importance, that is .
Demographic and Geographic Distribution of Skills
Median occupational ages are derived from the Current Population Survey (CPS) of the year 2019, and synthetic cohorts from individuals born in each year are created from the individuals’ survey conducted jointly by the U.S. Census Bureau and the Bureau of Labor Statistics [115]. Different occupational taxonomies between the two datasets are mapped by the BLS crosswalk.
Demographic analysis: CPS microdata also include gender and race/ethnicity demographic information. We chose four categories, Whites, Blacks, Asian and Hispanic, as they are the bulk of the sample, and any individuals of Hispanic background are included in that category for Fig. 5. To avoid attrition and early retirement, we include only full-time workers, employed at the time of the survey, who are between 18 and 55. For each demographic category, the average skill level is calculated for their occupational composition. The microdata records individuals’ education, income wages, and the number of hours worked. We adjust wages for inflation and account for the number of hours worked, to compute an adjusted weekly wage, which is readily comparable across the population. The race/ethnic disparities in Fig. 5 are a ratio of each demographic quantity (general level, nested level, unnested levels, education, and weekly wages) to those of White workers, following [74] identifying a dominant social group, a social group if it is at least 1.5 times more likely to be employed in the focal occupation. Likewise, the gender gap within each race/ethnicity is measured as a ratio of those quantities to those of male workers. Because we do not have a matched sample, we obtain 95% confidence intervals by a random sub-sampling. In each iteration, we take 10% of the subpopulation of interest, for instance, Asian male and Asian female workers, and estimate all corresponding measures. Repeating this sampling and estimation process in 10,000 iterations, we obtain the distribution for each estimation and derive the 95% confidential intervals. The skill, education, and wage estimations of Fig. 5 average over the years. However, dynamics over time also carry information. In SI, we show such temporal dynamics.
Geographic Analysis: To construct skill maps in Fig. 6, we calculate each category’s skill levels in the U.S. county. The BLS provides occupational compositions for each county, from which the average skill level is calculated. We then calculate the national average and the standard deviation for each skill category to derive a standard score (also known as z-score). For Fig. 6 (d), we group cities (core-based statistical areas) by populations [ 10 thousand, 50 thousand, 1 million, and one million] based on the 2010 Census population estimates. Figure 6 (e), we group cities by the intensity of their manufacturing industries, using the U.S. Census County Business Patterns in 2019. At the 2-digit NAICS codes, we take 31-33 as manufacturing industries and calculate the location quotient of manufacturing employment (the ratio of manufacturing employment from the metro area total employment over the nationwide ratio). Matching metro areas to counties, we designate counties with no manufacturing employment to group ‘None’, and group the rest based on quotient 33% and 66% quantiles of the measure into bottom, middle, and top.
Skill Compositions in Career Trajectories
The expected skill levels of each category in the career sequences. We studied over 70 million job sequences (8-digit SOC) in 20 million individual resumes between 2007 and 2020 from Burning Glass Institute. We then calculate the expected skill levels in th job by averaging the skill levels of those occupations appearing in th sequences, shown in Fig 3 (g-h). From these sequences of averaged skill levels, we calculate skill level changes in th job transition levels, , shown in Fig. 3 (i).
We exclude job transitions shorter than one year or within an occupation (i.e., moving from one company to another without changing the occupation) for our primary analyses. The decision to remove such occupations arises from the oddity we observed in most such jobs. For instance, various janitors or models became a CEO immediately or with overlapping periods. Nevertheless, our findings are robust to this decision (see SI for details).
To see if the observed trends are truly attributed to career trajectories, we shuffle job history in resumes, bootstrapping the job sequences, to produce a benchmark, and compare it with the skill changes we empirically observed in career moves in Fig. 3 (i), confirming that the empirically observed trends are unique to the career trajectories.
Temporal evolution of skill structure
We utilize this evolution of skill structure to demonstrate the implication of our constructed nestedness skill structure. We choose two sufficiently apart datasets to capture the structural difference, that is, version 9.0 in 2005 because it is the first version comparable to the most recent version while offering satisfactory coverage of occupational information (such as education and wage), and version 24.1 in 2019 because it is the most recent version without the potential contamination of irregular patterns due to the pandemic. The empirical challenge is that the classification system is continuously updated in response to technological progress, economic transformation, and social reconfiguration [116].
We created a crosswalk between occupation classifications in 2005 and 2019 that is not immediately available but only between two consecutive years. Occupation codes in 2005 are matched to those in 2006, and then those in 2006 to 2009, … to 2019. Our crosswalk automatically matches 968 occupations in 2019 skill data and 941 unique occupations in 2005 skill data, and the rest are manually matched (See SI ). Using these occupations and their skill levels in 2005, we construct the skill structure of 2005 in Fig. 7 (c), using comparable parameters and layouts for both years to make the networks most comparable (see SI).
Acknowledgement
H. Y. and M. H. acknowledge the support of the National Science Foundation Grant Award Number EF-2133863. The authors are grateful to Yong-Yeol Ahn, Inho Hong, Hyunuk Kim, Balazs Lengyel, Muhammed Yildirim, James McNerney, Morgan Frank, Christopher Esposito, Ulrich Schetter, Serguei Saavedra, James Evans, and Brian Uzzi for their valuable discussions and feedback. N. F. gratefully acknowledges financial support from the Austrian Research Agency (FFG), project #873927 (ESSENCSE).
References
- [1] David H. Autor and David Dorn “The Growth of Low-Skill Service Jobs and the Polarization of the US Labor Market” In American Economic Review 103.5, 2013, pp. 1553–97 DOI: 10.1257/aer.103.5.1553
- [2] Shahad Althobaiti et al. “Longitudinal Complex Dynamics of Labour Markets Reveal Increasing Polarisation” In arXiv preprint arXiv:2204.07073, 2022 arXiv: https://arxiv.org/pdf/2204.07073v1.pdf
- [3] Robert L Carneiro “On the Relationship between Size of Population and Complexity of Social Organization” In Journal of Anthropological Research 42.3 The University of Chicago Press, 1986, pp. 355–364 DOI: 10.1086/jar.42.3.3630039
- [4] César A Hidalgo “Why Information Grows : The Evolution of Order, from Atoms to Economies” Boulder, UNITED STATES: Basic Books, 2015 URL: http://ebookcentral.proquest.com/lib/uic/detail.action?docID=2039752
- [5] Joseph Henrich “The secret of our success” In The Secret of Our Success princeton University press, 2015
- [6] Peter J Richerson and Robert Boyd “Complex societies: The evolutionary origins of a crude superorganism” In Human nature 10 Springer, 1999, pp. 253–289
- [7] Benjamin F. Jones “The Burden of Knowledge and the “Death of the Renaissance Man”: Is Innovation Getting Harder?” In The Review of Economic Studies 76.1, 2009, pp. 283–317 DOI: 10.1111/j.1467-937X.2008.00531.x
- [8] Melanie Mitchell “Complexity : a guided tour” In Oxford University Press Oxford [England] ;: Oxford University Press, 2009
- [9] David Barboza “An iPhone’s Journey, From the Factory Floor to the Retail Store” In The New York Times December 2, 2016, pp. 3–7 URL: https://www.nytimes.com/2016/12/29/technology/iphone-china-apple-stores.html
- [10] Thomas Thwaites “The Toaster Project: Or a Heroic Attempt to Build a Simple Electric Appliance from Scratch ” Princeton Architectural Press, 2011
- [11] Leonard E Read “I, pencil: My family tree as told to Leonard E. Read” In In: The Freeman 8.12 Reprinted by The Library of EconomicsLiberty, 1958 URL: http://www.econlib.org/library/Essays/rdPncl1.html
- [12] Stephen J. Dubner “How Can This Possibly Be True?” freakonomics.com, 2016, pp. 236 URL: https://freakonomics.com/podcast/how-can-this-possibly-be-true/
- [13] Stefan Wuchty, Benjamin F Jones and Brian Uzzi “Increasing Dominance of Teams in Production of Knowledge” In Science (American Association for the Advancement of Science) 316.5827 Washington, DC: American Association for the Advancement of Science, 2007, pp. 1036–1039 DOI: 10.1126/science.1136099
- [14] Gary S Becker and Kevin M Murphy “The Division of Labor, Coordination Costs, and Knowledge” In The Quarterly Journal of Economics 107.4 Oxford University Press, 1992, pp. 1137–1160 DOI: 10.2307/2118383
- [15] G S Becker and K M Murphy “The Division of Labor, Coordination Costs, and Knowledge” In The Quarterly journal of economics 107.4 Cambridge, Mass. [etc.]: Oxford University Press (OUP), 1992, pp. 1137–1160
- [16] James McNerney et al. “How production networks amplify economic growth” In Proceedings of the National Academy of Sciences of the United States of America 119.1, 2022 DOI: 10.1073/pnas.2106031118
- [17] Pierre Azoulay, Benjamin F Jones, J Daniel Kim and Javier Miranda “Age and High-Growth Entrepreneurship” In American Economic Review: Insights 2.1, 2020, pp. 65–82 DOI: 10.1257/aeri.20180582
- [18] Frank Wouden and Hyejin Youn “The impact of geographical distance on learning through collaboration” In Research Policy 52.2, 2023, pp. 104698 DOI: https://doi.org/10.1016/j.respol.2022.104698
- [19] Gamble and Blackwell “Knowledge Management: A state of the art guide” In Director (London, England : 1983) 55.6 London: Institute of Directors, 2002
- [20] Jacob Mincer “Schooling, experience, and earnings.”, Human behavior and social institutions, 2 New York: National Bureau of Economic Research; distributed by Columbia University Press, 1974
- [21] Gary S. Becker “Investment in Human Capital : A Theoretical Analysis” In Journal of Political Economy 70.5, 1962, pp. 9–49
- [22] Robert E Lucas “On the mechanics of economic development” In Journal of Monetary Economics 22.1, 1988, pp. 3–42 DOI: https://doi.org/10.1016/0304-3932(88)90168-7
- [23] Frank Neffke and Martin Henning “Skill relatedness and firm diversification” In Strategic Management Journal 34.3 John Wiley & Sons, Ltd, 2013, pp. 297–316 DOI: https://doi.org/10.1002/smj.2014
- [24] Frank M H Neffke “The value of complementary co-workers” In Science Advances 5.12 American Association for the Advancement of Science, 2019 DOI: 10.1126/sciadv.aax3370
- [25] Robert Gibbons and Michael Waldman “Task-Specific Human Capital” In American Economic Review 94.2, 2004, pp. 203–207 DOI: 10.1257/0002828041301579
- [26] Katharine A Anderson “Skill networks and measures of complex human capital” In Proceedings of the National Academy of Sciences 114.48 Proceedings of the National Academy of Sciences, 2017, pp. 12720–12724
- [27] Flavio Cunha and James Heckman “The Technology of Skill Formation” In American Economic Review 97.2, 2007, pp. 31–47 DOI: 10.1257/aer.97.2.31
- [28] Xiaoxiao Li, Sebastian Linde and Hajime Shimao “Major Complexity Index and College Skill Production”, SSRN, 2021 URL: https://papers.ssrn.com/sol3/papers.cfm?abstract_id=3791651#:$%5Csim$:text=Abstract,the%20relative%20complexity%20of%20majors
- [29] Kenneth Joseph Arrow “The limits of organization” In The limits of organization, The Fels lectures on public policy analysis New York: Norton, 1974
- [30] Thomas S Kuhn “The structure of scientific revolutions” In The University of Chicago Press Chicago: The University of Chicago Press, 1962
- [31] Henrik Schwabe and Fulvio Castellacci “Automation, workers’ skills and job satisfaction” In PloS one 15.11 United States: Public Library of Science, 2020, pp. e0242929–e0242929
- [32] Dylan Nelson, Nathan Wilmers and Letian Zhang “Job Upgrading and Earnings Growth for Non-college Workers” In Academy of Management Proceedings 2022.1, 2022, pp. 11043 DOI: 10.5465/AMBPP.2022.11043abstract
- [33] Claudia Goldin and Lawrence F. Katz “The Race Between Technology & Education” In The Race between Education and Technology, 2008, pp. 163–246
- [34] Woo Seong Jo et al. “Extracting hierarchical backbones from bipartite networks”, 2020, pp. 1–8 arXiv: http://arxiv.org/abs/2002.07239
- [35] Serguei Saavedra, Daniel B. Stouffer, Brian Uzzi and Jordi Bascompte “Strong contributors to network persistence are the most vulnerable to extinction” In Nature 478.7368 Nature Publishing Group, 2011, pp. 233–235 URL: http://dx.doi.org/10.1038/nature10433
- [36] Carliss Baldwin, Alan MacCormack and John Rusnak “Hidden structure: Using network methods to map system architecture” In Research Policy 43.8, 2014, pp. 1381–1397 DOI: https://doi.org/10.1016/j.respol.2014.05.004
- [37] Maxim Poletaev and Chris Robinson “Human capital specificity: Evidence from the Dictionary of Occupational Titles and Displaced Worker Surveys, 1984-2000” In Journal of Labor Economics 26.3, 2008, pp. 387–420 DOI: 10.1086/588180
- [38] Christina Gathmann and Uta Schönberg “How general is human capital? A task-based approach” In Journal of Labor Economics 28.1, 2010, pp. 1–49 DOI: 10.1086/649786
- [39] John Paul Ferguson and Sharique Hasan “Specialization and Career Dynamics: Evidence from the Indian Administrative Service” In Administrative Science Quarterly 58.2 Los Angeles, CA: SAGE Publications, 2013, pp. 233–256
- [40] Ming D Leung “Dilettante or Renaissance Person? How the Order of Job Experiences Affects Hiring in an External Labor Market” In American Sociological Review 79.1 SAGE Publications Inc, 2014, pp. 136–158 DOI: 10.1177/0003122413518638
- [41] Jennifer Merluzzi and Damon J. Phillips “The Specialist Discount: Negative Returns for MBAs with Focused Profiles in Investment Banking” In Administrative Science Quarterly 61.1, 2016, pp. 87–124 DOI: 10.1177/0001839215610365
- [42] Heejung Byun, Justin Frake and Rajshree Agarwal “Leveraging who you know by what you know: Specialization and returns to relational capital” In Strategic Management Journal 39.7, 2018, pp. 1803–1833 DOI: 10.1002/smj.2790
- [43] Riccardo Fini, Julien Jourdan, Markus Perkmann and Laura Toschi “A New Take on the Categorical Imperative: Gatekeeping, Boundary Maintenance, and Evaluation Penalties in Science” In Organization Science, 2022 DOI: 10.1287/orsc.2022.1610
- [44] Heejung Byun and Joseph Raffiee “Career Specialization, Involuntary Worker–Firm Separations, and Employment Outcomes: Why Generalists Outperform Specialists When Their Jobs Are Displaced*” In Administrative Science Quarterly 68.1, 2023, pp. 270–316 DOI: 10.1177/00018392221143762
- [45] Enys Mones, Lilla Vicsek and Tamás Vicsek “Hierarchy measure for complex networks.” In PloS one 7.3, 2012, pp. e33799 DOI: 10.1371/journal.pone.0033799
- [46] Carl Benedikt Frey and Michael A. Osborne “The future of employment: How susceptible are jobs to computerisation?” In Technological Forecasting and Social Change 114, 2017, pp. 254–280 DOI: 10.1016/j.techfore.2016.08.019
- [47] Morgan R Frank et al. “Toward understanding the impact of artificial intelligence on labor” In Proceedings of the National Academy of Sciences, 2019, pp. 201900949 DOI: 10.1073/pnas.1900949116
- [48] Morgan R Frank, Yong-yeol Ahn and Esteban Moro “AI exposure predicts unemployment risk”, 2022
- [49] James R Norris “Markov chains” Cambridge university press, 1998
- [50] Derek Neal “Industry-Specific Human Capital: Evidence from Displaced Workers” In Journal of Labor Economics 13.4 [University of Chicago Press, Society of Labor Economists, NORC at the University of Chicago], 1995, pp. 653–677 URL: http://www.jstor.org.proxy.cc.uic.edu/stable/2535197
- [51] Daniel Parent “Industry‐Specific Capital and the Wage Profile: Evidence from the National Longitudinal Survey of Youth and the Panel Study of Income Dynamics” In Journal of Labor Economics 18.2 [The University of Chicago Press, Society of Labor Economists, NORC at the University of Chicago], 2000, pp. 306–323 DOI: 10.1086/209960
- [52] Erin Leahey “Not by productivity alone: How visibility and specialization contribute to academic earnings” In American sociological review 72.4 Sage Publications Sage CA: Los Angeles, CA, 2007, pp. 533–561
- [53] Florenta Teodoridis, Michaël Bikard and Keyvan Vakili “Creativity at the Knowledge Frontier: The Impact of Specialization in Fast- and Slow-paced Domains” In Administrative Science Quarterly 64.4 SAGE Publications Inc, 2018, pp. 894–927 DOI: 10.1177/0001839218793384
- [54] Raphael H Heiberger, Sebastian Munoz-Najar Galvez and Daniel A McFarland “Facets of Specialization and Its Relation to Career Success: An Analysis of U.S. Sociology, 1980 to 2015” In American Sociological Review 86.6 SAGE Publications Inc, 2021, pp. 1164–1192 DOI: 10.1177/00031224211056267
- [55] Jordi Bascompte, Pedro Jordano, Carlos J Melián and Jens M Olesen “The nested assembly of plant–animal mutualistic networks” In Proceedings of the National Academy of Sciences 100.16 Proceedings of the National Academy of Sciences, 2003, pp. 9383–9387 DOI: 10.1073/pnas.1633576100
- [56] Serguei Saavedra, Felix Reed-Tsochas and Brian Uzzi “A simple model of bipartite cooperation for ecological and organizational networks” In Nature 457.7228 Nature Publishing Group, 2009, pp. 463–466 DOI: 10.1038/nature07532
- [57] Ahmad Alabdulkareem et al. “Unpacking the polarization of workplace skills” In Science Advances 4.7, 2018, pp. 1–10
- [58] M.R. Frank et al. “Small cities face greater impact from automation” In Journal of the Royal Society Interface 15.139, 2018 URL: https://royalsocietypublishing.org/doi/10.1098/rsif.2017.0946
- [59] R Maria Rio-Chanona et al. “Occupational mobility and automation: a data-driven network model” In Journal of The Royal Society Interface 18.174 Royal Society, 2021, pp. 20200898 DOI: 10.1098/rsif.2020.0898
- [60] Esteban Moro et al. “Universal resilience patterns in labor markets” In Nature Communications 12.1, 2021, pp. 1972 DOI: 10.1038/s41467-021-22086-3
- [61] David H Autor “Skills, education, and the rise of earnings inequality among the “other 99 percent”” In Science 344.6186 American Association for the Advancement of Science, 2014, pp. 843–851 DOI: 10.1126/science.1251868
- [62] Sergei Maslov and Kim Sneppen “Specificity and stability in topology of protein networks” In Science 296.5569 Washington, DC: American Society for the Advancement of Science, 2002, pp. 910–913 DOI: 10.1126/science.1065103
- [63] D.H. Wright and J.H Reeves “On the meaning and measurement of nestedness of species assemblages” In Oecologia 92.2, 1992, pp. 416–428 DOI: 10.1007/BF00317469
- [64] Wesley M. Cohen and Daniel A. Levinthal “Absorptive Capacity: A New Perspective on Learning and Innovation” In Administrative Science Quarterly 35.1 [Sage Publications, Inc., Johnson Graduate School of Management, Cornell University], 1990, pp. 128–152 DOI: 10.2307/2393553
- [65] Hyejin Youn et al. “Scaling and universality in urban economic diversification” In Journal of The Royal Society Interface 13.114, 2016, pp. 20150937 DOI: 10.1098/rsif.2015.0937
- [66] Andres Gomez-Lievano, Oscar Patterson-Lomba and Ricardo Hausmann “Explaining the prevalence, scaling and variance of urban phenomena” In Nature Human Behaviour 1.1 Nature Publishing Group UK London, 2016, pp. 0012
- [67] Inho Hong et al. “The universal pathway to innovative urban economies” In Science Advances 6.34, 2020, pp. 1–7 DOI: 10.1126/sciadv.aba4934
- [68] Pierre-Alexandre Balland et al. “Complex economic activities concentrate in large cities” In Nature Human Behaviour, 2020 DOI: 10.1038/s41562-019-0803-3
- [69] Luís M.. Bettencourt, Horacio Samaniego and Hyejin Youn “Professional diversity and the productivity of cities” In Scientific Reports 4.1, 2014, pp. 5393 DOI: 10.1038/srep05393
- [70] Andres Gomez-Lievano and Oscar Patterson-Lomba “Estimating the drivers of urban economic complexity and their connection to economic performance” In Royal Society Open Science 8.9 Royal Society, 2021, pp. 210670 DOI: 10.1098/rsos.210670
- [71] Lewi Stone and Alan Roberts “The checkerboard score and species distributions” In Oecologia 85.1, 1990, pp. 74–79 DOI: 10.1007/BF00317345
- [72] Mário Almeida-neto et al. “A consistent metric for nestedness analysis in ecological systems: reconciling concept and measurement” In Oikos 117.8, 2008, pp. 1227–1239
- [73] David J Deming and Kadeem Noray “Earnings Dynamics, Changing Job Skills, and STEM Careers” In The Quarterly journal of economics 135.4, 2020, pp. 1965–2005
- [74] Di Tong, Lingfei Wu and James Allen Evans “Low-skilled Occupations Face the Highest Re-skilling Pressure”, 2021 URL: https://arxiv.org/abs/2101.11505
- [75] Weipan Xu et al. “Developing China’s workforce skill taxonomy reveals extent of labor market polarization” In Humanities and Social Sciences Communications 8.1, 2021, pp. 187 DOI: 10.1057/s41599-021-00862-2
- [76] Ken-Hou Lin and Koit Hung “The Network Structure of Occupations: Fragmentation, Differentiation, and Contagion” In American Journal of Sociology 127.5 The University of Chicago Press, 2022, pp. 1551–1601 DOI: 10.1086/719407
- [77] Neave O’Clery, Muhammed Ali Yıldırım and Ricardo Hausmann “Productive Ecosystems and the arrow of development” In Nature Communications 12.1, 2021, pp. 1479 DOI: 10.1038/s41467-021-21689-0
- [78] César A Hidalgo “Economic complexity theory and applications” In Nature Reviews Physics, 2021 DOI: 10.1038/s42254-020-00275-1
- [79] Sonia Harmand et al. “3.3-million-year-old stone tools from Lomekwi 3, West Turkana, Kenya” In Nature 521.7552, 2015, pp. 310–315 DOI: 10.1038/nature14464
- [80] Ricardo Hausmann and César A Hidalgo “The network structure of economic output” In Journal of Economic Growth 16.4, 2011, pp. 309–342 DOI: 10.1007/s10887-011-9071-4
- [81] César A Hidalgo, B. Winger, A.. Barabási and R. Hausmann “The product space conditions the development of nations” In Science 317.5837, 2007, pp. 482–487
- [82] César A Hidalgo and Ricardo Hausmann “The building blocks of economic complexity” In Proceedings of the National Academy of Sciences of the United States of America 106.26 National Academy of Sciences, 2009, pp. 10570–10575 DOI: 10.1073/pnas.0900943106
- [83] Andrea Tacchella et al. “A new metrics for countries’ fitness and products’ complexity” In Scientific reports 2.1 Nature Publishing Group UK London, 2012, pp. 723
- [84] Jaehyuk Park et al. “Global labor flow network reveals the hierarchical organization and dynamics of geo-industrial clusters” In Nature Communications 10.1, 2019, pp. 3449 DOI: 10.1038/s41467-019-11380-w
- [85] James McNerney, Yang Li, Andres Gomez-Lievano and Frank Neffke “Bridging the short-term and long-term dynamics of economic structural change” In arXiv preprint arXiv:2110.09673, 2021
- [86] Vicky Chuqiao Yang et al. “Scaling and the Universality of Function Diversity Across Human Organizations”, 2022 arXiv:2208.06487 [physics.soc-ph]
- [87] César A Hidalgo et al. “The principle of relatedness” In Unifying Themes in Complex Systems IX: Proceedings of the Ninth International Conference on Complex Systems 9, 2018, pp. 451–457 Springer
- [88] Jisung Yoon et al. “What makes Individual I’s a Collective We; Coordination mechanisms & costs”, 2023 arXiv:2306.02113 [physics.soc-ph]
- [89] Lingfei Wu, Dashun Wang and James A Evans “Large teams develop and small teams disrupt science and technology” In Nature 566.7744, 2019, pp. 378–382 DOI: 10.1038/s41586-019-0941-9
- [90] Katy Börner et al. “Skill discrepancies between research, education, and jobs reveal the critical need to supply soft skills for the data economy” In Proceedings of the National Academy of Sciences 115.50, 2018, pp. 12630–12637 DOI: 10.1073/pnas.1804247115
- [91] Yujia Liu and David B Grusky “The Payoff to Skill in the Third Industrial Revolution” In The American journal of sociology 118.5, 2013, pp. 1330–1374
- [92] David J. Deming “The growing importance of social skills in the labor market” In Quarterly Journal of Economics 132.4, 2017, pp. 1593–1640 DOI: 10.1093/qje/qjx022
- [93] Lex Borghans, Bas Ter Weel and Bruce A. Weinberg “People skills and the labor-market outcomes of underrepresented groups” In ILR Review 67.2, 2014, pp. 287–334 DOI: 10.1177/001979391406700202
- [94] Catherine J Weinberger “The Increasing Complementarity between Cognitive and Social Skills” In The Review of Economics and Statistics 96.5, 2014, pp. 849–861
- [95] Erik Lindqvist and Roine Vestman “The Labor Market Returns to Cognitive and Noncognitive Ability: Evidence from the Swedish Enlistment” In American Economic Journal: Applied Economics 3.1 American Economic Association, 2011, pp. 101–128 URL: http://www.jstor.org.turing.library.northwestern.edu/stable/25760248
- [96] Peter Kuhn and Catherine Weinberger “Leadership skills and wages” In Journal of Labor Economics 23.3, 2005, pp. 395–436 DOI: 10.1086/430282
- [97] David Deming and Lisa B. Kahn “Skill Requirements across Firms and Labor Markets: Evidence from Job Postings for Professionals” In Journal of Labor Economics 36.S1 The University of Chicago Press, 2018, pp. S337–S369 DOI: 10.1086/694106
- [98] Leonid Kogan, Dimitris Papanikolaou, Lawrence DW Schmidt and Bryan Seegmiller “Technology, vintage-specific human capital, and labor displacement: Evidence from linking patents with occupations” SSRN 3585676 In SSRN, 2021 URL: http://dx.doi.org/10.2139/ssrn.3585676
- [99] Michael Muthukrishna, Ben W Shulman, Vlad Vasilescu and Joseph Henrich “Sociality influences cultural complexity” In Proceedings of the Royal Society B: Biological Sciences 281.1774 Royal Society, 2014, pp. 20132511 DOI: 10.1098/rspb.2013.2511
- [100] Edward.. Lazear “Firm‐Specific Human Capital: A Skill‐Weights Approach” In Journal of Political Economy 117.5 The University of Chicago Press, 2009, pp. 914–940 URL: http://www.jstor.org/stable/10.1086/648671
- [101] Kyle Feinstein “Stanford, Harvard revise high school math curriculum recommendations, exclude data science” In The Stanford Daily, 2023 URL: https://stanforddaily.com/2023/04/25/stanford-harvard-revise-high-school-math-curriculum-recommendations-exclude-data-science/
- [102] Julien Clement “Missing the Forest for the Trees: Modular Search and Systemic Inertia as a Response to Environmental Change” In Administrative Science Quarterly 68.1 SAGE Publications Inc, 2022, pp. 186–227 DOI: 10.1177/00018392221136267
- [103] Santiago Hermo, Miika Päällysaho, David Seim and Jesse M Shapiro “Labor Market Returns and the Evolution of Cognitive Skills: Theory and Evidence” In The Quarterly Journal of Economics 137.4, 2022, pp. 2309–2361 DOI: 10.1093/qje/qjac022
- [104] T M A Fink and M Reeves “How much can we influence the rate of innovation?” In Science advances 5.1 United States: American Association for the Advancement of Science, 2019, pp. eaat6107–eaat6107
- [105] Thomas Fink, Pankaj Ghemawat and Martin Reeves “Searching for Great Strategies” In Strategy Science 2.4 INFORMS, 2017, pp. 272–281 DOI: 10.1287/stsc.2017.0052
- [106] T M A Fink, M Reeves, R Palma and R S Farr “Serendipity and strategy in rapid innovation” In Nature Communications 8.1, 2017, pp. 2002 DOI: 10.1038/s41467-017-02042-w
- [107] David Autor, Caroline Chin, Anna M Salomons and Bryan Seegmiller “New Frontiers: The Origins and Content of New Work, 1940–2018” National Bureau of Economic Research, 2022
- [108] “An occupational information system for the 21st century : the development of O*NET” Place of publication not identified: American Psychological Association, 1999
- [109] M Ángeles Serrano, Marián Boguñá and Alessandro Vespignani “Extracting the multiscale backbone of complex weighted networks” In Proceedings of the National Academy of Sciences 106.16 National Academy of Sciences, 2009, pp. 6483–6488 DOI: 10.1073/pnas.0808904106
- [110] Giorgio Alfredo Spedicato “Discrete Time Markov Chains with R” R package version 0.6.9.7 In The R Journal, 2017 URL: https://journal.r-project.org/archive/2017/RJ-2017-036/index.html
- [111] R.I.M. Dunbar “Neocortex size as a constraint on group size in primates” In Journal of Human Evolution 22.6, 1992, pp. 469–493 DOI: https://doi.org/10.1016/0047-2484(92)90081-J
- [112] Miguel A Fortuna et al. “Nestedness versus modularity in ecological networks: two sides of the same coin?” In Journal of Animal Ecology 79.4, 2010, pp. 811–817 DOI: https://doi.org/10.1111/j.1365-2656.2010.01688.x
- [113] Alje Dam et al. “Correspondence analysis, spectral clustering and graph embedding: applications to ecology and economic complexity” In Scientific reports 11.1 Nature Publishing Group UK, 2021, pp. 8926 DOI: 10.1038/s41598-021-87971-9
- [114] Wirt Atmar and Bruce D Patterson “The measure of order and disorder in the distribution of species in fragmented habitat” In Oecologia 96.3, 1993, pp. 373–382 DOI: 10.1007/BF00317508
- [115] Sarah Flood et al. “Integrated Public Use Microdata Series, Current Population Survey: Version 10.0 [dataset]” In IPUMS, 2022 DOI: https://doi.org/10.18128/D030.V10.0
- [116] Jaehyuk Park, Lijun Sun and Hyejin Youn “Industrial Topics in Urban Labor System”, 2020