Uncovering Bias in Personal Informatics
Abstract.
Personal informatics (PI) systems, powered by smartphones and wearables, enable people to lead healthier lifestyles by providing meaningful and actionable insights that break down barriers between users and their health information. Today, such systems are used by billions of users for monitoring not only physical activity and sleep but also vital signs and women’s and heart health, among others. Despite their widespread usage, the processing of sensitive PI data may suffer from biases, which may entail practical and ethical implications. In this work, we present the first comprehensive empirical and analytical study of bias in PI systems, including biases in raw data and in the entire machine learning life cycle. We use the most detailed framework to date for exploring the different sources of bias and find that biases exist both in the data generation and the model learning and implementation streams. According to our results, the most affected minority groups are users with health issues, such as diabetes, joint issues, and hypertension, and female users, whose data biases are propagated or even amplified by learning models, while intersectional biases can also be observed.
1. Introduction
Ubiquitous technologies, such as smartphones and wearables, are an integral part of our lives today (Group, 2021; Statista, 2022). Their proliferation has given rise to Personal Informatics (PI), namely a class of systems that “help people collect personally relevant information for the purpose of self-reflection and gaining self-knowledge” (Li et al., 2010). Such systems enable people to keep track of their productivity (Kim et al., 2016), finances (Kaye et al., 2014), and learning (Garbett et al., 2018). Yet, tracking various aspects of physical and mental health is particularly prevalent (Epstein et al., 2020). PI systems can continuously and unobtrusively measure and collect physiological and behavioral data, namely, “digital biomarkers”, from users through integrated sensors. Digital biomarkers contain an uncanny amount of personal information. Even the coarser behavioral biomarkers acquired from consumer wearables (e.g., steps, calories) strongly correlate to a person’s gender, height, and weight (Kazlouski et al., 2022), while signals of finer granularity (e.g., accelerometer and heart rate), can predict variables associated with an individual’s physical health, fitness, and demographics (Spathis et al., 2021).
At the same time, consumer smartphones and wearables are now packed with an increasing number of advanced health tracking features, innovating in personal health, research, and care (Apple, 2022a). Flagship consumer wearable algorithms —some approved by the US Food and Drug Administration— can now identify signs of atrial fibrillation (AFib) through electrocardiogram (ECG) or photoplethysmography (PPG) signals (Fitbit, 2022). On a different note, newly released watches introduce novel cycle-tracking functionality, including fertility prediction and notifications, using logged period data and temperature measurements (Apple, 2022b). Mobility features include fall and crash detection through accelerometer and gyroscope measurements and notification of emergency services. Similarly, newly integrated blood oxygen (SpO2) sensors on wearable rings can provide indicators and warn users about potential sleep apnea or lung diseases (Team, 2022). It is evident that consumer smartphones and wearables have moved beyond step counts, marking a rapid transition towards mHealth .
However, the prevalent PI adoption embeds important challenges due to the questionable transparency and unexplored biases in the systems’ algorithms. Contrary to the common belief that algorithmic decisions are objective by definition, a machine learning (ML) model may be inherently unfair by learning, preserving, or even amplifying historical biases existent in the data (Pessach and Shmueli, 2022). Unfortunately, real-world cases of unfair ML models are abundant even within the ubiquitous computing community. For example, neural network algorithms trained to classify skin lesions were found to exhibit lower diagnostic accuracy in black patients (Kamulegeya et al., 2019). Moreover, racial bias has been identified in health sensors such as oximeters, which were primarily tested on white populations, resulting in the misclassification of people of color (Sjoding et al., 2020). Given the growing potential of PI devices in mHealth, imagine the ethical and social implications if an AFib detection algorithm exhibited bias against a specific race or if a fertility prediction algorithm was biased against women in developing countries.
Despite this growing interest in ML fairness, a focused emphasis on the requirements of unbiased PI systems in mHealth settings is lacking (Ahmad et al., 2020; Yfantidou et al., 2023). Yet, PI systems are deployed in high-stakes health applications, while their input data modality, i.e., personal sensitive data, makes them susceptible to propagating bias. Thus, exploring biases within these systems is critical to raise awareness regarding mitigating and regulatory actions required to avert potential negative consequences. This need is further highlighted by the differences between PI and other domains, such as facial or speech recognition:
-
•
The digital divide as a barrier of entry: To contribute data to an image or voice dataset, users do not need any technical knowledge or niche device. However, to contribute to a PI dataset, users face significant “entry barriers” in terms of digital capacity or device ownership, creating new-found representation biases.
-
•
Emerging technologies accuracy: Facial or speech recognition devices, e.g., camera or voice recorder, are mature technologies with high accuracy. On the contrary, emerging PI devices’ accuracy significantly varies across models, creating unexplored measurement biases and discrepancies across user segments.
-
•
Complex nature of data: It may be straightforward to identify biases in terms of skin tone, nationality and gender in facial or speech recognition. Yet, identifying biases in digital biomarkers, e.g., sensor data, is complicated. Biases in PI data can remain hidden and be further propagated or even amplified in ML models.
Motivated by these differences and research gap, we present the first comprehensive study on bias in PI: We adopt the most complete framework to date for understanding sources of harm in the ML life cycle (Suresh and Guttag, 2021) (§3), and explore biases in the data generation (§4) and model building and implementation (§5) streams. Ultimately, we apply our methodology in the largest real-world PI dataset to date, while providing preliminary indications of generalizability through differing datasets and use cases (§6), and we offer recommendations for bias mitigation (§7). Specifically, our research questions (RQs) and the respective contributions are as follows:
-
(1)
Are PI data susceptible to biases? We examine whether ubiquitous digital biomarkers are subject to historical, representation, and measurement biases. To demonstrate our point, we analyze the MyHeart Counts dataset (Hershman et al., 2019), comprising physical activity, fitness, sleep, and cardiovascular health data for 50K participants across the United States (US). Our results reveal biases across all stages of the data generation stream, highlighting the need for careful usage of PI datasets, in general, and the MyHeart Counts data, in particular.
-
(2)
Do ML models inherit PI data biases? We examine whether biases inherent in PI data persist during modeling. Specifically, we assess various learning and personalization models for aggregation, learning, and deployment biases. Consistent with prior research (Paviglianiti and Pasero, 2020), our findings indicate that data biases are propagated to learning models, particularly for user groups with intersecting identities. They are also significantly amplified in their personalized counterparts, prompting further exploration of personalization trade-offs.
-
(3)
Do synthetic benchmarks hide the imperfect nature of PI? We explore whether “perfect” synthetic benchmark datasets can hide PI data and model “imperfections” and biases during evaluation. Specifically, we compare a random benchmark, representative of our data, with one designed to achieve demographic parity for evaluation biases. Our findings highlight the importance of establishing PI benchmarks that are representative of the intended target populations to avoid deploying models with unidentified biases.
2. Background and Related Work
This section provides the necessary background and delimits the scope of this work, while discussing relevant literature on the conceptual space of fairness in PI for mHealth.
2.1. Bias and Fairness in PI Definitions
Bias in ML is a potential source of unfairness that can lead to harmful consequences, such as discrimination. In terms of algorithms, bias can be defined as “a systematic error or an unexpected tendency to favor one outcome over another” (Mehrabi et al., 2021). The term can also refer to an algorithm’s undesired dependence on specific data attributes that may be linked to a demographic group, e.g., based on gender, race, or religion (Fletcher et al., 2021). While bias is related to fairness, it is important to note that algorithmic bias is distinct from ethics. It is simply a mathematical and statistical consequence of an algorithm, including the data used, the logic itself and the user interaction feedback-loop, making it fully quantifiable (Baeza-Yates, 2018a).
Unlike bias, the fairness of an ML model is judged against a set of legal or ethical principles, which are subject to the local government and culture. The Fairness, Accountability, and Transparency in Machine Learning (FAccT/ML) community defines fairness as a principle that “ensures that algorithmic decisions do not create discriminatory or unjust impacts when comparing across different demographics (e.g., race, sex, etc.)” (Awwad et al., 2020). Fairness is an inexorably subjective and context-dependent notion and incorporates different metrics for different definitions, some of which are even mutually incompatible (Friedler et al., 2021). For example, drawing from our use case (§3.2) and as per relevant literature (Organization, 2019), women tend to perform overall less physical activity compared to their male counterparts. Hence, a PI goal-setting algorithm could either give females lower goals because they historically perform less physical activity or give females equal high goals despite historic differences to encourage behavior change. Fairness in this context is subjective and dependent on the viewpoint. However, algorithmic bias is objective and can be identified regardless of fairness considerations. For instance, the first algorithm described would be biased against women since it assigns them fewer high-activity goals compared to men.
Bias can (but does not always) result in discrimination. We consider systems fairer if they are less biased, but building ML systems without bias is practically difficult and possibly infeasible. However, quantifying and mitigating bias is an attainable and important step toward building fairer ML systems. Hence, our work aims to unveil and quantify biases in the PI life cycle without the subjective element of personal fairness perspectives. Note that we might still use the term “fairness” in the paper, when we refer to certain standard terminology, e.g., “fairness through unawareness” or “fairness metrics”.
2.2. Bias and Fairness in PI for Health and Well-being Literature
With the widespread adoption of intelligent systems and applications in our everyday lives, accounting for data and model biases has gained significant traction in designing and deploying systems. Specifically, these notions have been studied extensively in domains such as natural language processing (Bolukbasi et al., 2016; Frey et al., 2020), recommender systems (Leonhardt et al., 2018; Wang et al., 2022, 2020b), and computer vision (Buolamwini and Gebru, 2018; Wang et al., 2020a). Yet, evidence for biases in the PI setting is lacking. Closer to PI, fairness research in healthcare is still in its infancy (Feng et al., 2022). The digitization of medical data has enabled the scientific community to collect large amounts of heterogeneous, multi-modal data and develop ML algorithms for various medical tasks. During the process, various limitations have been uncovered based on the three most prominent data types: medical image data, structured electronic health record (EHR) data, and textual data.
Medical imaging has been the most widely used data source for ML in healthcare, and biases in them have received attention (Jiang et al., 2017). For example, Larrazabal et al. (2020) utilizes two commonly used X-ray image datasets to diagnose various chest diseases under different gender imbalance conditions and showcase that the minority gender group systematically performs worse than the majority gender group. Similarly, according to Adamson and Smith (2018), relying on ML for skin cancer screening may exacerbate potential racial disparities in dermatology.
On a different note, EHR systems store multi-modal, heterogeneous patient data, such as demographics, diagnoses, and clinical records, and have been used for various tasks, such as medical concept extraction, mortality prediction, and disease inference. Regarding EHR data fairness, Meng et al. (2021) identify race-level differences in the predictions of neural network models on the MIMIC-IV dataset (Johnson et al., 2020), with Black and Hispanic patients being less likely to receive interventions or receiving interventions of shorter average duration. Similarly, Röösli et al. (2022) reveals a strong class imbalance problem and significant fairness concerns for Black and publicly insured ICU patients in the same dataset.
Concerning textual EHR data, Chen et al. (2019) examines clinical and psychiatric notes to predict intensive care unit mortality and 30-day psychiatric readmission. Their analysis reveals differences in prediction accuracy, and biases are present in terms of gender and insurance type for mortality prediction and insurance policy for psychiatric 30-day readmission. Within the same scope, Zhang et al. (2020) train deep embedding models on medical notes from the MIMIC-III database (Johnson et al., 2016), and find that classifiers trained from their embeddings exhibit statistically significant differences in performance, often favoring the majority group regarding gender, language, ethnicity, and insurance status.
Yet, despite the emerging research on biases in healthcare, its proximity to PI, and the widespread adoption of PI technologies, biases in PI have been barely explored. Paviglianiti and Pasero (2020) reported gender biases in digital biomarkers using Vital-ECG, a wearable smart device that collects electrocardiogram and plethysmogram signals. Still, their study is limited to quantifying learning bias, far from a complete study of bias in the PI life cycle. On the contrary, inspired by relevant works in related domains (Hutiri and Ding, 2022; Hutiri et al., 2023), our work aims to raise awareness and set up a systematic approach to comprehensively analyze data and model biases in PI systems, highlighting the multiple facets of bias that may affect system fairness.
3. Personal Informatics Biases: Setting & Configuration
In this section, we discuss frameworks capturing biases (Section 3.1) and our use case configuration, acting as a starting point for our investigation (Section 3.2).
3.1. Sources of Bias in the Machine Learning Life Cycle Framework
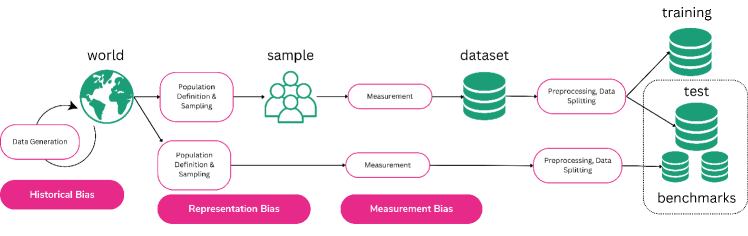
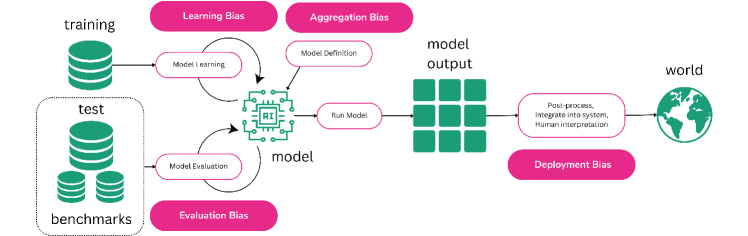
There exist various frameworks for capturing bias in ML applications, e.g., in the context of the Web (Baeza-Yates, 2018a), autonomous systems (Danks and London, 2017) or crowdsourced labeling (Barbosa and Chen, 2019). However, most tend to be domain-specific. Yet, Suresh and Guttag (2021) has introduced a framework for understanding sources of harm throughout the ML life cycle, independent of the application domain. Given its generic and comprehensive nature and, thus, suitability for the PI use case, we consider this as a basis for our study. As per (Suresh and Guttag, 2021), the ML life cycle consists of two streams, the data generation stream and the model building and implementation stream, containing seven sources of bias-related harms, as shown in Figures 1(a) and 1(b), respectively, and defined below:
-
•
Historical biases can occur even if the data are flawlessly sampled by reflecting real-world biases against one or more groups of people. For example, gender gaps in certain fields can result in language models linking certain job-related terms, such as nurse or programmer, with female or male descriptors, respectively (Bolukbasi et al., 2016).
-
•
Representation biases can occur when sampling methods lead to underrepresenting population segments. For example, in popular image datasets, skewed towards the US or Europe, result in performance degradation when categorizing images from underrepresented regions (Denton et al., 2020).
-
•
Measurement biases can occur when choosing, collecting, and calculating features and labels for the prediction problem. For example, in medical contexts, diagnosis is frequently a stand-in for a health condition; yet, some gender and race groups face elevated risks of misdiagnosis, or underdiagnosis (Hoffman et al., 2016).
-
•
Aggregation biases can occur when a universal model is applied to that should be differentiated based on underlying user groups. For example, when training natural language processing models on generic data, the nuances and contextual meanings of street slang can be lost (Frey et al., 2020).
-
•
Learning biases can occur when modeling choices amplify performance gaps across user segments. For example, prioritizing privacy in a model can diminish the impact of underrepresented groups data (Bagdasaryan et al., 2019).
-
•
Evaluation biases can occur when the benchmark population is not representative of the target population. For example, dark-skinned women comprise only a small percentage of popular facial image benchmarks, leading to worse intersectional performance of commercial facial analysis tools (Buolamwini and Gebru, 2018).
-
•
Deployment biases can occur when there exists a mismatch between the problem a model is designed to solve and how it is actually utilized. For example, risk assessment tools in criminal justice can be used in “off-label” ways, such as determining the length of a sentence (Collins, 2018).
In the following section, we introduce the use case through which we explore bias in PI for mHealth. We then show empirically and analytically how Suresh and Guttag’s seven sources of bias translate in the PI domain.
3.2. Exploring Bias through the Largest Digital Biomarkers mHealth Dataset
To enable our analysis of bias in the PI life cycle, we require an indicative use case. For this purpose, we utilize the MyHeart Counts dataset (Hershman et al., 2019), the largest collection of digital biomarkers in the mHealth domain to date, enabling us to perform the most comprehensive analysis of bias across diverse user demographics. Nevertheless, our methodology can be potentially generalized to other PI datasets (§6).
Data Description
Up till recently, generic, population-scale PI datasets were uncommon due to cost, privacy concerns, and data protection regulations. Existing open datasets were small- to medium-sized (Vaizman et al., 2018; Wang et al., 2014) or domain-constrained, e.g., to human-activity recognition (HAR) (Anguita et al., 2013). The release of data from the MyHeart Counts Cardiovascular Health Study from 50K participants in the US, changed this situation. Participants completed surveys and a 6-minute walk test and contributed PI data via a mobile application. Approximately 1 out of 10 participants () shared their basic PI data, such as step count, distance covered, burned calories, and flights climbed. We combine these data with survey responses to attain the following user attributes: gender, ethnicity, age, BMI, and health conditions, such as heart condition, hypertension, joint problem, and diabetes.
| Original Protected Attribute Values | Binarized Protected Attribute Values | ||
|---|---|---|---|
| Attribute | Original Groups | Majority Group | Minority Group |
| Gender | Male, Female, N/A | Male | Female |
| Ethnicity | White, Asian, Black, Hispanic, American Indian, Pacific Islander, Other, N/A | White | Non-white |
| Age | Integer Number, N/A | ¡65 (lower risk of complications) | ¿=65 (higher risk of complications) |
| BMI | Real Number (height and weight), N/A | ¡18.5 or =¿25 (unhealthy) | =¿18.5 and ¡25 (healthy) |
| Heart Condition | Yes, No, N/A | No | Yes |
| Hypertension | Yes, No, N/A | No | Yes |
| Joint Problem | Yes, No, N/A | No | Yes |
| Diabetes | Yes, No, N/A | No | Yes |
Data Preprocessing
To ensure sufficient sample size per user group and compatibility with bias metrics, we binarize non-binary user attributes, such as ethnicity, age, and BMI, as seen in Table 1. This grouping creates two user groups per protected attribute, namely a majority group (“privileged”) and a minority group (“unprivileged”). Note that the usage of the term “privilege” in this work does not necessarily coincide with real-world “privilege”. For example, users with unhealthy BMI are the majority, and hence “privileged” user segment in our dataset, whereas one could argue that the opposite applies in reality.
| Features | Label | ||||
|---|---|---|---|---|---|
| user_id | timestamp | steps at t-48h | … | steps at t-1h | next day’s steps |
| 1 | 23-11-2022 | 1040 | … | 300 | 8500 |
Data Labeling
The MyHeart Counts dataset does not introduce any prediction tasks. To this end, we select the next-day physical activity prediction from historical data use case (Bampakis et al., 2022; Vasdekis et al., 2022) for model training. In other words, based on the user’s past activity, we try to predict how many steps they will perform the next day (see Table 2), e.g., to enable personalized goal-setting. Basic digital behavioral biomarkers, such as steps, are easy to collect and commonplace in the literature, enabling the reproducibility of our findings. Also, they are the largest available sensed modality in the My Heart Counts dataset, allowing us to exploit more data for our analysis. At the same time, according to the World Health Organization (WHO), physical activity has significant health benefits for hearts, bodies, and minds, contributing to preventing and managing noncommunicable diseases such as cardiovascular diseases, cancer, and diabetes (WHO, 2012). Strikingly, physical inactivity has been identified by the WHO as the fourth leading risk factor for global mortality, accounting for 6% of deaths globally (Organization et al., 2010), highlighting the importance of the selected use case.
Bias Measures
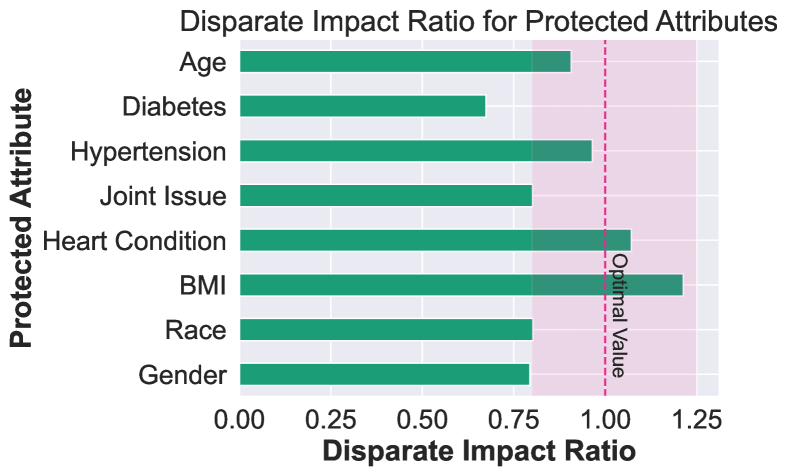
To measure bias, ML researchers have quantified fairness metrics that operationalize fairness definitions (See Appendix B). For this work, we utilize the widely used Disparate Impact Ratio (DIR), which is the ratio of base or selection rates between unprivileged and privileged groups, assuming equal ability to perform physical activity across demographics:
where is the actual or predicted positive outcome label (base or selection rate, respectively), is the minority (protected) group, and is the majority group. Values lower than 1 mean the majority group has a higher proportion of positive outcomes; a value of 1 indicates demographic parity. For example, a value of 0.8 for a dataset with gender as protected attribute means that for every male receiving a high activity goal, only 0.8 females do so. According to the “4/5 rule” (Castelnovo et al., 2022), accepted values lie within [0.8,1.25], but such ranges are not universally accepted and are context-dependent (Commission et al., 1990).
4. Exploring Bias in Personal Informatics Data Generation
Bias in the data generation stream can take the form of historical, representation, and measurement biases, as seen in Figure 1(a). In this section, we explore all three sources, answering to RQ1: Are PI data susceptible to biases?
4.1. Historical Bias
Historical biases are domain- rather dataset-dependent, and hence not necessarily quantifiable. Hence, for completeness, we state the main findings of the related literature on the PI domain.
Physical Activity Inequalities
Physical activity data, such as step counts, are among the most common digital biomarkers, and constitute the majority of the extracted MyHeart Counts data, with 4920 users of step tracking compared to 626 users of sleep tracking. However, inequalities in physical activity are well-documented in literature (Guthold et al., 2018; Althoff et al., 2017; Organization, 2019). Althoff et al. (2017) reveal variability in physical activity worldwide, where reduced activity in females explains a large portion of the observed activity inequality. Overall, the World Health Organization reports that “girls, women, older adults, people of low socioeconomic position, people with disabilities and chronic diseases, marginalized populations, indigenous people and the inhabitants of rural communities often have less access to safe, accessible, affordable and appropriate spaces and places in which to be physically active” (Organization, 2019). Such real-world inequalities can manifest into the behavioral data we use to train our models.
The Digital Divide
Similarly, as the world rapidly digitalizes, it threatens to exclude those that remain offline. Almost half the world’s population, the majority of them women or citizens of developing countries, are still disconnected (Mohammed, 2021). Even in the connected world, male internet users outnumber their female counterparts. This “digital divide” encompasses even more discrepancies, such as the digital infrastructure quality and connectivity speed in rural or remote areas and the required skills to navigate technology (Chetty et al., 2018). Therefore, it is clear that technological systems, including PI, are limited in their ability to capture the diversity of the world population, due to pre-existing inequalities in digital access and literacy.
BYOD Study Design Biases
PI technologies are used for data collection in clinical research, resulting in newfound demographic imbalances. Studies adopting a bring-your-own-device (BYOD) design, such as MyHeart Counts, are more user-friendly, achieve better participant compliance, potentially reduce the bias of introducing new technologies, and accelerate data collection from larger cohorts (Demanuele et al., 2022; Cho et al., 2022). However, Cho et al. (2022) identifies significant demographic disparities regarding race (50-85% white cohorts) in BYOD studies. Their findings align with the reported demographic divide existent in the composition of wearable users. Even though the gap is narrowing, a recent report (Ericsson ConsumerLab, 2016) documents that most existing wearable users are fit adults between 25–34 and that whilst females are more likely to own activity trackers, 63% of smartwatch owners are male. Hence, the technology and participant cohorts in PI in the context of BYOD studies subject datasets to the same biases exposed in the activity inequality and the digital divide literature.
4.2. Representation Bias
We discuss representation biases across three dimensions: misrepresented, underrepresented, and unevenly sampled populations.
Misrepresented Populations
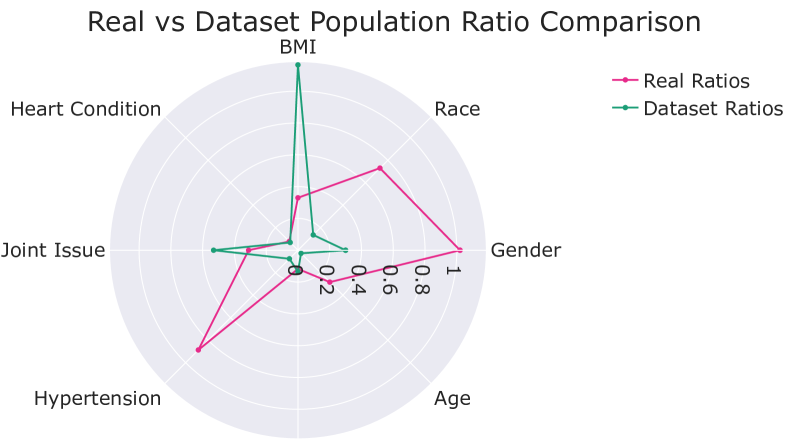
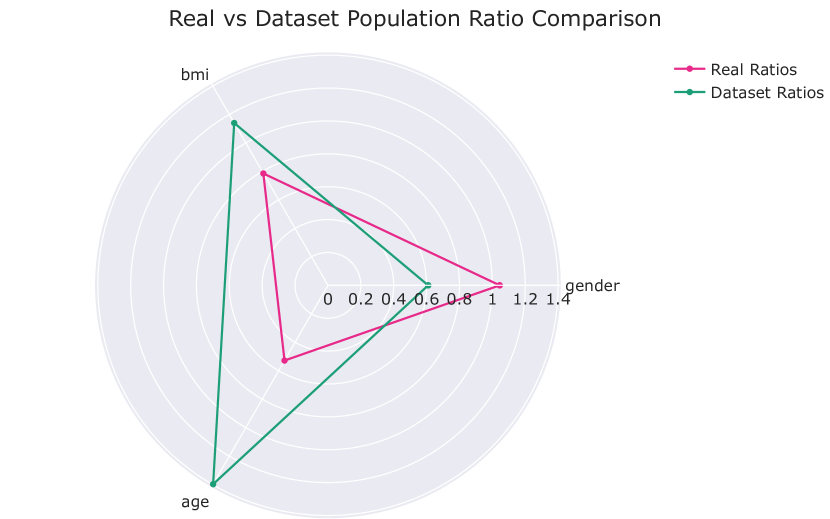
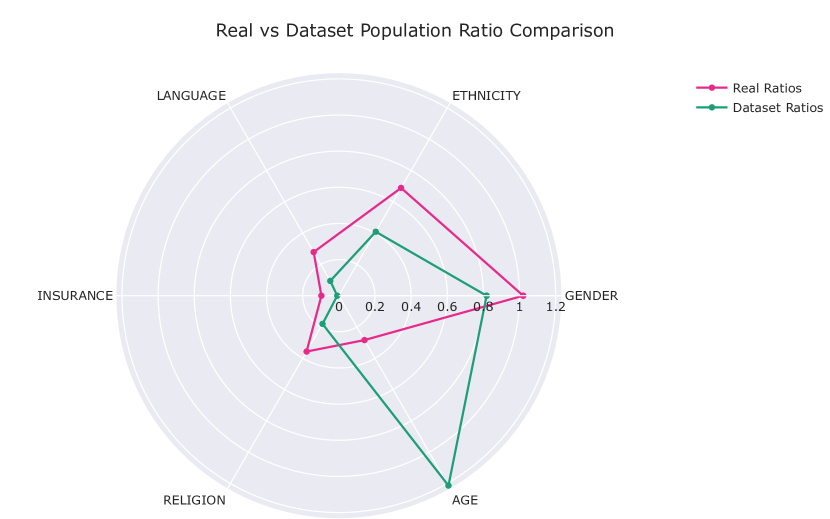
Representation bias can emerge when the sample population does not reflect the general population (bias in rows). In the MyHeart Counts dataset, we compare the ratios of majority and minority user segments as defined in Table 1 with the real-world ratios extracted from US population censuses. Specifically, we utilize the US Census Bureau (gender, race, and age (Bureu, 2022) distributions), the Centers for Disease Control and Prevention (BMI (Fryar et al., 2020a, b), joint issues (Theis et al., 2021), hypertension (for Disease Control et al., 2019), and diabetes (of Health et al., 2020)), and the American Heart Association (heart condition (Tsao et al., 2022)) data. Figure 3 showcases the results of this comparison in a radar plot. For example, while in the general US population, we have approximately 1 female per 1 male (ratio of 1.0 in pink), in the MyHeart Counts data, we have 0.2 females per 1 male, highlighting the substantial underrepresentation of women. The same applies to race, age, and hypertension segments, where the minority classes in the dataset (non-white users, users less than 45, and users with hypertension, respectively) do not reflect real-world ratios. An interesting finding is that, while in the US, there exist approximately 0.3 underweight, overweight, or obese people for every person with normal weight, in the dataset, this ratio is doubled. Hence, possibly due to historical biases and design choices, our analysis of the MyHeart Counts data (Figure 3) provides evidence that PI datasets might not be representative of target populations.
Underrepresented Populations
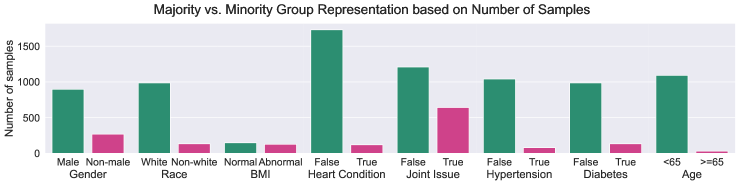
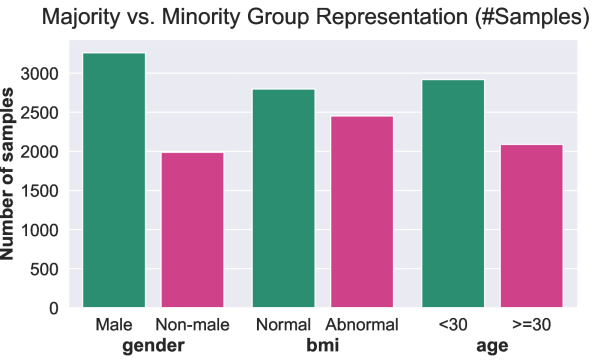
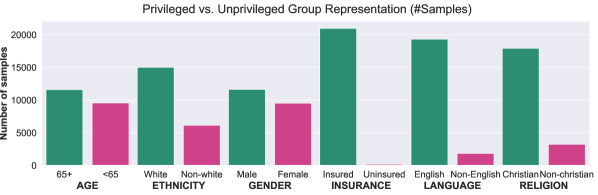
PI datasets can still include underrepresented groups (bias in rows) even if sampled perfectly. Figure 4 shows significant imbalances in the number of samples between minority and majority user segments across almost all protected attributes. We notice that even for representative sampling, e.g., users with joint or heart problems, the minority group is still significantly underrepresented. Thus, the model might be less robust for those users because it has less data to learn from. Overall, we see that the MyHeart Counts data are skewed towards white, fit males, which needs to be considered in the model-building phases. An ideal PI dataset should be representative of the target population while having enough minority samples. However, building large-scale PI datasets is challenging due to the required effort and cost.
Unevenly Sampled Populations
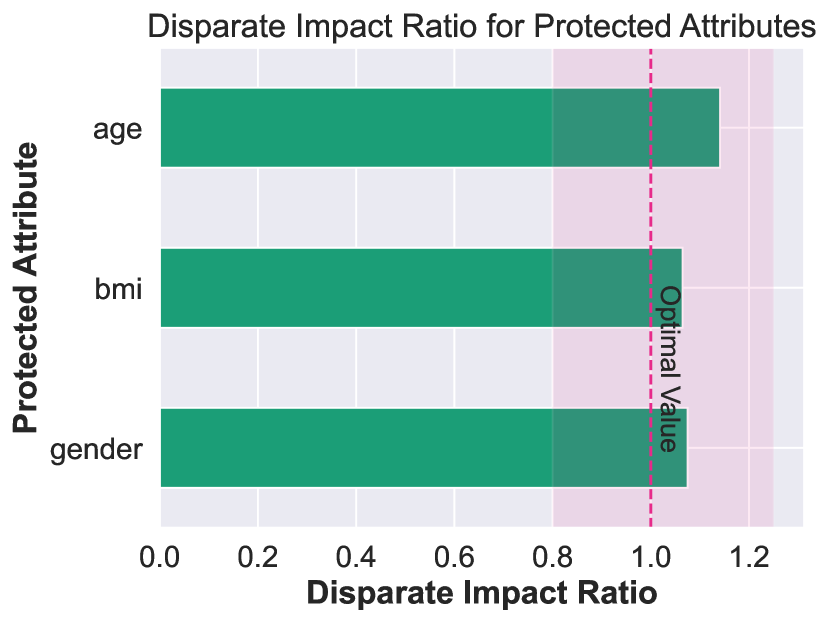
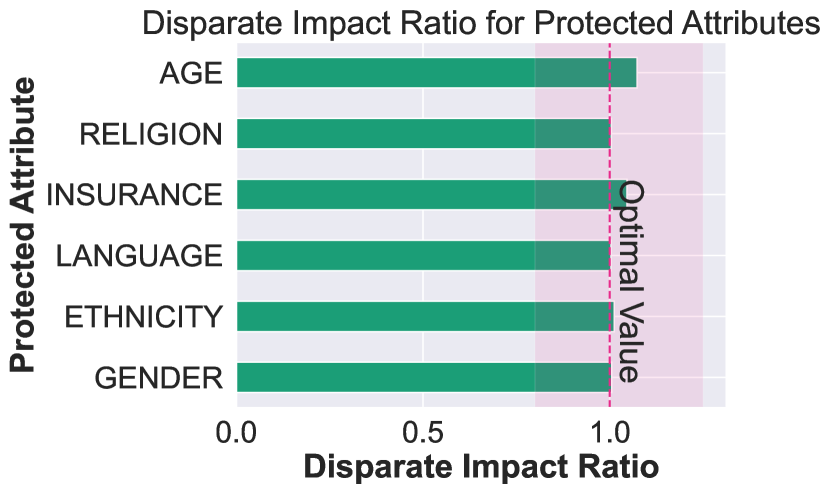
Even if sampling is representative and equal (e.g., 50% male and 50% female users), the dataset can still suffer from representation bias if the sampling method is uneven, e.g., active males but inactive females (bias in columns). This is also the case in MyHeart Counts. Figure 3 shows the DIR value per protected attribute (i.e., the ratio of recorded high activity for unprivileged versus privileged groups). For our use case, a value of means that the minority sample is significantly less active than the majority sample. Specifically, in the MyHeart Counts data, diabetes patients, users with joint issues, racial minorities, and to a smaller extent, women, racial minorities, and overweight and obese users systematically perform lower step counts in the dataset compared to their majority counterparts. On the contrary, users of different age groups with or without hypertension or heart issues do not differ significantly regarding step counts in the data.
4.3. Measurement Bias
In this section, we focus on the input modalities and their accuracy and discrepancies during data collection.
Device Differences
Data in the MyHeart Counts HealthKit dataset originate from different sources (i.e., 33% iPhone, 11% Apple Watch, and 56% third parties. iPhones use integrated sensors, including accelerometer, gyroscope, GPS, and magnetometer to detect and calculate step counts. The motion coprocessor unit reads the sensor data and communicates with the CMMotionActivityManager to classify user activity. This process cannot be fully replicated in Apple watches due to differences in placement, fit, and usage habits. Phones may underestimate step counts due to non-carrying time, while watches have been found more accurate for measuring daily step counts for healthy adults (Amagasa et al., 2019; Duncan et al., 2018; Veerabhadrappa et al., 2018). MyHeart Counts HealthKit data show statistically significant differences () in watch ownership across segments based on gender (46% of males have at least one watch entry vs. 28% females), heart condition (38% with vs. 26% without), and ethnicity (41% non-white vs. 36% white).
Model Differences
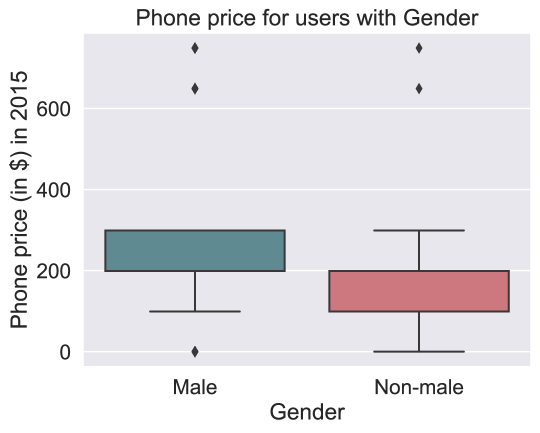
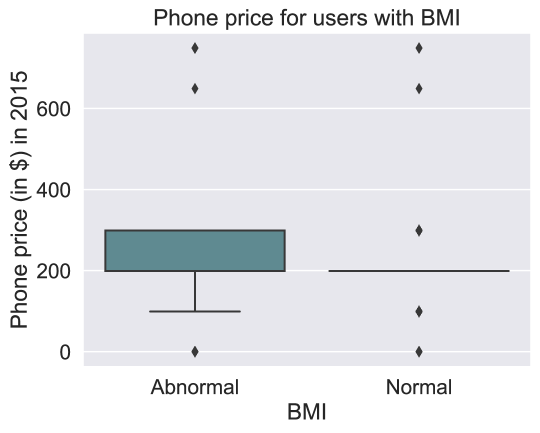
Accuracy differences have been reported across consecutive generations of phone devices (Duncan et al., 2018). Incremental hardware changes may increase the quantity, modality, and quality of data available for the device to classify user activity. For instance, the existence of specialized coprocessors, “always-on” capabilities, and revised recognition algorithms in newer phones can improve classification accuracy. In the MyHeartCounts data, we encounter various phone models, spanning five generations. We identify statistically significant differences () in phone ownership based on gender and BMI. Specifically, females and people with normal BMI tend to own older and cheaper phones with fewer capabilities (see Figure 5).
General Input Modality Differences
Finally, most MyHeart Counts data comes from third parties, such as alternative wearables or fitness and well-being apps. This is common in the PI domain, given the abundance and heterogeneity of available data sources. In our use case, we identify statistically significant differences in third party usage based on gender (91% males have at least one third party entry compared to 85% females) and diabetes condition (97% with vs. 90% without). However, different input devices or apps are proven to have different accuracies, likely to create measurement accuracy discrepancies between different users (El-Amrawy and Nounou, 2015).
5. Exploring Bias in Personal Informatics Model Building and Implementation
Bias in the model building and implementation stream can take the form of aggregation, learning, evaluation, and deployment biases, as seen in Figure 1(b). In this section, we discuss all four sources, providing an answer to RQ3, namely: Do ML models inherit PI data biases? Do they mitigate, propagate, or maybe even amplify them?
5.1. Aggregation Bias
We evaluate aggregation bias by plotting the DIR (selection rate, i.e., rate of high activity goals predictions) for different user segments’ predictions based on heart conditions, hypertension, joint issues, diabetes, race, BMI, gender, and age. We utilize two baseline models to capture the notions of “fairness through awareness” (Dwork et al., 2012) and “fairness through unawareness” (Kusner et al., 2017). In fairness through awareness, fairness is captured by the principle that similar individuals should have similar classification outcomes. In our use case, the similarity is defined based on user demographics in the absence of other features. In practical terms, the aware model is trained on a feature set that includes protected attributes per user. On the other hand, fairness through unawareness is satisfied if no protected attributes are explicitly used in the learning process (Verma and Rubin, 2018).
Models’ Description
Our baseline models and hyperparameters are sourced from prior work in the field of physical activity prediction that benchmarked six distinct learning paradigms from traditional ML models to advanced deep learning architectures on the MyHeart Counts dataset (Bampakis et al., 2022). For the scope of our work, we choose their best-performing model, a Long Short-Term Memory (LSTM) recurrent neural network, that achieves a Mean Absolute Error (MAE) of 1087 steps, beating previous state-of-the-art approaches by 67% on the task of physical activity prediction. For more details on the model architecture see Appendix A.
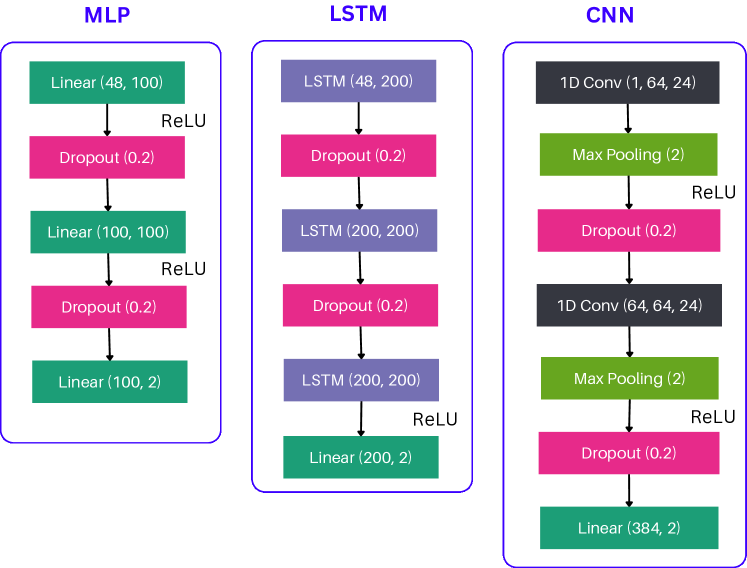
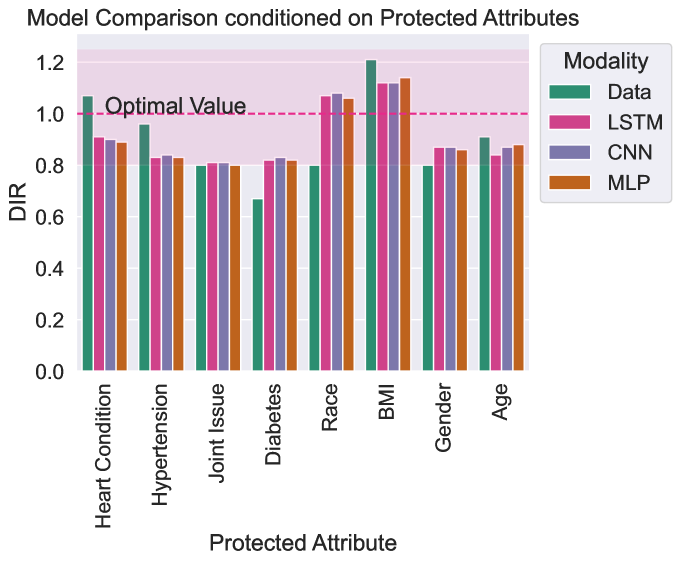
To further validate our model choice (LSTM), we also conduct comparative fairness assessments between three deep learning models (Figure 7):
-
•
3-layered Multilayer perceptron (MLP) with dropout
-
•
2-layered Convolutional Neural Network (CNN) with max-pooling and dropout
-
•
3-layered Long Short-Term Memory (LSTM) with dropout
As per Figure 7, both alternatives perform similarly to the “unaware” LSTM model regarding fairness metrics (i.e., only 0-2% deviation in DIR), indicating the generalizability of our claims across learning paradigms.
Single Attribute Biases
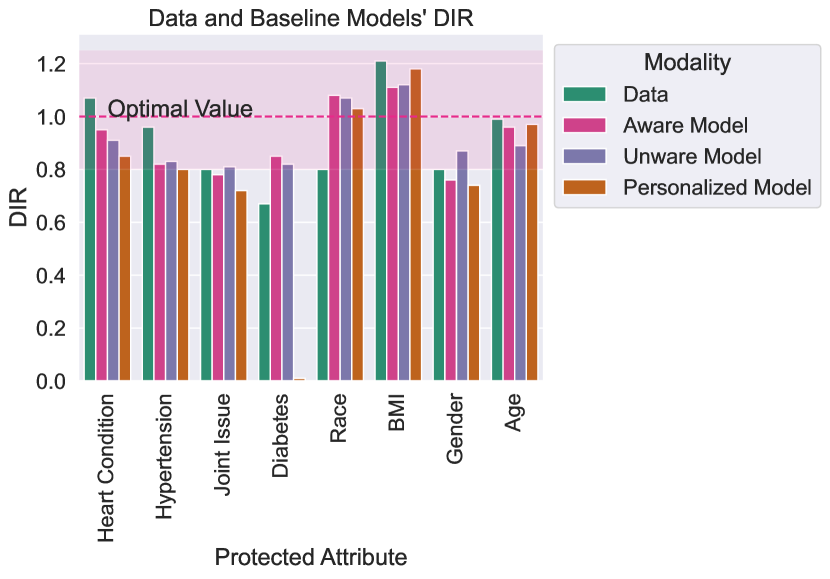
Figure 9 presents experimentation results concerning ML model biases measured via DIR. Specifically, aware learning models are not foolproof against data biases in most cases (joint issues, diabetes, gender), and even amplify them for specific protected attributes (hypertension); (2) Even excluding protected attributes from the training process of unaware models does not guarantee unbiased results in line with prior work (Pedreshi et al., 2008). Fairness through unawareness is also ineffective due to the presence of proxy features, i.e., features that work like proxies for protected attributes. Through them, bias propagates from data to models: for example, a person’s walking behavior (measured in step counts) is a good predictor of gender, BMI, and age, which can thus be inferred, despite being hidden during training (Kazlouski et al., 2022). Overall, diabetes patients have the largest bias gap compared to non-diabetic users, partially attributed to their highly biased training data. Yet, users with hypertension have the largest difference between data and model biases since models trained on seemingly unbiased data introduce bias during the learning process.
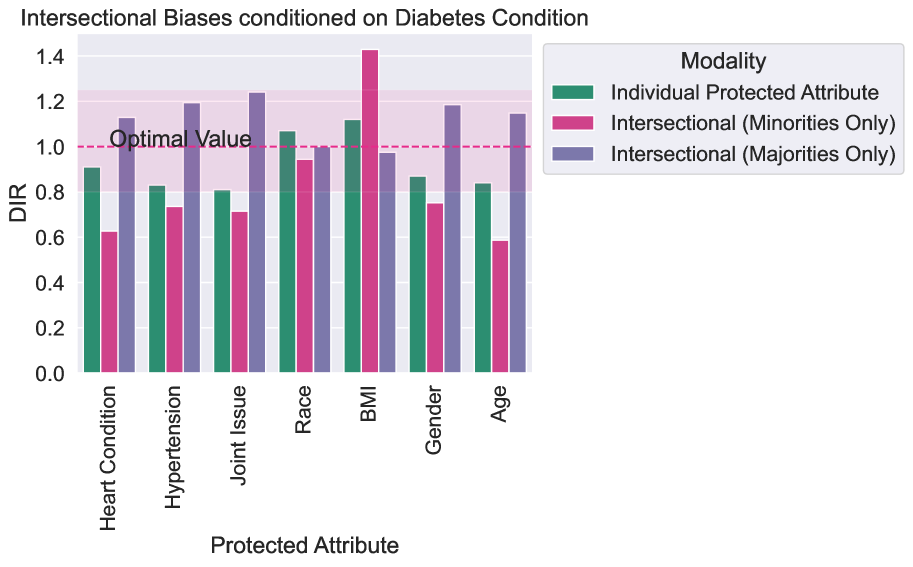
Intersectional Biases
We also examine intersectional biases, as shown in Figure 9; namely we quantify the biases of the unaware model conditioned on protected attribute combinations. Specifically, we consider two attributes at a time and two different combination strategies: minority-minority vs. rest (e.g., diabetic women) and majority-majority vs. rest (e.g., non-diabetic men). Keeping the diabetes attribute fixed, our results highlight the widening intersectional biases for individuals who belong to multiple minorities (in pink) across almost all attributes (with the exception of BMI, where individuals with unhealthy BMI are the majority group, despite usually being considered unprivileged in practice). The largest gap appears in individuals with more than one health condition, such as diabetic heart patients and diabetic patients aged 65+. At the same time, individuals who do not belong to any minority groups (in purple), benefit across all attributes. The trends in aggregation bias indicate that PI models do not tackle diverse user segments equally well and reflect or even amplify representation biases existing in the data, especially regarding intersectional biases.
5.2. Learning Bias
Personalization in prevalent in the PI literature, straying from the “one-size-fits-all” mentality and its shortcomings, as discussed above. Contrary to generic models, personalized models are fine-tuned given the data of a single user or user segment. Accounting for such interindividual variability has been proven to dramatically improve prediction performance in various tasks within the PI domain, such as pain detection, engagement estimation, and stress prediction from ubiquitous devices data (Taylor et al., 2017; Shi et al., 2022; Lopez-Martinez and Picard, 2017). Given the increasing popularity of the personalization paradigm, in this study, we investigate whether personalization as a modeling choice can amplify performance disparities across different user segments in the data, given the existence of representation bias.
Model Description
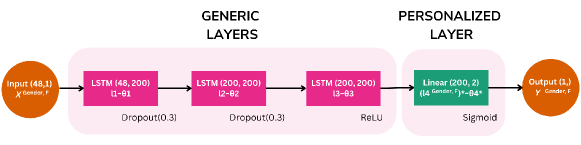
We base our approach on the CultureNet package (Rudovic et al., 2018, 2017) for building generalized and culturalized deep models to estimate engagement levels from face images of children with Autism Spectrum Condition. Specifically, we utilize our deep LSTM model, which is trained on data from all users, we freeze the network parameters tuned to both minority and majority user groups, as described in Section 5.1, and then fine-tune the last layer, i.e., a linear fully-connected layer, to each user group separately based on the MyHeart Counts protected attributes (health condition, hypertension, joint issues, diabetes, race, BMI, gender, age). Figure 10 delineates the personalization process. Appendix A provides a formal definition of the learning process.
Single Attribute Biases
While we could not identify significant performance benefits either for the privileged or unprivileged groups by utilizing personalization in our use case, we encountered significant bias shortcomings (Figure 9). Specifically, across all protected attributes (with a borderline exception of race), personalized models are more biased than either aware or unaware models or both. Users with diabetes present an extreme case. The personalized model “learns” that diabetics are less active than healthy users in the dataset and thus provides solely low activity goals, even to active diabetics. The intuition behind this behavior lies in the training process; personalized models amplify data representation biases through fine-tuning. Our findings highlight that a common modeling choice in PI, such as personalization, can negatively affect biases and asks for bias-aware personalization approaches to rip the benefits of user tailoring without leading to biased results.
5.3. Evaluation Bias
Benchmark Selection
ML models are optimized on training and validation data but evaluated on test benchmarks (Deng et al., 2009; Harper and Konstan, 2015). However, the ubiquitous computing community still suffers from a lack of larger benchmarks beyond HAR (Anguita et al., 2013) and sleep classification (Zhang et al., 2018; Chen et al., 2015). Also, benchmarks within the community often do not represent the target population. For example, within the fall detection domain, due to safety concerns, datasets usually comprise imitated falls performed by younger people while they are deployed on older people (Sucerquia et al., 2017).
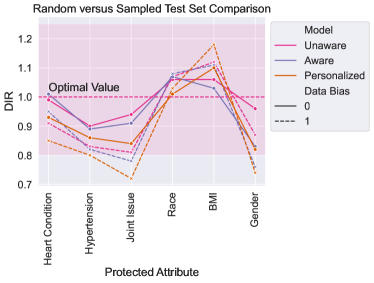
Yet, a misrepresentative benchmark encourages deploying models that perform well only on the benchmark population. To illustrate our point, given the lack of established benchmarks in PI, we devise two distinct test sets for comparison purposes: our original, “realistic” (random) test set, and a sampled subset of the latter (“ideal”), with demographic parity at base rate (). We then evaluate our models on these two test sets. Figure 11 presents the results of our experimentation, where it is clear that the ideal test set, imitating a “fair” world, consistently shows lower bias than the “realistic” test set. Better performance is defined as smaller deviations from the optimal DIR value of . Essentially, an ideal-world benchmark is “hiding” the imperfections of our trained model, which has been proven to propagate or even amplify biases based on the original, random test set.
Evaluation Metric Selection
Evaluation bias can also emerge from the metric used to quantify the models’ performance. For instance, group fairness hybrid metrics, such as error rates, are prone to imbalances and can hide disparities in other types of bias metrics, such as WAE metrics (see Appendix B). Similarly, aggregate measures, such as accuracy, can hide subgroup under-performance or conceal shortcomings in other metrics (Suresh and Guttag, 2021).
5.4. Deployment Bias
Changing Deployment Scenarios
PI’s most active research areas are Human-Activity Recognition and Sleep Classification. From this lens, False Positives (FP) and False Negatives (FN), i.e., Type I and Type II errors, respectively, in these scenarios are not critical, and models have been developed to maximize True Positives (TPs). This dominant view promotes deployment bias in novel use cases with the emergence of health-related intelligence embedded into PI systems. For example, given ECG sensor data and AFib detection functionality, Type II errors should be minimized to avoid loss of life. It is thus critical to reassess the conceptualization of PI systems’ evaluation practices and datasets and tailor them to their context.
Development in Isolation
ML models for PI systems are built and evaluated as if they were fully autonomous. In reality, they operate in a complex socio-ethical system moderated by institutions and human decision-makers, also known as the “framing trap” (Selbst et al., 2019). Users may share their mHeatlh data with physicians for interpretation and disease management. Despite good performance in isolation, they may lead to harmful consequences due to human biases, e.g., confirmation bias. Specifically, physicians are more likely to believe AI that supports current practices and opinions (Parikh et al., 2019). At the same time, research shows that physicians’ perceptions about black male patients’ physical activity behavior were significant predictors of their recommendations for surgery, independent of clinical factors, appropriateness, payer, and physician characteristics (Van Ryn et al., 2006). Such complicated interconnections highlight how evaluating a system in isolation creates unrealistic notions of its benefits and harms.
Biased Interpretation.
Interpreting biased data can result in self-trackers making incorrect inferences or inappropriate tracking decisions. Discomfort with the information revealed and concerns about data quality —which may not be consistent across demographics— can lead to PI abandonment (Epstein et al., 2016). Additionally, discrepancies between users’ expectations and biased data and subjectivity and uncertainty in data interpretation can fuel rumination (i.e., anxious self-attention and fear of failure), hindering self-improvement efforts and increasing the likelihood of abandonment. This is particularly relevant for health tracking and vulnerable populations, such as those with chronic illnesses, mental health conditions, and women facing fertility challenges, where the association of goals with identity and critical outcomes may increase the propensity for rumination (Eikey et al., 2021).
6. Generalizability
This section aims to (i) demonstrate the straightforward applicability of our methodology to other datasets and (ii) reveal initial insights about the generality of our findings and future steps.
While our analysis was conducted on the MyHeart Counts dataset, some of our findings can be potentially generalized to other scenarios in PI and mHealth. To showcase this, we apply part of our experiments on two distinct datasets:
-
•
LifeSnaps is a newly-released, medium-scale, multi-modal dataset containing 71M rows of anthropological data, collected unobtrusively for the total course of more than four months by 71 participants. Based on data availability, we consider three protected attributes in Lifesnaps, namely gender, age, and BMI. Also, given the lack of official benchmark tasks, we consider the “next-day physical activity prediction” task for model training, same with the MyHeart Counts dataset.
-
•
MIMIC-III is an established, large-scale clinical dataset consisting of information concerning more than 38K patients admitted to intensive care units (ICU) at a large tertiary care hospital in the US. Based on data availability, in MIMIC-III, we consider six protected attributes, namely gender, ethnicity, language, insurance, religion, and age. Contrary to LifeSnaps or MyHeart Counts, there exists a public benchmark suite that includes four different clinical prediction tasks for MIMIC-III (Harutyunyan et al., 2019). For this analysis, we utilize the “in-hospital mortality” task as a binary classification equivalent to the “next-day physical activity prediction” task.

In exploring biases, we identified both commonalities and differences across PI datasets. Regarding the data generation stream, representation biases seem to be the norm in PI datasets, naturally leading to learning and aggregation biases in the model building and implementation stream and highlighting the need for increased awareness among researchers and practitioners in the field. Having said that, the identified biases are distinct in each dataset, emerging mostly from their recruitment methodology and the availability of protected attributes.
Bias in Rows Commonalities
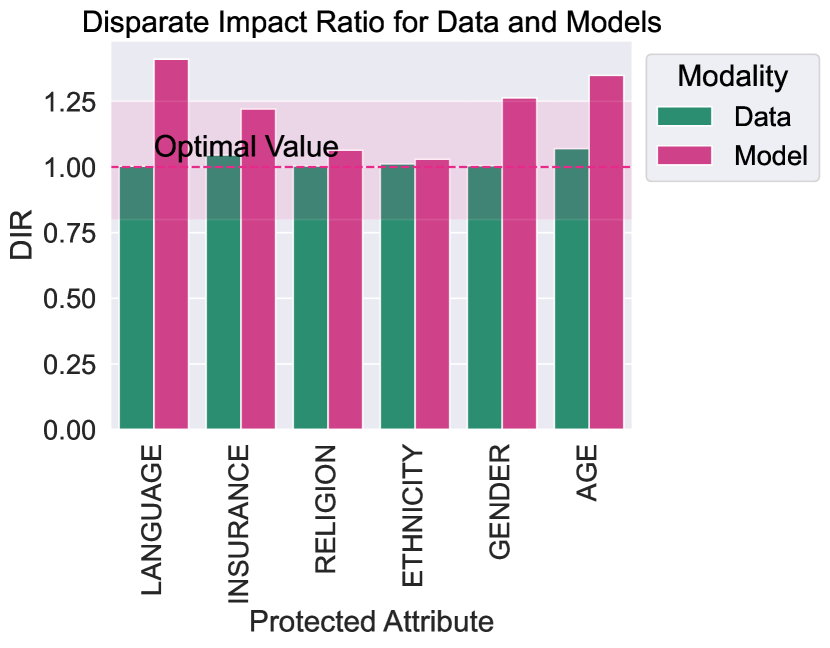
Both datasets, similarly to MyHeart Counts, suffer from some type of “bias in rows” as seen in Figures 12(a) and 13(a). Specifically, LifeSnaps and MIMIC-III suffer from misrepresented populations. In LifeSnaps (Figures 12(a) and 12(b)), younger people are overrepresented due to university-based recruitment, while in MIMIC-III (Figures 13(a) and 13(b)) older people are overrepresented due to ICU-based recruitment. Additionally, while gender and ethnicity representation is improved compared to MyHeart Counts, still white males are overrepresented in all three datasets. MIMIC-III, similarly to MyHeartCounts, suffers from underrepresented populations, such as uninsured, non-white, non-English-speaking, or non-christian users (Figure 13(b)). These biases are, in turn, propagated to the baseline learning models (Figure 13(d)), in line with prior work (Röösli et al., 2022).
Bias in Columns Differences
When “bias in columns” is explored, contrary to the MyHeart Counts data, both datasets are evenly sampled in terms of outcome labels, namely physical activity in LifeSnaps and in-hospital mortality for MIMIC-III (Figures 12(c) and 13(c), respectively). Hence, these findings may not directly generalize to other PI datasets but are still included in our methodology for completeness and visibility. Specifically, contrary to population demographics which can capture misrepresented and underrepresented groups, an analysis for unevenly sampled populations is not commonly performed during data exploration, whereas in certain cases, such as MyHeart Counts, it could reveal behavioral discrepancies across populations.
Model Bias
In line with prior research (Röösli et al., 2022), we encounter biases in MIMIC’s deep learning benchmark models. Specifically, as seen in Figure 13(d), despite even data sampling, models amplify biases for non-English-speaking, uninsured, female, and elderly users. Similar trends, independent of demographics, were noticed in the MyHeart Counts dataset. On the contrary, we do not notice any statistically significant differences in the LifeSnaps dataset (Figure 12(d)), possibly due to its limited sample size compared to the other two datasets.
Overall, these findings concerning generalizability highlight the need for comprehensive data and model evaluation in PI and, by extension, mHealth. It is high time PI researchers and practitioners looked beyond performance-only metrics to human-centric metrics capturing biases and demographic parity.
7. Discussion
Unacknowledged data and model biases in PI applications for health and well-being can have critical personal and societal consequences; they can perpetuate health disparities (Mamykina et al., 2015), result in misdiagnoses or delayed diagnoses for certain population segments (Obermeyer et al., 2019), affect resource allocation and access to healthcare services (Sjoding et al., 2020), or reinforce stereotypes and stigma (Lupton, 2014). This section discusses our findings concerning biases in PI systems and provides guidelines on mitigating identified biases in their ML life cycle (§7.1). It also delineates the limitations of our work and areas for future research (§7.2).
7.1. Findings & Implications
Data Generation Stream
As illustrated by our findings, pre-existing historical biases are present in digital biomarkers, due to well-documented phenomena, such as the global inequality in physical activity and the digital divide, leading to data generation that is not representative of the general population. This is indeed the case in the MyHeart Counts dataset, where female, non-white, underweight, overweight or obese, young, and hypertensive users, are undersampled. Unacknowledged historical biases, though, can creep into the ML pipeline perpetuating social injustices. Yet, even within well-sampled user groups, data imbalances, either in terms of user attributes or measured behaviors, are still prevalent due to realistic differences across user segments. Specifically, in PI, we see significant underrepresentation of minority groups across all protected attributes and measured behavioral differences —not necessarily realistic— for users with diabetes, joint issues, unhealthy BMI, non-white users, and females. Unresolved representation biases can lead to performance discrepancies for minority groups, which in turn might lead to differences in treatment or care (Gottlieb et al., 2022). Finally, PI data is susceptible to measurement biases, due to the heterogeneity in input modalities, performance and hardware differences across generations of devices, and usage of third-multiple party apps of unknown accuracy. Females are especially affected by such biases in our dataset, as they tend to own older devices with fewer capabilities and use more fitness-related third-party apps. Unknown measurement biases in seemingly “objective” sensor data can lead to errors in downstream tasks that disproportionally affect certain protected groups.
In an initial attempt to offer guidance to researchers in the field of ubiquitous computing, we present the following guidelines in the context of the data generation stream on how to mitigate the impact of historical, representation, and measurement biases, respectively:
Summing up, we believe that our findings shed light on the biases that can creep into the data generation and model building, and implementation streams of PI technologies. While our mitigation guidelines are by no means exhaustive, they provide a starting point for researchers and practitioners to incorporate bias assessments “by design” in the life cycle of their works to alleviate the potential negative effects of such biases.
Model Building and Implementation Stream
Based on our results, digital biomarkers representation biases can be propagated or even amplified by learning models, regardless of the inclusion of protected attributes in the feature set. This is due to the existence of proxy variables in PI data that can be used by models to infer hidden protected attributes. Such aggregation biases are also prevalent in our use case for users with joint issues, diabetes, hypertension, and female users. These biases may (or may not) lead to discrimination depending on the context. Yet, mitigating them is the safest way to ensure fairness. Additionally, common learning choices in PI, such as personalization, can introduce learning biases, if trained on biased data. In our case, they perform worse -in terms of bias- across all attributes, while, in extreme cases (e.g., diabetic users), they can even introduce maximum bias. Accuracy gains emerging from alternative learning choices can be tempting, but their trade-offs should be thoroughly assessed. On a different note, our empirical results illustrate that model performance is highly susceptible to the representativeness of the PI benchmark used and highlight how evaluation biases can affect ubiquitous models in the evaluation phase. In such cases, performance and fairness drift can emerge if the evaluation data is not representative of the target population. Finally, the application of ML in PI is not free of deployment biases, which can emerge from outdated evaluation practices emerging from the PI systems’ early applications or the false assumption of autonomous PI systems’ existence. Yet, mischoosing evaluation metrics or focusing solely on aggregate metrics can hide discrepancies in performance for minority groups. Developing high-stakes systems in isolation might also lead to (unintended) system misuse.
To provide guidance in the context of model building and implementations, we offer guidelines to alleviate the potential negative effects of the aggregation, learning, evaluation, and deployment biases, respectively:
7.2. Limitations & Future Work
While MyHeart Counts offers scale and access to protected attributes, as outlined in §3, and our generalizability study supports our findings as described in §6, additional analyses may be necessary to fully comprehend bias in PI. For instance, certain protected attributes in the dataset have incomplete categorization, e.g., gender is treated as a binary concept, while others might be fully absent regardless of relevance to the use case, e.g., physical or mental disability and pregnancy. At the same time, the selected dataset is US-based, not capturing activity patterns across the global population. Hence our findings might not be directly applicable across protected attributes and geographical contexts. Finally, while activity tracking is the most common functionality in PI systems and prior work has highlighted worldwide physical activity inequality (Althoff et al., 2017), our dataset does not capture more advanced health features, such as heart monitoring and fertility tracking. Still, it is important to recognize that different use cases might incorporate different biases. Hence, while our findings shed light on the previously unexplored field of PI biases, they should be further corroborated across different contexts, such as demographics, geographical regions, and use cases.
Appropriate PI datasets for fueling future fairness research in the domain are still lacking. Due to the sensitivity of the data at hand, many datasets are proprietary with restrictive Institutional Review Board (IRB) agreements, but inclusive, open datasets could significantly advance the domain. Also, given the prevalence of small-scale datasets, future work should focus on quantifying biases in small digital biomarkers data, as realistically, most institutions will never acquire big data (Baeza-Yates, 2018b). Additionally, due to closed-sourced data and algorithms, there is a lack of established benchmarks, especially regarding emerging PI tasks, such as fertility prediction, or AFib detection. To this end, similarly to the work of Harutyunyan et al. (2019), future work should create inclusive and representative benchmarks for tasks within the PI domain. Beyond that, there is work to be done in quantifying and mitigating bias in sequential physiological and behavioral data. For instance, many PI tasks are formulated as regression problems, but regression-specific fairness metrics and mitigation approaches are limited in the literature (Gursoy and Kakadiaris, 2022; Agarwal et al., 2019). Finally, due to privacy considerations for sensitive digital biomarkers, many times PI data are not accompanied by protected attributes for the population they describe, making it cumbersome to perform a bias and fairness evaluation. To this end, future work should investigate the space of “fairness in unawareness”, or, in other words, how you can quantify and mitigate biases in the absence of protected attributes.
8. Conclusions
This paper presents the first-of-its-kind, comprehensive study of bias in PI by analyzing the most extensive digital biomarkers data to date. In response to our RQs, we show that bias exists across all stages of the life cycle, both in the data generation and model building and implementation streams. Different user minorities are affected by diverse types of bias, but users with diabetes, joint issues, or hypertension and female users show higher degrees of impact adversity in our MyHeart Counts use case due to representation, aggregation, and learning biases. Our findings echo concerns similar to those raised in the evaluation for healthcare technologies (Ahmad et al., 2020). While some of our findings are specific to the investigated use case, they can mostly be extended to other PI tasks.
Acknowledgements.
This project has received funding from the European Union’s Horizon 2020 research and innovation programme under the Marie Skłodowska-Curie grant agreement No 813162. The content of this paper reflects only the authors’ view and the Agency and the Commission are not responsible for any use that may be made of the information it contains. Results presented in this work have been produced using the Aristotle University of Thessaloniki Compute Infrastructure and Resources. The authors would like to acknowledge the support provided by the Scientific Computing Office throughout the progress of this research work.References
- (1)
- Adamson and Smith (2018) Adewole S Adamson and Avery Smith. 2018. Machine learning and health care disparities in dermatology. JAMA dermatology 154, 11 (2018), 1247–1248.
- Agarwal et al. (2019) Alekh Agarwal, Miroslav Dudík, and Zhiwei Steven Wu. 2019. Fair regression: Quantitative definitions and reduction-based algorithms. In International Conference on Machine Learning. PMLR, JMLR, Campridge, MA, United States, 120–129.
- Ahmad et al. (2020) Muhammad Aurangzeb Ahmad, Arpit Patel, Carly Eckert, Vikas Kumar, and Ankur Teredesai. 2020. Fairness in machine learning for healthcare. In Proceedings of the 26th ACM SIGKDD International Conference on Knowledge Discovery & Data Mining. Association for Computing Machinery, New York, NY, USA, 3529–3530.
- Althoff et al. (2017) Tim Althoff, Rok Sosič, Jennifer L Hicks, Abby C King, Scott L Delp, and Jure Leskovec. 2017. Large-scale physical activity data reveal worldwide activity inequality. Nature 547, 7663 (2017), 336–339.
- Amagasa et al. (2019) Shiho Amagasa, Masamitsu Kamada, Hiroyuki Sasai, Noritoshi Fukushima, Hiroyuki Kikuchi, I-Min Lee, Shigeru Inoue, et al. 2019. How well iPhones measure steps in free-living conditions: cross-sectional validation study. JMIR mHealth and uHealth 7, 1 (2019), e10418.
- Anguita et al. (2013) Davide Anguita, Alessandro Ghio, Luca Oneto, Xavier Parra Perez, and Jorge Luis Reyes Ortiz. 2013. A public domain dataset for human activity recognition using smartphones. In Proceedings of the 21th International European Symposium on Artificial Neural Networks, Computational Intelligence and Machine Learning. MDPI, Basel, Switzerland, 437–442.
- Apple (2022a) Apple. 2022a. Empowering people to live a healthier day. Health Report 1 (2022), 60.
- Apple (2022b) Apple. 2022b. How Apple is empowering people with their health information — apple.com. https://www.apple.com/gr/newsroom/2022/07/how-apple-is-empowering-people-with-their-health-information/. [Accessed 14-Nov-2022].
- Awwad et al. (2020) Yazeed Awwad, Richard Fletcher, Daniel Frey, Amit Gandhi, Maryam Najafian, and Mike Teodorescu. 2020. Exploring fairness in machine learning for international development. Technical Report. CITE MIT D-Lab.
- Baeza-Yates (2018a) Ricardo Baeza-Yates. 2018a. Bias on the Web. Commun. ACM 61, 6 (2018), 54–61.
- Baeza-Yates (2018b) Ricardo Baeza-Yates. 2018b. BIG, small or Right Data: Which is the proper focus. https://www.kdnuggets.com/2018/10/big-small-right-data.html.
- Bagdasaryan et al. (2019) Eugene Bagdasaryan, Omid Poursaeed, and Vitaly Shmatikov. 2019. Differential privacy has disparate impact on model accuracy. Advances in Neural Information Processing Systems 32 (2019), 15479––15488.
- Bampakis et al. (2022) Asterios Bampakis, Sofia Yfantidou, and Athena Vakali. 2022. UBIWEAR: An end-to-end, data-driven framework for intelligent physical activity prediction to empower mHealth interventions. In 2022 IEEE International Conference on E-health Networking, Application & Services (HealthCom). IEEE, IEEE, New York, NY, United States, 56–62.
- Barbosa and Chen (2019) Natã M Barbosa and Monchu Chen. 2019. Rehumanized crowdsourcing: A labeling framework addressing bias and ethics in machine learning. In Proceedings of the 2019 CHI Conference on Human Factors in Computing Systems. Association for Computing Machinery, New York, NY, USA, 1–12.
- Bolukbasi et al. (2016) Tolga Bolukbasi, Kai-Wei Chang, James Y Zou, Venkatesh Saligrama, and Adam T Kalai. 2016. Man is to computer programmer as woman is to homemaker? debiasing word embeddings. Advances in Neural Information Processing Systems 29 (2016), 4356––4364.
- Buolamwini and Gebru (2018) Joy Buolamwini and Timnit Gebru. 2018. Gender shades: Intersectional accuracy disparities in commercial gender classification. In Conference on fairness, accountability and transparency. PMLR, JMLR, Campridge, MA, United States, 77–91.
- Bureu (2022) United States Census Bureu. 2022. National Population by Characteristics: 2020-2021. https://www.census.gov/data/tables/time-series/demo/popest/2020s-national-detail.html
- Castelnovo et al. (2022) Alessandro Castelnovo, Riccardo Crupi, Greta Greco, Daniele Regoli, Ilaria Giuseppina Penco, and Andrea Claudio Cosentini. 2022. A clarification of the nuances in the fairness metrics landscape. Scientific Reports 12, 1 (2022), 4209.
- Chen et al. (2019) Irene Y Chen, Peter Szolovits, and Marzyeh Ghassemi. 2019. Can AI help reduce disparities in general medical and mental health care? AMA journal of ethics 21, 2 (2019), 167–179.
- Chen et al. (2015) Xiaoli Chen, Rui Wang, Phyllis Zee, Pamela L Lutsey, Sogol Javaheri, Carmela Alcántara, Chandra L Jackson, Michelle A Williams, and Susan Redline. 2015. Racial/ethnic differences in sleep disturbances: the Multi-Ethnic Study of Atherosclerosis (MESA). Sleep 38, 6 (2015), 877–888.
- Chetty et al. (2018) Krish Chetty, Liu Qigui, Nozibele Gcora, Jaya Josie, Li Wenwei, and Chen Fang. 2018. Bridging the digital divide: measuring digital literacy. Economics 12, 1 (2018), 1–17.
- Cho et al. (2022) Peter Jaeho Cho, Jaehan Yi, Ethan Ho, Md Mobashir Hasan Shandhi, Yen Dinh, Aneesh Patil, Leatrice Martin, Geetika Singh, Brinnae Bent, Geoffrey Ginsburg, et al. 2022. Demographic Imbalances Resulting From the Bring-Your-Own-Device Study Design. JMIR mHealth and uHealth 10, 4 (2022), e29510.
- Collins (2018) Erin Collins. 2018. Punishing risk. Geo. LJ 107 (2018), 57.
- Commission et al. (1990) Equal Employment Opportunity Commission et al. 1990. Uniform guidelines on employee selection procedures. Fed Register 1 (1990), 216–243.
- Danks and London (2017) David Danks and Alex John London. 2017. Algorithmic Bias in Autonomous Systems. In Proceedings of the 26th International Joint Conference on Artificial Intelligence (Melbourne, Australia) (IJCAI’17). AAAI Press, Washington, DC, United States, 4691–4697.
- Demanuele et al. (2022) Charmaine Demanuele, Cynthia Lokker, Krishna Jhaveri, Pirinka Georgiev, Emre Sezgin, Cindy Geoghegan, Kelly H Zou, Elena Izmailova, and Marie McCarthy. 2022. Considerations for Conducting Bring Your Own “Device”(BYOD) Clinical Studies. Digital biomarkers 6, 2 (2022), 47–60.
- Deng et al. (2009) Jia Deng, Wei Dong, Richard Socher, Li-Jia Li, Kai Li, and Li Fei-Fei. 2009. Imagenet: A large-scale hierarchical image database. In 2009 IEEE conference on computer vision and pattern recognition. IEEE, IEEE, New York, NY, United States, 248–255.
- Denton et al. (2020) Emily Denton, Alex Hanna, Razvan Amironesei, Andrew Smart, Hilary Nicole, and Morgan Klaus Scheuerman. 2020. Bringing the people back in: Contesting benchmark machine learning datasets. Technical Report. arXiv preprint 2007.07399. 1–6 pages.
- Duncan et al. (2018) Markus J Duncan, Kelly Wunderlich, Yingying Zhao, and Guy Faulkner. 2018. Walk this way: validity evidence of iphone health application step count in laboratory and free-living conditions. Journal of sports sciences 36, 15 (2018), 1695–1704.
- Dwork et al. (2012) Cynthia Dwork, Moritz Hardt, Toniann Pitassi, Omer Reingold, and Richard Zemel. 2012. Fairness through awareness. In Proceedings of the 3rd innovations in theoretical computer science conference. Association for Computing Machinery, New York, NY, USA, 214–226.
- Eikey et al. (2021) Elizabeth Victoria Eikey, Clara Marques Caldeira, Mayara Costa Figueiredo, Yunan Chen, Jessica L Borelli, Melissa Mazmanian, and Kai Zheng. 2021. Beyond self-reflection: introducing the concept of rumination in personal informatics. Personal and Ubiquitous Computing 25, 3 (2021), 601–616.
- El-Amrawy and Nounou (2015) Fatema El-Amrawy and Mohamed Ismail Nounou. 2015. Are currently available wearable devices for activity tracking and heart rate monitoring accurate, precise, and medically beneficial? Healthcare informatics research 21, 4 (2015), 315–320.
- Epstein et al. (2020) Daniel A Epstein, Clara Caldeira, Mayara Costa Figueiredo, Xi Lu, Lucas M Silva, Lucretia Williams, Jong Ho Lee, Qingyang Li, Simran Ahuja, Qiuer Chen, et al. 2020. Mapping and taking stock of the personal informatics literature. Proceedings of the ACM on Interactive, Mobile, Wearable and Ubiquitous Technologies 4, 4 (2020), 1–38.
- Epstein et al. (2016) Daniel A Epstein, Monica Caraway, Chuck Johnston, An Ping, James Fogarty, and Sean A Munson. 2016. Beyond abandonment to next steps: understanding and designing for life after personal informatics tool use. In Proceedings of the 2016 CHI conference on human factors in computing systems. 1109–1113.
- Ericsson ConsumerLab (2016) Ericsson ConsumerLab. 2016. Wearable technology and the IoT.
- Feng et al. (2022) Qizhang Feng, Mengnan Du, Na Zou, and Xia Hu. 2022. Fair machine learning in healthcare: A review. Technical Report. arXiv preprint 2206.14397. 1–21 pages.
- Fitbit (2022) Fitbit. 2022. Irregular Rhythm — fitbit.com. https://www.fitbit.com/global/us/technology/irregular-rhythm. [Accessed 14-Nov-2022].
- Fleisher (2021) Will Fleisher. 2021. What’s Fair about Individual Fairness?. In Proceedings of the 2021 AAAI/ACM Conference on AI, Ethics, and Society. Association for Computing Machinery, New York, NY, United States, 480–490.
- Fletcher et al. (2021) Richard Ribón Fletcher, Audace Nakeshimana, and Olusubomi Olubeko. 2021. Addressing fairness, bias, and appropriate use of artificial intelligence and machine learning in global health. , 561802 pages.
- for Disease Control et al. (2019) Centers for Disease Control, Prevention (CDC), et al. 2019. Hypertension cascade: hypertension prevalence, treatment and control estimates among US adults aged 18 years and older applying the criteria from the American College of Cardiology and American Heart Association’s 2017 Hypertension Guideline—NHANES 2013–2016.
- Frey et al. (2020) William R Frey, Desmond U Patton, Michael B Gaskell, and Kyle A McGregor. 2020. Artificial intelligence and inclusion: Formerly gang-involved youth as domain experts for analyzing unstructured twitter data. Social Science Computer Review 38, 1 (2020), 42–56.
- Friedler et al. (2021) Sorelle A Friedler, Carlos Scheidegger, and Suresh Venkatasubramanian. 2021. The (im) possibility of fairness: Different value systems require different mechanisms for fair decision making. Commun. ACM 64, 4 (2021), 136–143.
- Fryar et al. (2020b) Cheryl D Fryar, Margaret D Carroll, and Joseph Afful. 2020b. Prevalence of underweight among adults aged 20 and over: United States, 1960–1962 through 2017–2018.
- Fryar et al. (2020a) Cheryl D Fryar, Margaret D Carroll, Joseph Afful, et al. 2020a. Prevalence of overweight, obesity, and severe obesity among adults aged 20 and over: United States, 1960–1962 through 2017–2018. , 7 pages.
- Garbett et al. (2018) Andrew Garbett, David Chatting, Gerard Wilkinson, Clement Lee, and Ahmed Kharrufa. 2018. ThinkActive: designing for pseudonymous activity tracking in the classroom. In Proceedings of the 2018 CHI Conference on Human Factors in Computing Systems. Association for Computing Machinery, New York, NY, USA, 1–13.
- Gottlieb et al. (2022) Eric Raphael Gottlieb, Jennifer Ziegler, Katharine Morley, Barret Rush, and Leo Anthony Celi. 2022. Assessment of racial and ethnic differences in oxygen supplementation among patients in the intensive care unit. JAMA internal medicine 182, 8 (2022), 849–858.
- Group (2021) The Radicati Group. 2021. Mobile Statistics Report, 2021-2025. https://www.radicati.com/wp/wp-content/uploads/2021/Mobile_Statistics_Report,_2021-2025_Executive_Summary.pdf
- Gursoy and Kakadiaris (2022) Furkan Gursoy and Ioannis A Kakadiaris. 2022. Error Parity Fairness: Testing for Group Fairness in Regression Tasks. Technical Report. arXiv preprint 2208.08279. 1–12 pages.
- Guthold et al. (2018) Regina Guthold, Gretchen A Stevens, Leanne M Riley, and Fiona C Bull. 2018. Worldwide trends in insufficient physical activity from 2001 to 2016: a pooled analysis of 358 population-based surveys with 1· 9 million participants. The lancet global health 6, 10 (2018), e1077–e1086.
- Harper and Konstan (2015) F Maxwell Harper and Joseph A Konstan. 2015. The movielens datasets: History and context. ACM Transactions on Interactive Intelligent Systems (TIIS) 5, 4 (2015), 1–19.
- Harutyunyan et al. (2019) Hrayr Harutyunyan, Hrant Khachatrian, David C Kale, Greg Ver Steeg, and Aram Galstyan. 2019. Multitask learning and benchmarking with clinical time series data. Scientific data 6, 1 (2019), 1–18.
- Hershman et al. (2019) Steven G Hershman, Brian M Bot, Anna Shcherbina, Megan Doerr, Yasbanoo Moayedi, Aleksandra Pavlovic, Daryl Waggott, Mildred K Cho, Mary E Rosenberger, William L Haskell, et al. 2019. Physical activity, sleep and cardiovascular health data for 50,000 individuals from the MyHeart Counts Study. Scientific data 6, 1 (2019), 1–10.
- Hoffman et al. (2016) Kelly M Hoffman, Sophie Trawalter, Jordan R Axt, and M Norman Oliver. 2016. Racial bias in pain assessment and treatment recommendations, and false beliefs about biological differences between blacks and whites. Proceedings of the National Academy of Sciences 113, 16 (2016), 4296–4301.
- Hutiri and Ding (2022) Wiebke Toussaint Hutiri and Aaron Yi Ding. 2022. Bias in automated speaker recognition. In 2022 ACM Conference on Fairness, Accountability, and Transparency. Association for Computing Machinery, New York, NY, USA, 230–247.
- Hutiri et al. (2023) Wiebke (Toussaint) Hutiri, Aaron Yi Ding, Fahim Kawsar, and Akhil Mathur. 2023. Tiny, Always-on and Fragile: Bias Propagation through Design Choices in On-Device Machine Learning Workflows. ACM Trans. Softw. Eng. Methodol. (apr 2023). https://doi.org/10.1145/3591867 Just Accepted.
- Jiang et al. (2017) Fei Jiang, Yong Jiang, Hui Zhi, Yi Dong, Hao Li, Sufeng Ma, Yilong Wang, Qiang Dong, Haipeng Shen, and Yongjun Wang. 2017. Artificial intelligence in healthcare: past, present and future. Stroke and vascular neurology 2, 4 (2017), 230–243.
- Johnson et al. (2020) Alistair Johnson, Lucas Bulgarelli, Tom Pollard, Steven Horng, Leo Anthony Celi, and Roger Mark. 2020. Mimic-iv.
- Johnson et al. (2016) Alistair EW Johnson, Tom J Pollard, Lu Shen, Li-wei H Lehman, Mengling Feng, Mohammad Ghassemi, Benjamin Moody, Peter Szolovits, Leo Anthony Celi, and Roger G Mark. 2016. MIMIC-III, a freely accessible critical care database. Scientific Data 3, 1 (2016), 1–9.
- Kamulegeya et al. (2019) Louis Henry Kamulegeya, Mark Okello, John Mark Bwanika, Davis Musinguzi, William Lubega, Davis Rusoke, Faith Nassiwa, and Alexander Börve. 2019. Using artificial intelligence on dermatology conditions in Uganda: A case for diversity in training data sets for machine learning. BioRxiv (2019).
- Kaye et al. (2014) Joseph Jofish Kaye, Mary McCuistion, Rebecca Gulotta, and David A Shamma. 2014. Money talks: tracking personal finances. In Proceedings of the SIGCHI Conference on Human Factors in Computing Systems. Association for Computing Machinery, New York, NY, USA, 521–530.
- Kazlouski et al. (2022) Andrei Kazlouski, Thomas Marchioro, and Evangelos Markatos. 2022. What your Fitbit Says about You: De-anonymizing Users in Lifelogging Datasets. In Proceedings of the 18th International Conference on Security and Cryptography - SECRYPT. SciTePress, Setubal, Portugal, 806–811.
- Kim et al. (2016) Young-Ho Kim, Jae Ho Jeon, Eun Kyoung Choe, Bongshin Lee, KwonHyun Kim, and Jinwook Seo. 2016. TimeAware: Leveraging framing effects to enhance personal productivity. In Proceedings of the 2016 CHI Conference on Human Factors in Computing Systems. Association for Computing Machinery, New York, NY, USA, 272–283.
- Kusner et al. (2017) Matt J Kusner, Joshua Loftus, Chris Russell, and Ricardo Silva. 2017. Counterfactual fairness. Advances in Neural Information Processing Systems 30 (2017).
- Larrazabal et al. (2020) Agostina J Larrazabal, Nicolás Nieto, Victoria Peterson, Diego H Milone, and Enzo Ferrante. 2020. Gender imbalance in medical imaging datasets produces biased classifiers for computer-aided diagnosis. Proceedings of the National Academy of Sciences 117, 23 (2020), 12592–12594.
- Leonhardt et al. (2018) Jurek Leonhardt, Avishek Anand, and Megha Khosla. 2018. User fairness in recommender systems. In Companion Proceedings of the The Web Conference 2018. Association for Computing Machinery, New York, NY, United States, 101–102.
- Li et al. (2010) Ian Li, Anind Dey, and Jodi Forlizzi. 2010. A stage-based model of personal informatics systems. In Proceedings of the SIGCHI conference on human factors in computing systems. Association for Computing Machinery, New York, NY, USA, 557–566.
- Lopez-Martinez and Picard (2017) Daniel Lopez-Martinez and Rosalind Picard. 2017. Multi-task neural networks for personalized pain recognition from physiological signals. In 2017 Seventh International Conference on Affective Computing and Intelligent Interaction Workshops and Demos (ACIIW). IEEE, IEEE, New York, NY, United States, 181–184.
- Lupton (2014) Deborah Lupton. 2014. Self-tracking cultures: towards a sociology of personal informatics. In Proceedings of the 26th Australian computer-human interaction conference on designing futures: The future of design. 77–86.
- Mamykina et al. (2015) Lena Mamykina, Arlene M Smaldone, and Suzanne R Bakken. 2015. Adopting the sensemaking perspective for chronic disease self-management. Journal of biomedical informatics 56 (2015), 406–417.
- Mehrabi et al. (2021) Ninareh Mehrabi, Fred Morstatter, Nripsuta Saxena, Kristina Lerman, and Aram Galstyan. 2021. A survey on bias and fairness in machine learning. ACM Computing Surveys (CSUR) 54, 6 (2021), 1–35.
- Meng et al. (2021) Chuizheng Meng, Loc Trinh, Nan Xu, and Yan Liu. 2021. Mimic-if: Interpretability and fairness evaluation of deep learning models on mimic-iv dataset. Technical Report. arXiv preprint 2102.06761.
- Mohammed (2021) Amina Mohammed. 2021. With Almost Half of World’s Population Still Offline, Digital Divide Risks Becoming ‘New Face of Inequality,’Deputy Secretary-General Warns General Assembly.
- Mulligan et al. (2019) Deirdre K Mulligan, Joshua A Kroll, Nitin Kohli, and Richmond Y Wong. 2019. This thing called fairness: Disciplinary confusion realizing a value in technology. Proceedings of the ACM on Human-Computer Interaction 3, CSCW (2019), 1–36.
- Obermeyer et al. (2019) Ziad Obermeyer, Brian Powers, Christine Vogeli, and Sendhil Mullainathan. 2019. Dissecting racial bias in an algorithm used to manage the health of populations. Science 366, 6464 (2019), 447–453.
- of Health et al. (2020) US Department of Health, Human Services, et al. 2020. National diabetes statistics report, 2020.
- Organization (2019) World Health Organization. 2019. Global action plan on physical activity 2018-2030: more active people for a healthier world. World Health Organization, Geneva, Switzerland.
- Organization et al. (2010) World Health Organization et al. 2010. Global recommendations on physical activity for health. World Health Organization, Geneva, Switzerland.
- Parikh et al. (2019) Ravi B Parikh, Stephanie Teeple, and Amol S Navathe. 2019. Addressing bias in artificial intelligence in health care. Jama 322, 24 (2019), 2377–2378.
- Paviglianiti and Pasero (2020) Annunziata Paviglianiti and Eros Pasero. 2020. VITAL-ECG: a de-bias algorithm embedded in a gender-immune device. In 2020 IEEE International Workshop on Metrology for Industry 4.0 & IoT. IEEE, IEEE, New York, NY, United States, 314–318.
- Pedreshi et al. (2008) Dino Pedreshi, Salvatore Ruggieri, and Franco Turini. 2008. Discrimination-aware data mining. In Proceedings of the 14th ACM SIGKDD international conference on Knowledge discovery and data mining. Association for Computing Machinery, New York, NY, United States, 560–568.
- Pessach and Shmueli (2022) Dana Pessach and Erez Shmueli. 2022. A Review on Fairness in Machine Learning. ACM Computing Surveys (CSUR) 55, 3 (2022), 1–44.
- Röösli et al. (2022) Eliane Röösli, Selen Bozkurt, and Tina Hernandez-Boussard. 2022. Peeking into a black box, the fairness and generalizability of a MIMIC-III benchmarking model. Scientific Data 9, 1 (2022), 1–13.
- Rudovic et al. (2017) Ognjen Rudovic, Jaeryoung Lee, Lea Mascarell-Maricic, Björn W Schuller, and Rosalind W Picard. 2017. Measuring engagement in robot-assisted autism therapy: a cross-cultural study. Frontiers in Robotics and AI 4 (2017), 36.
- Rudovic et al. (2018) Ognjen Rudovic, Yuria Utsumi, Jaeryoung Lee, Javier Hernandez, Eduardo Castelló Ferrer, Björn Schuller, and Rosalind W Picard. 2018. CultureNet: a deep learning approach for engagement intensity estimation from face images of children with autism. In 2018 IEEE/RSJ International Conference on Intelligent Robots and Systems (IROS). IEEE, IEEE, New York, NY, United States, 339–346.
- Saleiro et al. (2018) Pedro Saleiro, Benedict Kuester, Loren Hinkson, Jesse London, Abby Stevens, Ari Anisfeld, Kit T Rodolfa, and Rayid Ghani. 2018. Aequitas: A bias and fairness audit toolkit. Technical Report. arXiv preprint 1811.05577.
- Selbst et al. (2019) Andrew D Selbst, Danah Boyd, Sorelle A Friedler, Suresh Venkatasubramanian, and Janet Vertesi. 2019. Fairness and abstraction in sociotechnical systems. In Proceedings of the conference on fairness, accountability, and transparency. Association for Computing Machinery, New York, NY, USA, 59–68.
- Shi et al. (2022) Zhonghao Shi, Thomas R Groechel, Shomik Jain, Kourtney Chima, Ognjen Rudovic, and Maja J Matarić. 2022. Toward Personalized Affect-Aware Socially Assistive Robot Tutors for Long-Term Interventions with Children with Autism. ACM Transactions on Human-Robot Interaction (THRI) 11, 4 (2022), 1–28.
- Sjoding et al. (2020) Michael W Sjoding, Robert P Dickson, Theodore J Iwashyna, Steven E Gay, and Thomas S Valley. 2020. Racial bias in pulse oximetry measurement. New England Journal of Medicine 383, 25 (2020), 2477–2478.
- Spathis et al. (2021) Dimitris Spathis, Ignacio Perez-Pozuelo, Soren Brage, Nicholas J. Wareham, and Cecilia Mascolo. 2021. Self-Supervised Transfer Learning of Physiological Representations from Free-Living Wearable Data. In Proceedings of the Conference on Health, Inference, and Learning (Virtual Event, USA) (CHIL ’21). Association for Computing Machinery, New York, NY, USA, 69–78. https://doi.org/10.1145/3450439.3451863
- Statista (2022) Statista. 2022. Global connected wearable devices 2016-2022 — Statista — statista.com. https://www.statista.com/statistics/487291/global-connected-wearable-devices/. [Accessed 14-Nov-2022].
- Sucerquia et al. (2017) Angela Sucerquia, José David López, and Jesús Francisco Vargas-Bonilla. 2017. SisFall: A fall and movement dataset. Sensors 17, 1 (2017), 198.
- Suresh and Guttag (2021) Harini Suresh and John Guttag. 2021. A framework for understanding sources of harm throughout the machine learning life cycle. In Equity and access in algorithms, mechanisms, and optimization. Association for Computing Machinery, New York, NY, United States, 1–9.
- Taylor et al. (2017) Sara Taylor, Natasha Jaques, Ehimwenma Nosakhare, Akane Sano, and Rosalind Picard. 2017. Personalized multitask learning for predicting tomorrow’s mood, stress, and health. IEEE Transactions on Affective Computing 11, 2 (2017), 200–213.
- Team (2022) Oura Team. 2022. New to Oura: Blood Oxygen Sensing (SpO2) — ouraring.com. https://ouraring.com/blog/blood-oxygen-sensing-spo2/. [Accessed 14-Nov-2022].
- Theis et al. (2021) Kristina A Theis, Louise B Murphy, Dana Guglielmo, Michael A Boring, Catherine A Okoro, Lindsey M Duca, and Charles G Helmick. 2021. Prevalence of Arthritis and Arthritis-Attributable Activity Limitation—United States, 2016–2018. Morbidity and Mortality Weekly Report 70, 40 (2021), 1401.
- Tsao et al. (2022) Connie W Tsao, Aaron W Aday, Zaid I Almarzooq, Alvaro Alonso, Andrea Z Beaton, Marcio S Bittencourt, Amelia K Boehme, Alfred E Buxton, April P Carson, Yvonne Commodore-Mensah, et al. 2022. Heart disease and stroke statistics—2022 update: a report from the American Heart Association. Circulation 145, 8 (2022), e153–e639.
- Vaizman et al. (2018) Yonatan Vaizman, Katherine Ellis, Gert Lanckriet, and Nadir Weibel. 2018. Extrasensory app: Data collection in-the-wild with rich user interface to self-report behavior. In Proceedings of the 2018 CHI conference on human factors in computing systems. Association for Computing Machinery, New York, NY, USA, 1–12.
- van Breugel et al. (2021) Boris van Breugel, Trent Kyono, Jeroen Berrevoets, and Mihaela van der Schaar. 2021. Decaf: Generating fair synthetic data using causally-aware generative networks. Advances in Neural Information Processing Systems 34 (2021), 22221–22233.
- Van Ryn et al. (2006) Michelle Van Ryn, Diana Burgess, Jennifer Malat, and Joan Griffin. 2006. Physicians’ perceptions of patients’ social and behavioral characteristics and race disparities in treatment recommendations for men with coronary artery disease. American journal of public health 96, 2 (2006), 351–357.
- Vasdekis et al. (2022) Dimitrios Vasdekis, Sofia Yfantidou, Stefanos Efstathiou, and Athena Vakali. 2022. WeMoD: A Machine Learning Approach for Wearable and Mobile Physical Activity Prediction. In 2022 IEEE International Conference on Pervasive Computing and Communications Workshops and other Affiliated Events (PerCom Workshops). IEEE, IEEE, New York, NY, United States, 385–390.
- Veerabhadrappa et al. (2018) Praveen Veerabhadrappa, Matthew Duffy Moran, Mitchell D Renninger, Matthew B Rhudy, Scott B Dreisbach, and Kristin M Gift. 2018. Tracking steps on apple watch at different walking speeds. Journal of general internal medicine 33, 6 (2018), 795–796.
- Verma and Rubin (2018) Sahil Verma and Julia Rubin. 2018. Fairness definitions explained. In 2018 IEEE/ACM International Workshop on Software Fairness (FairWare). IEEE, IEEE, New York, NY, United States, 1–7.
- Wang et al. (2020b) Guang Wang, Yongfeng Zhang, Zhihan Fang, Shuai Wang, Fan Zhang, and Desheng Zhang. 2020b. FairCharge: A data-driven fairness-aware charging recommendation system for large-scale electric taxi fleets. Proceedings of the ACM on Interactive, Mobile, Wearable and Ubiquitous Technologies 4, 1 (2020), 1–25.
- Wang et al. (2014) Rui Wang, Fanglin Chen, Zhenyu Chen, Tianxing Li, Gabriella Harari, Stefanie Tignor, Xia Zhou, Dror Ben-Zeev, and Andrew T Campbell. 2014. StudentLife: assessing mental health, academic performance and behavioral trends of college students using smartphones. In Proceedings of the 2014 ACM international joint conference on pervasive and ubiquitous computing. Association for Computing Machinery, New York, NY, United States, 3–14.
- Wang et al. (2022) Yifan Wang, Weizhi Ma, Min Zhang*, Yiqun Liu, and Shaoping Ma. 2022. A survey on the fairness of recommender systems. ACM Journal of the ACM (JACM) 111 (2022), 1–43.
- Wang et al. (2020a) Zeyu Wang, Klint Qinami, Ioannis Christos Karakozis, Kyle Genova, Prem Nair, Kenji Hata, and Olga Russakovsky. 2020a. Towards fairness in visual recognition: Effective strategies for bias mitigation. In Proceedings of the IEEE/CVF conference on computer vision and pattern recognition. IEEE, New York, NY, United States, 8919–8928.
- WHO (2012) WHO. 2012. Report of the Formal Meeting of Member States to Conclude the Work on the Comprehensive Global Monitoring Framework, Including Indicators, and a Set of Voluntary Global Targets for the Prevention and Control of Non-Communicable Diseases.
- Xu et al. (2023) Xuhai Xu, Xin Liu, Han Zhang, Weichen Wang, Subigya Nepal, Yasaman Sefidgar, Woosuk Seo, Kevin S Kuehn, Jeremy F Huckins, Margaret E Morris, et al. 2023. GLOBEM: Cross-Dataset Generalization of Longitudinal Human Behavior Modeling. Proceedings of the ACM on Interactive, Mobile, Wearable and Ubiquitous Technologies 6, 4 (2023), 1–34.
- Yeom and Tschantz (2021) Samuel Yeom and Michael Carl Tschantz. 2021. Avoiding disparity amplification under different worldviews. In Proceedings of the 2021 ACM Conference on Fairness, Accountability, and Transparency. Association for Computing Machinery, New York, NY, USA, 273–283.
- Yfantidou et al. (2023) Sofia Yfantidou, Marios Constantinides, Dimitris Spathis, Athena Vakali, Daniele Quercia, and Fahim Kawsar. 2023. Beyond Accuracy: A Critical Review of Fairness in Machine Learning for Mobile and Wearable Computing. Technical Report. arXiv preprint 2303.15585.
- Zhang et al. (2018) Guo-Qiang Zhang, Licong Cui, Remo Mueller, Shiqiang Tao, Matthew Kim, Michael Rueschman, Sara Mariani, Daniel Mobley, and Susan Redline. 2018. The National Sleep Research Resource: towards a sleep data commons. Journal of the American Medical Informatics Association 25, 10 (2018), 1351–1358.
- Zhang et al. (2020) Haoran Zhang, Amy X Lu, Mohamed Abdalla, Matthew McDermott, and Marzyeh Ghassemi. 2020. Hurtful words: quantifying biases in clinical contextual word embeddings. In proceedings of the ACM Conference on Health, Inference, and Learning. Association for Computing Machinery, New York, NY, United States, 110–120.
Appendix A Model Architectures
Baseline Model. For our baseline model, we consider the following setting: we are given a time-series dataset of users segmented into two groups, and , based on protected attribute (e.g., gender, age, etc.). The user data within each group are denoted as , where and K is the number of users per group, conditioned on protected attribute . Furthermore, the data of each user are stored as , where input time series (step count values) of users , are stored in , where (unaware model) is the length (in time steps) of a sample daily activity in the data, or (aware model) is the length of a sample daily activity in the data plus the protected attribute features. Formally, our deep neural network architecture receives as input the users’ daily activity samples () and passes them through LSTM layers with parameters , weight matrix, and bias, respectively, for each layer , to produce the output . The optimization of the network parameters for LSTM layers is obtained by minimizing the binary cross entropy loss defined as:
where represents the number of training samples from both datasets .
Personalized Model. For our personalized model, formally, the learning during the fine-tuning process is attained through the last layer in the network, one for the minority and one for the majority user group. Before further optimization, the group-specific layers are initialized as and , and then fine-tuned using the data from () and (), respectively, for each protected attribute as:
The final network weights, , are then used to perform the group-specific inference of next-day physical activity level from past behavior per protected attribute.
Appendix B Fairness Taxonomy in Machine Learning
Viewed through the lens of quantitative science, ML research has broadly grouped fairness into two categories: individual fairness and group fairness. In the broad sense, group fairness partitions the general population into groups based on sensitive (a.k.a. protected) attributes and seeks statistical equality across groups. On the other hand, individual fairness seeks for similar individuals to be treated similarly (Dwork et al., 2012; Mulligan et al., 2019).
In individual fairness, determining whether individuals are similar requires first defining what features are relevant to fairness (Fleisher, 2021). However, in PI, it would be incomplete to define such similarity solely based on digital behavioral biomarkers, such as steps, or heart rate, as hidden contextual information might be significantly more relevant. To this end, we proceed with group fairness from now on. This decision translates to our use case as exploring significant differences in allocation, representation, or error rates regarding future step goals across different population segments. For example, do females get systematically lower step goals than males?
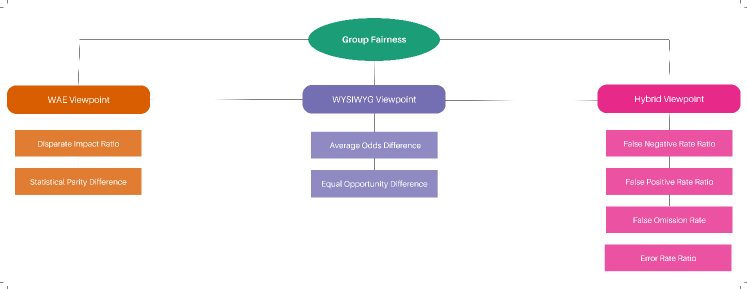
Within group fairness, there are still two opposing viewpoints: we’re all equal (WAE) and what you see is what you get (WYSIWYG) (Friedler et al., 2021; Yeom and Tschantz, 2021). The WAE viewpoint considers that all groups have similar abilities to perform the task, e.g., all groups of people are equally capable of walking more, while the WYSIWYG viewpoint holds that the data reflect each group’s ability to perform the task, e.g., some groups of people might be less capable.
| True | ||||||||||
| Positive Label | Negative Label | |||||||||
| Predicted | Positive Label | TP | FP |
|
||||||
| Negative Label | FN | TN |
|
|||||||
|
|
|||||||||
|
|
|||||||||
Overall, every metric tries to quantify the difference in performance between privileged and unprivileged users. Here, we present the most common fairness metrics across all viewpoints, namely WAE, WYSIWYG, and hybrid (Figure 14). The confusion matrix (see Table 3) is the heart of ML performance measurement and is also used in the fairness metrics definitions below. All metrics are expressed as ratios or differences between unprivileged (u) and privileged (p) groups. Note that is the user sample, is the predicted label, and “pos_label” is the favorable outcome scenario (e.g., high physical activity).
WAE Metrics. The WAE viewpoint supports that data, e.g., step counts, may contain biases, so the distribution differences across groups should not be mistaken for a difference in ability. The two most commonly used WAE metrics are the Disparate Impact Ratio (DIR) and the Statistical Parity Difference (SPD) (Table 4).
| Metric | Definition | Formula | Task Interpretation | Bias Interpretation |
|---|---|---|---|---|
| DIR | The ratio of base or selection rates between unprivileged and privileged groups. | How many users receive high activity goals in the unprivileged group compared to the privileged group? | A low () indicates that the unprivileged user group systematically receives fewer high activity goals. | |
| SPD | The difference in selection rates between unprivileged and privileged groups. | Same as above | A low () indicates that the unprivileged user group systematically receives fewer high activity goals. |
Hybrid Metrics. Hybrid metrics lie in-between the two viewpoints. The most commonly used hybrid metrics, depending on the problem’s context, are the False Positive Rate (FPR) Ratio, the False Negative Rate (FNR) Ratio, the False Omission Rate (FOR) Ratio, and the Error Rate Ratio (ERR) (Table 5).
| Metric | Definition | Formula | Task Interpretation | Bias Interpretation |
|---|---|---|---|---|
| FPR Ratio | The ratio between the number of negative outcomes wrongly categorized as positive, i.e., false positives (FP), and the total number of actual negative outcomes regardless of classification. | From all the low active users, how many wrongfully received high activity goals? | A low Ratio () indicates that the privileged low active user group systematically receives more high activity goals compared to the unprivileged low active user group. | |
| FNR Ratio | The ratio between the number of positive outcomes wrongly categorized as negative, i.e., false negatives (FN), and the total number of actual positive outcomes regardless of classification. | From all the highly active users, how many wrongfully received low activity goals? | A high Ratio () indicates that the unprivileged highly active user group systematically receives more low activity goals compared to the privileged highly active user group. | |
| FOR Ratio | The ratio between the outcomes wrongly categorized as negative, i.e., FN, and the total number of classified negative outcomes. | From all the users that were given low activity goals -rightfully so or not-, how many were actually highly active? | A high Ratio () indicates that the unprivileged user group systematically receives more wrong low activity goals compared to the privileged user group. | |
| ERR | The ratio between the erroneous outcomes, i.e., FN or FP, and the total number of outcomes. | How many times was the activity level prediction wrong? | A high () indicates that the unprivileged user group systematically receives more wrong goals -low or high- compared to the privileged user group. |
WYSIWYG Metrics. The WYSIWYG viewpoint supports that data correlates well with future behavior and that they can be used to compare the users’ abilities. The two most commonly used WAE metrics are the Average Odds Difference (AOD) and the Equal Opportunity Difference (EOD).
| Metric | Definition | Formula | Task Interpretation | Bias Interpretation |
|---|---|---|---|---|
| EOD | The difference of true positive rates between the unprivileged and the privileged groups. | From all the highly active users, how many were actually given high activity goals? | A low () indicates that the unprivileged highly active user group systematically receives fewer high activity goals compared to the privileged highly active user group. | |
| AOD | The average difference between the FPR and the TPR between unprivileged and privileged groups. | TBD | TBD |
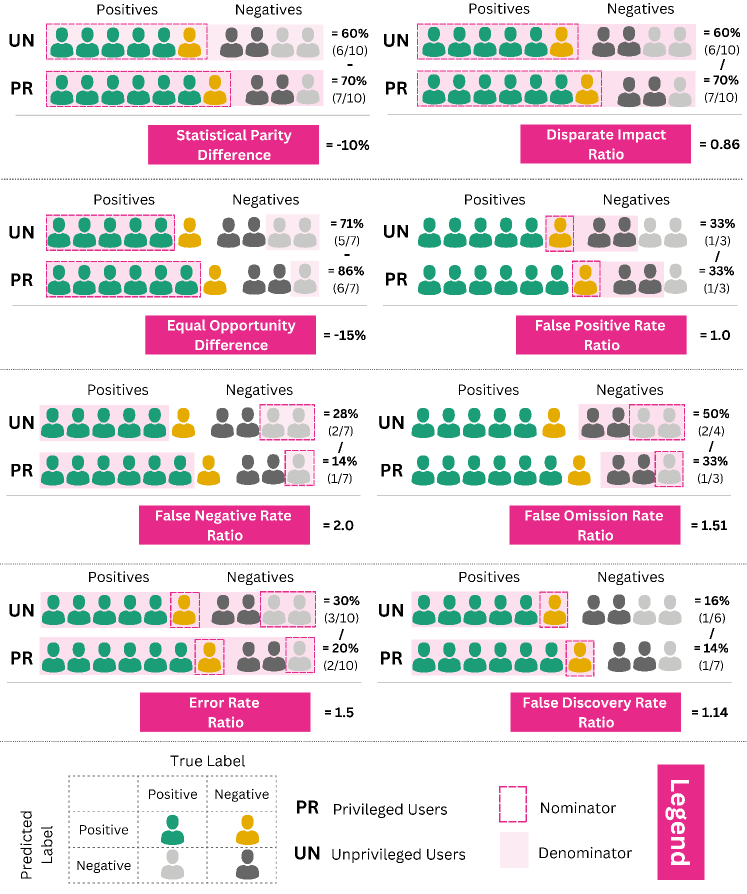
Fairness Metrics’ Value Ranges. Figure 15 gives a graphical overview of all fairness metrics discussed. We notice that difference-based metrics have a different range of values compared to ratio-based metrics. Specifically, difference-based metrics are within the range, while ratio-based metrics are within the range. For both categories, a value of 1.0 is optimal, indicating demographic parity. Anything greater or less than the optimal value indicates some level of bias. According to AIF360, accepted difference-based metrics’ values are within the range , and accepted ratio-based metrics’ values are within [0.8,1.25], but such ranges are not universally accepted and might be adjusted on a task-by-task basis. Table 7(a) indicates which user group, namely privileged or unprivileged, benefits based on a group fairness metric’s value.
| Value () | |||
|---|---|---|---|
| Metric | |||
| DIR | UN | UN PR | PR |
| FOR | PR | UN PR | UN |
| FNR | PR | UN PR | UN |
| FPR | UN | UN PR | PR |
| ERR | PR | UN PR | UN |
| Value () | |||
|---|---|---|---|
| Metric | |||
| SPD | UN | UN PR | PR |
| EOD | UN | UN PR | PR |
| AOD | UN | UN PR | PR |