Optical transitions of a single nodal ring in SrAs3: radially and axially resolved characterization
Abstract
SrAs3 is a unique nodal-line semimetal that contains only a single nodal ring in the Brillouin zone, uninterrupted by any trivial bands near the Fermi energy. We performed axis-resolved optical reflection measurements on SrAs3 and observed that the optical conductivity exhibits flat absorption up to 129 meV in both the radial and axial directions, confirming the robustness of the universal power-law behavior of the nodal ring. Furthermore, in conjunction with model and first-principles calculations, the axis-resolved optical conductivity unveiled fundamental properties beyond the flat absorption, including the overlap energy of the topological bands, the spin-orbit coupling gap along the nodal ring, and the geometric properties of the nodal ring such as the average ring radius, ring ellipticity, and velocity anisotropy. In addition, our temperature-dependent measurements revealed a spectral weight transfer between intraband and interband transitions, indicating a possible violation of the optical sum rule within the measured energy range.
Topological semimetals, a class of novel quantum materials characterized by symmetry-protected band contact or crossing, have received significant attention in recent years due to their unique fundamental properties and potential for device applications [1, 2]. Nodal-line semimetals (NLSMs) are a type of topological semimetals that have two energy bands crossing over a continuous line in the -space [3, 4, 5, 6, 7]. The exotic quasiparticle excitations and rich topological properties of NLSMs, including the non-trivial Berry phase around the nodal line, give rise to various intriguing phenomena such as anomalous transverse current [8], weak localization [9], and correlation effect [10, 11].
Optical conductivity measurements serve as a powerful tool in the study of NLSMs for probing the intricate low-energy electronic band structures of materials since they provide direct access to states close to the Fermi energy . In NLSMs, the interband transition between two bands forming the nodal line is predicted to exhibit a distinct power-law behavior of the real part of the optical conductivity, with the effective dimension , which leads to the flat optical conductivity regardless of the band dispersion power [12, 13, 14, 15, 16].
However, experimentally, most optical studies of NLSMs face challenges that hinder an in-depth investigation. Firstly, numerous real materials exhibit multiple nodal lines instead of a single one in the Brillouin zone (BZ). These nodal lines take the form of open nodal lines [17, 18, 11], rectangular- [19, 20, 21] or irregular-shaped [22, 23] cages, which often become entangled into complicated manifolds, adding complexity to the analysis. Secondly, in most real materials, topologically trivial bands coexist at the alongside the nodal line. These trivial bands create their own intra- and interband transitions that seriously obscure the optical signal from the non-trivial band [19, 21, 24, 25, 26, 22], making it difficult to investigate the genuine properties of the nodal line. Due to these two challenges, the majority of optical experiments have been limited to demonstrating the presence of the flat conductivity [18, 11, 19, 27, 20, 21, 28]. To advance the study of NLSMs beyond the flat conductivity, real materials with a simple nodal line and no trivial bands are highly desired.
In this work, we perform optical measurements on , a rare example that features a single, isolated (doubly degenerate) nodal ring in the BZ [29, 30, 31, 32]. Furthermore, remarkably, it possesses no interrupting trivial bands near but consists of only the non-trivial topological bands [29, 31, 33]. These outstanding properties of provide a unique opportunity for an in-depth investigation beyond the power-law behavior. Optical conductivities for both radial and axial directions of the nodal ring are measured across a various temperature range. The axis-resolved optical conductivity is combined with model and first-principles calculations, unveiling fundamental properties such as the overlap energy of the non-trivial bands, the spin-orbit coupling (SOC) that opens a gap along the nodal ring, the axis-dependent velocity anisotropy along with the average ring radius and ring ellipticity. In addition, our temperature-dependent measurements reveal an anomalous spectral weight transfer between the intraband and interband transitions.
A single crystal was synthesized and thoroughly characterized [32]. An axis-resolved optical measurement was performed using polarized light. The experimental details are described in the Supplemental Material (SM) Sec. I [34].
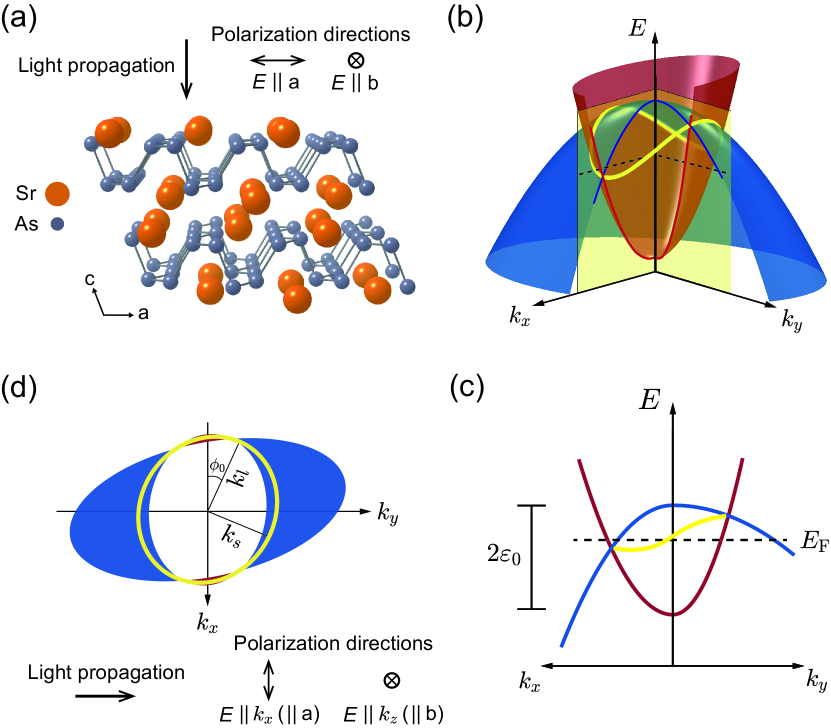
Figure 1 presents the crystal structure and electronic band structure of . The lattice of , which belongs to the space group, consists of As-planes separated by Sr atoms that are stacked along the -axis. Figure 1(b) displays the conduction and valence bands, which are both mainly from As orbitals, that intersect each other leading to the formation of a nodal ring. Figure 1(c), a simplified view of Fig. 1(b), shows that the two bands overlap by . They disperse asymmetrically along the and directions, causing the nodal ring to tilt. Figure 1(d) displays the nodal ring in -space. The ring is elliptically elongated and rotated on the - plane, as shown by ARPES and DFT studies [30, 29]. The two light polarizations, and , employed in our measurement probe the radial and axial directions of the nodal ring, respectively. (Here we refer to as the radial direction, even though the nodal ring is a rotated ellipse.) In , the SOC creates an energy gap along the nodal ring, which is intentionally omitted for clarity in Fig. 1. The Fermi energy and carrier density of our sample were precisely determined using quantum oscillation measurements as described in Ref. [32]. The indicated in Fig. 1(c) shows that the hole is dominant over the electron, where the actual carrier densities are = 4.2 cm-3 for the hole and = 6.9 cm-3 for the electron, measured from quantum transport [32] at = 5 K, respectively, which is schematically represented in the sizes of the blue (hole) and red (electron) pockets as well in Fig. 1(d).
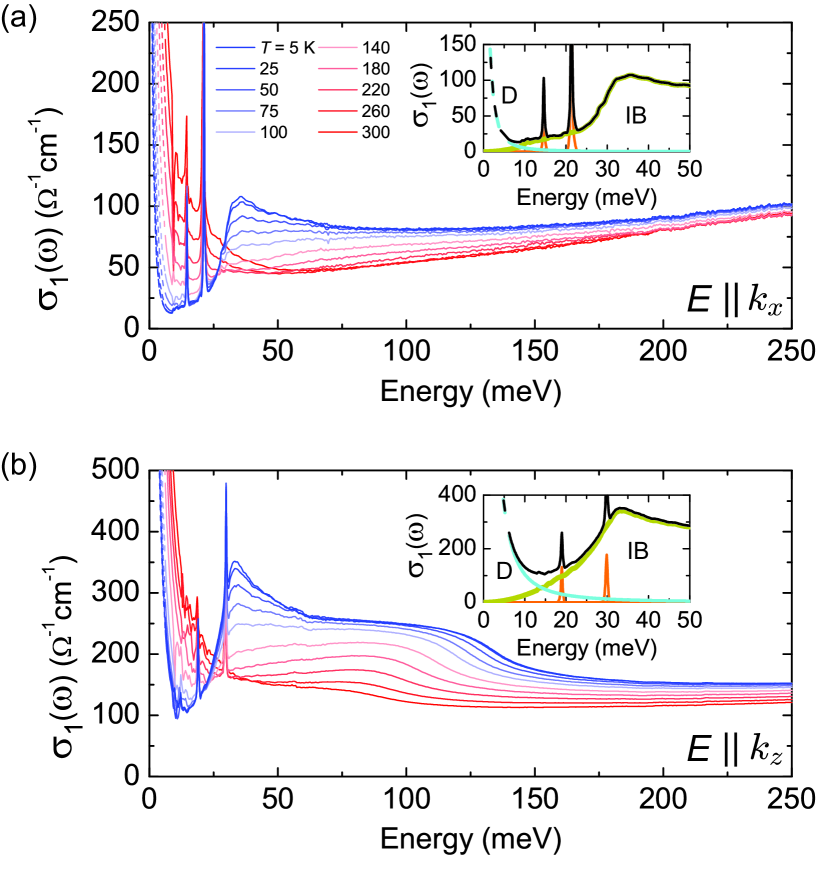
Figure 2 shows the optical conductivity for and for 5 K 300 K. They were obtained by fitting the reflectivity data using the Kramers-Kronig constrained variational dielectric functions of RefFit [42]. shows a good agreement with the transport conductivity at = 0 (see Fig. S3 in SM Sec. II [34]). The raw data are presented in SM Fig. S1 [34]. consists of a Drude peak at low energy and an interband transition in the high energy range, respectively. In addition, two sharp optical phonon peaks exist between the Drude and interband conductivities. For quantitative analysis, we decompose into three components through data fitting: Drude, phonon, and interband (IB) conductivities as . The details of the fitting analysis are presented in SM Sec. II [34].
In Fig. 3(a), we focus on the low temperature result taken at K. The Drude peak is described by , where and = 1/ are the plasma frequency and the carrier scattering rate, respectively. arises overwhelmingly from the hole carrier due to its dominance over the electron. Using the fitting results for () and (), summarized in SM Table S1 [34], we obtain / = 8.7 which, from the definition of = ( = hole density, = effective mass), is equivalent to /. It shows that the effective mass of the hole is substantially lighter along the Sr-chain (-axis) than along the Sr-zigzag direction (-axis), similar to black phosphorus [43]. By inserting the hole density obtained from transport measurement into , = 0.017 and = 0.148 are obtained. Furthermore, by using = 1/ and , we calculate the carrier mobility to be = 3.9 and = 2.1 , respectively, which are similar to the transport results [44, 45]. The high ’s support the suppressed back-scattering of the topological bands of .
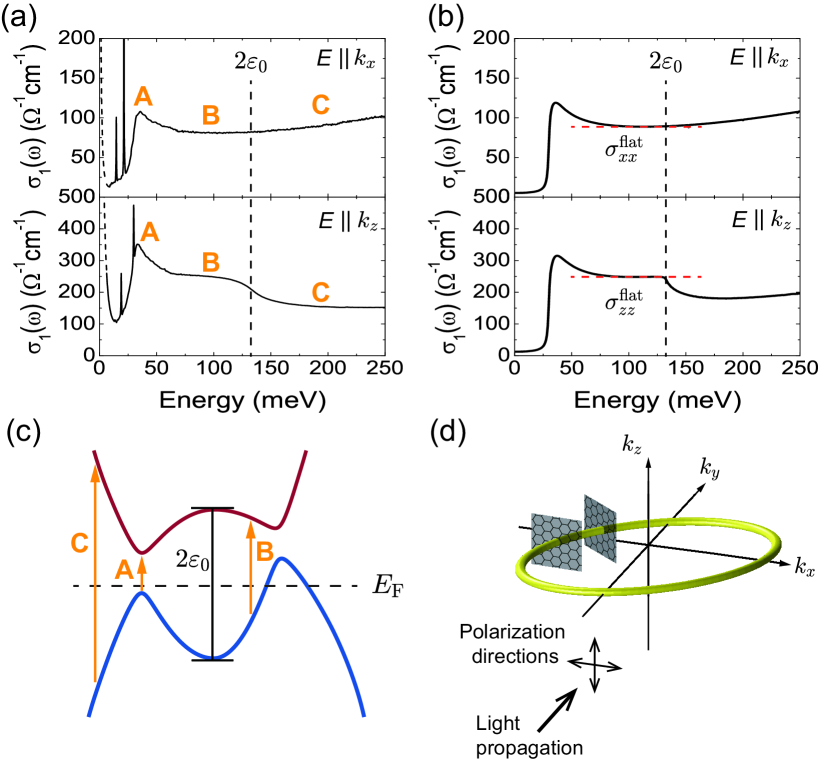
Next, we investigate the interband conductivity . For , displays an absorption peak (A) at 30 meV and a flat conductivity (B) over the 70 - 129 meV range. At higher energies, gradually increases (C) with energy. For , the flat optical conductivity is significantly enhanced over for . In the region C, drops markedly for around meV in contrast to the increase for . To understand the behaviors of A, B, and C both qualitatively and quantitatively, we perform a theoretical calculation using a four-band model Hamiltonian that takes into account the two crossing bands of the nodal ring including their spin degrees of freedom:
| (1) |
where , , , and is the wave vector measured from the Y point in the BZ, and and are Pauli matrices acting on the pseudospin and spin degrees of freedom, respectively. is the strength of the SOC, which, as a leading approximation, we take as constant. Here the coefficients , , (, , , ), and are obtained from first-principles calculations. For the band overlap energy 2 and SOC , which are difficult to estimate correctly from first-principles calculations, we determine them by comparing with the optical data (see SM Sec. III [34]). Then we calculate the interband conductivity using the Kubo formula. The full numerical results of are presented in Fig. 3(b).
To gain some insight into the optical features, we adopt a simple picture that the nodal ring is considered as a collection of gapped anisotropic graphene sheets, as shown in Fig. 3(d). In this picture, the Hamiltonian in Eq. (1) at low frequencies can be transformed into [34]
Here are the polar coordinates of , and are wave vectors measured from the nodal ring along the radial and directions, respectively, and and are the corresponding Fermi velocities along the two directions. Note that has an angular dependence, while is constant. is the energy tilt term and acts as a mass term opening an energy gap.
Then the optical conductivity of the nodal ring can be obtained by summing up all the contributions from each gapped anisotropic graphene sheet along the nodal ring as
| (3) |
where , , are spatial directions, is the optical conductivity of the gapped anisotropic graphene, is the characteristic scale of the nodal ring size which will be defined later, and are geometric factors related to the shape of the nodal ring (see SM Sec. IV [34]).
The optical conductivity for the Hamiltonian in Eq. (Optical transitions of a single nodal ring in SrAs3: radially and axially resolved characterization) at zero temperature in the clean limit is then given by [34]
| (4) |
Here, is the flat optical conductivity which will be discussed in Eq. (5), the term inside the square bracket represents the effect of SOC, and is the Heaviside step function. The result in Eq. (4) shows that, at the onset of interband transitions, the SOC-induced optical peak appears at in both and , and therefore the peak position defines the magnitude of the SOC gap.
In obtaining Eq. (4), we use the fact that of lies within the SOC gap for at least a certain range of angle, as shown in Fig. 3(c), giving a peak corresponding to the gap size. Note that Eq. (4) is an approximate form neglecting the effect of the energy tilt term. For details, see SM Sec. IV [34].
Based on the experimental data in Fig. 3(a), we estimate 2 meV. The SOC gap is one of the key factors that determines the band structure of NLSMs but has seldom been measured precisely due to its small magnitude. We emphasize that the high energy resolution of IR spectroscopy, in combination with the successful theoretical analysis, allows for the reliable determination of .
As frequency increases, the optical conductivity approaches in Eq. (4). This can be obtained analytically as [34]
| (5a) | ||||
| (5b) | ||||
where and are the lengths of the semi-major and semi-minor axes of the nodal ring, , , is the angle between the semi-major axis of the nodal ring and the axis, is the band degeneracy factor. From , , , , and [34], and are estimated to be 78 and 247 , respectively, showing good agreement with the experimental result.
It should be noted that for a given nodal ring size (), depends on how much the nodal ring is elongated and rotated, taking into account the mixing between the semi-major and semi-minor directions, while does not depend on the nodal ring shape and the rotation angle. For a circular nodal ring () with equal velocity , Eq. (5) reduces to consistent with the previous result [16].
Having investigated the SOC-induced peak (A) and the flat conductivity (B), we move to the region C. For 129 meV, the flat conductivity is no longer maintained and increases gradually while shows a sudden drop, indicating that the picture we employed in Eq. (2) does not hold any more at high frequencies [16, 15]. At , the joint density of states for interband transitions shows an abrupt change. Above this frequency, the optical conductivity exhibits a non-trivial frequency-dependence depending on the direction due to the difference in the velocity matrix elements along the and directions. Remarkably, our analytic estimation for the flat conductivity using Eq. (5) and the full numerical calculation using the Kubo formula over a wide frequency range are in excellent agreement with the experiment not only qualitatively but also quantitatively.
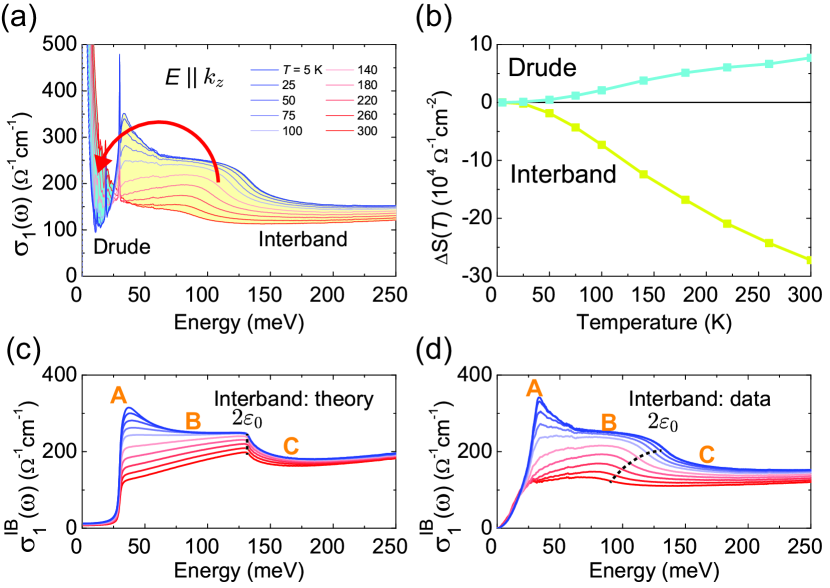
We now move on to the -dependent characteristics of . Figure 4(a) illustrates that with increasing temperature, the Drude peak becomes broader and gains spectral weight while the interband transition decreases and loses spectral weight. This redistribution of spectral weight can be understood through two factors. Firstly, the thermal population of electrons in the conduction band (CB) and holes in the valence bands (VB) leads to a broadening of the Fermi-Dirac distribution. Secondly, the shift in chemical potential resulting from density conservation reduces the regions where interband transitions are allowed (See SM Sec. IV-2, V [34]). These two factors collectively contribute to the enhancement of the Drude weight and the suppression of interband transitions. For quantitative analysis, we calculate the optical spectral weight of the Drude peak, and interband transition . In calculating , the cutoff frequency was taken to be 0.7 eV (see SM Sec II-3 [34]). In Fig. 4(b), we display the -driven changes of the spectral weight for the Drude peak and IB transition. We find 0 for the Drude and 0 for the IB, indicating that the optical spectral weight is transferred from the IB to the Drude with increasing temperature. One interesting observation is that is substantially larger than , as seen by comparing the two shaded spectral areas in Fig. 4(a). The non-conservation of the total spectral weight, + , seemingly violates the optical sum rule. Similar behavior was reported in other materials such as FeSi, YBa2Cu3Ox, La2-xSrxCuO4 [46, 47, 48]. The origin of their sum rule violation is poorly understood. The lost spectral weight is expected to be recovered in a frequency range not probed experimentally [46]. This notion indicates the necessity of expanding the optical measurement on beyond the energy ranges investigated in the present study.
For further analysis, we numerically calculated the -dependent by incorporating the thermal effect, i.e., the Fermi-Dirac distribution and -driven chemical potential shift in the Kubo formula (see SM Sec. V [34]). Both the theoretical and experimental results show consistently that decreases and becomes less distinct with increasing as shown in Figs. 4(c) and 4(d). However, there is a notable difference between the two: in the experimental data, shows a redshift of 2, while in the numerical results, 2 remains constant. This discrepancy suggests the presence of an additional factor beyond thermal population effects, possibly indicating a -driven evolution of the band structure not captured in the numerical calculations. However, at this stage, our understanding of this phenomenon is still limited. Further study is required to elucidate the exact nature of the -dependent .
To conclude, we performed the measurement of optical transitions on a nodal ring semimetal by adopting , a unique material that possesses only a single nodal ring in the BZ without any interrupting trivial bands. By combining model and first-principles calculations, our axis-resolved optical measurements revealed fundamental properties of NLSMs beyond the flat absorption, such as the SOC gap, the band overlap energy, and the intrinsic geometric features of the nodal ring. Our study demonstrates that originates exclusively from the single nodal ring, establishing as an ideal platform for investigating nodal rings in topological materials.
Acknowledgements.
This work was supported by the NRF grant funded by the Korea government (NRF-2021R1A2C1009073). J.J. was supported by Basic Science Research Program of Korea (NRF-2018R1A6A1A06024977). J.J. and H.M. were supported by the NRF grant funded by the Korea government (NRF-2018R1A2B6007837 and NRF-2023R1A2C1005996), the Creative-Pioneering Researchers Program through Seoul National University (SNU), and the Center for Theoretical Physics. H. K. and J. S. K. were supported by the Institute for Basic Science (IBS) through the Center for Artificial Low Dimensional Electronic Systems (no. IBS-R014-D1), and by the NRF through the Basic Science Research Program (2022R1A2C3009731), and the Max Planck POSTECH/Korea Research Initiative (2022M3H4A1A04074153). T.P. and J.S. were supported by the NRF grant funded by the Korea government (NRF-2021R1A2C2010972). The work at HYU was supported by the NRF grant funded by the Korean government (MSIT) (2022R1F1A1072865 and RS-2022-00143178) and BrainLink program funded by the Ministry of Science and ICT through the NRF (2022H1D3A3A01077468).References
- Lv et al. [2021] B. Q. Lv, T. Qian, and H. Ding, Rev. Mod. Phys. 93, 025002 (2021).
- Armitage et al. [2018] N. P. Armitage, E. J. Mele, and A. Vishwanath, Rev. Mod. Phys. 90, 015001 (2018).
- Burkov et al. [2011] A. A. Burkov, M. D. Hook, and L. Balents, Phys. Rev. B 84, 235126 (2011).
- Phillips and Aji [2014] M. Phillips and V. Aji, Phys. Rev. B 90, 115111 (2014).
- Fang et al. [2015] C. Fang, Y. Chen, H.-Y. Kee, and L. Fu, Phys. Rev. B 92, 081201(R) (2015).
- Chen et al. [2016] Y. Chen, H.-S. Kim, and H.-Y. Kee, Phys. Rev. B 93, 155140 (2016).
- Fang et al. [2016] C. Fang, H. Weng, X. Dai, and Z. Fang, Chin. Phys. B 25, 117106 (2016).
- Rui et al. [2018] W. B. Rui, Y. X. Zhao, and A. P. Schnyder, Phys. Rev. B 97, 161113(R) (2018).
- Chen et al. [2019] W. Chen, H.-Z. Lu, and O. Zilberberg, Phys. Rev. Lett. 122, 196603 (2019).
- Pezzini et al. [2018] S. Pezzini, M. R. van Delft, L. M. Schoop, B. V. Lotsch, A. Carrington, M. I. Katsnelson, N. E. Hussey, and S. Wiedmann, Nat. Phys. 14, 178 (2018).
- Shao et al. [2020] Y. Shao, A. N. Rudenko, J. Hu, Z. Sun, Y. Zhu, S. Moon, A. J. Millis, S. Yuan, A. I. Lichtenstein, D. Smirnov, Z. Q. Mao, M. I. Katsnelson, and D. N. Basov, Nat. Phys. 16, 636 (2020).
- Bácsi and Virosztek [2013] A. Bácsi and A. Virosztek, Phys. Rev. B 87, 125425 (2013).
- Carbotte [2016] J. P. Carbotte, J. Phys. Condens. Matter 29, 045301 (2016).
- Mukherjee and Carbotte [2017] S. P. Mukherjee and J. P. Carbotte, Phys. Rev. B 95, 214203 (2017).
- Barati and Abedinpour [2017] S. Barati and S. H. Abedinpour, Phys. Rev. B 96, 155150 (2017).
- Ahn et al. [2017] S. Ahn, E. J. Mele, and H. Min, Phys. Rev. Lett. 119, 147402 (2017).
- Hu et al. [2016] J. Hu, Z. Tang, J. Liu, X. Liu, Y. Zhu, D. Graf, K. Myhro, S. Tran, C. N. Lau, J. Wei, and Z. Mao, Phys. Rev. Lett. 117, 016602 (2016).
- Schilling et al. [2017] M. B. Schilling, L. M. Schoop, B. V. Lotsch, M. Dressel, and A. V. Pronin, Phys. Rev. Lett. 119, 187401 (2017).
- Santos-Cottin et al. [2021] D. Santos-Cottin, M. Casula, L. de’ Medici, F. Le Mardelé, J. Wyzula, M. Orlita, Y. Klein, A. Gauzzi, A. Akrap, and R. P. S. M. Lobo, Phys. Rev. B 104, L201115 (2021).
- Li et al. [2023] R. S. Li, T. Zhang, W. Ma, S. X. Xu, Q. Wu, L. Yue, S. J. Zhang, Q. M. Liu, Z. X. Wang, T. C. Hu, X. Y. Zhou, D. Wu, T. Dong, S. Jia, H. Weng, and N. L. Wang, Phys. Rev. B 107, 045115 (2023).
- Shao et al. [2019] Y. Shao, Z. Sun, Y. Wang, C. Xu, R. Sankar, A. J. Breindel, C. Cao, M. M. Fogler, A. J. Millis, F. Chou, Z. Li, T. Timusk, M. B. Maple, and D. N. Basov, Proc. Natl. Acad. Sci. USA 116, 1168 (2019).
- Wang et al. [2021] Y. Wang, Y. Qian, M. Yang, H. Chen, C. Li, Z. Tan, Y. Cai, W. Zhao, S. Gao, Y. Feng, S. Kumar, E. F. Schwier, L. Zhao, H. Weng, Y. Shi, G. Wang, Y. Song, Y. Huang, K. Shimada, Z. Xu, X. J. Zhou, and G. Liu, Phys. Rev. B 103, 125131 (2021).
- Cao et al. [2022] L. Y. Cao, M. Yang, L. Wang, Y. Li, B. X. Gao, L. Wang, J. L. Liu, A. F. Fang, Y. G. Shi, and R. Y. Chen, Phys. Rev. B 106, 245145 (2022).
- Jin et al. [2019] L. Jin, X. Zhang, T. He, W. Meng, X. Dai, and G. Liu, J. Mater. Chem. C 7, 10694 (2019).
- Bian et al. [2016] G. Bian, T.-R. Chang, H. Zheng, S. Velury, S.-Y. Xu, T. Neupert, C.-K. Chiu, S.-M. Huang, D. S. Sanchez, I. Belopolski, N. Alidoust, P.-J. Chen, G. Chang, A. Bansil, H.-T. Jeng, H. Lin, and M. Z. Hasan, Phys. Rev. B 93, 121113(R) (2016).
- Feng et al. [2017] B. Feng, B. Fu, S. Kasamatsu, S. Ito, P. Cheng, C.-C. Liu, Y. Feng, S. Wu, S. K. Mahatha, P. Sheverdyaeva, P. Moras, M. Arita, O. Sugino, T.-C. Chiang, K. Shimada, K. Miyamoto, T. Okuda, K. Wu, L. Chen, Y. Yao, and I. Matsuda, Nat. Commun. 8, 1007 (2017).
- Qiu et al. [2019] Z. Qiu, C. Le, Z. Liao, B. Xu, R. Yang, J. Hu, Y. Dai, and X. Qiu, Phys. Rev. B 100, 125136 (2019).
- Ebad-Allah et al. [2022] J. Ebad-Allah, S. Rojewski, Y. L. Zhu, Z. Q. Mao, and C. A. Kuntscher, Phys. Rev. B 106, 075143 (2022).
- Xu et al. [2017] Q. Xu, R. Yu, Z. Fang, X. Dai, and H. Weng, Phys. Rev. B 95, 045136 (2017).
- Song et al. [2020] Y. K. Song, G. W. Wang, S. C. Li, W. L. Liu, X. L. Lu, Z. T. Liu, Z. J. Li, J. S. Wen, Z. P. Yin, Z. H. Liu, and D. W. Shen, Phys. Rev. Lett. 124, 056402 (2020).
- Hosen et al. [2020] M. M. Hosen, G. Dhakal, B. Wang, N. Poudel, K. Dimitri, F. Kabir, C. Sims, S. Regmi, K. Gofryk, D. Kaczorowski, A. Bansil, and M. Neupane, Sci. Rep. 10, 2776 (2020).
- Kim et al. [2022] H. Kim, J. M. Ok, S. Cha, B. G. Jang, C. I. Kwon, Y. Kohama, K. Kindo, W. J. Cho, E. S. Choi, Y. J. Jo, W. Kang, J. H. Shim, K. S. Kim, and J. S. Kim, Nat. Commun. 13, 7188 (2022).
- [33] H. Wang, Y.-X. Huang, H. Liu, X. Feng, J. Zhu, W. Wu, C. Xiao, and S. A. Yang, arXiv:2211.05978 (2022) .
- [34] See Supplemental Material for details of sample preparation and experimental methods, temperature-dependent reflectivity and optical conductivity, model and calculation methods, low-frequency asymptotic forms of the optical conductivity, and temperature dependence of the chemical potential, which include Refs. [16, 21, 29, 32, 35–41].
- Homes et al. [1993] C. C. Homes, M. Reedyk, D. A. Cradles, and T. Timusk, Appl. Opt. 32, 2976 (1993).
- Blaha et al. [2020] P. Blaha, K. Schwarz, F. Tran, R. Laskowski, G. K. H. Madsen, and L. D. Marks, J. Chem. Phys. 152, 074101 (2020).
- Tran and Blaha [2009] F. Tran and P. Blaha, Phys. Rev. Lett. 102, 226401 (2009).
- Togo and Tanaka [2015] A. Togo and I. Tanaka, Scr. Mater. 108, 1 (2015).
- Kresse and Furthmüller [1996] G. Kresse and J. Furthmüller, Phys. Rev. B 54, 11169 (1996).
- Quan et al. [2017] Y. Quan, Z. P. Yin, and W. E. Pickett, Phys. Rev. Lett. 118, 176402 (2017).
- [41] G. D. Mahan, Many-Particle Physics (Springer, New York, 2000).
- Kuzmenko [2005] A. B. Kuzmenko, Rev. Sci. Instrum. 76, 083108 (2005).
- ichiro Narita et al. [1983] S. ichiro Narita, S. ichi Terada, S. Mori, K. Muro, Y. Akahama, and S. Endo, J. Phys. Soc. Jpn. 52, 3544 (1983).
- Klar and Bauhofer [1994] P. J. Klar and W. Bauhofer, Phys. Rev. B 50, 5180 (1994).
- Bauhofer [1985] W. Bauhofer, Phys. Rev. B 32, 1183 (1985).
- Schlesinger et al. [1993] Z. Schlesinger, Z. Fisk, H.-T. Zhang, M. B. Maple, J. F. DiTusa, and G. Aeppli, Phys. Rev. Lett. 71, 1748 (1993).
- Basov et al. [2001] D. N. Basov, C. C. Homes, E. J. Singley, M. Strongin, T. Timusk, G. Blumberg, and D. van der Marel, Phys. Rev. B 63, 134514 (2001).
- Kuzmenko et al. [2003] A. B. Kuzmenko, N. Tombros, H. J. A. Molegraaf, M. Grüninger, D. van der Marel, and S. Uchida, Phys. Rev. Lett. 91, 037004 (2003).