Identifying Suspicious Regions of COVID-19 by Abnormality-Sensitive Activation Mapping
Abstract
This paper presents a fully-automated method for the identification of suspicious regions of a coronavirus disease (COVID-19) on chest CT volumes. One major role of chest CT scanning in COVID-19 diagnoses is identification of an inflammation particular to the disease. This task is generally performed by radiologists through an interpretation of the CT volumes, however, because of the heavy workload, an automatic analysis method using a computer is desired. Most computer-aided diagnosis studies have addressed only a portion of the elements necessary for the identification. In this work, we realize the identification method through a classification task by using a 2.5-dimensional CNN with three-dimensional attention mechanisms. We visualize the suspicious regions by applying a backpropagation based on positive gradients to attention-weighted features. We perform experiments on an in-house dataset and two public datasets to reveal the generalization ability of the proposed method. The proposed architecture achieved AUCs of over 0.900 for all the datasets, and mean sensitivity and specificity . The method can also identify notable lesions pointed out in the radiology report as suspicious regions.
Keywords:
COVID-19 Chest CT Computer-aided diagnosis Interpretablility Explainability 3D attention mechanisms.1 Introduction
The identification of suspicious abnormality from a medical image is a fundamental problem with relevance to many computer-aided diagnosis (CAD) systems. Automatic and precise identification of suspicious regions remains a major challenge in the medical image processing field. Facing at an infectious disease caused by the coronavirus SARS-CoV-2 (COVID-19), chest CT scanning is an essential examination for COVID-19 diagnosis [1, 2, 3], and automatic identification of suspicious region from a CT volume also poses high demands on image analysis to reduce interpreting workloads for radiologists [4]. Along with increasing demands for early COVID-19 diagnoses, numerous automated classification methods have been investigated [5, 6, 7, 8]. However, these works focused on the precise classification of COVID-19 cases [9, 10]. Toward practical application to medical diagnosis, in addition to high classification accuracy, explainability/interpretability by a suggestion of suspicious regions found by classification model is essential [4].
Related works addressed automated identification of suspicious regions in COVID-19 diagnosis. Han et al. [11] proposed 3D attention-based multiple instance learning and they visualized 3D patch-level importance. This method suggests only binary information whether suspicious regions or not for small 3D patches in a CT volume. Zhang et al. applied attention blocks for fusing 3D chest CT volume and 2D X-ray image and visualized suspicious regions [12] Takateyama et al. [13] utilized attention specific to bilateral lesions and pleural effusions and visualized saliency in input. These two methods simply apply 2D Grad-CAM to their trained models. Because these slice-level visualizations typically show high intensities for normal structures that span multiple slices such as bronchi, blood vessels, and interlobular septa, these are insufficient for identifying key patterns. Therefore, visualizing 3D suspicious lesions is still an open problem. Our motivation is to reveal COVID-19 suspicious regions by utilizing 3D information effectively.
Visual explanation of key patterns realizes the identification of the suspicious regions of COVID-19. Since this approach bases on the assumption that a trained model can correctly recognize key patterns and accurately classify chest CT volumes, we propose 2.5D architecture for robust COVID-19 classification. This hybrid architecture of three 2D encoders followed by a single 3D encoder extracts fine 3D features with a reduced number of parameters. Furthermore, we incorporate attention mechanisms into our 2.5D architecture to capture key 3D patterns. While low-resolution attention maps given by attention mechanisms roughly imply regions including the findings of target COVID-19 disease, it is difficult to understand where and what are actual key patterns at the original-scale images/volumes. To circumvent this difficulty, we extend a backpropagation-based visual explanation method for a 3D convolutional layer and applied it to our attention-guided 3D features towards the identification of suspicious regions.
In this work, we propose a method for the identification of COVID-19 suspicious regions by introducing abnormality-sensitive activation mapping. For the visualization of suspicious regions, this method selectively utilize features relevant for the classification. A summary of our main contributions are follows: (1) we offer an attention-guided full-3D visual explanation method toward the COVID-19 diagnostic assistance, (2) our identification provides a strong interpretability for the classification results by directly pointing out actual lesions, and (3) we perform large-scale experiments on three datasets, with a total of over 2,000 cases.
2 Methods
Our proposed method consists of a robust 2.5D classifier with our extended attention mechanisms and its visual explanation. Since we integrated the feature extraction based on the extended 3D attention mechanisms, we can assume that larger gradients backpropagate to only key features in each layer. Therefore, backpropagation via attention-guided features leads our abnormality-sensitive activation mapping. The input and output of the proposed method is a chest CT volume and a 3D visual explanation showing suspicious regions, respectively. Figure 1 shows the outline of our method.
2.1 Robust COVID-19 classification
2.1.1 Preprocessing
We set a window level and a window width of to 550 H.U. and 1500 H.U., respectively, for a lung window setting. We normalize the volume into . After the normalization, a lung segmentation method [14] processes the volume to output a lung mask volume , where 0 and 1 express outside and inside the lung, respectively. By using an element-wise multiplication of and , we obtain a lung volume .
2.1.2 2.5D-based representation learning
We design a 2.5D architecture for effective 3D feature extraction from 3D volumetric CT data. Since 3D volumes can express more patterns than 2D images, an architecture of 3D CNN also have more and more parameters than one of 2D CNN, and apt to result in overfitting to a given training dataset [15, 16]. However, our hybrid architecture of three 2D encoders and one 3D encoder can avoid overfitting to a training dataset by reducing the number of parameters of CNN.
For a resized lung volume of , three 2D encoders of four convolutional layers perform 2D convolutions with kernels along axial, coronal, and sagittal slices of , respectively. As a result of these convolutions, we obtain tensors . By concatenating these three feature maps, we obtain a tensor . For , the 3D encoder performs 3D convolutions with and kernels accompanying dilated convolutions [17] and mixed pooing [18]. Concatenated 2D features are fused into 3D feature maps with a channel index .
2.1.3 Attention-guided 3D feature selection
We develop attention mechanisms for 3D feature maps by extending channel and spatial attentions [19]. These mechanisms enable us to detect regions including key patterns for accurate classification. For 3D feature maps with a channel index , we compute spatial-wise global-average and max poolings by
| (1) |
respectively, and then obtain vectors . By feeding these and into two multi-layer perceptrons of weights and with different activation functions, we compute a -dimensional attention vector as
| (2) |
where and express element-wise activations by sigmoid and ReLU functions, respectively. From and , we obtain intermediate feature maps for .
For the computation of spatial attention, channel-wise average- and max-poolings of generate tensors , respectively, by
| (3) |
Concatenating these two tensors as and setting a 3D convolution as where is a convolution kernel, we have a spatial-attention map by
| (4) |
where expresses a sigmoid activation function. Using element-wise multiplication of two tensors, we obtain attention-guided feature maps by
| (5) |
as the final output of our two attention mechanisms. By using these feature maps, our model computes likelihoods for two classes and then outputs a predicted class , where 0 and 1 indicate non-typical and typical cases, respectively.
2.2 Identification of suspicious region via weight analysis
Visual explanation of our robust COVID-19 classification model realizes the identification of suspicious regions. To achieve the identification of suspicious regions, we propose a positive-gradient-based visual explaining method for 3D patterns. While the survey [20] of deep learning methods in medical imaging analysis reported that many studies used the Grad-CAM [21], recent works indicate the importance of positive gradients in the weight analysis of a trained CNN [22, 23]. Furthermore, mathematical analysis in Ref. [23] reveals that the numerical equivalence of Grad-CAM++ [24] and positive-gradient-based Grad-CAM [22].
We set as an output of a CNN for class . For each voxel in -th 3D feature map of size at a 3D convolutional layer, we have a neuron importance weight
| (6) |
where is a gradient of with respect to . Visual explanation at a 3D convolutional layer for class is given by
| (7) |
We apply Eqs. (6) and (7) to the convolutional layer just before the final down sampling. In order to clarify the suspicious regions, we exclude parts of the heatmap, which have intensities of 0.1 or less, from the final identification result.
3 Experiments
3.0.1 Datasets
| Dataset | Typical | Non-typical | Total | |
|---|---|---|---|---|
| In-house | Training | 596 | 368 | 964 |
| Validation | 149 | 92 | 241 | |
| Testing | 187 | 115 | 302 | |
| All | 932 | 575 | 1,507 | |
| COVID-CT-MD [25] | Testing | 169 | 76 | 245 |
| COVID-CTset [26] | Testing | 95 | 282 | 377 |
To evaluate the proposed method, we used an IRB-approved in-house dataset and two public datasets [25, 26]. Table 1 summarizes the details of datasets. For the in-house dataset, radiologists labeled each case based on the four COVID-19 typicality categorization defined by the RSNA [27]. From the given labels, we used two high typicality categories as the typical COVID-19 and the rest as the non-typical case. Even though these public datasets offer labels of COVID-19 and normal cases, we treated the former as typical and the latter as non-typical.
3.0.2 Implimentation and training
Our implementation is based on TensorFlow2. For computation, we used two AMD EPYC7313 processors and an NVIDIA A100 GPU of 80 GB RAM. We trained the 2.5D CNN with 3D attention mechanisms for 100 epochs using Adam optimizer with an initial learning rate of . The learning rate decayed 15% at every 10 epochs. The batch size was 16. We selected the best models of each method w.r.t. classification accuracy in the validation dataset.
3.0.3 Evaluation of COVID-19 classification
We evaluated the 2.5D CNN’s performance by using receiver operating characteristic (ROC) curves and areas under the curves (AUCs) based on the model’s classification accuracy. We compared the proposed model with a 3D CNN [28], a 3D CNN with one attention block, a 2.5D CNN w/o attention, an orthogonal ensemble [29] of 2.5D CNNs and a 2.5D CNN with five attention blocks. Figure 2 and Table 2 show ROC curves and AUCs based on the classification results for each dataset. The proposed architecture achieved the best AUCs on three datasets, and mean sensitivity and specificity .
3.0.4 Evaluation of suspicious region identification
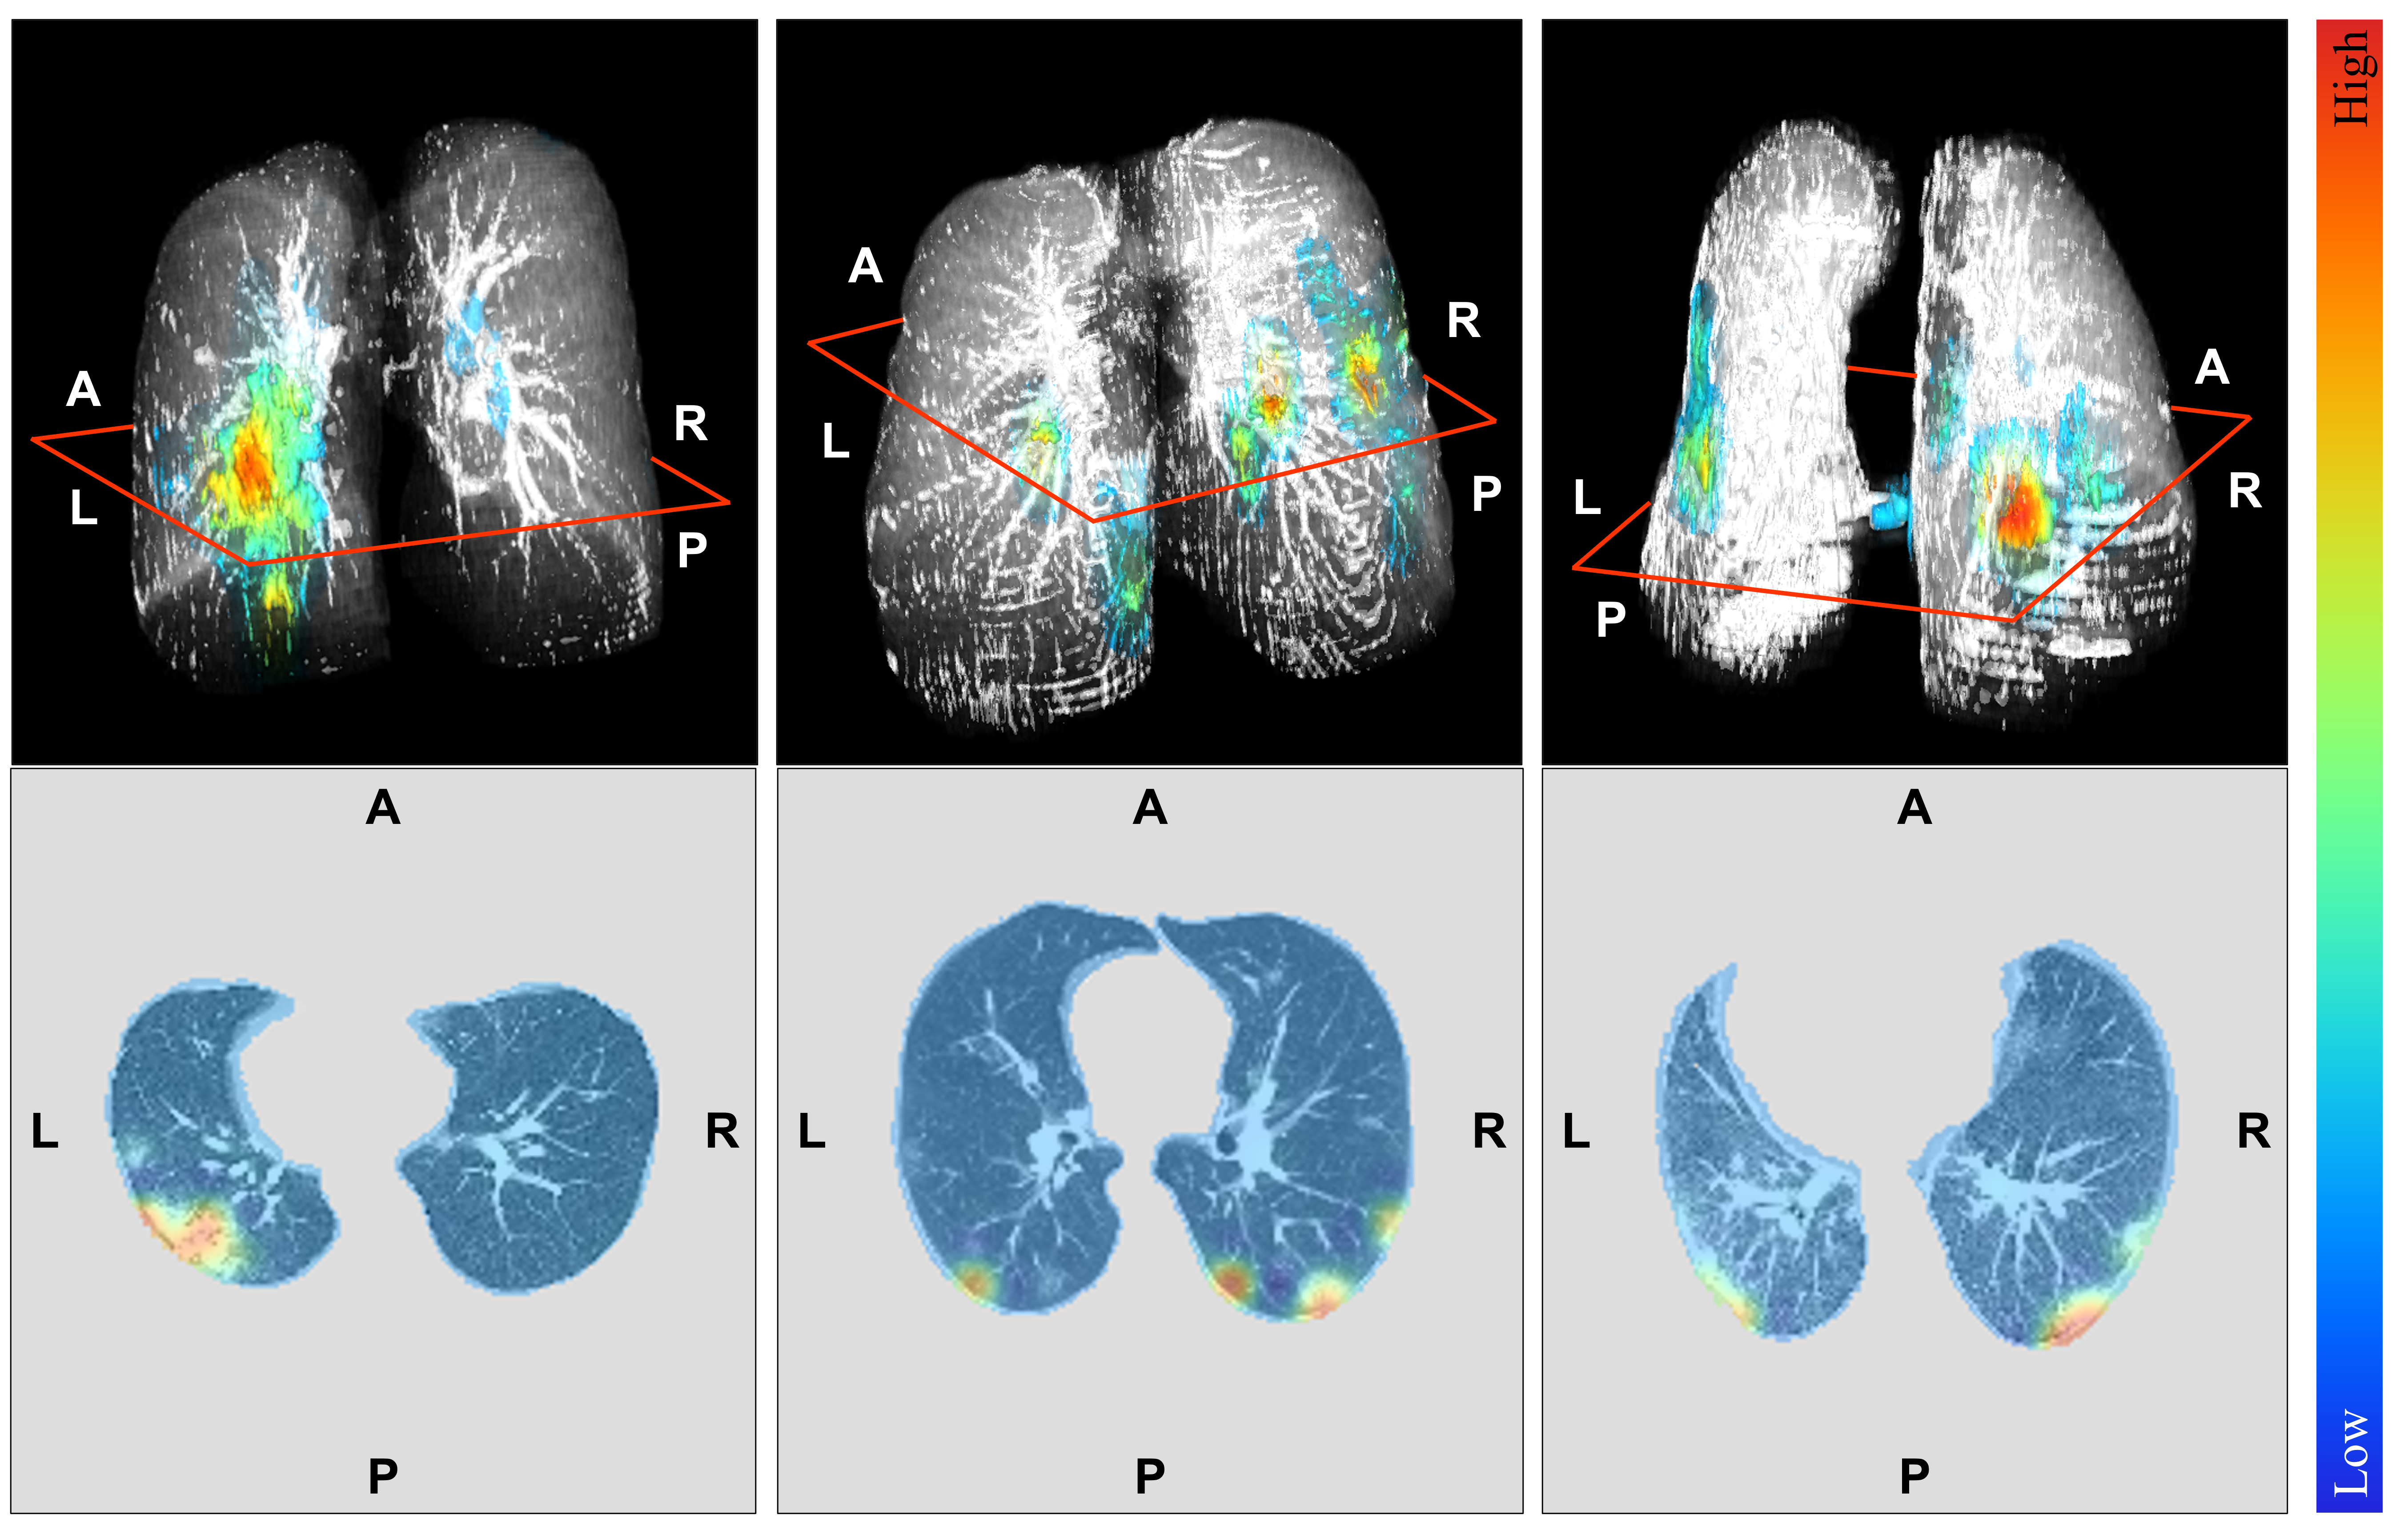
From the in-house test data, we picked 47 typical cases whose radiology reports contained information on the suspected COVID-19 lesions and their lobe-level locations for evaluation. For the selected cases, we evaluated a coincidence of actual lesions and CNN-identified suspicious regions. We checked the lesion location based on the radiology report and intensities of the heatmap there. If the intensities were higher than 0.1 (excluded level), we regarded the lesion as correctly identified. The evaluation is based on lobe- and case-level. By using the total number of lesions and the number of identified lesions , we computed identification rates (IR) for lobe- and case-levels as . Figure 3 is an example of the suspicious-region identification on the three datasets. Table 3 shows the accuracy of the suspicious-region identification.
| In-house | COVID-CT-MD | COVID-CTset | |
|---|---|---|---|
| 3D CNN | 0.838 | 0.853 | 0.779 |
| 3D CNN + attn. block | 0.906 | 0.932 | 0.900 |
| 2.5D CNN | 0.881 | 0.930 | 0.855 |
| 2.5D CNN + OEN | 0.869 | 0.929 | 0.889 |
| 2.5D CNN + 5 attn. blocks | 0.732 | 0.725 | 0.685 |
| Proposed | 0.910 | 0.946 | 0.916 |
| LUL | LLL | RUL | RML | RLL | Case-level | |
|---|---|---|---|---|---|---|
| Number of total | 21 | 33 | 23 | 11 | 29 | 47 |
| Number of identified | 2 | 22 | 9 | 2 | 27 | 39 |
| Identification rate | 9.52% | 66.7% | 39.1% | 18.2% | 93.1% | 83.0% |
4 Discussions
As shown in Table 2 and Fig. 2, our proposed CNN achieved the best performances among six methods on three datasets. The results suggest that the 2.5D architecture with the 3D attention mechanisms is effective to improve the model’s generalization ability. Especially, the improvement in the specificity is evident. This implies that attention-guided features express key patterns of typical COVID-19 well. On the other hand, the model with multiple attention blocks decreased its classification performance from the model without attention blocks. In this model, the attention mechanisms might perform over selections of features in shallow layers and fail in feature extraction of key 3D patterns.
The visualization in Fig. 3 implies that our method can identify ground-glass opacities (GGOs) and consolidations. The method tended to focus on lesions located in posterior regions and lower lobes. These findings and regions match with previously reported common findings and sites of COVID-19 [30, 31]. In Table 3, the proposed method achieved the case-level IR over 80%, even though the IR of the left lower lobe is lower than the right lower lobe. We can also interpret the low IRs for the upper and middle lobes as a result of the classification mainly focusing on lesions in the lower lobes. However, typical COVID-19 cases often have bilateral lesions [30, 31]. Since our method was able to identify lesions in at least either lung, these results suggest that our attention- and positive-gradient-based visualization is acceptable for identifying suspicious regions in a practical application scenario.
As the current limitation, identifying weak and highly-localized GGOs is still challenging for the proposed method. We will refine this point by adopting a larger input size of our architecture to capture more tiny key patterns.
5 Conclusions
We proposed a suspicious region identification method for the COVID-19 cases on chest CT volumes by an abnormality-sensitive activation mapping. As a result of the experiments, our method showed stable classification performances on three datasets. The method identified GGOs and consolidations in posterior regions and lower lobes as suspicious regions. Since these abnormalities are in agreement with the clinically important findings, we conclude that the proposed method is acceptable for the diagnostic assistance.
5.0.1 Acknowledgements
Parts of this research were supported by the NICT, Grant Number 222A03, the JST CREST, Grant Number JPMJCR20D5, the JSPS KAKENHI, Grant Number 26108006 and the JST SPRING, Grant Number JPMJSP2125. The author (RT) would like to take this opportunity to thank the “Interdisciplinary Frontier Next-Generation Researcher Program of the Tokai Higher Education and Research System.”
References
- [1] Chung, M., Bernheim, A., Mei, X. et al.: CT imaging features of 2019 novel coronavirus (2019-nCoV). Radiology 295(1), 202–207 (2020)
- [2] Pan, F., Ye, T., Sun, P. et al.: Time course of lung changes at chest CT during recovery from coronavirus disease 2019 (COVID-19). Radiology 295(3), 715–721 (2020)
- [3] Machnicki, S., Patel, D., Singh, A. et al.: The Usefulness of Chest CT Imaging in Patients With Suspected or Diagnosed COVID-19: A Review of Literature. Chest 160(2), 652–670 (2021)
- [4] Roberts, M., Driggs, D., Thorpe, M. et al.: Common pitfalls and recommendations for using machine learning to detect and prognosticate for COVID-19 using chest radiographs and CT scans. Nature Machine Intelligence 3(3), 199–217 (2021).
- [5] Kanne, J.P., Bai, H., Bernheim, A. et al.: COVID-19 Imaging: What We Know Now and What Remains Unknown. Radiology 299(3), E262–279 (2021)
- [6] Mei, X., Lee, H.-C., Diao, K.-Y. et al.: Artificial intelligence-enabled rapid diagnosis of patients with COVID-19. Nature Medicine 26(8), 1224–1228 (2020)
- [7] Amyar, A., Modzelewski, R., Li, H. et al.: Multi-task deep learning based CT imaging analysis for COVID-19 pneumonia: classification and segmentation. Computers in Biology and Medicine 104037, 126 (2020)
- [8] He, X., Ying, G., Zhang, J. et al.: Evolutionary Multi-objective Architecture Search Framework: Application to COVID-19 3D CT Classification. Proc. MICCAI LNCS 13431, 560–570 (2022)
- [9] Castiglione, A., Vijayakumar, P., Nappi, M. et al.: COVID-19: automatic Detection of the Novel Coronavirus Disease from CT Images Using an Optimized Convolutional Neural Network. IEEE Trans. Industrial Informatics 17(9), 6480–6488 (2021)
- [10] Saba, L., Agarwal, M., Patrick, A. et al.: Six artificial intelligence paradigms for tissue characterisation and classification of non-COVID-19 pneumonia against COVID-19 pneumonia in computed tomography lungs. IJCARS 16(3), 423–434 (2021)
- [11] Han, Z., Wei, B., Hong, Y. et al.: Accurate screening of COVID-19 using attention-based deep 3D multiple instance learning. IEEE Trans. Medical Imaging 39(8), 2584–2594 (2020).
- [12] Zhang, Y.D., Zhang, Z., Zhang, X. et al.: MIDCAN: A multiple input deep convolutional attention network for COVID-19 diagnosis based on chest CT and chest X-ray. Pattern Recognition Letters 150, 816 (2021)
- [13] Takateyama, Y., Haruishi, T., Hashimoto, M. et al.: Attention induction for a CT volume classification of COVID-19. IJCARS, 1–13 (2022)
- [14] Oda, M., Hayashi, Y., Otake, Y. et al.: Lung infection and normal region segmentation from CT volumes of COVID-19 cases. Proc. SPIE Medical Imaging 11597, 682–687 (2021)
- [15] Puyal J. G.-B., Brandao, P., Ahmad, O.F. et al.: Polyp detection on video colonoscopy using a hybrid 2D/3D CNN. MedIA 82, 102625 (2022)
- [16] Itoh, H., Oda, M., Misawa, M. et al.: Stable polyp-scene classification via subsampling and residual learning from an imbalanced large dataset. IET Healthcare Technology Letters 6(6), 237–242 (2019).
- [17] Yu, F., Koltun, V.: Multi-Scale Context Aggregation by Dilated Convolutions. Proc. International Conference on Learning Representations 2016 (2016)
- [18] Playout, C., Duval, R., Cheriet, F.: A Multitask Learning Architecture for Simultaneous Segmentation of Bright and Red Lesions in Fundus Images. Proc. MICCAI LNCS 11071, 101–108 (2018)
- [19] Woo, S., Park, J., Lee, J.Y. et al.: CBAM: convolutional block attention module. Proc. ECCV, 3–19 (2018)
- [20] van der Velden, B., Kuijf, H., Gilhuijs, K. et al.: Explainable artificial intelligence (XAI) in deep learning-based medical image analysis. MedIA 79, 12470 (2022)
- [21] Selvaraju, R., Cogswell, M., Das, A. et al.: Grad-CAM: Visual Explanations from Deep Networks via Gradient-Based Localization. Proc. ICCV, 618–626 (2017)
- [22] Itoh, H., Misawa, M., Mori, Y. et al.: Positive-gradient-weighted object activation mapping: visual explanation of object detector towards precise colorectal-polyp localisation. IJCARS 17, 2051–2063 (2022)
- [23] Lerma, M., Lucas, M.: Grad-CAM++ is equivalent to Grad-CAM with positive gradients. CoRR arXiv:2205.10838 (2022)
- [24] Chattopadhay, A., Sarkar, A., Howlader, P. et al.: Grad-CAM++: Generalized gradient-based visual explanations for deep convolutional networks. Proc. IEEE Winter Conference on Applications of Computer Vision, 839847 (2018)
- [25] Afshar, P., Heidarian, S., Enshaei, N. et al.: COVID-CT-MD, COVID-19 computed tomography scan dataset applicable in machine learning and deep learning. Scientific Data 8(1), 1–8 (2021)
- [26] Rahimzadeh, M., Attar, A., Sakhaei, S.M.: A fully automated deep learning-based network for detecting COVID-19 from a new and large lung CT scan dataset. Biomedical Signal Processing and Control 68, 102588 (2021)
- [27] Simpson, S., Kay, F.U., Abbara, S. et al.: Radiological Society of North America expert consensus statement on reporting chest CT findings related to COVID-19. Endorsed by the Society of Thoracic Radiology, the American College of Radiology, and RSNA - secondary publication. Journal of Thoracic Imaging 35(4), 219–227 (2020)
- [28] Oda, M., Zheng, T., Hayashi, Y. et al.: Automated classification method of COVID-19 cases from chest CT volumes using 2D and 3D hybrid CNN for anisotropic volumes. Proc. SPIE Medical Imaging 12033, 60–66 (2022)
- [29] Larrazabal, A., Martinez, C., Dolz, J. et al.: Orthogonal ensemble networks for biomedical image segmentation. Proc. MICCAI 12903, 594–603 (2021)
- [30] Bao, C., Liu, X., Zhang, H. et al.: Coronavirus disease 2019 (COVID-19) CT findings: a systematic review and meta-analysis. Journal of American College of Radiology 17(6), 701–709 (2020)
- [31] Ojha, V., Mani, A., Pandey, N. et al.: CT in coronavirus disease 2019 (COVID-19): a systematic review of chest CT findings in 4410 adult patients. European Radiology 30(11), 6129–6138 (2020)