Label-Free Liver Tumor Segmentation
Abstract
We demonstrate that AI models can accurately segment liver tumors without the need for manual annotation by using synthetic tumors in CT scans. Our synthetic tumors have two intriguing advantages: (I) realistic in shape and texture, which even medical professionals can confuse with real tumors; (II) effective for training AI models, which can perform liver tumor segmentation similarly to the model trained on real tumors—this result is exciting because no existing work, using synthetic tumors only, has thus far reached a similar or even close performance to real tumors. This result also implies that manual efforts for annotating tumors voxel by voxel (which took years to create) can be significantly reduced in the future. Moreover, our synthetic tumors can automatically generate many examples of small (or even tiny) synthetic tumors and have the potential to improve the success rate of detecting small liver tumors, which is critical for detecting the early stages of cancer. In addition to enriching the training data, our synthesizing strategy also enables us to rigorously assess the AI robustness.
1 Introduction
Artificial intelligence (AI) has dominated medical image segmentation [zhou2019unet++, isensee2021nnu, hatamizadeh2022unetr, zhou2019models, zhou2021models], but training an AI model (e.g., U-Net [ronneberger2015u]) often requires a large number of annotations. Annotating medical images is not only expensive and time-consuming, but also requires extensive medical expertise, and sometimes needs the assistance of radiology reports and biopsy results to achieve annotation accuracy [zhou2021review, erickson2021imaging, rubin2021biomedical, zhou2021towards, wang2021development, zhou2022interpreting]. Due to its high annotation cost, only roughly 200 CT scans with annotated liver tumors are publicly available (provided by LiTS [bilic2019liver]) for training and testing models.
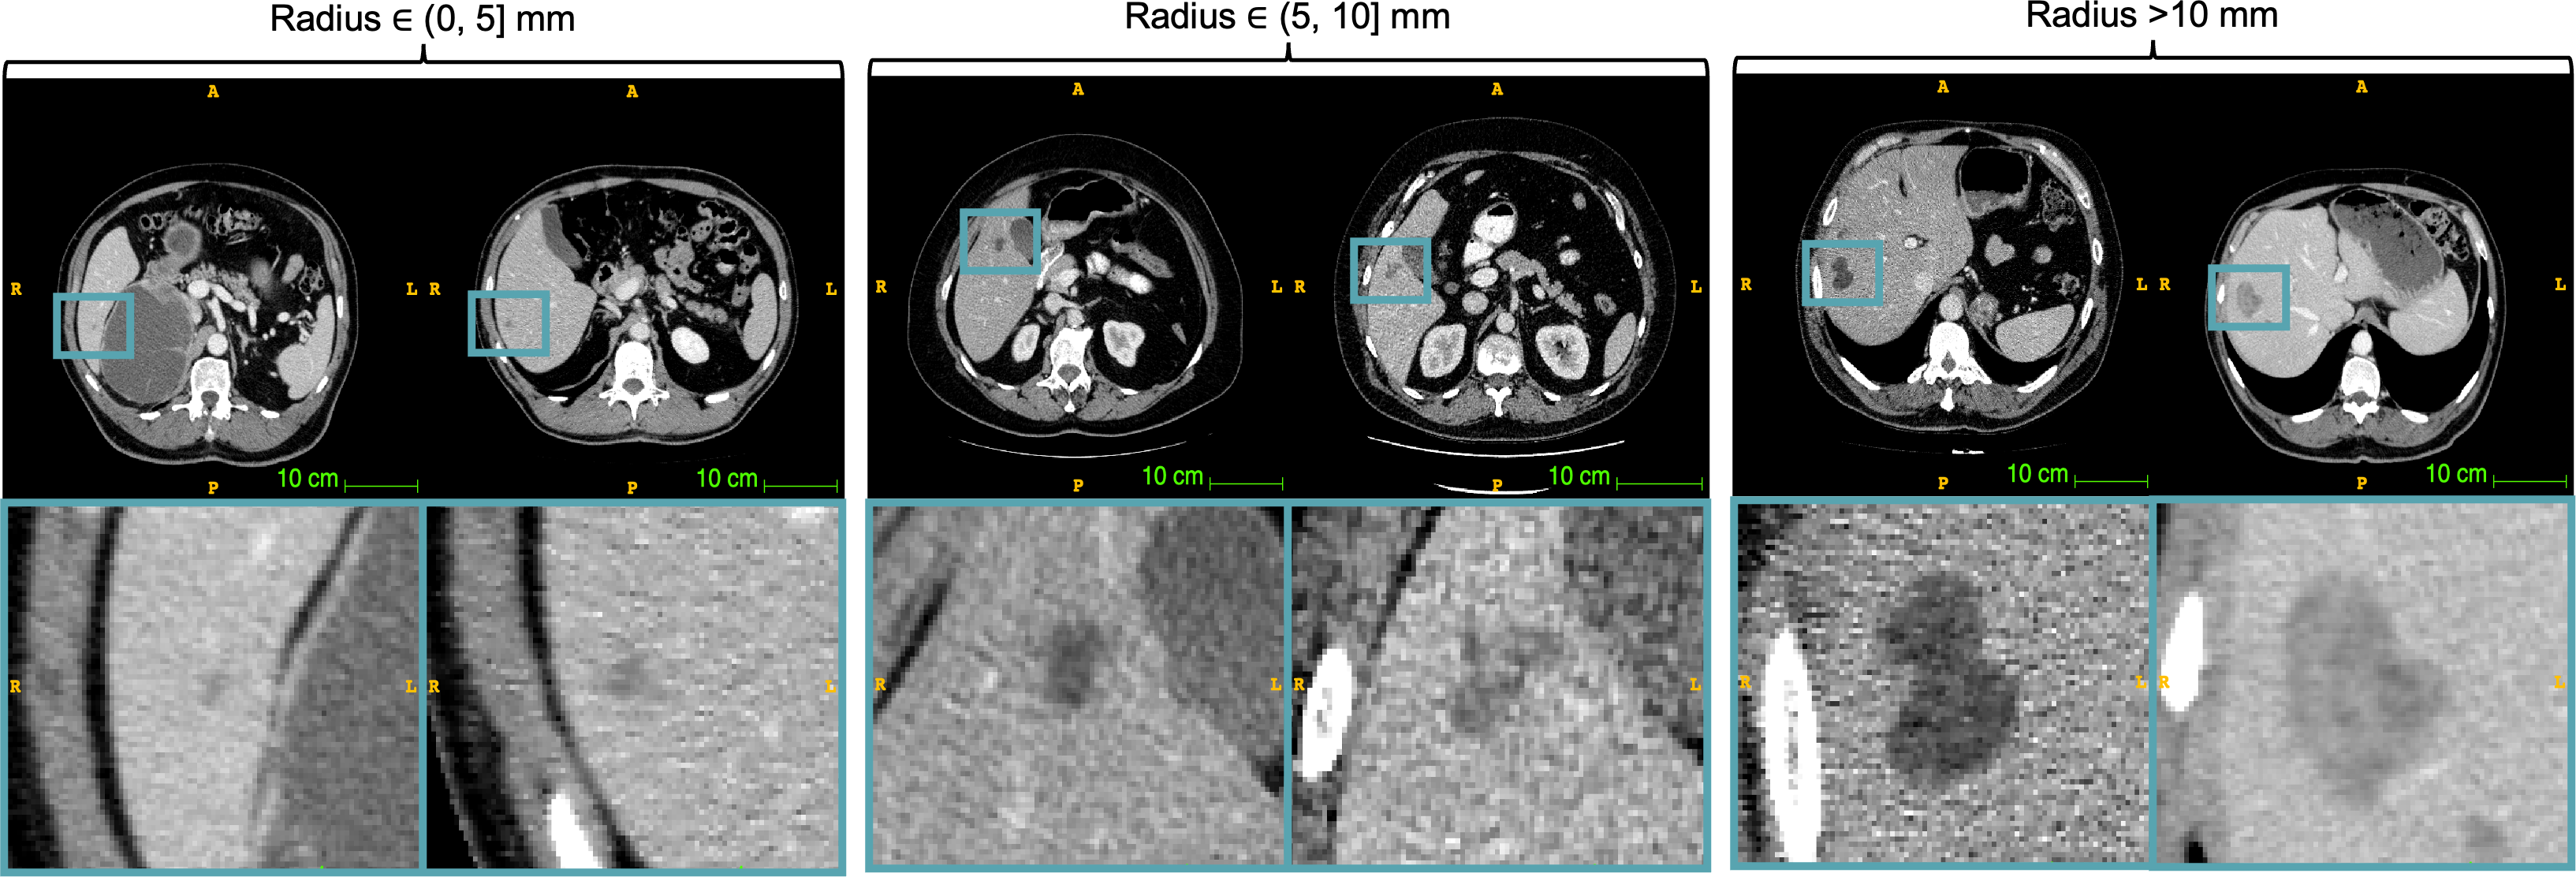
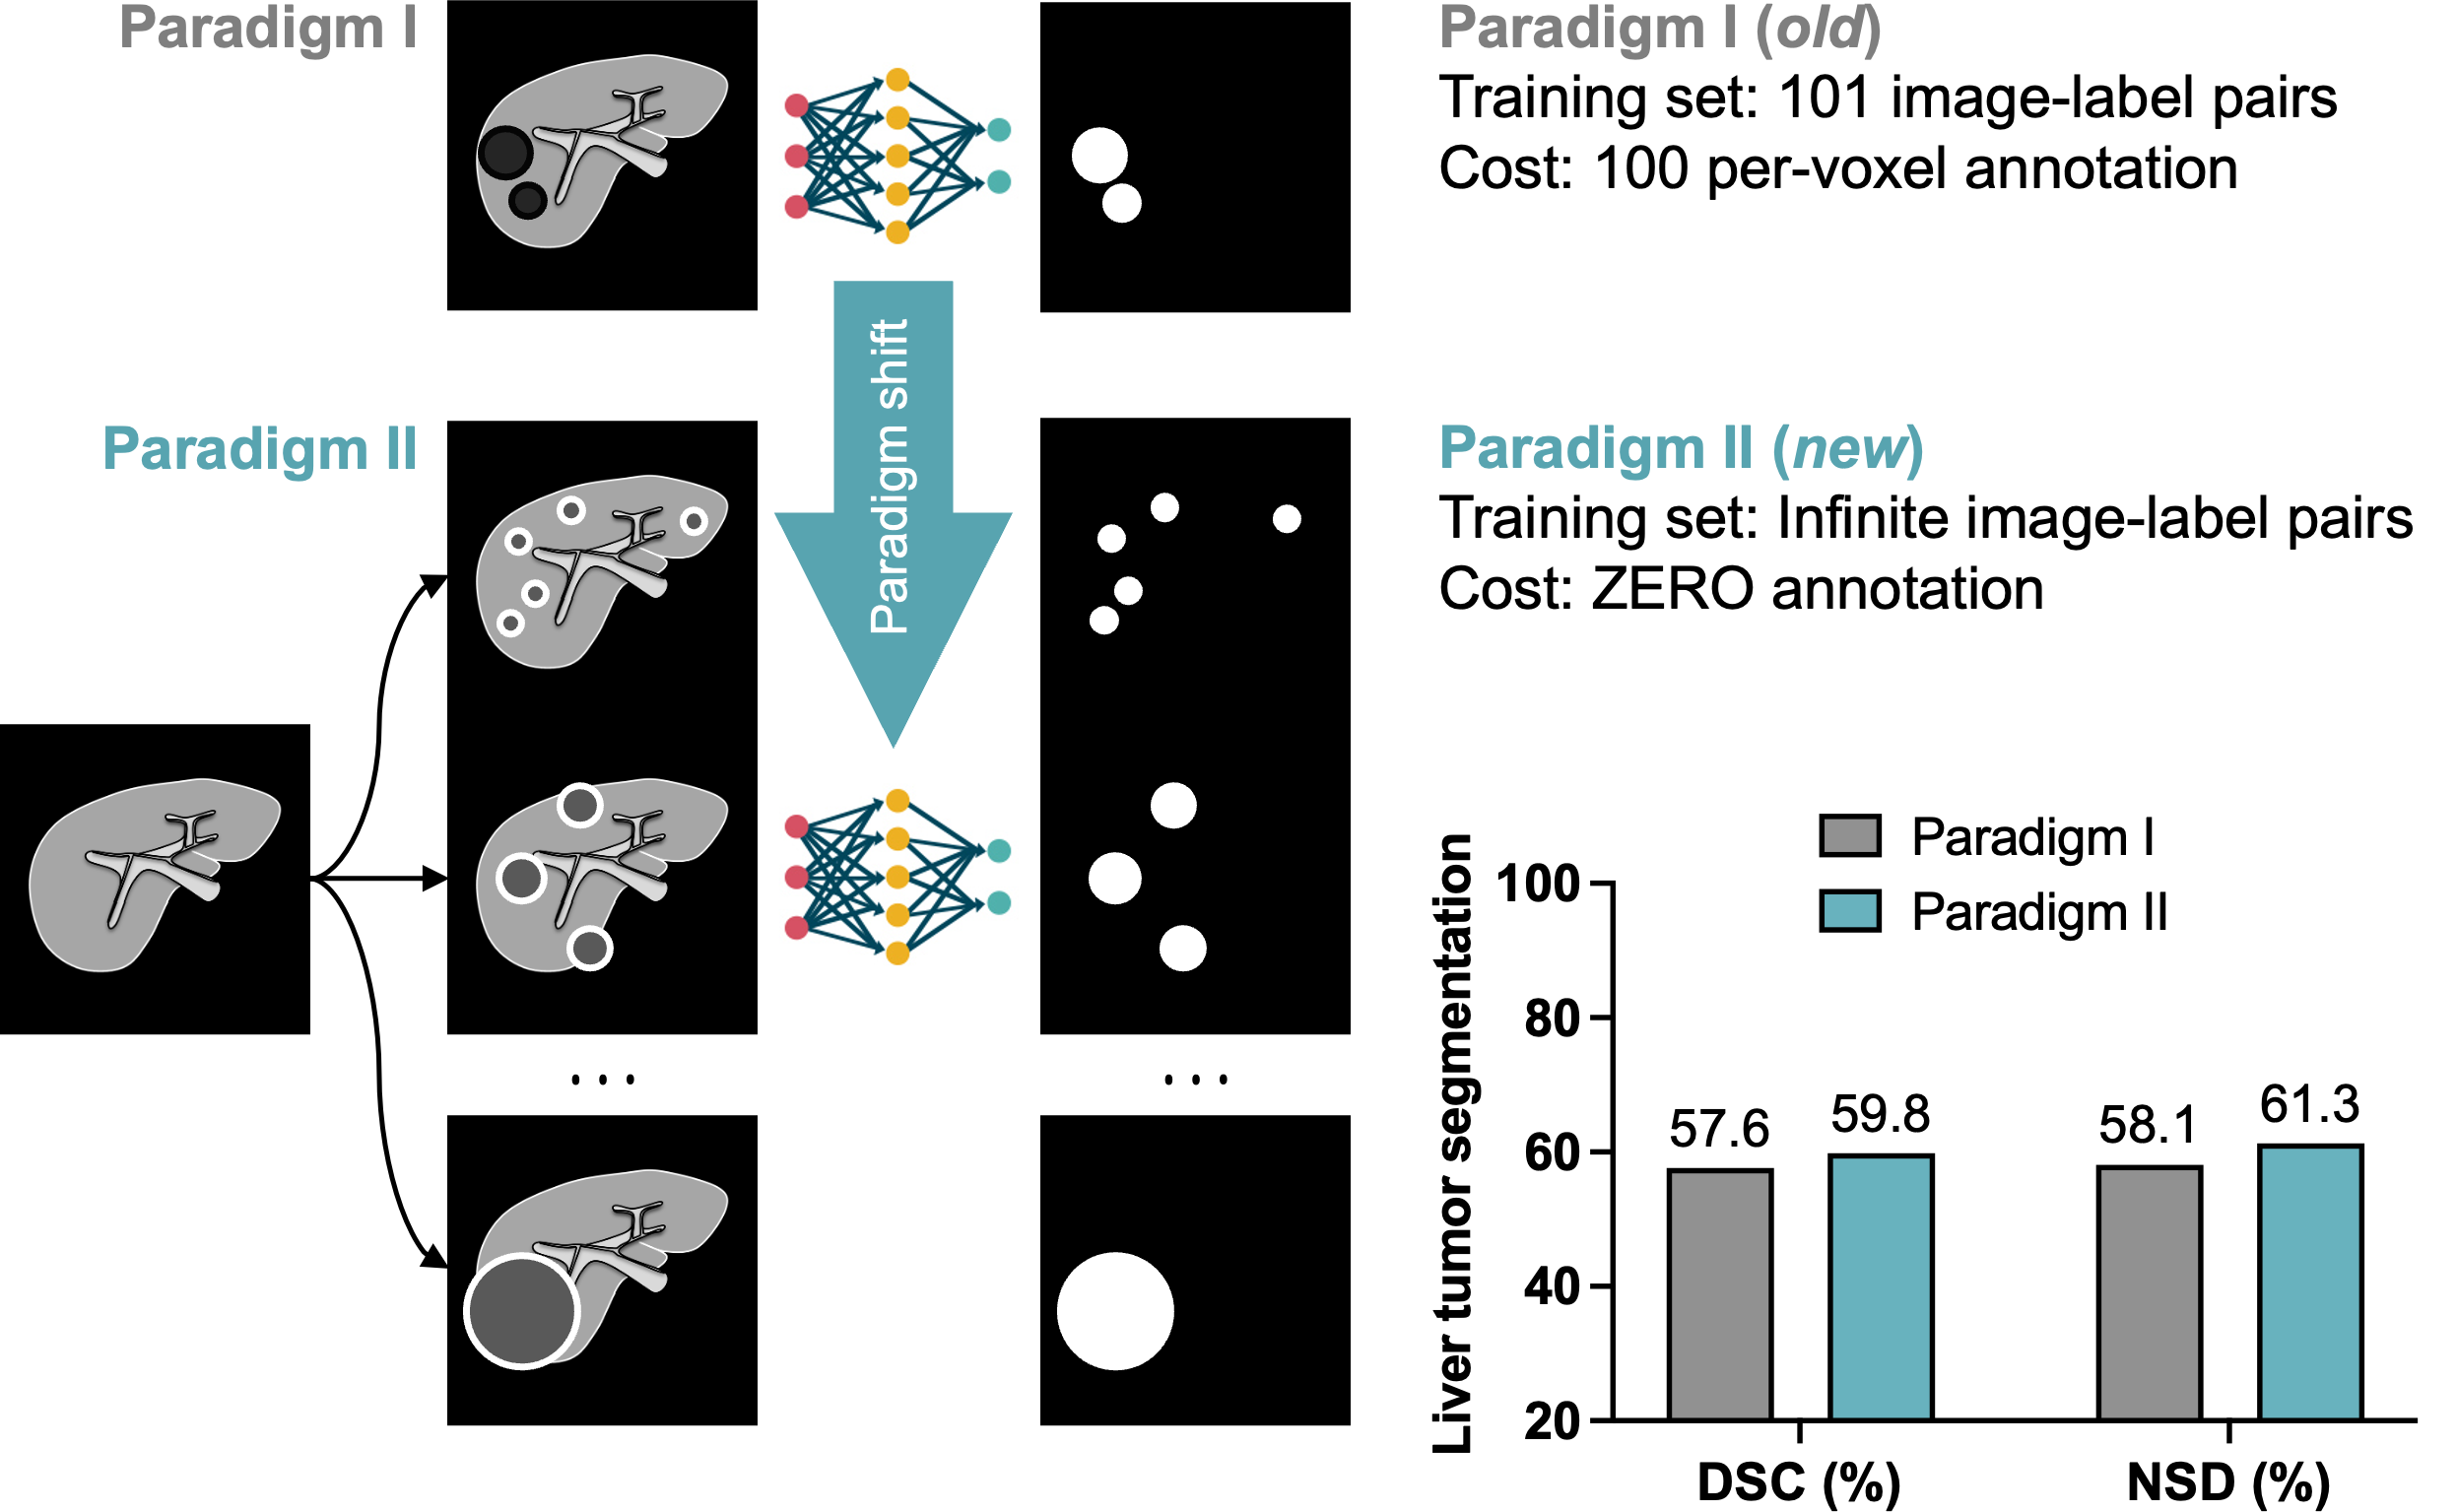
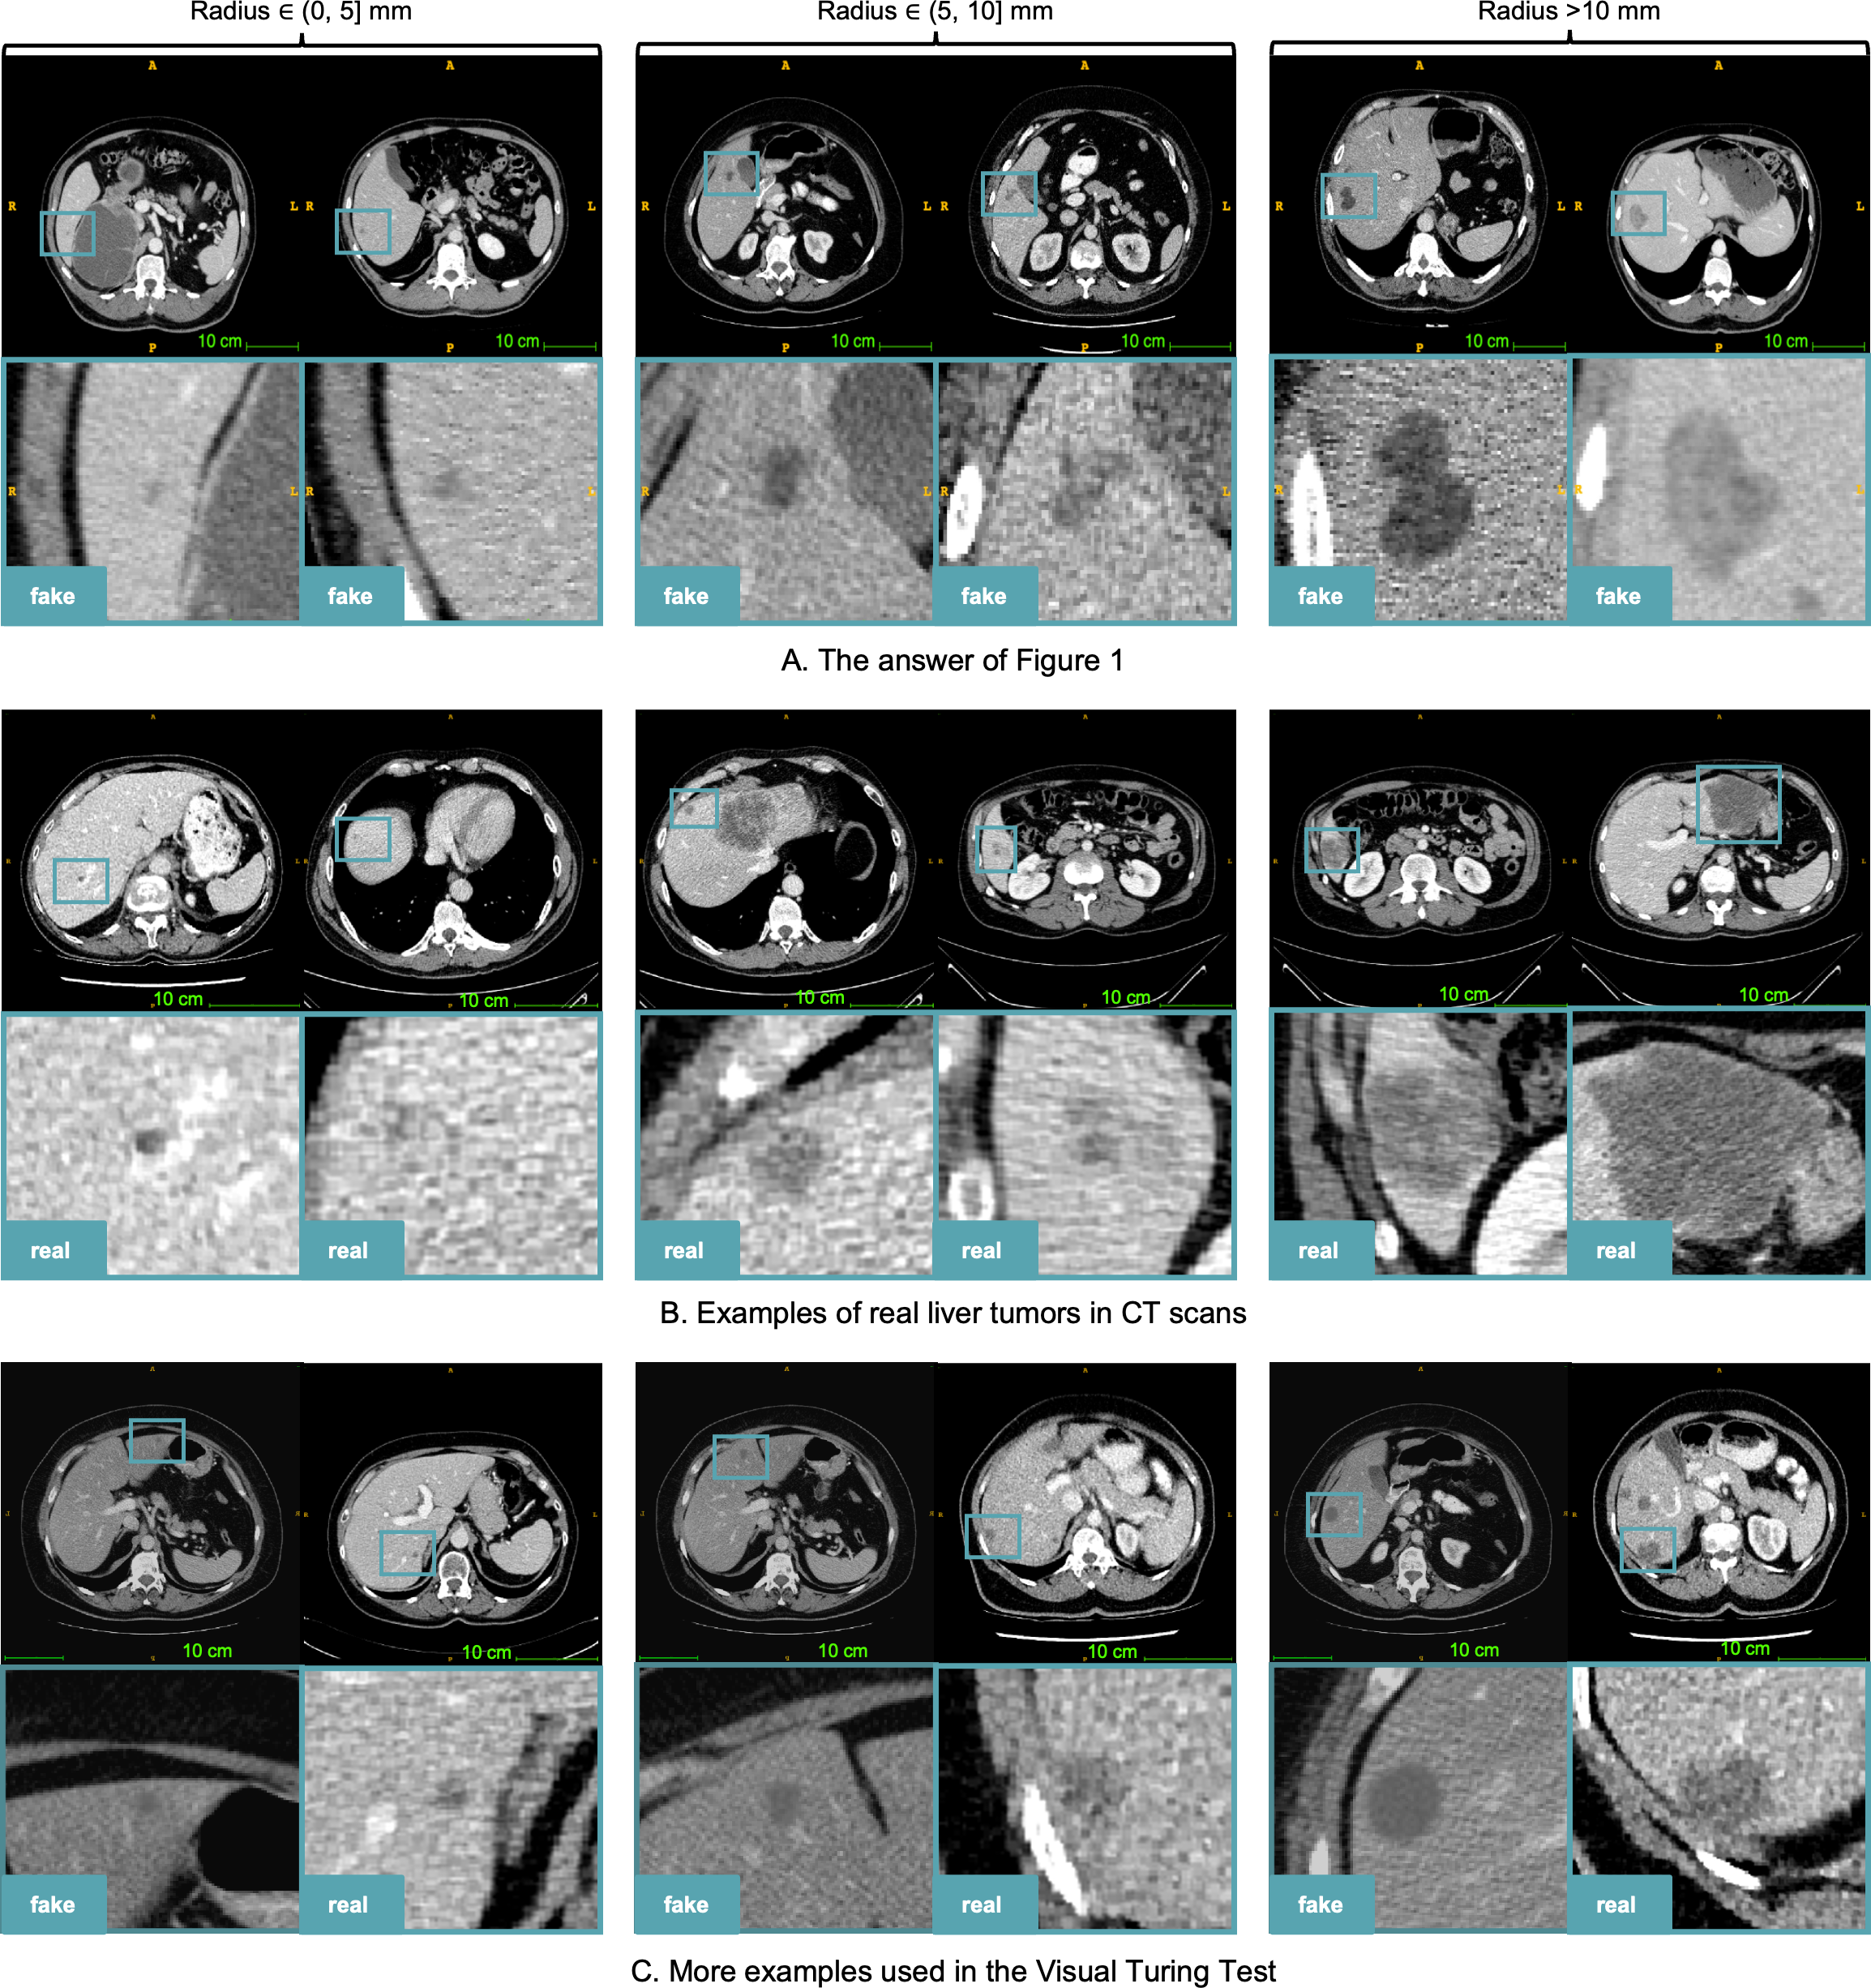
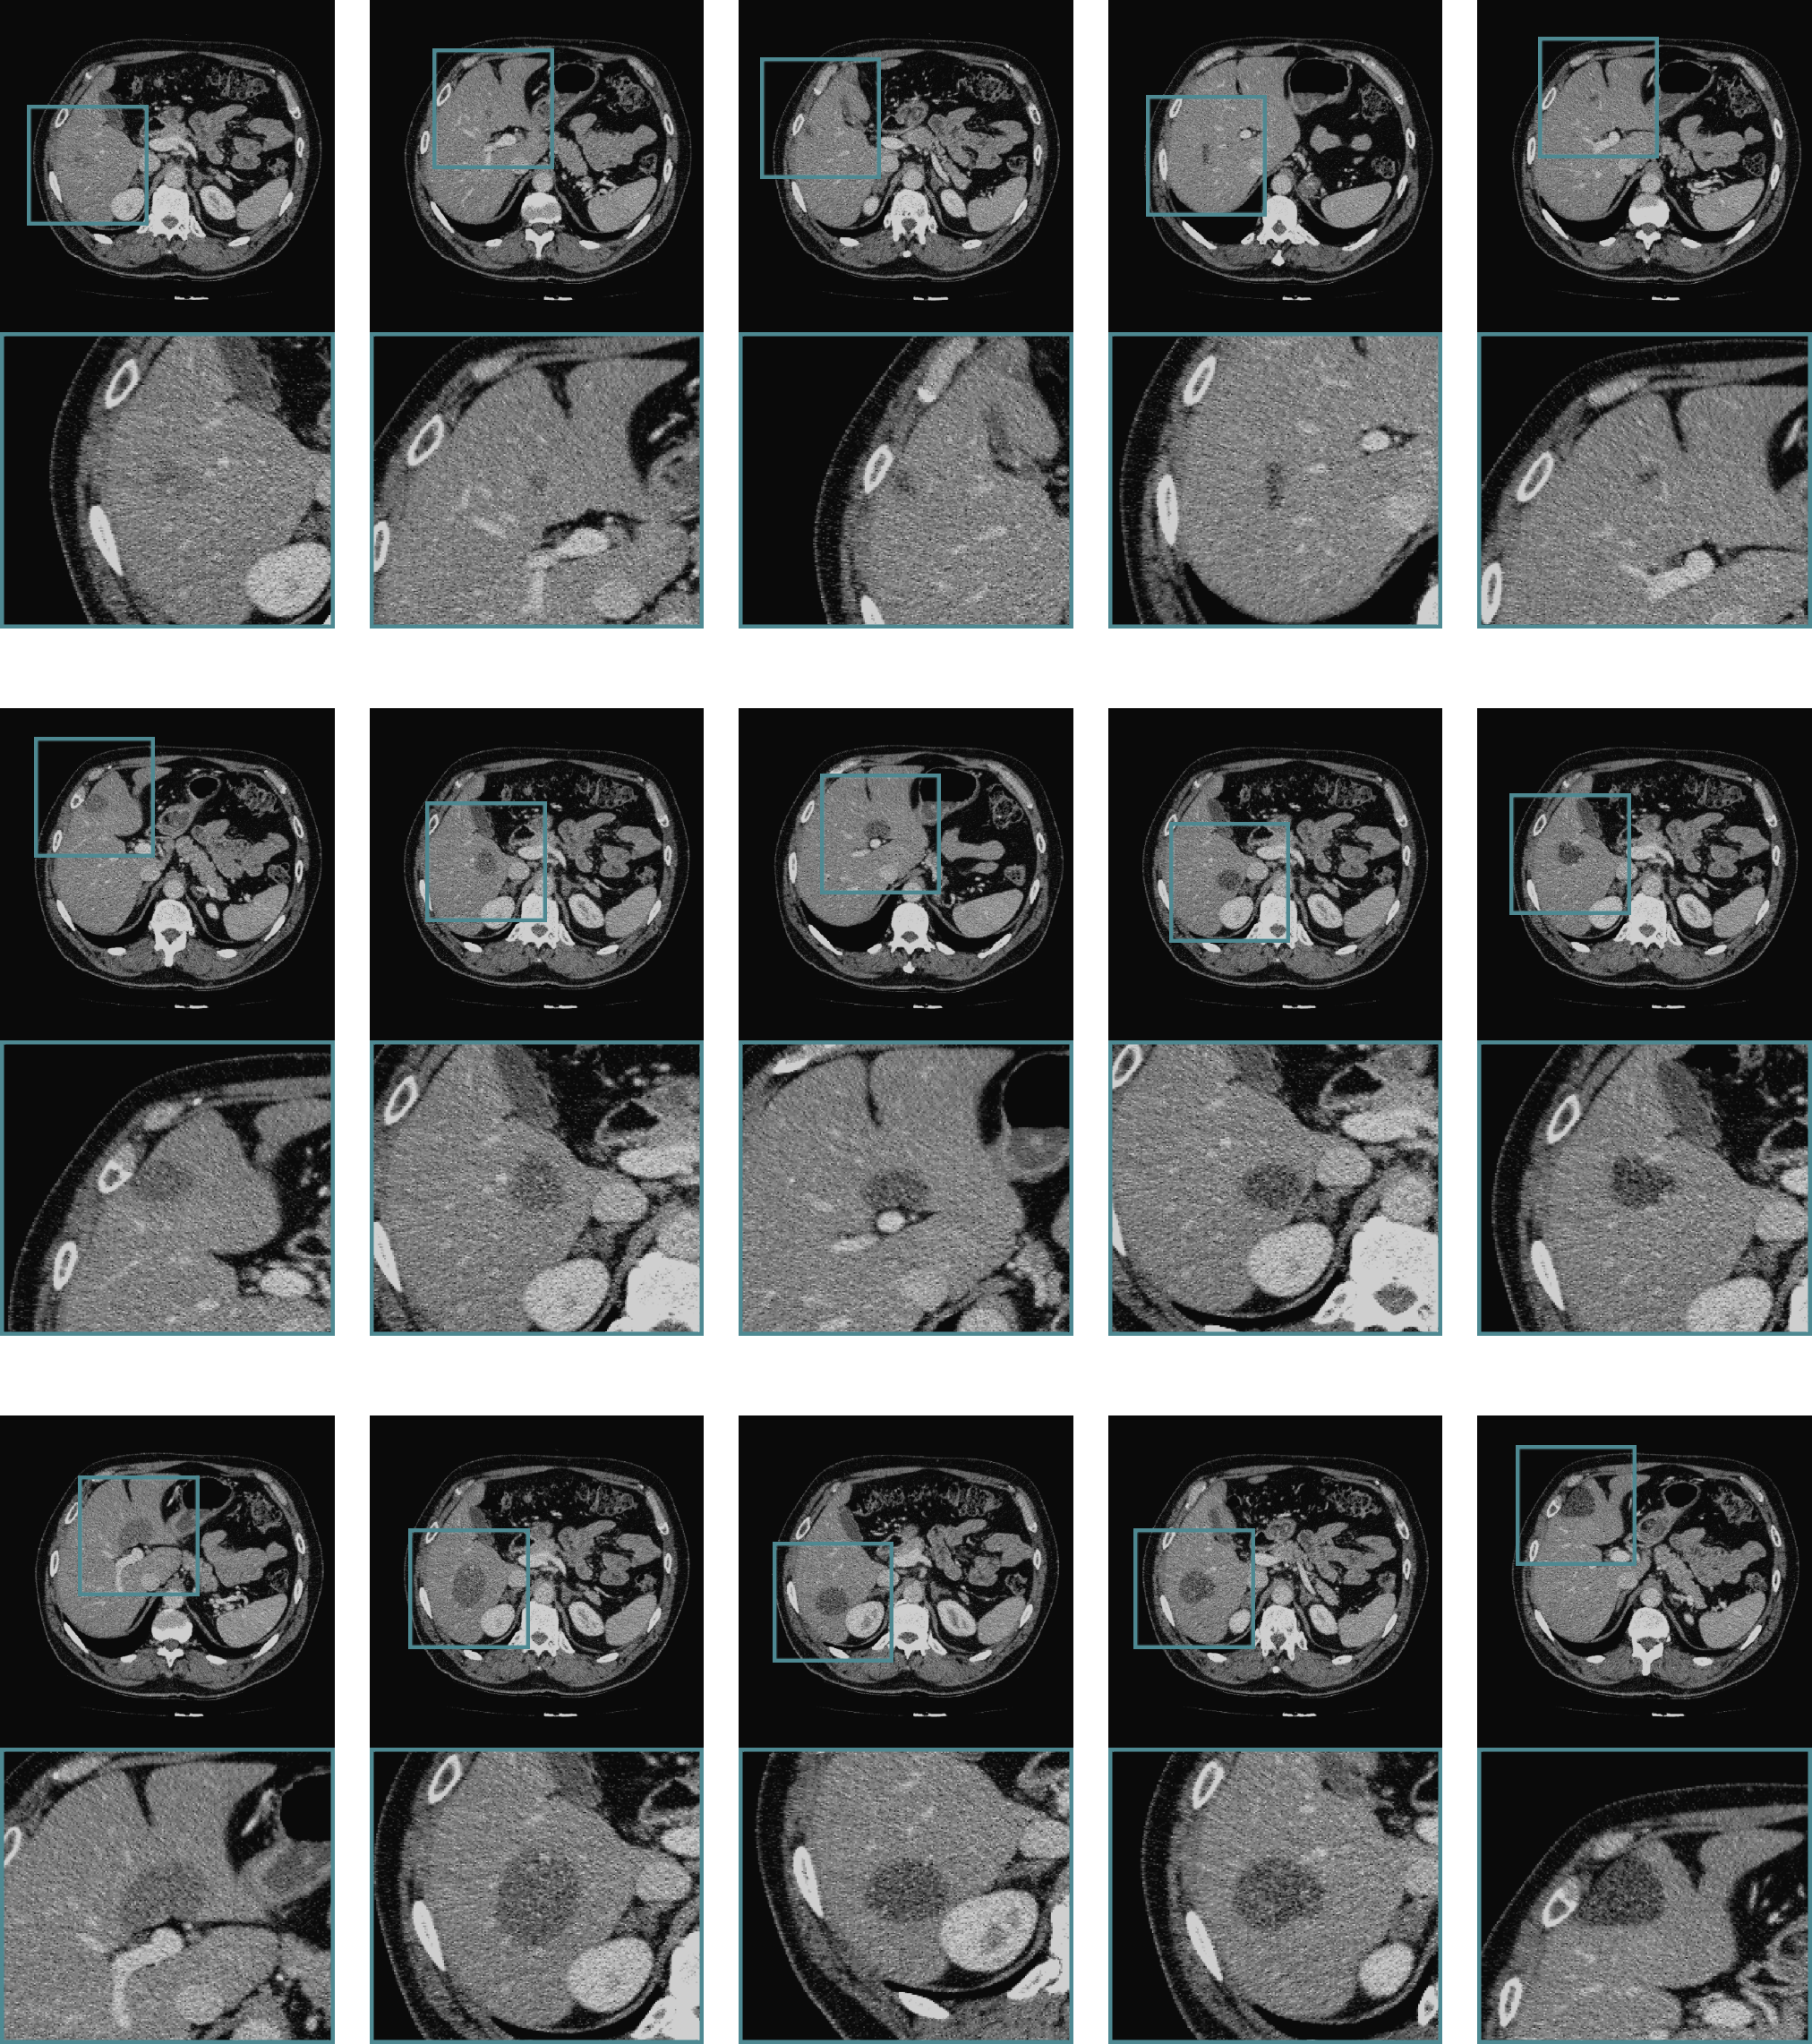
To minimize annotation expenses, generating synthetic tumors is an emerging research topic. Early attempts include, but only limited to, synthesizing COVID-19 infections [yao2021label, lyu2022pseudo], lung nodules [han2019synthesizing] abdominal tumors [jin2021free], diabetic lesions [wang2022anomaly], and brain tumors [wyatt2022anoddpm]. However, the synthetic tumors in those studies appear very different from the real tumors; due to this, AI models trained using synthetic tumors perform significantly worse than those trained using real tumors. What makes synthesizing tumors so hard? There are several important factors: shape, intensity, size, location, and texture. In this paper, we handcraft a strategy to synthesize liver tumors in abdominal CT scans. Our key novelties include (i) location without collision with vessels, (ii) texture with scaled-up Gaussian noise, and (iii) shape generated from distorted ellipsoids. These three aspects are proposed according to the clinical knowledge of liver tumors (detailed in §3.2). The resulting synthetic tumors are realistic—even medical professionals usually confuse them with real tumors in the visual examination (Figure 1; Table 2). In addition, the model trained on our synthetic tumors achieves a Dice Similarity Coefficient (DSC) of 59.81% for segmenting real liver tumors, whereas AI trained on real tumors obtains a DSC of 57.63% (Figure 2), showing that synthetic tumors have the potential to be used as an alternative to real tumors in training AI models.
These results are exciting because using synthetic tumors only, no previous work has thus far reached a similar (or even close) performance to the model trained on real tumors [hu2022synthetic]. Moreover, our synthesizing strategy can exhaustively generate tumors with desired locations, sizes, shapes, textures, and intensities, which are not limited to a fixed finite-size training set (the well-known limitation of the conventional training paradigm [yuille2021deep]). For example, it is hard to collect sufficient training examples with small tumors. It is because early-stage tumors may not cause symptoms, which can delay detection, and these tumors are relatively small and exhibit subtle abnormal textures that make it difficult for radiologists to manually delineate the tumor boundaries. In contrast, our synthesis strategy can generate a large number of examples featuring small tumors. The key contribution of ours is a synthetic tumor generator, which offers five advantages as summarized below.
- 1.
- 2.
- 3.
- 4.
- 5.
These results have the potential to stimulate a shift in the tumor segmentation training paradigm, as illustrated in Figure 2, from label-intensive to label-free AI development for tumor segmentation. Our ultimate goal is to train AI models for tumor segmentation without using manual annotation—this study makes a significant step towards it.
2 Related Work
Unsupervised anomaly segmentation. Anomaly segmentation is a challenging application area, especially for medical diagnosis [kermany2018identifying, xiang2021painting] and industrial defect detection [bergmann2019mvtec, huang2022self]. Compared with their supervised counterparts, unsupervised methods raises more attention for their low cost and scalability. The general unsupervised anomaly detection setting is to train with normal samples only, without any anomalous data, and no image-level annotation or pixel-level annotation is provided[roth2022towards, schlegl2019f, kingma2013auto]. Under the unsupervised setting, some previous works use self-organizing maps for unsupervised anomaly detection [munoz1998self, li2021anomaly] and Huang et al. [huang2022self] introduced gradient magnitude similarity and structured similarity index losses in addition to mean square error to compute the loss of image reconstruction. Evidenced in Table 3, our label-free synthetic tumors achieve a significantly better performance in unsupervised tumor segmentation than some of the most recent work in this area.
Tumor synthesis. Successful works about tumor synthesis include polyp detection from colonoscopy videos [shin2018abnormal], COVID-19 detection from Chest CT [yao2021label, lyu2022pseudo], diabetic lesion detection from retinal images [wang2022anomaly], cancer detection from fluorescence microscopy images [horvath2022metgan], and brain tumor detection from MRI [wyatt2022anoddpm]. However, these works are restricted to the types of tumors, and other diseases, that are fairly easy to visually identify in CT scans. Most recently, Zhang et al. [zhang2023self] synthesized liver and brain tumors for pre-training and adapted the model to tumor segmentation within the same organ under a low-annotation regime. The manually crafted “counterfeit” tumors in the related work appear very differently from real tumors. As a result, AI algorithms, trained on synthetic tumors, may work well in detecting synthetic tumors in the test set but fail to recognize the actual tumors (evidenced in Table 3). We tackle these limitations by integrating radiologists in the tumor synthesis study for feedback (§3.2). This enables us to understand deeply about tumors, and in turn, benefit in developing AI algorithms to segment them more accurately.
Generalization from synthetic to real domains. The problem of domain generalization was introduced [blanchard2011generalizing] for zero-shot adaptation to data with a domain gap. Specifically, the goal is to make a model using data from a single or multiple related source domain(s) while achieving great generalization ability well to any target domain(s) [zhou2022domain, wang2022generalizing]. In this paper, evaluating the model generalization ability on real data is of great importance to justify whether our tumor generator is powerful enough. Domain generalization has been widely studied in multiple computer vision tasks like object recognition [li2017deeper, feature_critic], semantic segmentation [volpi2019addressing, yue2019domain] and medical imaging [liu2020ms, liu2020shape]. As deep learning models are data hungry and annotated data are very expensive, how to train a model with synthetic data but generalize well to real data has been targeted in some previous works [fang2013unbiased, chen2020automated, chen2021contrastive] and some datasets [peng2017visda, ganin2015unsupervised, ros2016synthia, cordts2016cityscapes, richter2016playing] are created for benchmark and further exploring. While previous works focus on preserving the transferable knowledge learned from synthetic data, our paper aims to prove that our tumor generator is powerful enough to generate tumors with reasonable domain gap and that our model has outstanding generalization ability to detect real tumors (detailed in Section 5.3).

3 Method
3.1 Tumor Generation
To localize the liver, we first apply the pre-trained nnU-Net111The off-the-shield, pre-trained nnU-Net [isensee2021nnu] for liver segmentation can be downloaded here, which can achieve an average DSC of 95% on unseen CT scans (sufficient for a coarse localization of the liver). to the CT scans. With a coarse location of the liver available, we then develop a sequence of morphological image-processing operations to synthesize realistic tumors within the liver (see Figure 3). The tumor generation consists of four steps: (1) location selection, (2) texture generation, (3) shape generation, and (4) post-processing.
Location selection. The first step is to select a proper location for the tumor. This step is crucial because liver tumors usually do not allow any vessels (e.g., hepatic vein, portal vein, and inferior vena cava) to pass through them. To avoid the blood vessels, we first conduct vessel segmentation through the voxel value thresholding [gonzalez2009digital]. The segmented vessel mask is given by the following equation:
| (1) |
where is the smoothed CT scan, , by applying a Gaussian filter with standard deviation to the original CT scans ; is the standard image filtering operator. Smoothing can effectively eliminate noise caused by CT reconstruction. The threshold is set to a value slightly greater than the mean Hounsfield Unit (HU) of the liver.
| (2) |
where is the liver mask (background=0, liver=1), is point-wise multiplication, and is a hyperparameter.
With the vessel mask, one can detect whether a chosen location is at risk of making a tumor collide with vessels. After proposing a random location , we conduct the collision detection by judging whether there are blood vessels within the range of tumor radius . If , there is a risk of collision, so the location needs to be re-selected. This process iterates until a tumor location without collision is found. With the desirable tumor location, we are able to generate the tumor texture and shape.
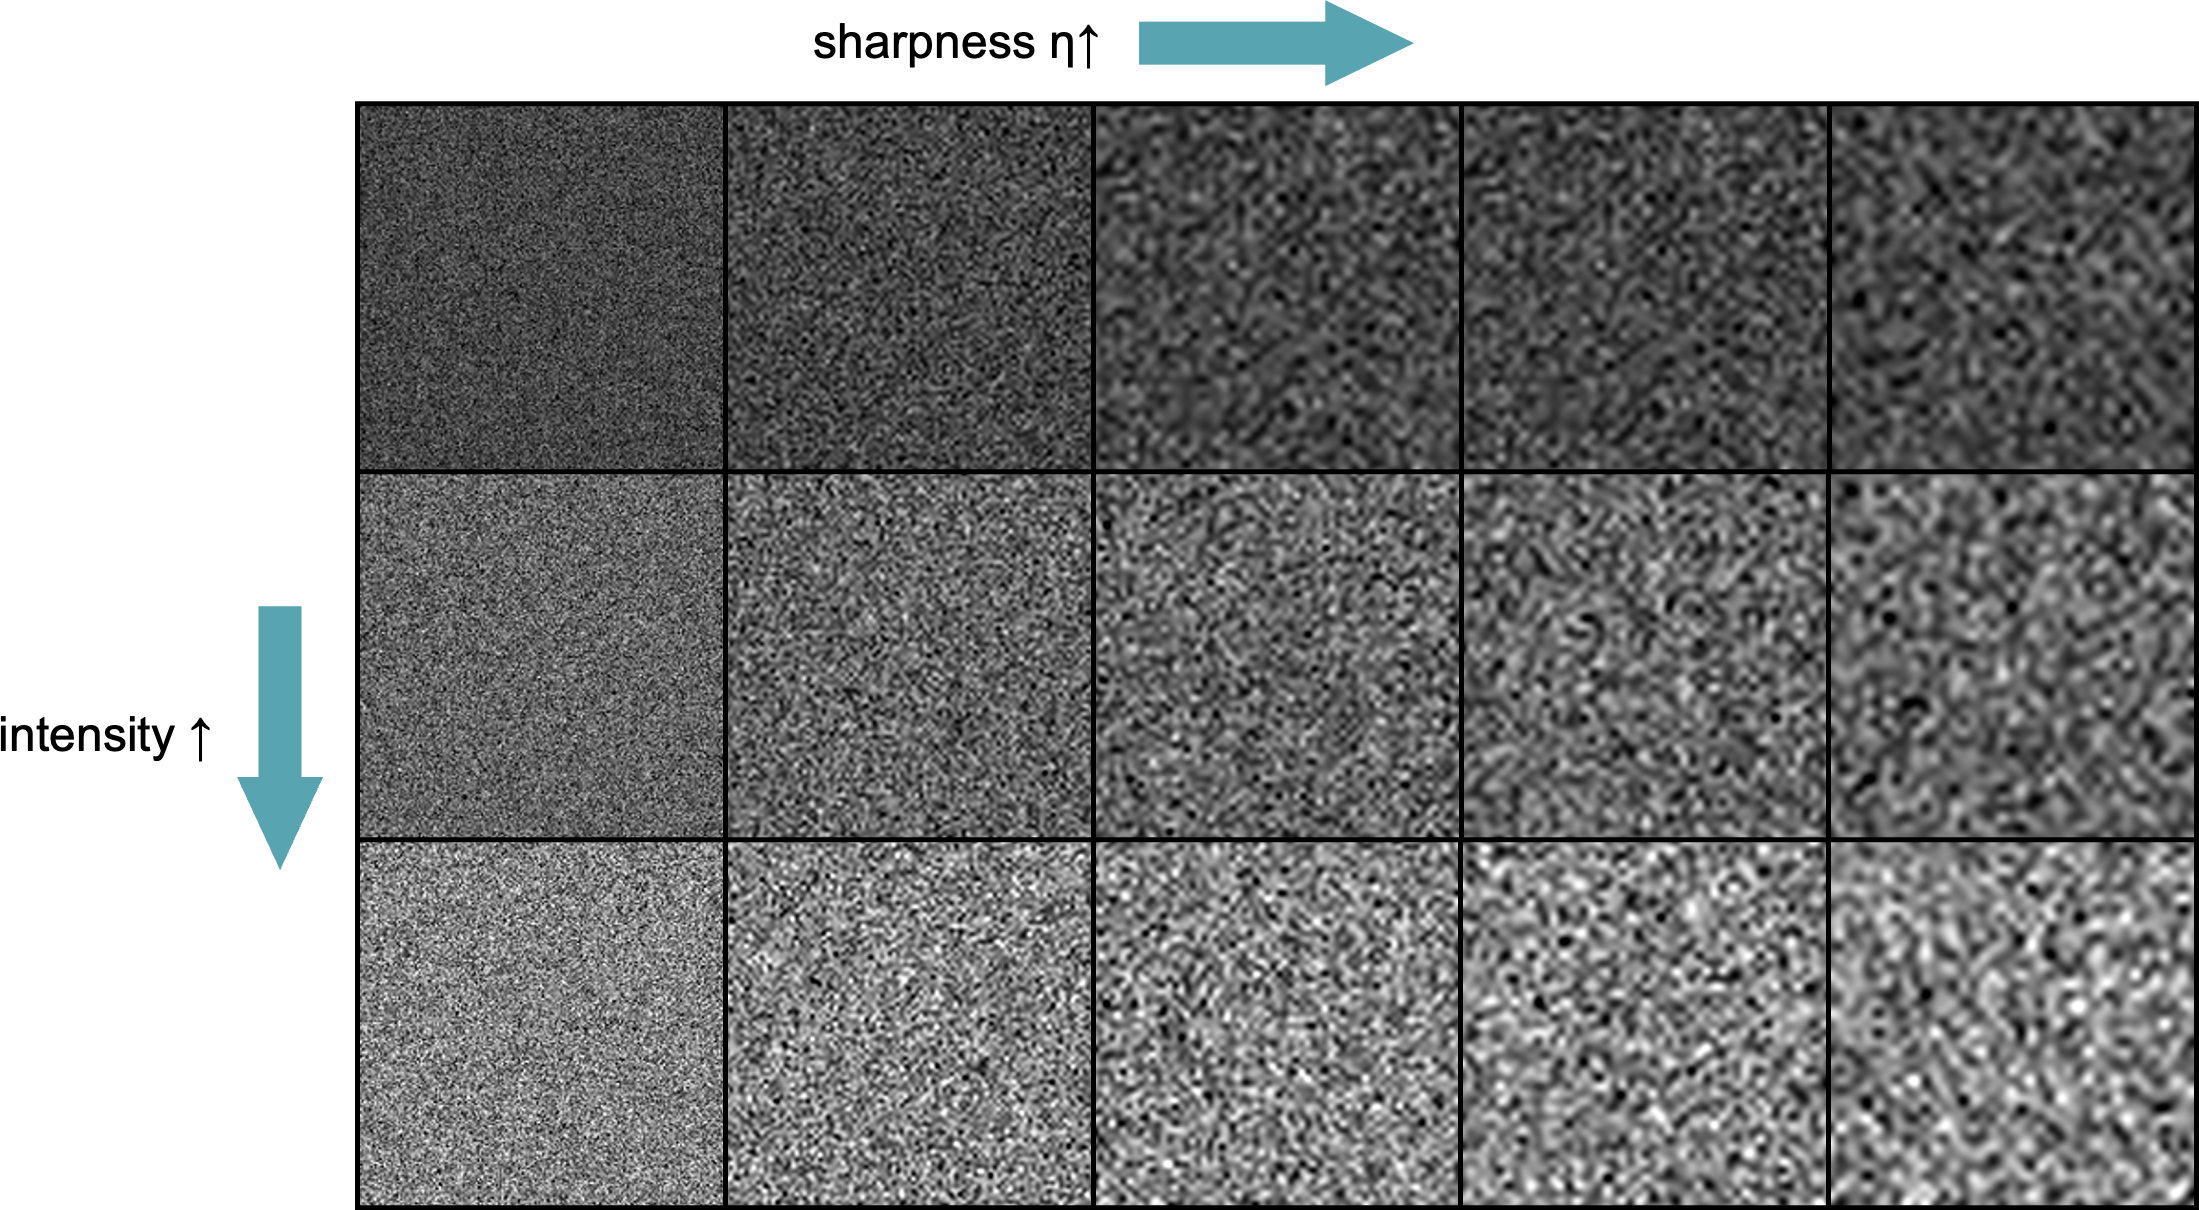
Texture generation. The HU values of liver and tumor textures follow the Gaussian distributions. To obtain realistic tumor textures, we first generate a 3D Gaussian noise with the predefined mean HU intensity and the same standard deviation as the hepatic parenchyma (the liver area excluding vessels), . Since the random Gaussian noise is usually too sharp as the texture for the tumor, we soften the texture by scaling it up with spline interpolation of the order 3 (cubic interpolation) on directions. The scaled-up texture is denoted as in this work, we want it exhibits graininess close to the hepatic parenchyma. The scaling factor determines how rough the generated grain feels. means the Gaussian texture is not scaled, resulting in large value fluctuation between adjacent voxels. Larger brings greater graininess, which may be similar to the real tumor texture. Finally, considering the tomography imaging quality, we further blur the texture with Gaussian filter
| (3) |
where is the standard deviation. After blurring, the texture resembles those generated by real imaging.
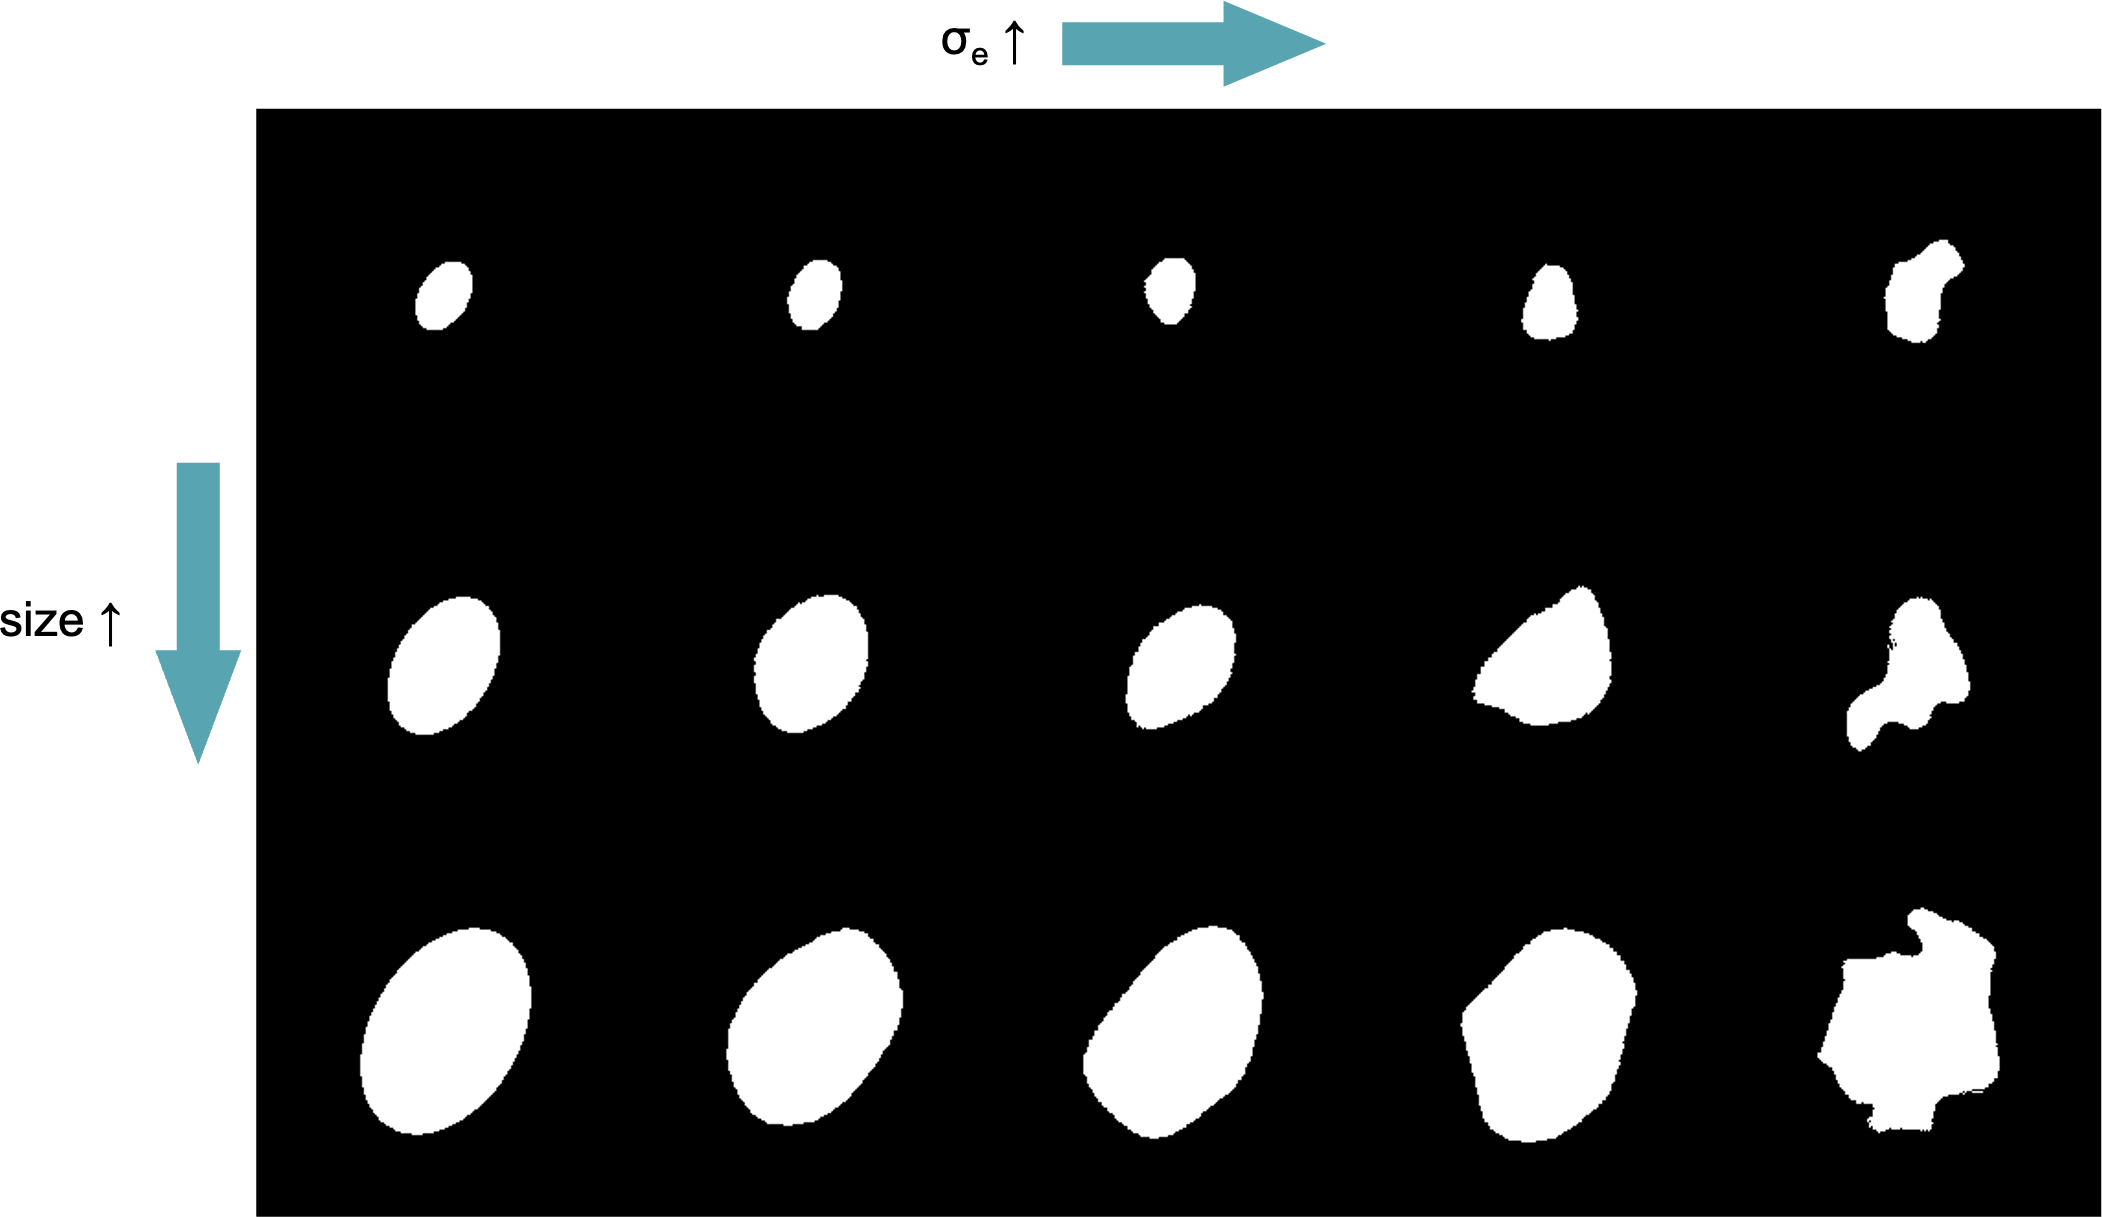
Shape generation. Most tumors grow from the centers and gradually swell, making small tumors (i.e., ) nearly spherical. This motivates us to generate tumor-like shapes with ellipsoids. We randomly sample the half-axis lengths of the ellipsoid for directions from a uniform distribution , and place the generated ellipsoid mask centered at . For a generated ellipsoid tumor mask (background=0, tumor=1), and with the same shape as the scanning volume ), elastic deformations [ogden1997non, ronneberger2015u], controlled by , are applied to enrich its diversity. The deformed tumor mask is more similar to the naturally grown tumors in appearance than simple ellipsoids. In addition, it can also improve the model’s robustness by learning the shape-semantic invariance. The deformed tumor mask is denoted as . In order to make the transition between the generated tumor and the surrounding liver parenchyma more natural, we finally blur the mask by applying a Gaussian filter with the standard deviation . To be more specifically, we obtain blur shape .
Post-processing. The first step of post-processing is placing the tumor on the scanning volume and corresponding liver mask . Assuming the tumor mask array and the texture array have the same shape as and . We can obtain new scanning volume with tumor through equation
| (4) | ||||
For the new mask with the tumor (bg=0,liver=1,tumor=2), it can be synthesized with . After placing the tumor, we adopt another two steps to make the generated tumor more realistic to medical professionals. They aim to simulate mass effect and the capsule appearance, respectively. Mass effect means the expanding tumor pushes its surrounding tissue apart. If the tumor grows large enough, it will compress the surrounding blood vessels to make them bend, or even cause the edge of the nearby liver to bulge. Local scaling warping [gustafsson1993interactive] is chosen in this work to implement mass effect. It remaps pixels in a circle to be nearer to the circumference. For a pixel with a distance to the circle center, the remapped pixel distance is
| (5) |
where is the radius of the expanded circular area, is a hyper-parameter for controlling the expansion intensity. Larger leads to stronger warping. Note that when , the remapping reduces to the identity function . The remapping procedure is conducted on both scanning and mask volumes. After warping, they are named and . The latter one (liver/tumor segmentation label) is now ready for the subsequent training. Finally, we simulate the capsule appearance by brightening the tumor edge. The edge area can be obtained by
| (6) |
where and are the lower bound and upper bound for filtering the edge from tumor mask. Then we increase HU intensity of the blurred edge area to simulate the capsule
| (7) |
| (8) |
where is the pre-defined HU intensity difference between a tumor and its capsule. The new scanning volume is now ready for training or Turing test. The parameters we use are shown in Table 1. Visualization examples can be found in Appendix Figures 8–10.
| parameter | value | parameter | value |
| 15 | |||
3.2 Clinical Knowledge about Liver Tumors
This work focus on generating hepatocellular carcinomas (tumor grown from liver cells). After the contrast injection, the clinical examination process of liver is divided into three phases, arterial phase (30s after injection), portal venous phase (60–70s after injection), and delay phase (3min after injection). Typically, only the first two phases are used for detecting hepatocellular carcinomas, and the tumor HU intensity value in different stages distributes differently. The mean attenuation measurement of the lesions in the hepatic arterial phase was 111 HU (range, 32–207 HU), and it decreased in the portal venous phase to a mean of 106 HU (range, 36–162 HU). There was a mean difference of 26 HU (range, –44 to 146 HU) between the lesion and liver in the arterial phase. On average, the hepatocellular carcinomas measured 11 HU (range, –98 to 61 HU) less than the adjacent liver parenchyma in the portal venous phase [lee2004triple]. The distributional characteristics help us determine the generated mean tumor HU values.
The location, shape, and number of tumors depend on how severe the hepatocellular carcinomas are according to the standardized guidance of the Liver Imaging Reporting and Data System (LI-RADS) [m2021use]. Milder carcinomas usually lead to smaller, fewer spherical lesions. Only one small tumor emerges in most cases. While multi-focal lesions, which means scattered small tumors, only appear in seldom cases. Severe carcinomas usually present a satellite lesion, a large lesion surrounded by a cluster of small lesions. The large central lesion also takes on a more irregular shape than small lesions. And also, larger tumors usually display evident mass effects, accompanied by capsule appearances that separate the tumor from the liver parenchyma.
4 Experiments
Datasets. Detailed per-voxel annotations for liver tumors are provided in LiTS [bilic2019liver]. The volume of liver tumors ranges from 38mm3 to 349 cm3, and the radius of tumors is in the range of [2, 44]mm. We perform 5-fold cross-validation, following the same split as in Tang et al. [tang2022self]. An AI model (e.g. U-Net) is trained on 101 CT scans with annotated liver and liver tumors. For comparison, a dataset of 116 CT scans with healthy livers is assembled from CHAOS [kavur2021chaos] (20 CT scans), BTCV [landman2015] (47 CT scans), Pancreas-CT [TCIA_data] (38 CT scans) and health subjects in LiTS (11 CT scans). We then generate tumors in these scans on the fly, resulting in enormous image-label pairs of synthetic tumors for training the AI model. We generate five levels of tumor sizes for model training; the parameters and examples can be found in Appendix Table 6 and Figure 11.
| junior professional | senior professional | ||||
| real () | synt () | real () | synt () | ||
| truth | real () | 5 | 15 | 10 | 2 |
| synt () | 21 | 8 | 7 | 12 | |
-
•
1The junior professional achieves an Accuracy, Sensitivity, and Specificity of 26.5%, 27.6%, and 25.0%. One CT scan is marked unsure.
-
•
2The senior professional achieves an Accuracy, Sensitivity, and Specificity of 71.0%, 63.2%, and 83.3%. 19 CT scans are marked unsure.
| tumors | method | architecture | labeled / unlabeled CTs | DSC (%) [95% CI] | NSD (%) [95% CI] |
| none | PatchCore [roth2022towards] | Wide-Resnet50-2 [zagoruyko2016wide] | 0 / 116 | 15.97 [11.86–20.09] | 16.43 [10.42–22.44] |
| none | f-AnoGAN [schlegl2019f] | Customized [baur2021autoencoders] | 0 / 116 | 19.00 [13.88–24.11] | 16.94 [11.97–21.91] |
| none | VAE [kingma2013auto] | Customized [baur2021autoencoders] | 0 / 116 | 24.63 [19.83–29.44] | 23.63 [18.44–28.83] |
| synt | Yao et al. [yao2021label] | U-Net [ronneberger2015u] | 0 / 116 | 32.79 [28.66–36.92] | 31.28 [26.87–35.70] |
| real | fully-supervised | U-Net | 101 / 0 | 57.51 [52.24–62.79] | 58.04 [52.56–63.52] |
| synt | label-free (ours) | U-Net | 0 / 116 | 59.77 [54.54–64.99] | 61.29 [56.12–66.47] |
Evaluation metrics. Tumor segmentation performance was evaluated by Dice similarity coefficient (DSC) and Normalized Surface Dice (NSD) with 2mm tolerance; tumor detection performance was evaluated by Sensitivity and Specificity. For all the metrics above, 95% CIs were calculated and the p-value cutoff of less than 0.05 was used for defining statistical significance.
Implementation. Our codes are implemented based on the MONAI222https://monai.io/ framework for both U-Net and Swin UNETR. Input images are clipped with the window range of [-21,189] and then normalized to have zero mean and unit standard deviation. Random patches of were cropped from 3D image volumes during training. All models are trained for 4,000 epochs, and the base learning rate is 0.0002. The batch size is two per GPU. We adopt the linear warmup strategy and the cosine annealing learning rate schedule. For inference, we use the sliding window strategy by setting the overlapping area ratio to 0.75.


| shape | size | texture | intensity | location | |||||||||||
| 2 | 3 | 2 | 3 | 2 | 3 | 2 | 3 | 2 | 3 | ||||||
| UNet++ [zhou2019unet++] | 81.84 | 85.78 | 84.35 | 68.45 | 63.01 | 9.27 | 75.92 | 85.75 | 82.54 | 90.16 | 75.58 | 26.99 | 84.12 | 83.89 | 81.49 |
| nnU-Net [isensee2021nnu] | 82.18 | 83.85 | 85.44 | 80.23 | 59.55 | 5.39 | 84.91 | 88.47 | 84.18 | 91.60 | 83.61 | 30.53 | 84.84 | 85.42 | 84.06 |
| Swin UNETR [tang2022self] | 81.79 | 81.82 | 82.37 | 82.62 | 65.95 | 26.08 | 85.43 | 86.12 | 82.31 | 88.95 | 79.36 | 12.87 | 84.05 | 82.71 | 80.23 |
5 Results & Discussion
Using 116 CT scans from Pancreas-CT, CHAOS, and BTCV with our label-free tumor generator, we outperformed all those methods on the LiTS benchmark, wherein previous methods used 101 CT scans and annotations from LiTS.
5.1 Clinical Validation using Visual Turing Test
We conduct the Visual Turing Test [geman2015visual] on 50 CT scans, where 20 scans are with real tumors from LiTS, and the remaining 30 scans are healthy livers from WORD [luo2022word] with synthetic tumors. Two professionals with different experience levels take part in this test. They can inspect each sample in 3D view, which means continuous variation of slice sequence can be observed by scrolling the mouse. This is an important setting for the test because some important tumor characteristics are not obvious in a 2D view (e.g., vessel collision). In the test, professionals can label each sample as real, synthetic or unsure. When calculating the performance metrics, only the samples with definite results are counted.
The testing results are shown in Table 2. For junior professionals with 6-year experience, definite judgments of 49 out of 50 samples are given. All of the accuracy, sensitivity, and specificity are below 30%, which means the generated samples succeed in confusing the junior professional. In particular, the sensitivity of 27.6% means that the rest 72.4% synthetic samples are mistakenly regarded as real samples. The result verifies that our synthesis method can generate realistic tumors. According to the results given by the senior professional with 15-year experience, 36.8% synthetic samples seemed to be real, indicating that nearly half of the generated samples can tease senior professionals. Noteworthy, the senior professional only gives 19 judgments among all 30 synthetic samples. Adding up misjudged samples and uncertain samples, a total of 18 out of 30 generated samples have confused him/her.
5.2 Comparison with State-of-the-art Methods
We compare our label-free tumor synthesis strategy with several prominent unsupervised tumor segmentation methods designed for both natural and medical images, such as PatchCore [roth2022towards], f-AnoGAN [schlegl2019f], VAE [baur2021autoencoders], and the method proposed by Yao et al. [yao2021label]. To enhance the performance of these baseline methods, we focus solely on the liver region for training and testing to minimize noise caused by extraneous information. Table 3 shows that all the previous unsupervised methods exhibit suboptimal performance in segmenting real liver tumors. In contrast, our label-free tumor synthesis—a novel approach to unsupervised tumor segmentation—significantly outperforms all these methods, achieving a DSC of 59.77% and an NSD of 61.29%. On the other hand, the model trained on real tumors using fully supervised learning achieves a DSC of 57.51% and an NSD of 58.04%. These results highlight the potential of a paradigm shift from label-intensive to label-free tumor segmentation.
5.3 Generalization to Different Models and Data
We verify the generalizability of synthetic tumors using Swin UNETR333Swin UNETR is a hybrid segmentation architecture, which integrates the benefits of both U-Net [ronneberger2015u] and Transformer [dosovitskiy2020image, liu2021swin]. We select Swin UNETR because it is very competitive and has ranked first in numerous public benchmarks [tang2022self], including liver tumor segmentation (MSD-Liver). [hatamizadeh2022swin], including its Tiny, Small, and Base variants. Figure 4 shows that the model trained on real tumors performs slightly better than that on synthetic tumors, but there is no statistical difference between the two results as the p-value is greater than 0.05. In addition to evaluating the models on the LiTS dataset, we assess their domain generalization ability using data from other datasets444We first selected the tumor-free scans from these datasets and then had radiologists review each one of the scans to dismiss the diseased liver. (i.e., MSD-Pancreas, MSD-Spleen, MSD-Colon). As shown in the right panel of Figure 4, our model trained with healthy data collected from 3 different datasets shows better robustness than the model trained on real data only from LiTS, while achieving much higher Specificity on the three external datasets. It is noteworthy that higher Specificity (fewer false positives) is crucial in clinical applications as it reduces the number of patients subjected to invasive diagnostic procedures and their associated costs [brodersen2013long, xia2022felix, liu2023clip].
5.4 Potential in Small Tumor Detection
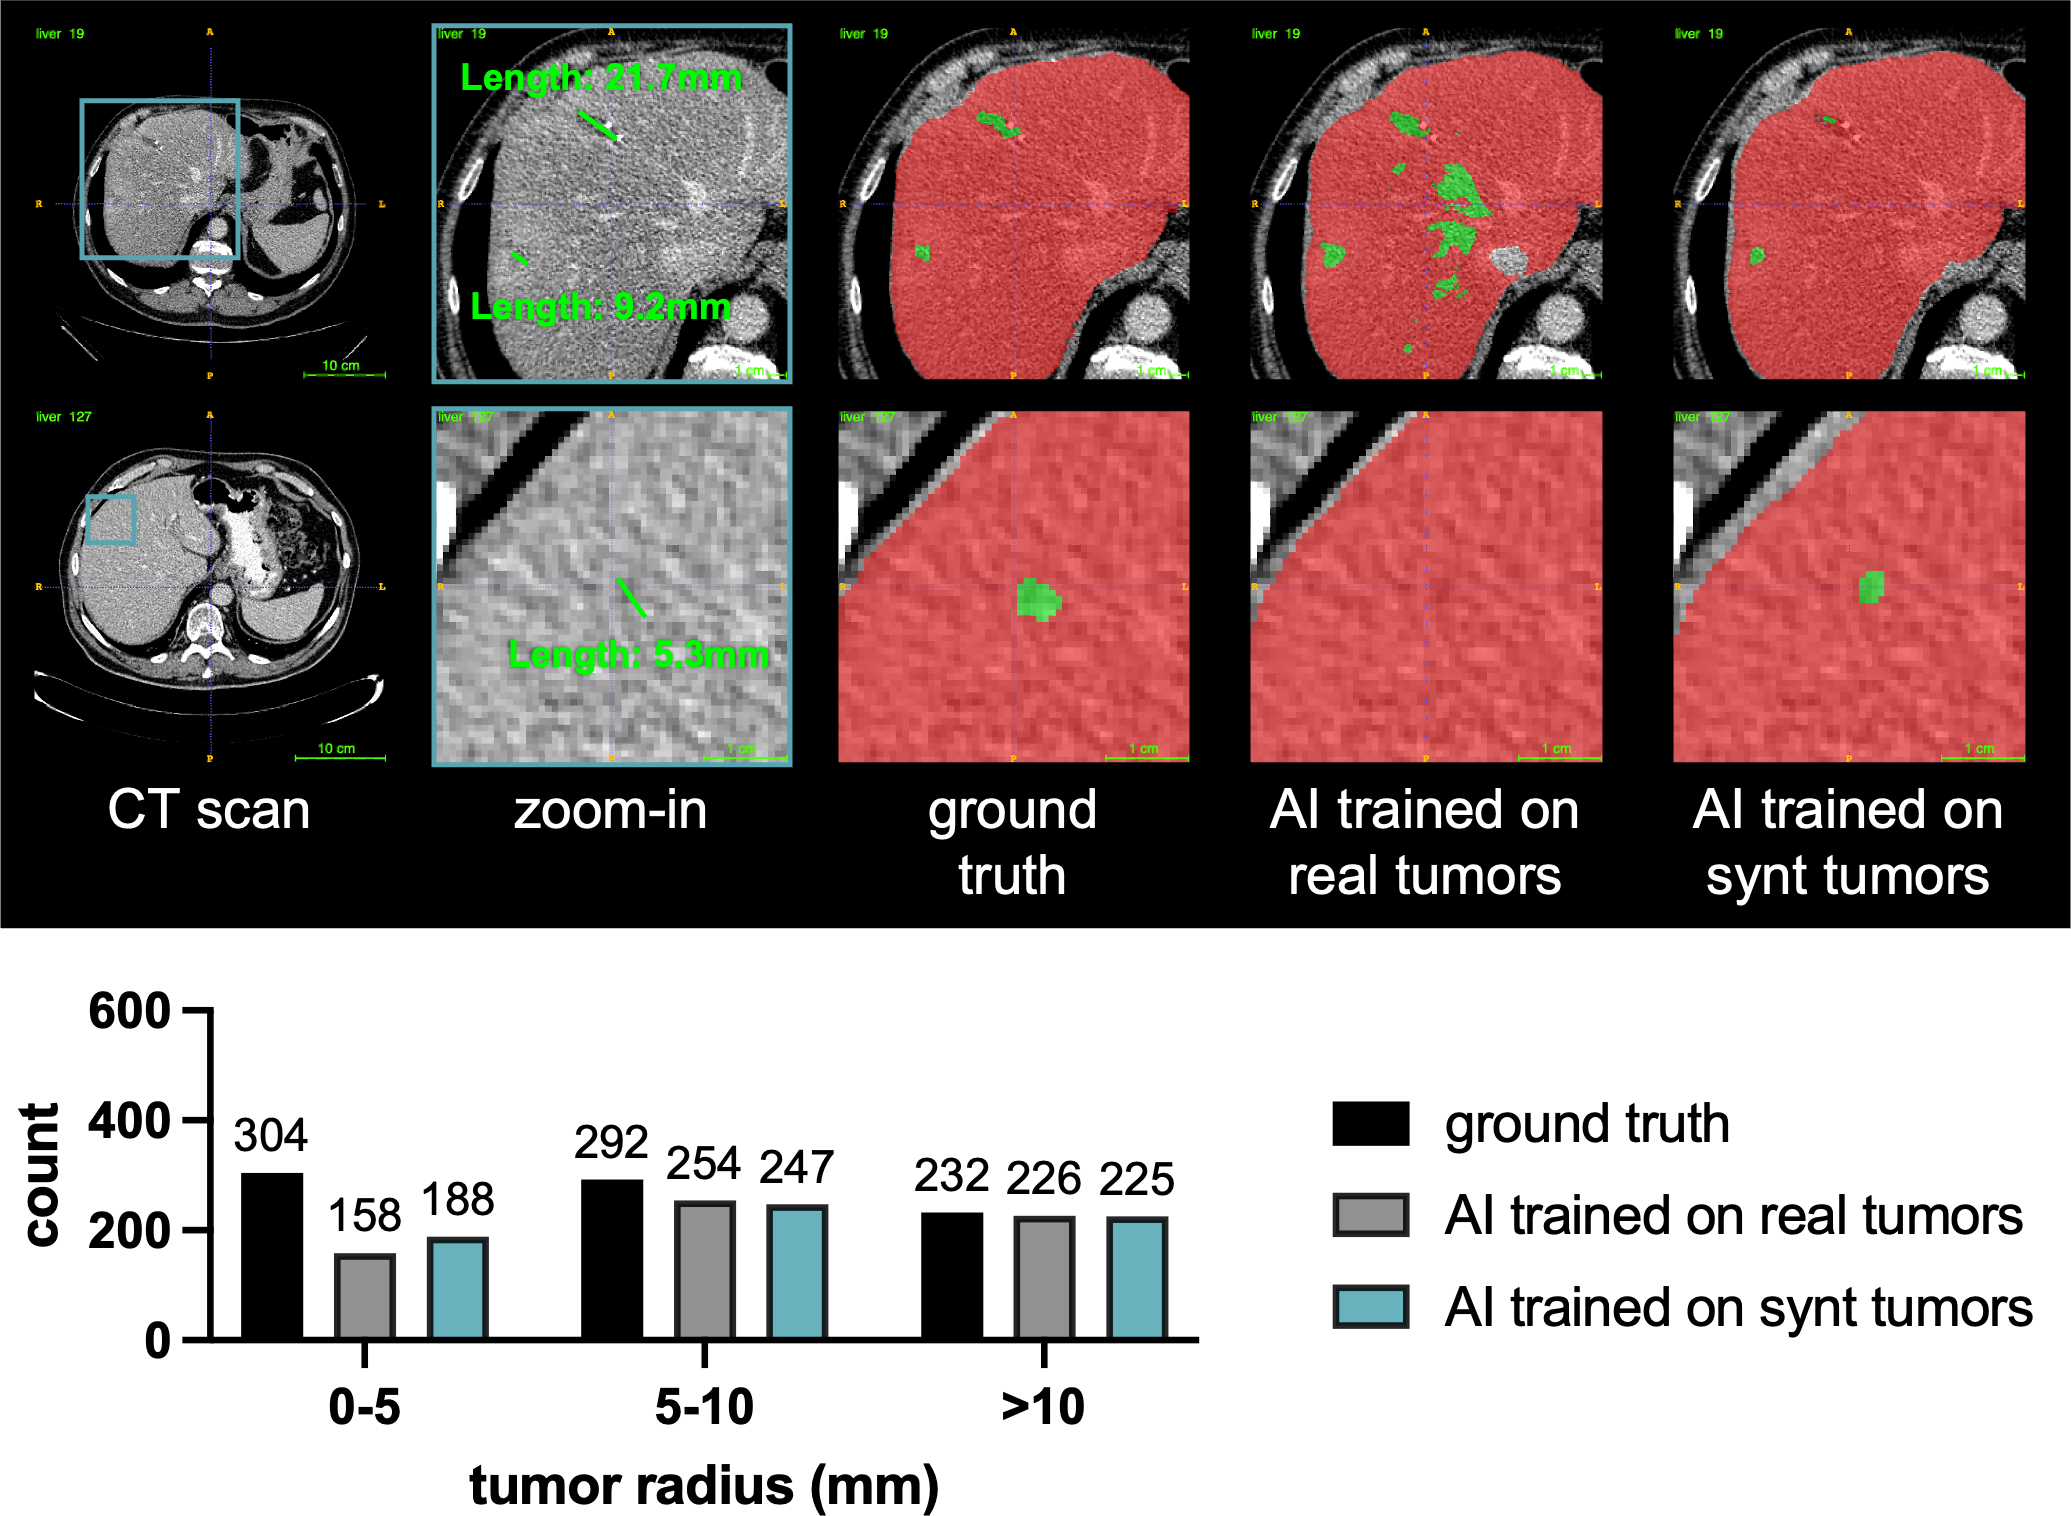
Early detection of small tumors is essential for prompt cancer diagnosis, but such cases are scarce in real datasets because most patients remain asymptomatic during the early stages. AI models trained on these datasets exhibit reduced detection sensitivity for small tumors (radius 5mm) compared with larger tumors (radius 5mm), displaying sensitivities of 52.0% and 91.6%, respectively. Thus, an advanced tumor generator could create synthetic data containing various tumor sizes for training and testing models, addressing the size imbalance issue found in real data. The lower panel of Figure 5 presents quantitative tumor detection performance stratified by tumor size, and the upper panel presents two cases with small tumors for qualitative comparison. Evidently, AI models (trained solely on synthetic data) outperform those trained on real tumors in detecting and segmenting small tumors in the liver. The results indicate that the generation of copious amounts of synthetic small tumors can improve the efficacy of models in detecting real small tumors, thereby playing a crucial role in the early detection of cancer.
5.5 Controllable Robustness Benchmark
Standard evaluation in medical imaging is limited to determining the effectiveness of AI in detecting tumors. This is because the number of annotated tumors in the existing test datasets is not big enough to be representative of the tumors that occur in real organs and, in particular, contains only a limited number of very small tumors. We show that synthetic tumors can serve as an accessible and comprehensive source for rigorously evaluating AI’s performance in detecting tumors at a variety of different sizes and locations with the organs. To be specific, our tumor generator can synthesize liver tumors varying in five dimensions, i.e. location, size, shape, intensity, and texture, by tuning hyperparameters in the tumor generation pipeline. Taking five different options in each dimension, our tumor generator could create 25 (55) variants for each single CT scan. Generating a large number of synthetic tumors during testing enables us to find failure scenarios of current AI models. After locating the worst cases of AI, we can synthesize and include worst-case tumors in the training set and fine-tune AI algorithms. Figure 6 illustrates the out-of-distribution (o.o.d.) benchmark created by synthetic tumors, wherein we evaluate several state-of-the-art models (trained on public datasets). These models show good robustness in the shape, location, and texture dimensions but are sensitive to tumors of extreme sizes and intensities.
| tiny size |
|
edge blurring |
|
|
||||||
| ✓ | 43.9 | 26.4 | ||||||||
| ✓ | ✓ | 47.1 | 51.3 | |||||||
| ✓ | ✓ | 50.3 | 54.1 | |||||||
| ✓ | ✓ | 52.6 | 33.4 | |||||||
| ✓ | ✓ | ✓ | 55.1 | 61.8 |
5.6 Ablation Study on Shape Generation
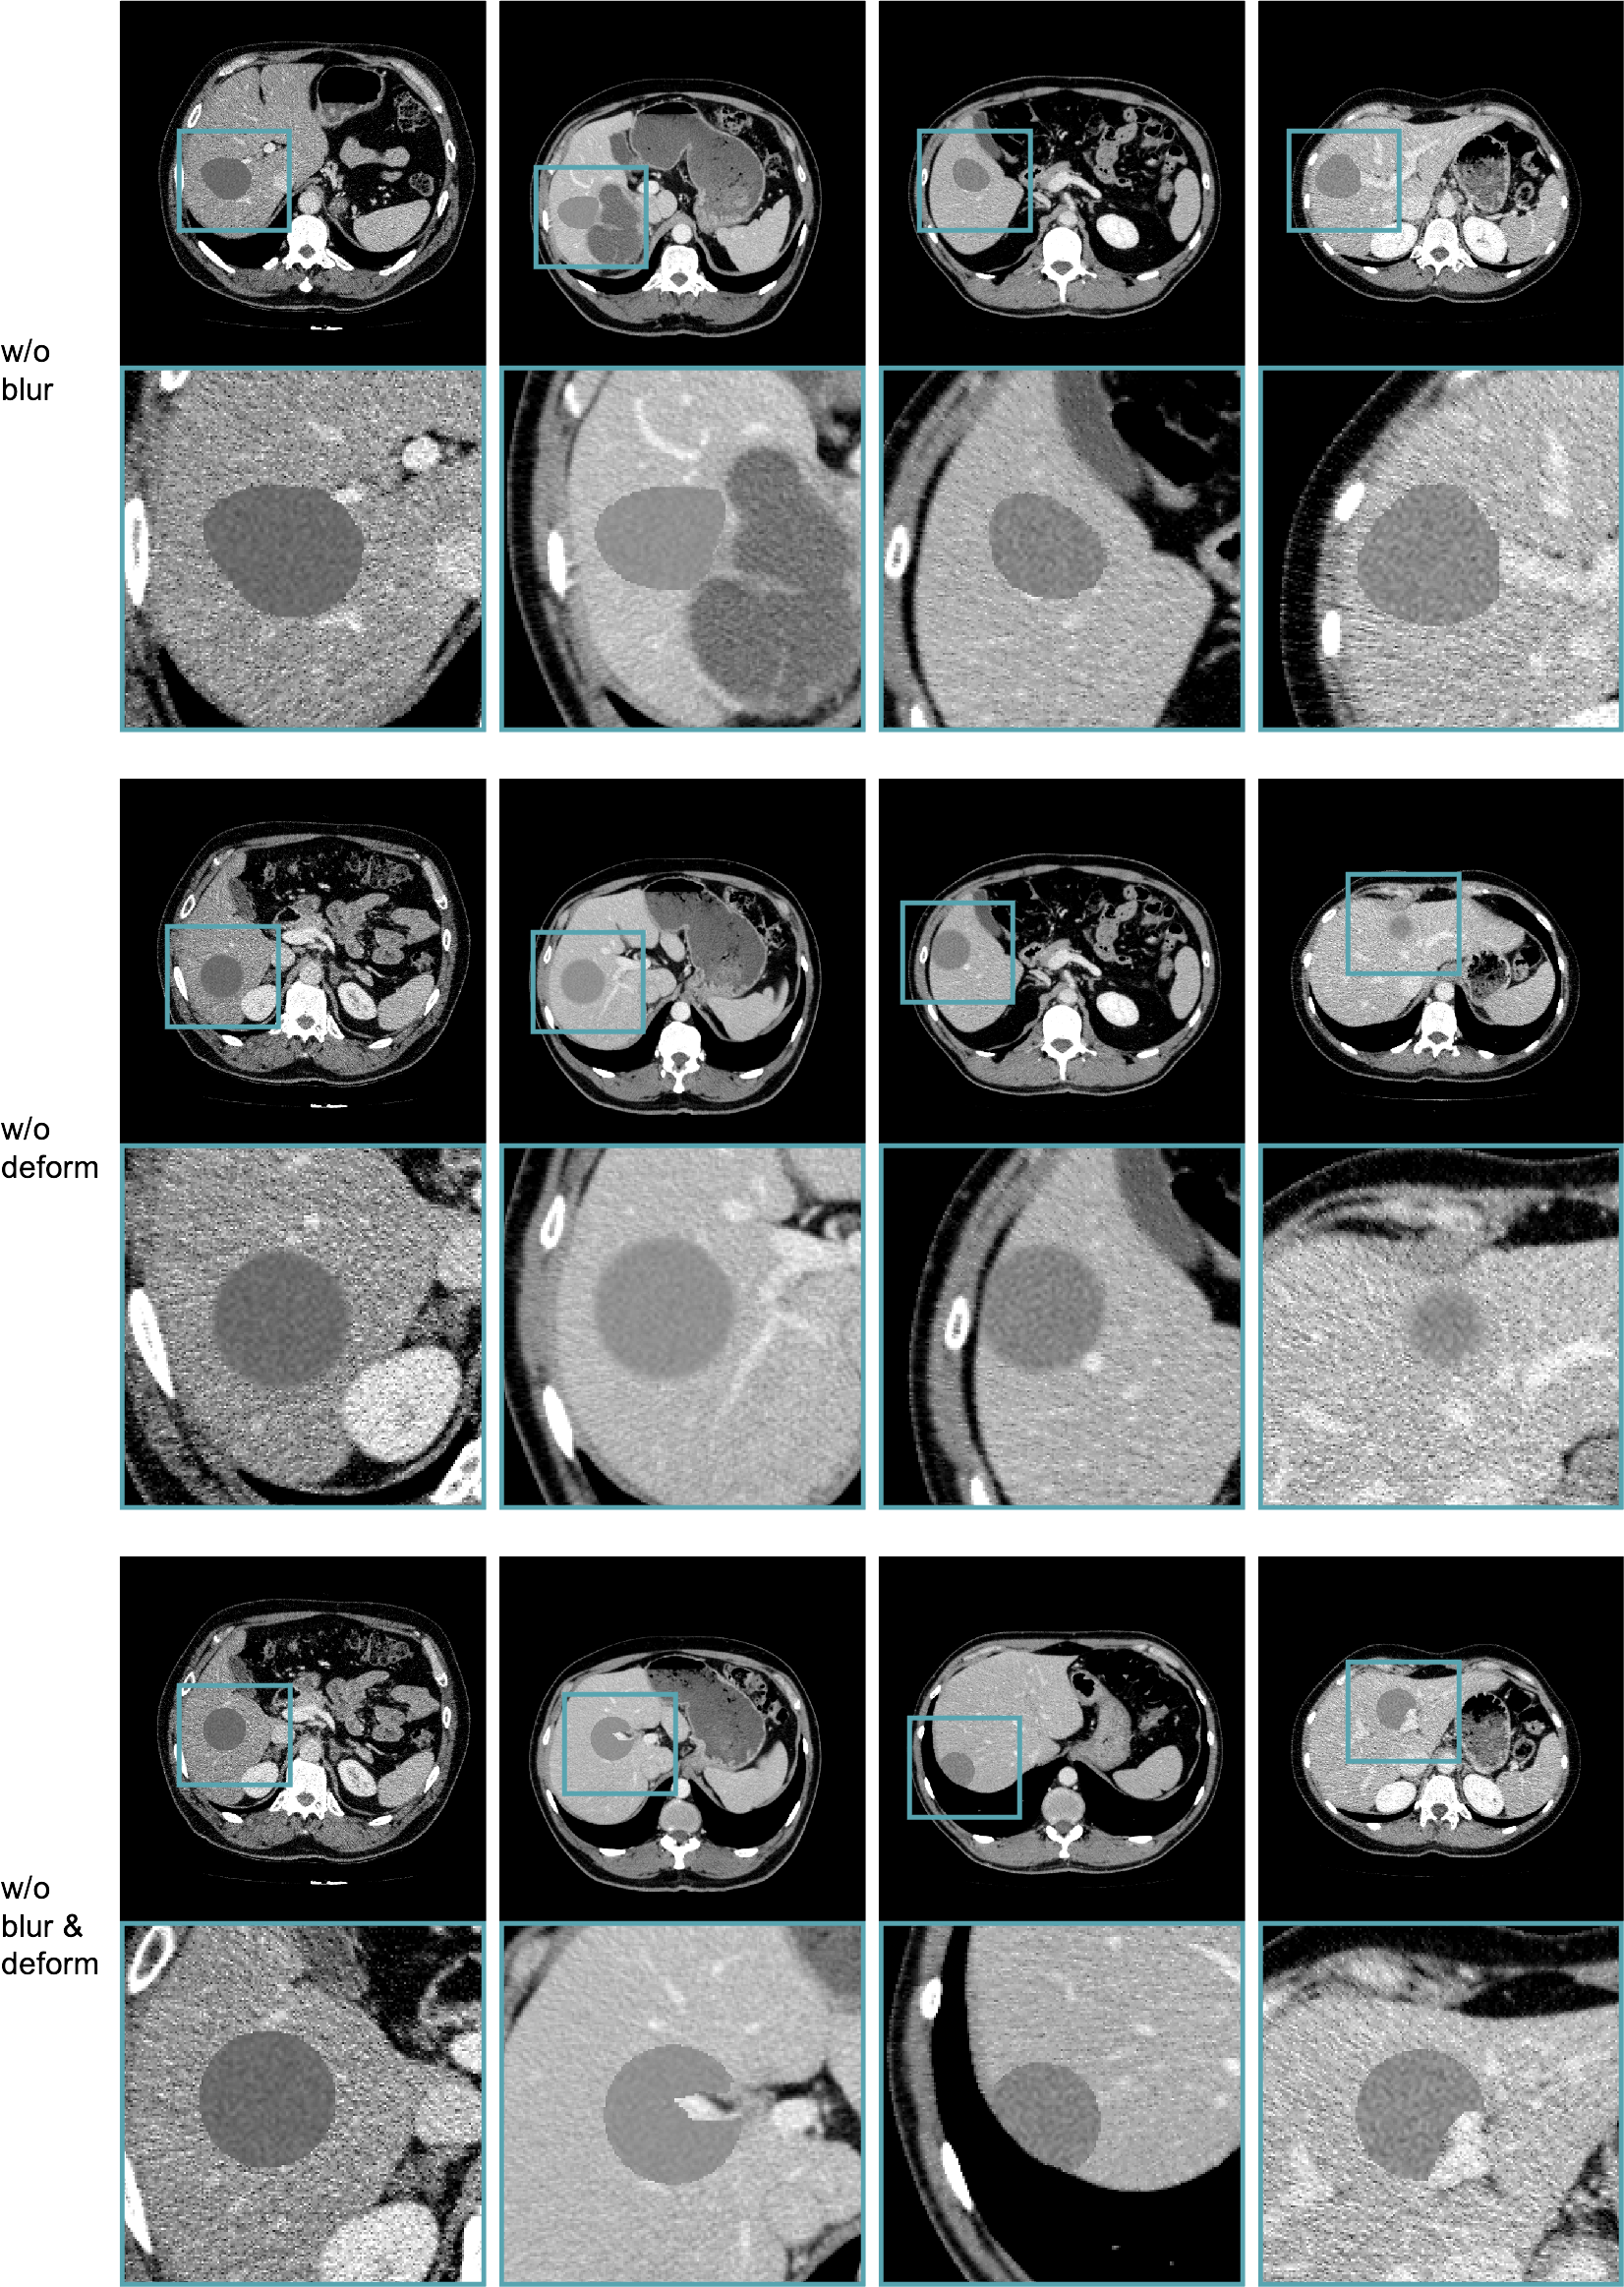
To show the importance of each step in tumor generation, we design ablation studies focusing on shape generation and synthesizing small tumors. We evaluate the models trained with different incomplete settings of synthetic strategies on two aspects: all tumor segmentation and small tumor detection. As shown in Table 4, the performance would be much poorer without synthesizing small tumors, edge blurring or elastic deformation in the shape generation. The reasons are simple: (1) without elastic deformation and edge blurring steps for shape generation (shown in Figure 3), the synthetic tumors can be extremely unrealistic (i.e. the edge is sharp and shape can only be ellipsoid). Several examples are provided in Appendix Figure 12. (2) The model doesn’t have the generalization ability to small tumors (radius 5mm) when the training set does not have them.
6 Conclusion
In this paper, we have developed an effective strategy to synthesize liver tumors. With zero manual annotation, we verify that the AI model trained on synthetic tumors can perform similarly to the ones trained on real tumors in the LiTS dataset (which took months to create). This reveals the great potential for the use of synthesis tumors to train AI models on larger-scale healthy CT datasets (which are much easier to obtain than CT scans with liver tumors). Furthermore, synthetic tumors allow us to assess AI’s capability of detecting tumors of varying locations, sizes, shapes, intensities, textures, and stages in CT scans. In the future, we will consider generative adversarial nets (GANs) [goodfellow2020generative, han2019synthesizing], Diffusion Models [ho2020denoising] and possibly improved with 3D geometry models like NeRF [mildenhall2021nerf] to generate better tumor texture.
Acknowledgements. This work was supported by the Lustgarten Foundation for Pancreatic Cancer Research and partially by the Patrick J. McGovern Foundation Award. We appreciate the effort of the MONAI Team to provide open-source code for the community. We thank Yucheng Tang, Huimiao Chen, Bowen Li, Jessica Han, and Wenxuan Li for their constructive suggestions; thank Camille Torrico and Alexa Delaney for improving the writing of this paper. Paper content is covered by patents pending.
References
- [1] Michela Antonelli, Annika Reinke, Spyridon Bakas, Keyvan Farahani, Annette Kopp-Schneider, Bennett A Landman, Geert Litjens, Bjoern Menze, Olaf Ronneberger, Ronald M Summers, et al. The medical segmentation decathlon. Nature communications, 13(1):1–13, 2022.
- [2] Michela Antonelli, Annika Reinke, Spyridon Bakas, Keyvan Farahani, Bennett A Landman, Geert Litjens, Bjoern Menze, Olaf Ronneberger, Ronald M Summers, Bram van Ginneken, et al. The medical segmentation decathlon. arXiv preprint arXiv:2106.05735, 2021.
- [3] Christoph Baur, Stefan Denner, Benedikt Wiestler, Nassir Navab, and Shadi Albarqouni. Autoencoders for unsupervised anomaly segmentation in brain mr images: a comparative study. Medical Image Analysis, 69:101952, 2021.
- [4] Paul Bergmann, Michael Fauser, David Sattlegger, and Carsten Steger. Mvtec ad–a comprehensive real-world dataset for unsupervised anomaly detection. In Proceedings of the IEEE/CVF conference on computer vision and pattern recognition, pages 9592–9600, 2019.
- [5] Patrick Bilic, Patrick Ferdinand Christ, Eugene Vorontsov, Grzegorz Chlebus, Hao Chen, Qi Dou, Chi-Wing Fu, Xiao Han, Pheng-Ann Heng, Jürgen Hesser, et al. The liver tumor segmentation benchmark (lits). arXiv preprint arXiv:1901.04056, 2019.
- [6] Gilles Blanchard, Gyemin Lee, and Clayton Scott. Generalizing from several related classification tasks to a new unlabeled sample. In NeurIPS, 2011.
- [7] John Brodersen and Volkert Dirk Siersma. Long-term psychosocial consequences of false-positive screening mammography. The Annals of Family Medicine, 11(2):106–115, 2013.
- [8] Wuyang Chen, Zhiding Yu, Shalini De Mello, Sifei Liu, Jose M. Alvarez, Zhangyang Wang, and Anima Anandkumar. Contrastive syn-to-real generalization. In ICLR, 2021.
- [9] Wuyang Chen, Zhiding Yu, Zhangyang Wang, and Animashree Anandkumar. Automated synthetic-to-real generalization. In International Conference on Machine Learning, pages 1746–1756. PMLR, 2020.
- [10] Marius Cordts, Mohamed Omran, Sebastian Ramos, Timo Rehfeld, Markus Enzweiler, Rodrigo Benenson, Uwe Franke, Stefan Roth, and Bernt Schiele. The cityscapes dataset for semantic urban scene understanding. In CVPR, 2016.
- [11] Alexey Dosovitskiy, Lucas Beyer, Alexander Kolesnikov, Dirk Weissenborn, Xiaohua Zhai, Thomas Unterthiner, Mostafa Dehghani, Matthias Minderer, Georg Heigold, Sylvain Gelly, et al. An image is worth 16x16 words: Transformers for image recognition at scale. International Conference on Learning Representations, 2020.
- [12] Bradley J Erickson. Imaging systems in radiology. In Biomedical Informatics, pages 733–753. Springer, 2021.
- [13] Chen Fang, Ye Xu, and Daniel N Rockmore. Unbiased metric learning: On the utilization of multiple datasets and web images for softening bias. In ICCV, 2013.
- [14] Yaroslav Ganin and Victor S. Lempitsky. Unsupervised domain adaptation by backpropagation. In ICML, 2015.
- [15] Donald Geman, Stuart Geman, Neil Hallonquist, and Laurent Younes. Visual turing test for computer vision systems. Proceedings of the National Academy of Sciences, 112(12):3618–3623, 2015.
- [16] Rafael C Gonzalez. Digital image processing. Pearson education india, 2009.
- [17] Ian Goodfellow, Jean Pouget-Abadie, Mehdi Mirza, Bing Xu, David Warde-Farley, Sherjil Ozair, Aaron Courville, and Yoshua Bengio. Generative adversarial networks. Communications of the ACM, 63(11):139–144, 2020.
- [18] Andreas Gustafsson et al. Interactive image warping. Master’s thesis, 1993.
- [19] Changhee Han, Yoshiro Kitamura, Akira Kudo, Akimichi Ichinose, Leonardo Rundo, Yujiro Furukawa, Kazuki Umemoto, Yuanzhong Li, and Hideki Nakayama. Synthesizing diverse lung nodules wherever massively: 3d multi-conditional gan-based ct image augmentation for object detection. In 2019 International Conference on 3D Vision (3DV), pages 729–737. IEEE, 2019.
- [20] Ali Hatamizadeh, Vishwesh Nath, Yucheng Tang, Dong Yang, Holger R Roth, and Daguang Xu. Swin unetr: Swin transformers for semantic segmentation of brain tumors in mri images. In International MICCAI Brainlesion Workshop, pages 272–284. Springer, 2022.
- [21] Ali Hatamizadeh, Yucheng Tang, Vishwesh Nath, Dong Yang, Andriy Myronenko, Bennett Landman, Holger R Roth, and Daguang Xu. Unetr: Transformers for 3d medical image segmentation. In Proceedings of the IEEE/CVF Winter Conference on Applications of Computer Vision, pages 574–584, 2022.
- [22] Jonathan Ho, Ajay Jain, and Pieter Abbeel. Denoising diffusion probabilistic models. Advances in Neural Information Processing Systems, 33:6840–6851, 2020.
- [23] Izabela Horvath, Johannes Paetzold, Oliver Schoppe, Rami Al-Maskari, Ivan Ezhov, Suprosanna Shit, Hongwei Li, Ali Ertürk, and Bjoern Menze. Metgan: Generative tumour inpainting and modality synthesis in light sheet microscopy. In Proceedings of the IEEE/CVF Winter Conference on Applications of Computer Vision, pages 227–237, 2022.
- [24] Qixin Hu, Junfei Xiao, Yixiong Chen, Shuwen Sun, Jie-Neng Chen, Alan Yuille, and Zongwei Zhou. Synthetic tumors make ai segment tumors better. NeurIPS Workshop on Medical Imaging meets NeurIPS, 2022.
- [25] Chaoqin Huang, Qinwei Xu, Yanfeng Wang, Yu Wang, and Ya Zhang. Self-supervised masking for unsupervised anomaly detection and localization. IEEE Transactions on Multimedia, 2022.
- [26] Fabian Isensee, Paul F Jaeger, Simon AA Kohl, Jens Petersen, and Klaus H Maier-Hein. nnu-net: a self-configuring method for deep learning-based biomedical image segmentation. Nature Methods, 18(2):203–211, 2021.
- [27] Qiangguo Jin, Hui Cui, Changming Sun, Zhaopeng Meng, and Ran Su. Free-form tumor synthesis in computed tomography images via richer generative adversarial network. Knowledge-Based Systems, 218:106753, 2021.
- [28] A Emre Kavur, N Sinem Gezer, Mustafa Barış, Sinem Aslan, Pierre-Henri Conze, Vladimir Groza, Duc Duy Pham, Soumick Chatterjee, Philipp Ernst, Savaş Özkan, et al. Chaos challenge-combined (ct-mr) healthy abdominal organ segmentation. Medical Image Analysis, 69:101950, 2021.
- [29] Daniel S Kermany, Michael Goldbaum, Wenjia Cai, Carolina CS Valentim, Huiying Liang, Sally L Baxter, Alex McKeown, Ge Yang, Xiaokang Wu, Fangbing Yan, et al. Identifying medical diagnoses and treatable diseases by image-based deep learning. Cell, 172(5):1122–1131, 2018.
- [30] Diederik P Kingma and Max Welling. Auto-encoding variational bayes. arXiv preprint arXiv:1312.6114, 2013.
- [31] B Landman, Z Xu, J Igelsias, M Styner, T Langerak, and A Klein. 2015 miccai multi-atlas labeling beyond the cranial vault workshop and challenge, 2015. doi:10.7303/syn3193805.
- [32] KHY Lee, ME O’Malley, MA Haider, and A Hanbidge. Triple-phase mdct of hepatocellular carcinoma. American Journal of Roentgenology, 182(3):643–649, 2004.
- [33] Da Li, Yongxin Yang, Yi-Zhe Song, and Timothy M. Hospedales. Deeper, broader and artier domain generalization. In ICCV, 2017.
- [34] Ning Li, Kaitao Jiang, Zhiheng Ma, Xing Wei, Xiaopeng Hong, and Yihong Gong. Anomaly detection via self-organizing map. In 2021 IEEE International Conference on Image Processing (ICIP), pages 974–978. IEEE, 2021.
- [35] Yiying Li, Yongxin Yang, Wei Zhou, and Timothy Hospedales. Feature-critic networks for heterogeneous domain generalization. In ICML, 2019.
- [36] Jie Liu, Yixiao Zhang, Jie-Neng Chen, Junfei Xiao, Yongyi Lu, Bennett A Landman, Yixuan Yuan, Alan Yuille, Yucheng Tang, and Zongwei Zhou. Clip-driven universal model for organ segmentation and tumor detection. arXiv preprint arXiv:2301.00785, 2023.
- [37] Quande Liu, Qi Dou, and Pheng-Ann Heng. Shape-aware meta-learning for generalizing prostate mri segmentation to unseen domains. In MICCAI, 2020.
- [38] Quande Liu, Qi Dou, Lequan Yu, and Pheng Ann Heng. Ms-net: Multi-site network for improving prostate segmentation with heterogeneous mri data. TMI, 2020.
- [39] Ze Liu, Yutong Lin, Yue Cao, Han Hu, Yixuan Wei, Zheng Zhang, Stephen Lin, and Baining Guo. Swin transformer: Hierarchical vision transformer using shifted windows. arXiv preprint arXiv:2103.14030, 2021.
- [40] Xiangde Luo, Wenjun Liao, Jianghong Xiao, Jieneng Chen, Tao Song, Xiaofan Zhang, Kang Li, Dimitris N Metaxas, Guotai Wang, and Shaoting Zhang. Word: A large scale dataset, benchmark and clinical applicable study for abdominal organ segmentation from ct image. Medical Image Analysis, page 102642, 2022.
- [41] Fei Lyu, Mang Ye, Jonathan Frederik Carlsen, Kenny Erleben, Sune Darkner, and Pong C Yuen. Pseudo-label guided image synthesis for semi-supervised covid-19 pneumonia infection segmentation. IEEE Transactions on Medical Imaging, 2022.
- [42] Guilherme M. Cunha, Kathryn J Fowler, Alexandra Roudenko, Bachir Taouli, Alice W Fung, Khaled M Elsayes, Robert M Marks, Irene Cruite, Natally Horvat, Victoria Chernyak, et al. How to use li-rads to report liver ct and mri observations. RadioGraphics, 41(5):1352–1367, 2021.
- [43] Ben Mildenhall, Pratul P Srinivasan, Matthew Tancik, Jonathan T Barron, Ravi Ramamoorthi, and Ren Ng. Nerf: Representing scenes as neural radiance fields for view synthesis. Communications of the ACM, 65(1):99–106, 2021.
- [44] Alberto Munoz and Jorge Muruzábal. Self-organizing maps for outlier detection. Neurocomputing, 18(1-3):33–60, 1998.
- [45] Raymond W Ogden. Non-linear elastic deformations. Courier Corporation, 1997.
- [46] Xingchao Peng, Ben Usman, Neela Kaushik, Judy Hoffman, Dequan Wang, and Kate Saenko. Visda: The visual domain adaptation challenge. arXiv preprint arXiv:1710.06924, 2017.
- [47] Stephan R Richter, Vibhav Vineet, Stefan Roth, and Vladlen Koltun. Playing for data: Ground truth from computer games. In ECCV, 2016.
- [48] Olaf Ronneberger, Philipp Fischer, and Thomas Brox. U-net: Convolutional networks for biomedical image segmentation. In International Conference on Medical Image Computing and Computer-Assisted Intervention, pages 234–241. Springer, 2015.
- [49] German Ros, Laura Sellart, Joanna Materzynska, David Vazquez, and Antonio M Lopez. The synthia dataset: A large collection of synthetic images for semantic segmentation of urban scenes. In CVPR, 2016.
- [50] Holger Roth, Amal Farag, Evrim B. Turkbey, Le Lu, Jiamin Liu, and Ronald M. Summers. Data from pancreas-ct, 2016. The Cancer Imaging Archive. https://doi.org/10.7937/K9/TCIA.2016.tNB1kqBU.
- [51] Karsten Roth, Latha Pemula, Joaquin Zepeda, Bernhard Schölkopf, Thomas Brox, and Peter Gehler. Towards total recall in industrial anomaly detection. In Proceedings of the IEEE/CVF Conference on Computer Vision and Pattern Recognition, pages 14318–14328, 2022.
- [52] Daniel L Rubin, Hayit Greenspan, and Assaf Hoogi. Biomedical imaging informatics. In Biomedical Informatics, pages 299–362. Springer, 2021.
- [53] Thomas Schlegl, Philipp Seeböck, Sebastian M Waldstein, Georg Langs, and Ursula Schmidt-Erfurth. f-anogan: Fast unsupervised anomaly detection with generative adversarial networks. Medical Image Analysis, 2019.
- [54] Younghak Shin, Hemin Ali Qadir, and Ilangko Balasingham. Abnormal colon polyp image synthesis using conditional adversarial networks for improved detection performance. IEEE Access, 6:56007–56017, 2018.
- [55] Yucheng Tang, Dong Yang, Wenqi Li, Holger R Roth, Bennett Landman, Daguang Xu, Vishwesh Nath, and Ali Hatamizadeh. Self-supervised pre-training of swin transformers for 3d medical image analysis. In Proceedings of the IEEE/CVF Conference on Computer Vision and Pattern Recognition, pages 20730–20740, 2022.
- [56] Riccardo Volpi and Vittorio Murino. Addressing model vulnerability to distributional shifts over image transformation sets. In ICCV, 2019.
- [57] Hualin Wang, Yuhong Zhou, Jiong Zhang, Jianqin Lei, Dongke Sun, Feng Xu, and Xiayu Xu. Anomaly segmentation in retinal images with poisson-blending data augmentation. Medical Image Analysis, page 102534, 2022.
- [58] Jindong Wang, Cuiling Lan, Chang Liu, Yidong Ouyang, Tao Qin, Wang Lu, Yiqiang Chen, Wenjun Zeng, and Philip Yu. Generalizing to unseen domains: A survey on domain generalization. IEEE Transactions on Knowledge and Data Engineering, 2022.
- [59] Meiyun Wang, Fangfang Fu, Bingjie Zheng, Yan Bai, Qingxia Wu, Jianqiang Wu, Lin Sun, Qiuyu Liu, Mingge Liu, Yichen Yang, et al. Development of an ai system for accurately diagnose hepatocellular carcinoma from computed tomography imaging data. British Journal of Cancer, 125(8):1111–1121, 2021.
- [60] Julian Wyatt, Adam Leach, Sebastian M Schmon, and Chris G Willcocks. Anoddpm: Anomaly detection with denoising diffusion probabilistic models using simplex noise. In Proceedings of the IEEE/CVF Conference on Computer Vision and Pattern Recognition, pages 650–656, 2022.
- [61] Yingda Xia, Qihang Yu, Linda Chu, Satomi Kawamoto, Seyoun Park, Fengze Liu, Jieneng Chen, Zhuotun Zhu, Bowen Li, Zongwei Zhou, et al. The felix project: Deep networks to detect pancreatic neoplasms. medRxiv, 2022.
- [62] Tiange Xiang, Yixiao Zhang, Yongyi Liu, Alan L Yuille, Chaoyi Zhang, Weidong Cai, and Zongwei Zhou. In-painting radiography images for unsupervised anomaly detection. In Proceedings of the IEEE conference on computer vision and pattern recognition, 2023.
- [63] Qingsong Yao, Li Xiao, Peihang Liu, and S Kevin Zhou. Label-free segmentation of covid-19 lesions in lung ct. IEEE Transactions on Medical Imaging, 2021.
- [64] Xiangyu Yue, Yang Zhang, Sicheng Zhao, Alberto Sangiovanni-Vincentelli, Kurt Keutzer, and Boqing Gong. Domain randomization and pyramid consistency: Simulation-to-real generalization without accessing target domain data. In ICCV, 2019.
- [65] Alan L Yuille and Chenxi Liu. Deep nets: What have they ever done for vision? International Journal of Computer Vision, 129(3):781–802, 2021.
- [66] Sergey Zagoruyko and Nikos Komodakis. Wide residual networks. arXiv preprint arXiv:1605.07146, 2016.
- [67] Xiaoman Zhang, Weidi Xie, Chaoqin Huang, Ya Zhang, Xin Chen, Qi Tian, and Yanfeng Wang. Self-supervised tumor segmentation with sim2real adaptation. IEEE Journal of Biomedical and Health Informatics, 2023.
- [68] Kaiyang Zhou, Ziwei Liu, Yu Qiao, Tao Xiang, and Chen Change Loy. Domain generalization: A survey. IEEE Transactions on Pattern Analysis and Machine Intelligence, 2022.
- [69] S Kevin Zhou, Hayit Greenspan, Christos Davatzikos, James S Duncan, Bram van Ginneken, Anant Madabhushi, Jerry L Prince, Daniel Rueckert, and Ronald M Summers. A review of deep learning in medical imaging: Imaging traits, technology trends, case studies with progress highlights, and future promises. Proceedings of the IEEE, 2021.
- [70] Zongwei Zhou. Towards Annotation-Efficient Deep Learning for Computer-Aided Diagnosis. PhD thesis, Arizona State University, 2021.
- [71] Zongwei Zhou, Michael B Gotway, and Jianming Liang. Interpreting medical images. In Intelligent Systems in Medicine and Health, pages 343–371. Springer, 2022.
- [72] Zongwei Zhou, Md Mahfuzur Rahman Siddiquee, Nima Tajbakhsh, and Jianming Liang. Unet++: A nested u-net architecture for medical image segmentation. In Deep Learning in Medical Image Analysis and Multimodal Learning for Clinical Decision Support, pages 3–11. Springer, 2018.
- [73] Zongwei Zhou, Md Mahfuzur Rahman Siddiquee, Nima Tajbakhsh, and Jianming Liang. Unet++: Redesigning skip connections to exploit multiscale features in image segmentation. IEEE transactions on medical imaging, 39(6):1856–1867, 2019.
- [74] Zongwei Zhou, Vatsal Sodha, Jiaxuan Pang, Michael B Gotway, and Jianming Liang. Models genesis. Medical image analysis, 67:101840, 2021.
- [75] Zongwei Zhou, Vatsal Sodha, Md Mahfuzur Rahman Siddiquee, Ruibin Feng, Nima Tajbakhsh, Michael B Gotway, and Jianming Liang. Models genesis: Generic autodidactic models for 3d medical image analysis. In International conference on medical image computing and computer-assisted intervention, pages 384–393. Springer, 2019.
| U-Net | labeled/unlabeled CTs | metric | fold 0 | fold 1 | fold 2 | fold 3 | fold 4 | average |
| real | 101/0 | DSC (%) | 55.86 | 52.26 | 67.34 | 53.06 | 59.63 | 57.63 |
| NSD (%) | 56.87 | 49.02 | 68.54 | 55.02 | 61.06 | 58.10 | ||
| synt | 0/116 | DSC (%) | 61.83 | 50.38 | 69.63 | 57.75 | 59.46 | 59.81 |
| NSD (%) | 64.50 | 47.74 | 71.48 | 61.96 | 60.22 | 61.28 | ||
| real & synt | 50/52 | DSC (%) | 56.96 | 48.77 | 68.65 | 54.16 | 55.76 | 56.86 |
| NSD (%) | 59.09 | 43.21 | 69.44 | 54.01 | 54.56 | 56.06 |
| Swin UNETR-Tiny | labeled/unlabeled CTs | metric | fold 0 | fold 1 | fold 2 | fold 3 | fold 4 | average |
| real | 101/0 | DSC (%) | 52.88 | 49.24 | 67.94 | 53.93 | 55.63 | 55.92 |
| NSD (%) | 51.34 | 47.08 | 71.22 | 54.56 | 58.53 | 56.55 | ||
| synt | 0/116 | DSC (%) | 55.90 | 49.63 | 62.20 | 52.48 | 55.30 | 55.10 |
| NSD (%) | 59.97 | 46.92 | 63.23 | 54.08 | 53.88 | 55.61 |
| Swin UNETR-Small | labeled/unlabeled CTs | metric | fold 0 | fold 1 | fold 2 | fold 3 | fold 4 | average |
| real | 101/0 | DSC (%) | 60.01 | 50.56 | 69.83 | 52.08 | 59.98 | 58.49 |
| NSD (%) | 64.40 | 48.67 | 71.20 | 55.34 | 59.68 | 59.86 | ||
| synt | 0/116 | DSC (%) | 57.16 | 52.16 | 63.63 | 54.79 | 54.13 | 56.37 |
| NSD (%) | 63.61 | 50.04 | 66.89 | 57.66 | 52.98 | 58.24 |
| Swin UNETR-Base | labeled/unlabeled CTs | metric | fold 0 | fold 1 | fold 2 | fold 3 | fold 4 | average |
| real | 101/0 | DSC (%)† | 55.35 | 50.32 | 64.41 | 54.17 | 55.35 | 55.92 |
| DSC (%) | 59.19 | 54.04 | 68.32 | 52.58 | 60.97 | 59.02 | ||
| NSD (%) | 63.56 | 52.46 | 70.06 | 55.19 | 62.85 | 60.82 | ||
| synt | 0/116 | DSC (%) | 55.26 | 51.43 | 64.87 | 53.34 | 54.82 | 55.94 |
| NSD (%) | 62.08 | 49.87 | 67.89 | 57.56 | 53.61 | 58.20 |
-
•
†The 5-fold cross validation results are provided by Tang et al. [tang2022self].
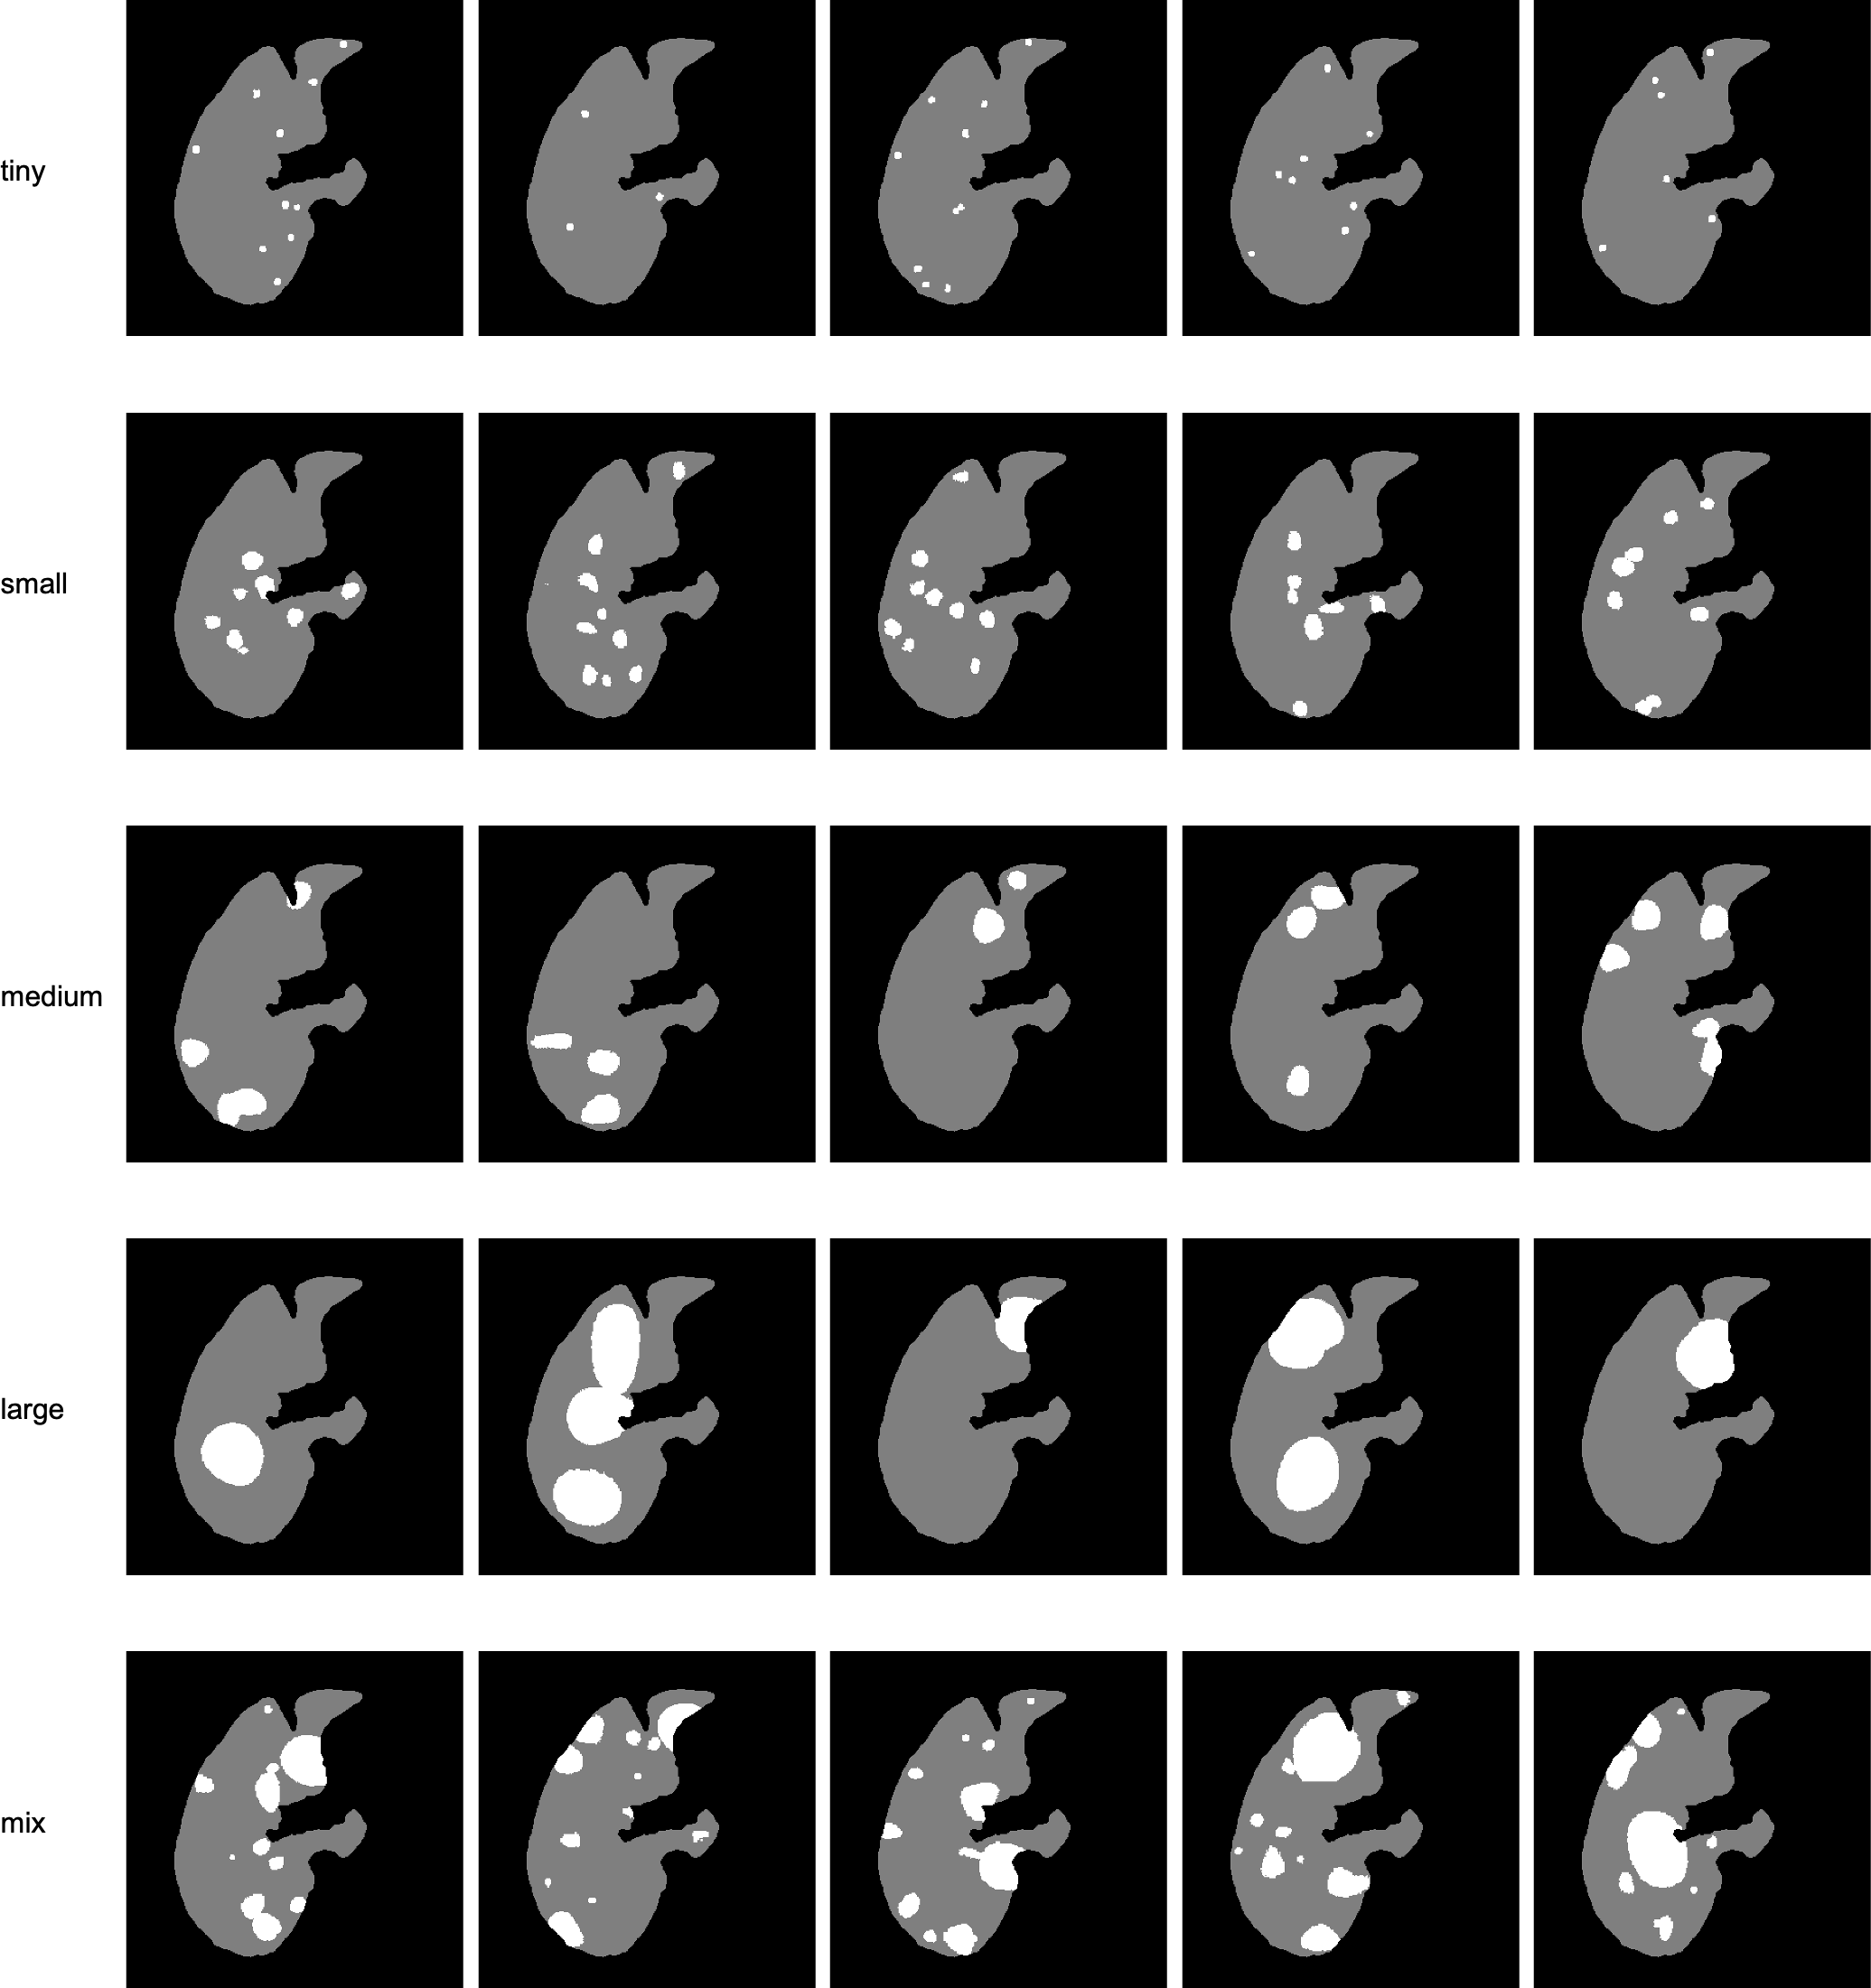
| parameter | tiny | small | medium | large | mix |
| size r | 4 | 8 | 16 | 32 | / |
| deformation | / | ||||
| number | / |
