Temporal Egonet Subgraph Transitions
Abstract
How do we summarize dynamic behavioral interactions? We introduce a possible node-embedding-based solution to this question: temporal egonet subgraph transitions.111Source code at https://github.com/lucaspar/cbm-project.
1 Introduction
The problem of anomaly detection in graphs has a multitude of real-world applications in many fields. An anomaly may be a rare item, event, or entity that does not fit with the more ‘typical’ trends in a set of data - i.e. an outlier. Examples include bank fraud in a set of financial transactions, typos in a text, intrusions in networks, ‘bot’ users in social media, or a sudden drop in sales caused by a global pandemic. In this paper, we propose Temporal Egonet Subgraph Transitions (TEST): a comprehensive way of summarizing the behavioral patterns of nodes in a network.
We represent interactions between users over time as a sequence of graphs, representing the evolution of interactions between a set of nodes over time. In this framework, we are interested in modeling the behavior individual nodes exhibit in order to distinguish different patterns of interaction. To that end, TEST creates a vector representation of each node using the changes in its neighborhood—or egonet—over time. These vector representations can then be used for traditional tasks, such as clustering and classification, depending on the application and data quality.
TEST is flexible enough to lend itself to a variety of standard tasks and application domains because it does not depend on labeled data or any kind of iterative learning procedure. Nodes’ vector representations are computed purely based on how their egonets change over time. Once in the embedding space, the data can be analyzed from various perspectives. For example, given labeled data, the latent representations can be used for classification tasks such as bot-detection on social networks. However, in the absence of ground truth regarding nodes, the latent representations can still be analyzed to find communities: clusters of points in the embedding space signalling nodes with similar temporal behavior.
Despite its flexibility, TEST makes some important assumptions about the data. Not only should the data be graphical, it should be a discrete sequence , where the events described by precede those in . This means that datasets presented as streams of timestamped edges must be discretized. If the discretization process is too coarse, signals in the data will be lost; however, if the discretization is too fine, the model will not significantly compress the data. While some datasets and application domains are concerned with clustering or classifying edges—as is the case in, for example, detecting fraudulent transactions on financial networks—our focus in this paper is on characterizing nodes’ behavior.
2 Related Work
Diverse techniques exists for anomaly detection in literature. Approaches include density-based techniques like k-nearest neighbor [10], local outlier factor [1], isolation forests [14] and other variations [23]. For higher dimensional data - subspace [11], correlation [12], single class support vector machines [20] and tensor based methods [6] have been proposed. Neural network approaches include replicators [8], Bayesian Networks [20], hidden markov models [20]. Additionally, cluster analysis based [2], fuzzy logic and ensemble techniques with feature bagging [18] and score normalization [22] have been applied.
Although these methodologies have minimal systematic advantages across data sets and parameters, many are applied in the realm of static graphs. To narrow the scope in relation to our proposed method regarding anomaly detection algorithms for dynamic graph networks a deeper exploration will be applied to network embedding and streaming anomaly approaches.
2.1 Streaming Anomaly Detection
Streaming anomaly detection attempts to detect suspicious or uncharacteristic behavior in continuous-time streams of relational data.
2.1.1 Streaming Graphs
Streaming graphs can be applied to anomalous node detection like dynamic tensor analysis (DTA) [25] which approximates an adjacency matrix for a graph at time t with incremental matrix factorization and utilizes a high reconstruction error to. Anomalous subgraph detection is illustrated in methods like [24] which uses k-core which is the maximal subgraph in which all vertices have degree at least k and use patterns related to k-core to find anomalous subgraphs. Streaming graphs can also be utilized for anomalous event detection such as changes in first and second derivatives in PageRank [28].
2.1.2 Streaming Edges
Streaming anomaly detection can also be applied to streaming edges. Anomalous nodes can be detected using methods like [29] which uses an incremental eigenvector update algorithm based in von Mises interations and discover hotspots of local changes in dynamics streams. SedanSpot [5] utilizes streaming edges to detect anomalous edges by exploiting edges that connect part of the graph that are sparsely connected and finding where bursts of activity indicative of anomalous behavior.
2.2 Network Embedding
Network embedding approaches consist of learning low-dimensional feature representation of the nodes or links within a network. Many advances [3, 13, 27, 31] in the network embedding space present new ways to learn representations for networks which can be used to detect anomalies. Feature learning strategies for extracting network embedding have been widely used in language models such as Skip-gram [17] in which the the defining neighborhood attributes for words in a sentence are preserved. In a similar manner, many popular methodologies such as DeepWalk [19] and Node2vec [7] use sequences of vertices from the graphs and learn the representation of these vertices by maximizing the preservation of the structure inherent to a neighborhood of vertices in the network. A large portion of work has also been dedicated to representation learning in other manners for graph network architectures [26, 27, 32] and compact representations of the graph have been used to find anomalies within the network [16].
These methods have also been specifically applied for anomaly detection in dynamic temporal graphs. Specifically, NetWalk [30] learns network representations which are dynamically updated as the network evolves. This is done by by learning the latent network representations by extracted sequences of vertices from the graph, otherwise termed as ”walks” from the initial network and then extract deep representations by minimizing the pairwise distance of the vertices when encoding the vector representations and adding global regularization by using a deep autoencoder reconstruction error. NetWalk is updated over dynamic changes with reservoir sampling strategy and a dynamic clustering model is used to find anomalies.
In [9], dynamic graph evolution is modeled with subgraph to subgraph transitions (SST) by fitting linear SVM models to SST count vectors. This can be used for link prediction of static, temporal, directed and undirected graphs while providing interpretable results. The idea of counting SSTs inspires our proposed methodology, however, instead of utilizing an edge based approach as this paper did, we propose a neighborhood based approach for detecting anomalies based on clusters (cf. Sec. 4).
3 Data Sources
We are focused on modeling behavior over time from graph-structured data, so we need datasets with the following attributes:
-
1.
Nodes with persistent IDs.
-
2.
Interactions (directed or undirected) between nodes.
-
3.
Timestamps for the interactions.
3.1 Available Datasets
Although we initially wanted to tackle node classification problems using TET, we ran into problems finding datasets which had both timestamped edges and ground-truth labels for the nodes. Most of the datasets with ground-truth we found had labels for the edges instead. Therefore, we are considering unsupervised tasks like clustering for testing the quality of our node embeddings. We describe some of the datasets we found below.
3.1.1 Enron Emails222http://odds.cs.stonybrook.edu/enroninc-dataset/
The nodes of this dataset represent email addresses and directed edges depict sent/received relations. Enron email network dataset contains a total of 80, 884 nodes and 700 timestamp in total.
3.1.2 College Messages444https://snap.stanford.edu/data/CollegeMsg.html
This is a dataset containing private messages at an online social network at the University of California, Irvine. Here an edge (u, v, t) means that during time t, an user u sent a message to an user v.
3.1.3 EU Emails666https://snap.stanford.edu/data/email-Eu-core-temporal.html
This dataset contains 986 nodes and 332,334 temporal edges, with the timestamp of 803 in total.
3.2 Synthetic Dataset
In order to test our model’s ability to properly distinguish between nodes with different temporal behavior in the embedding space, we need a dataset which:
-
1.
represents interactions between different objects,
-
2.
is temporal (i.e., interactions occur at known points in time, which may repeat),
-
3.
has ground truth labels on the nodes indicating whether those nodes are anomalous or not.
There are many public temporal graph datasets that immediately satisfy the first two requirements.
Among those, there are a few that also include some ground truth information regarding authentic/suspicious/anomalous edges in the graph. However, since we are attempting to characterize nodes as anomalous or not, edge-centric ground truth labels are unhelpful. Since a dataset satisfying all three criteria is unavailable to us, we could go out into the world and collect, mine, or survey a sufficiently high-quality dataset on our own.
We elected to not pursue this idea not only because of time constraints, but also because building a real-world dataset satisfying those three criteria by hand would require a level of description, analysis, and methodological detail that might be more appropriate for its own paper.
Therefore, we elected to generate a synthetic temporal graph with ground truth node labels.
The data consists of a discrete sequence of five graphs on a shared set of nodes , representing five snapshots of interactions between the nodes in .
The nodes are split between authentic and anomalous nodes, labels which persist through the different graphs in the sequence. For each time authentic nodes’ edges are generated by an Erdos-Renyi random process [4];
specifically, between any two authentic nodes and , an edge exists with probability . The anomalous nodes are connected together in the following way: for , all of the anomalous nodes form the empty subgraph; for , the anomalous nodes form a clique.
The free parameters for generating this dataset are the connection probability for the authentic nodes, the total number of nodes , and the percentage of the total nodes that is designated as anomalous. In the future, we can experiment with different ways of connecting the anomalous nodes together to create more-varied temporal patterns.
4 Description of the Model
| Synthetic dataset: , | |||||||||||||
| Egonet | Node2Vec | Spectral Clustering | Deepwalk | ||||||||||
| Prec. | Recall | F1-Score | Prec. | Recall | F1-Score | Prec. | Recall | F1-Score | Prec. | Recall | F1-Score | Data Points | |
| Anomaly | 1.00 | 1.00 | 1.00 | 0.00 | 0.00 | 0.00 | 0.01 | 0.04 | 0.02 | 0.27 | 0.56 | 0.36 | 25 |
| Normal | 1.00 | 1.00 | 1.00 | 0.95 | 0.95 | 0.95 | 0.94 | 0.82 | 0.88 | 0.98 | 0.92 | 0.95 | 475 |
| Accuracy | 1.00 | 0.90 | 0.78 | 0.90 | 500 | ||||||||
The basic idea behind TET is that changes in a node’s egonet can be summarized by counting subgraph transitions. A subgraph transition for a node at a given time transition is defined as a pair of graphs on a shared node set such that:
-
is a subgraph of the adjacency neighborhood of at time if any missing nodes from the neighborhood at time are included
-
is a subgraph of the adjacency neighborhood of at time if any missing nodes from the neighborhood at time are included
-
and are not isomorphic.
In the interest of computational tractability, we only consider subgraph transitions up to a certain number of vertices—for this paper, we only consider subgraph transitions on at most nodes.
By enumerating and canonically ordering all of the subgraph transitions in question, we can construct a vector of subgraph transition counts for the node during the time hop from to . This subgraph transition count vector summarizes the change in ’s behavior from the previous time step to the next time step.
Performing this for each time transition results in a sequence of count vectors , where is the number of subgraph transitions enumerated (note: may be very large, even for small ). We can then condense these counts into a single vector representation for by applying some element-wise aggregation function (e.g., mean, sum, min, max). In this paper, we aggregate the count vectors by averaging each of the transition counts over all of the time steps, producing as the embedding vector for the node in question. The model is described in detail in Alg. 1.
5 Evaluation
5.1 Experiments Setup
In the case that we find a properly labeled dataset to evaluate TET, we can use more commonly found metrics to compare our results in an anomaly-detection problem. We probably will not use accuracy of classification directly, however. That is because anomaly datasets in general are heavily skewed towards the normal behavior, thus, any classifier that labeled them all as normal would achieve an accuracy close to 100%. Thus, we focus our report in the F1-score, precision, and recall achieved in the baseline executions and compare them against Egonet. The experiments shown in Table 1 shown here were carried out on the synthetic dataset described in Sec. 3.2.
5.2 Baselines
In order to assess the quality of our method, we will compare against competing methods and apply the same unsupervised learning methods later on.
-
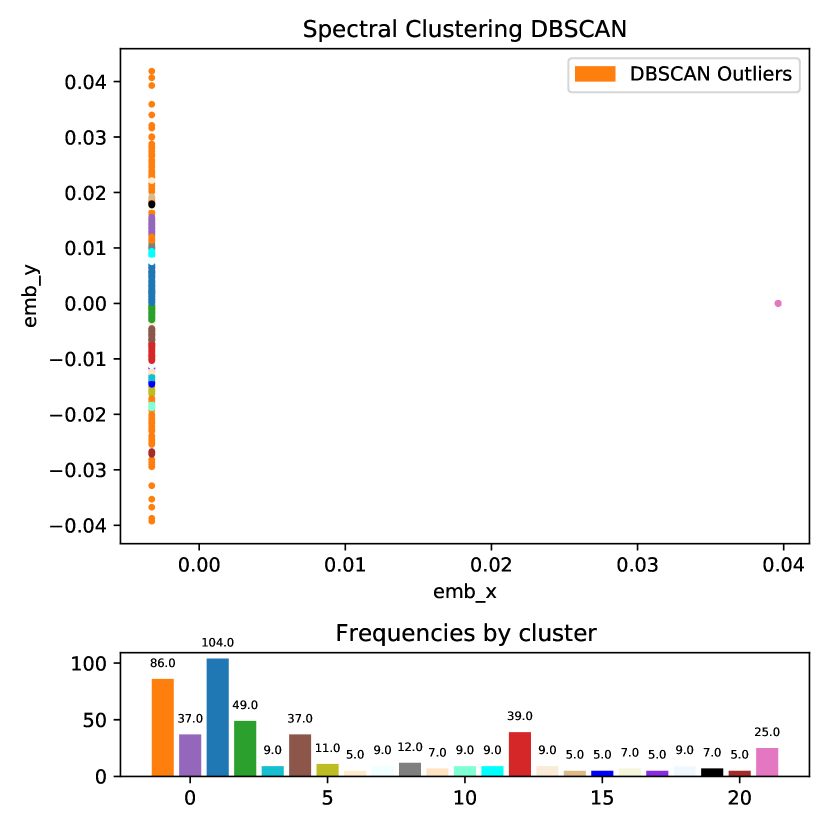
Spectral Clustering [15]: is closely related to nonlinear dimension reduction, and dimension reduction techniques such as locally-linear embedding can be used to reduce errors from noise. By calculating the Laplacian of the graph and obtaining the first eigenvectors and corresponding eigenvalues of the Laplacian, this method output embedding nodes. Spectral Clustering has no assumption on the shapes of the clusters and can thus model complex scenarios.
-
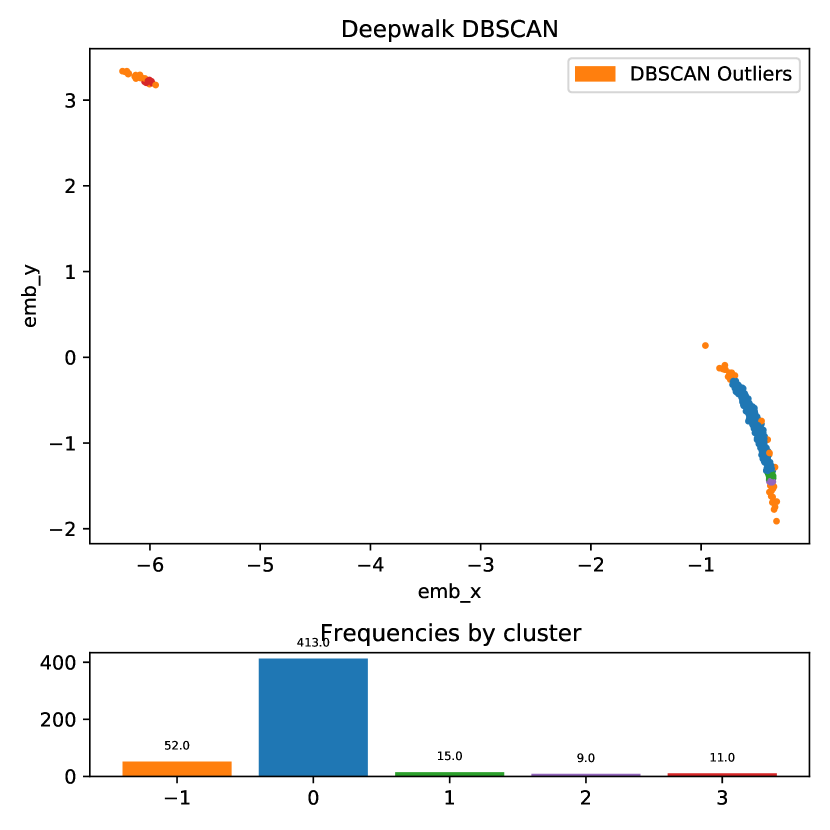
DeepWalk [19]: generalizes on language modeling from sequences of words to graphs by using local information from sequences of vertices(Random Walk and SkipGram) in the graph and learning representations by treating them equivalently to sentences. Here the input is an edge list file and the output of DeepWalk is 64 dimensions by default. In order to visualize it, the output is manually set to 2 dimensions.
-
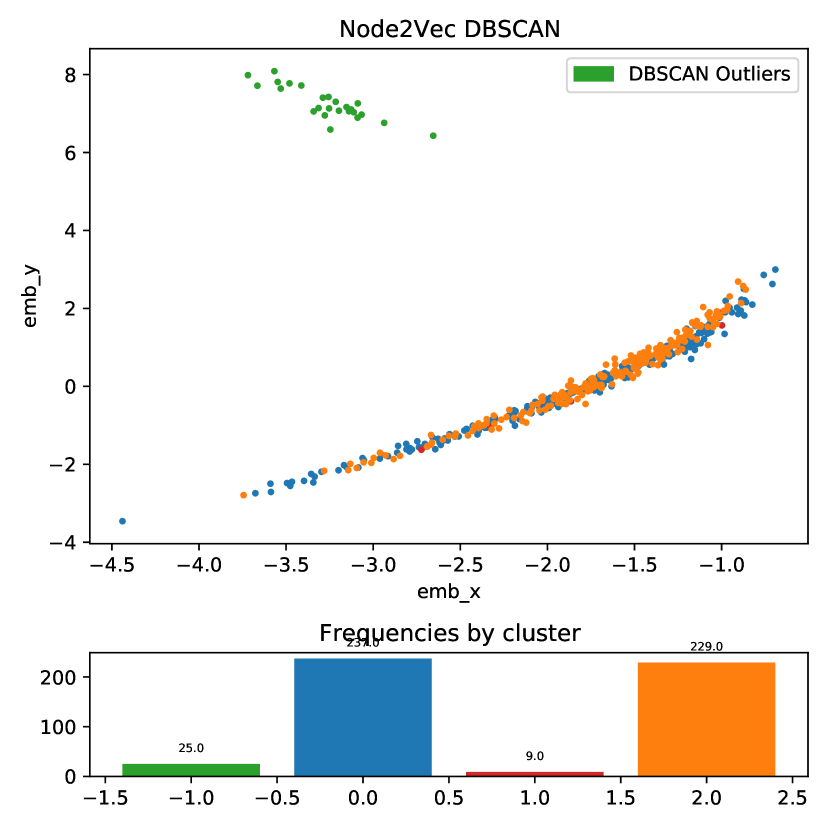
Node2Vec [7]: is a useful method for extracting the continuous-feature representations for nodes in graph networks. By using a biased random walk procedure, Node2Vec maps of nodes to a lower-dimensional space of features while preserving their locality.
The baselines mentioned above do not take dynamic graphs into account without a remodeling of the input data and multiple executions, making it a challenging task to represent the evolution of the graph over time. In our case temporal graphs into account, which significantly lowers to their implementation complexity. All of the output of embedding methods (including the output of Egonet) are later fed forward to the same pipeline of DBSCAN for outlier detection. The results are displayed in Figures 1, 2, and 3. The images also point the frequency distribution among the classes found by DBSCAN. As opposed to k-means, DBSCAN attempts to find the optimal number of classes, so the number of clusters is highly dependent on the embedding dataset.
5.3 Future Work
In addition to the clustering techniques mentioned above, the Extreme Value Machine (EVM) [21] could be used to classify extracted embeddings.
The EVM is a scalable nonlinear classifier which supports open-set classification, where the models are assumed to have incomplete knowledge of their operating context and can reject inputs that are beyond the support of the training set. The EVM relies on a strong feature representation and every represented sample in the feature representation becomes a point. EVM utilizes bins which groups all the points in their feature representation by their correspondent label. These bins are utilized to create a 1 vs. rest EVM classifier for each known class or in our case each of the known clusters. The EVM generates a classifier where a Weibull distribution is fit on the data for each known class and is made to avoid the negative data points (unknown classes) or outliers for our application. This is repeated for all the known classes/clusters. When a coordinate point which is a sample encoded by its feature representation as a vector is provided to the EVM, the points are mapped to the feature space as a probability of belonging to a representative class, or if it falls below a threshold of inclusion, labeled as an outlier.
The analysis of our approach for extracting embeddings and clustering with DBSCAN proved to be successful on the synthetically generated data, however, real world data may be more complex and difficult to detect outliers in. Thus, using an approach like the EVM and forming distributions that take into account the input space distance distributions may provide strong understanding of the nature of the data and prove to be an effective means of capturing anomalous nodes based off the embeddings.
References
- [1] Markus M Breunig, Hans-Peter Kriegel, Raymond T Ng, and Jörg Sander. Lof: identifying density-based local outliers. In Proceedings of the 2000 ACM SIGMOD international conference on Management of data, pages 93–104, 2000.
- [2] Ricardo JGB Campello, Davoud Moulavi, Arthur Zimek, and Jörg Sander. Hierarchical density estimates for data clustering, visualization, and outlier detection. ACM Transactions on Knowledge Discovery from Data (TKDD), 10(1):1–51, 2015.
- [3] Shiyu Chang, Wei Han, Jiliang Tang, Guo-Jun Qi, Charu C Aggarwal, and Thomas S Huang. Heterogeneous network embedding via deep architectures. In Proceedings of the 21th ACM SIGKDD international conference on knowledge discovery and data mining, pages 119–128, 2015.
- [4] Paul Erdős and Alfréd Rényi. On Random Graphs. I. Publicationes Mathematicae, 6:290–297, 1959.
- [5] Dhivya Eswaran and Christos Faloutsos. Sedanspot: Detecting anomalies in edge streams. In 2018 IEEE International Conference on Data Mining (ICDM), pages 953–958. IEEE, 2018.
- [6] Hadi Fanaee-T and Joao Gama. Tensor-based anomaly detection: An interdisciplinary survey. Knowledge-Based Systems, 98:130–147, 2016.
- [7] Aditya Grover and Jure Leskovec. node2vec: Scalable feature learning for networks. In Proceedings of the 22nd ACM SIGKDD international conference on Knowledge discovery and data mining, pages 855–864, 2016.
- [8] Simon Hawkins, Hongxing He, Graham Williams, and Rohan Baxter. Outlier detection using replicator neural networks. In International Conference on Data Warehousing and Knowledge Discovery, pages 170–180. Springer, 2002.
- [9] Justus Isaiah Hibshman, Daniel Gonzalez, Satyaki Sikdar, and Tim Weninger. Joint subgraph-to-subgraph transitions: Generalizing triadic closure for powerful and interpretable graph modeling. Proceedings of the 14th ACM International Conference on Web Search and Data Mining, 2021.
- [10] Edwin M Knorr, Raymond T Ng, and Vladimir Tucakov. Distance-based outliers: algorithms and applications. The VLDB Journal, 8(3):237–253, 2000.
- [11] Hans-Peter Kriegel, Peer Kröger, Erich Schubert, and Arthur Zimek. Outlier detection in axis-parallel subspaces of high dimensional data. In Pacific-asia conference on knowledge discovery and data mining, pages 831–838. Springer, 2009.
- [12] Hans-Peter Kriegel, Peer Kröger, Erich Schubert, and Arthur Zimek. Outlier detection in arbitrarily oriented subspaces. In 2012 IEEE 12th international conference on data mining, pages 379–388. IEEE, 2012.
- [13] Omer Levy and Yoav Goldberg. Neural word embedding as implicit matrix factorization. Advances in neural information processing systems, 27:2177–2185, 2014.
- [14] Fei Tony Liu, Kai Ming Ting, and Zhi-Hua Zhou. Isolation-based anomaly detection. ACM Transactions on Knowledge Discovery from Data (TKDD), 6(1):1–39, 2012.
- [15] Jialu Liu, Jiawei Han, C Aggarwal, and C Reddy. Spectral clustering., 2013.
- [16] Emaad Manzoor, Sadegh M Milajerdi, and Leman Akoglu. Fast memory-efficient anomaly detection in streaming heterogeneous graphs. In Proceedings of the 22nd ACM SIGKDD International Conference on Knowledge Discovery and Data Mining, pages 1035–1044, 2016.
- [17] Tomas Mikolov, Ilya Sutskever, Kai Chen, Greg Corrado, and Jeffrey Dean. Distributed representations of words and phrases and their compositionality. arXiv preprint arXiv:1310.4546, 2013.
- [18] Hoang Vu Nguyen, Hock Hee Ang, and Vivekanand Gopalkrishnan. Mining outliers with ensemble of heterogeneous detectors on random subspaces. In International Conference on Database Systems for Advanced Applications, pages 368–383. Springer, 2010.
- [19] Bryan Perozzi, Rami Al-Rfou, and Steven Skiena. Deepwalk: Online learning of social representations. In Proceedings of the 20th ACM SIGKDD international conference on Knowledge discovery and data mining, pages 701–710, 2014.
- [20] John C Platt, John Shawe-Taylor, Alex J Smola, Robert C Williamson, et al. Estimating the support of a high-dimensional distribution. Technical Report MSR-T R-99–87, Microsoft Research (MSR), 1999.
- [21] Ethan M Rudd, Lalit P Jain, Walter J Scheirer, and Terrance E Boult. The extreme value machine. IEEE transactions on pattern analysis and machine intelligence, 40(3):762–768, 2017.
- [22] Erich Schubert, Remigius Wojdanowski, Arthur Zimek, and Hans-Peter Kriegel. On evaluation of outlier rankings and outlier scores. In Proceedings of the 2012 SIAM International Conference on Data Mining, pages 1047–1058. SIAM, 2012.
- [23] Erich Schubert, Arthur Zimek, and Hans-Peter Kriegel. Local outlier detection reconsidered: a generalized view on locality with applications to spatial, video, and network outlier detection. Data mining and knowledge discovery, 28(1):190–237, 2014.
- [24] Kijung Shin, Tina Eliassi-Rad, and Christos Faloutsos. Patterns and anomalies in k-cores of real-world graphs with applications. Knowledge and Information Systems, 54(3):677–710, 2018.
- [25] Jimeng Sun, Dacheng Tao, and Christos Faloutsos. Beyond streams and graphs: dynamic tensor analysis. In Proceedings of the 12th ACM SIGKDD international conference on Knowledge discovery and data mining, pages 374–383, 2006.
- [26] Fei Tian, Bin Gao, Qing Cui, Enhong Chen, and Tie-Yan Liu. Learning deep representations for graph clustering. In Proceedings of the AAAI Conference on Artificial Intelligence, volume 28, 2014.
- [27] Daixin Wang, Peng Cui, and Wenwu Zhu. Structural deep network embedding. In Proceedings of the 22nd ACM SIGKDD international conference on Knowledge discovery and data mining, pages 1225–1234, 2016.
- [28] Minji Yoon, Bryan Hooi, Kijung Shin, and Christos Faloutsos. Fast and accurate anomaly detection in dynamic graphs with a two-pronged approach. In Proceedings of the 25th ACM SIGKDD International Conference on Knowledge Discovery & Data Mining, pages 647–657, 2019.
- [29] Weiren Yu, Charu C Aggarwal, Shuai Ma, and Haixun Wang. On anomalous hotspot discovery in graph streams. In 2013 IEEE 13th International Conference on Data Mining, pages 1271–1276. IEEE, 2013.
- [30] Wenchao Yu, Wei Cheng, Charu C Aggarwal, Kai Zhang, Haifeng Chen, and Wei Wang. Netwalk: A flexible deep embedding approach for anomaly detection in dynamic networks. In Proceedings of the 24th ACM SIGKDD International Conference on Knowledge Discovery & Data Mining, pages 2672–2681, 2018.
- [31] Wenchao Yu, Guangxiang Zeng, Ping Luo, Fuzhen Zhuang, Qing He, and Zhongzhi Shi. Embedding with autoencoder regularization. In Joint European Conference on Machine Learning and Knowledge Discovery in Databases, pages 208–223. Springer, 2013.
- [32] Lekui Zhou, Yang Yang, Xiang Ren, Fei Wu, and Yueting Zhuang. Dynamic network embedding by modeling triadic closure process. In Proceedings of the AAAI Conference on Artificial Intelligence, volume 32, 2018.