Core-based Trend Detection in Blockchain Networks [Scalable Data Science]
Abstract.
Blockchains are now significantly easing trade finance, with billions of dollars worth of assets being transacted daily. However, analyzing these networks remains challenging due to the large size and complexity of the data. We introduce a scalable approach called InnerCore for identifying key actors in blockchain-based networks and providing a sentiment indicator for the networks using data depth-based core decomposition and centered-motif discovery. InnerCore is a computationally efficient, unsupervised approach suitable for analyzing large temporal graphs. We demonstrate its effectiveness through case studies on the recent collapse of LunaTerra and the Proof-of-Stake (PoS) switch of Ethereum, using external ground truth collected by a leading blockchain analysis company. Our experiments show that InnerCore can match the qualified analysis accurately without human involvement, automating blockchain analysis and its trend detection in a scalable manner.
PVLDB Reference Format:
PVLDB, 16(1): XXX-XXX, 2023.
doi:XX.XX/XXX.XX
††This work is licensed under the Creative Commons BY-NC-ND 4.0 International License. Visit https://creativecommons.org/licenses/by-nc-nd/4.0/ to view a copy of this license. For any use beyond those covered by this license, obtain permission by emailing info@vldb.org. Copyright is held by the owner/author(s). Publication rights licensed to the VLDB Endowment.
Proceedings of the VLDB Endowment, Vol. 16, No. 1 ISSN 2150-8097.
doi:XX.XX/XXX.XX
PVLDB Artifact Availability:
The source code, data, and/or other artifacts have been made available at %leave␣empty␣if␣no␣availability␣url␣should␣be␣sethttps://github.com/JZ-FSDev/InnerCore.
1. Introduction
Blockchain technology has been gaining increasing popularity over the past few years, revolutionizing the way we store and transfer digital assets (Nakamoto, 2008; Wood, 2014). Public blockchain networks are also completely open, where anonymous addresses use transactions to move cryptocurrencies and trade/invest in assets. While the technology offers numerous benefits, it also poses significant challenges, particularly in the area of cybersecurity. Blockchains enable electronic crimes in a variety of ways (Wu et al., 2022), ranging from demands for ransomware (Huang et al., 2018) to transactions in darknet markets (Jiang et al., 2021).
One of the biggest challenges in securing blockchain networks is detecting and preventing e-crimes. E-crimes detection requires scalable analysis of large-scale blockchain graphs in real-time, where results are both qualified and manageable by human analysts. To address this challenge, researchers have developed tools and algorithms for analyzing blockchain networks (Victor et al., 2021; Akcora et al., 2018; Abay et al., 2019; Su et al., 2022; Khan and Akcora, 2022).
Unfortunately, analyzing blockchain networks is an arduous task, given their large size and the anonymity of actors involved. It is crucial to devise scalable and effective methods that can analyze blockchain networks in real-time, to avoid future losses. The failure to conduct timely analysis of blockchain networks has already resulted in a staggering loss of over billions of dollars to blockchain users, as evident by the recent collapse of LunaTerra (Faux and Shen, 2022).
In this article, we introduce a new approach to e-crimes and trends detection. Our approach, InnerCore, involves identifying influential addresses with data depth-based core decomposition and further filtering out the role of addresses by using a centered-motif approach. InnerCore analysis can reduce large graphs having more than 400K nodes and 1M edges to an induced subgraph of less than 300 nodes and 90K edges, while still being able to detect the most influential nodes. InnerCore is unsupervised and highly scalable, yielding only 4-second running times on daily Ethereum graphs with 500K nodes and 1M edges. We apply InnerCore to two recent influential events in the blockchain world: the collapse of LunaTerra in May 2022 and the Proof-of-Stake (PoS) switch of Ethereum in September 2022. Empirical study demonstrates that our proposed approach effectively detects changes within the network without the need for human intervention.
Additionally, our method excels at efficiently identifying the most influential addresses within the network with a high level of precision, highlighting its utility in identifying key actors in blockchain-based networks.
Our key novelties are summarized below.
-
•
InnerCore: We propose InnerCore, a data depth-based core discovery method that can identify the most influential investors and traders in blockchain-based asset networks (§3.1).
- •
-
•
Unsupervised address discovery: Through conducting node ranking with a centered-motif approach in temporal asset networks, we demonstrate that InnerCore tracking can detect e-crime behavior and warn the network about possible long-term instability, without the need for supervised address discovery (§3.4).
-
•
Scalability: Due to their computational efficiency and ability to utilize only a small portion of graph nodes and edges to analyze overall behavior, the InnerCore discovery and expansion/decay calculations are suitable for application on large temporal graphs including Ethereum transaction and stablecoin networks (§4).
We discuss preliminaries and our problem in §2. Additional related works are specified in the Appendix.
2. Background and Problem Formulation
We discuss preliminaries on blockchain, smart contracts, and stablecoins (§2.1, §2.2), followed by one key technique AlphaCore decomposition (§2.3). We introduce our problem in §2.4.
2.1. Blockchain and Smart Contracts
A blockchain is an immutable public ledger that records transactions in discrete data structures called blocks. The earliest blockchains are cryptocurrencies such as Bitcoin and Litecoin where a transaction is a transfer of coins.
The Ethereum project (Wood, 2014) was created in July 2015 to provide smart contract functionality on a blockchain. Smart contracts are Turing complete software codes that are replicated across a blockchain network. The contracts ensure deterministic code execution that can be verified publicly.
Smart contracts have implemented mechanisms to trade digital assets, known as tokens (Victor and Lüders, 2019). Similar to cryptocurrencies, a token is transferred publicly between accounts (addresses), and may have an associated value in fiat currency which is arbitrated by token demand and supply in the real world.
2.2. Stablecoins
A stablecoin is a smart contract-based asset whose price is protected against volatility by i) collateralizing the stablecoin with one or more offline real-life assets (e.g., USD, gold), ii) using a dual coin, or by iii) employing algorithmic trading mechanisms (Moin et al., 2019).
In the pegged asset mechanism, an increase in the price is countered by creating more stablecoins (i.e., coin minting) and selling them to investors at the pegged price. The dual coin mechanism operates by having a management coin, referred to as the dual coin, to oversee a stablecoin. The investors of the dual coin participate in decision making through voting and receive benefits from the stablecoin’s transactions. In the event that the stablecoin’s price rises, some of the dual coin will be sold to purchase and decrease the supply of the stablecoin. Conflicting demand and supply dynamics of the two coins are assumed to stabilize the stablecoin’s price. However, investors may lose faith in the stablecoin to such a degree that they might also not buy the dual coin, however cheap it becomes. Stablecoins that are based on algorithmic trading do not require collateral for stability. They achieve stability through the utilization of a blockchain-based algorithm that adjusts the supply of tokens automatically in response to changes in demand.
2.3. Data Depth-Based Core Decomposition
Core decomposition (Malliaros et al., 2020) is a central technique used in network science to determine the significance of nodes and to find community structures in a wide range of applications such as biology (Luo et al., 2009), social networks (Al-garadi et al., 2017), and visualization (Zhang and Parthasarathy, 2012). One of the best-known representatives of core decomposition algorithms, graph--core (Seidman, 1983; Batagelj and Zaversnik, 2011), finds the maximal subgraph where each node has at least neighbors in that subgraph. Although the graph--core algorithm demonstrates high utility for analysis of graph structural properties, it does not account for important graph information such as the direction of edges, edge weights, and node features.
To address these limitations, multiple modifications of graph--core have been proposed to tackle task-specific graphs, e.g., graph--core in weighted and directed graphs, generalized -core (Al-garadi et al., 2017; Zhou et al., 2021; Liao et al., 2022; Batagelj and Zaveršnik, 2002; Garas et al., 2012; Giatsidis et al., 2011). Different from them, AlphaCore (Victor et al., 2021) is a recent core decomposition algorithm that combines multiple node properties using the statistical methodology of data depth (Mosler, 2012). The key idea of data depth is to offer a center-outward ordering of all observations by assigning a numeric score in to each data point with respect to its position within a cloud of a multivariate probability distribution. Using such a data depth function designed for directed and weighted graphs, AlphaCore maps a node with multiple features to a single numeric score, while preserving its relative importance with respect to other nodes.
As the AlphaCore decomposition unfolds, the data depth values are repeatedly updated through the calculation of node property functions and the application of data depth to the resulting values.
Consider a directed and weighted multigraph, , where represents the set of nodes and is a multiset of edges. The weight of each edge is designated by the weight function . In accordance with the generalized core definitions introduced in (Batagelj and Zaveršnik, 2002), a node property function can assign a real value to each node , based on edge properties such as weight. A node can be represented by its feature vector , where features have been computed for the node .
Definition 0 (Mahalanobis depth to the origin (MhDO)).
Let be an observed data point, then Mahalanobis (MhD) depth of x in respect to a -variate probability distribution with mean vector and covariance matrix is given by
| (1) |
is the covariance matrix of . The Mahalanobis data depth to origin (MhDO) measures the degree of ”outlyingness” of point x (in this context, the node property column vector) in relation to origin .
The core value of a node is established using a data depth threshold that is applied to remove neighboring high depth nodes iteratively. Nodes with high property values, such as large edge weights, generally have a low depth, while nodes with low property values often have a high depth, such as most blockchain nodes that trade small amounts of tokens. However, node property values are not the only factor that determines depth; the community structure around the node also plays a role. Nodes are considered to be in the -core if their depth, relative to themselves, is no more than .
Why Data Depth? Data depth provides a more precise identification of crucial nodes compared to state-of-the-art core decomposition algorithms and acts as a combination of centrality measure and core decomposition (Victor et al., 2021). Unlike traditional decomposition algorithms, a depth-based decomposition does not require the specification of multiple feature weighting parameters to perform effectively on a particular task. We provide a running example in the Appendix.
2.4. Problem Definition
Given a snapshot of weighted, directed, multi-graphs over successive timestamps, where denotes the graph at timestamp , its set of nodes (i.e., investors/traders), and its multiset of edges (i.e., transactions) representing the transfer of underlying asset, we aim to (i) locate the most important node set at time such that the behavior of nodes in can be used to characterize the future success of the underlying asset at , and (ii) categorize investors’ behavior in terms of the future health and success of the underlying asset.
To resolve above problems, we identify nodes in the innermost AlphaCore, as well as characterize three-node motifs in these innermost cores from our transaction networks. In our experiments, we demonstrate that nodes in the innermost AlphaCore are more useful, compared to other notions of important nodes, in characterizing and predicting the future success of the blockchain assets.
3. Methodology
In keeping with the daily routine of daily life, blockchain networks are frequently examined on a daily basis (Casale-Brunet et al., 2021; Chen et al., 2020). We divide a blockchain network into daily intervals, using a reference time zone to create a set of snapshot graphs. In a snapshot graph of a blockchain network, a node represents a trader/investor, whereas an edge denotes a financial transaction. Next, we define InnerCore, InnerCore expand, and InnerCore decay on the snapshot graphs.
We use in-degree, out-degree, in-strength, and out-strength as node properties (defined in Table 1) to compute the AlphaCore decomposition of a snapshot graph, as these node features can be defined easily for a weighted, directed, multi-graph. Core decomposition helps us eliminate unimportant edges and nodes (e.g., addresses trading small amounts). Using the results of the core decomposition, we then identify an InnerCore of nodes, which helps us pinpoint the most influential nodes.
| Function | Definition |
|---|---|
| neighbors of | |
| neighbors reachable with outgoing edges from | |
| neighbors reachable with incoming edges to | |
| edges to/from (Degree) | |
| outgoing edges from (Out-Degree) | |
| incoming edges to (In-Degree) | |
| sum of edge weights incident to a node (Strength) | |
| sum of outgoing edge weights (Out-Strength) | |
| sum of incoming edge weights (In-Strength) |
3.1. InnerCore of a Graph
The data depth of a node is defined as the degree of ”outlyingness” of the node property function in relation to the origin . We define the InnerCore of as the set of nodes whose data depth, relative to themselves, is less than an value. We set to a small value, and iteratively recompute the depth of each node as we remove nodes whose data depth is greater than in each iteration. This process continues until no more nodes can be removed. The resulting set of nodes is the InnerCore of the graph. The InnerCore computation is illustrated in Algorithm 1.
Algorithm 1 computes a feature matrix based on each node property function in line 1. For instance, this could include a node’s neighborhood size as listed in Table 1. The feature matrix is used to compute the inverse covariance matrix in line 1, which will be utilized for future data depth calculations. The initial depth of each node is determined using the Mahalanobis depth with respect to the origin at line 1. Nodes with depth greater than or equal to input are removed from the node set at line 1. Once one batch of node removals has been performed, the feature matrix and depth values are re-evaluated in lines 1–1. If any remaining nodes still have a depth greater than or equal to , the next batch is initiated at the same level. When there are no nodes left with depth larger than , the algorithm is considered complete, and the remaining nodes in are returned as the InnerCore.
Scalability. Computing the InnerCore requires performing Cholesky decomposition on the covariance matrix at line 1 once, which has time complexity for features. Node features need to be recomputed at each iteration of the while loop with a cost of , where is the average degree in the graph. There are at most iterations (number of nodes). In the worst case, the total time complexity is . However, since the neighborhood of a node can be sparse, the value of is small. Moreover, since multiple nodes are removed in batches, the number of iterations is much smaller than . For example, in a network with approximately 480,000 nodes and 1 million edges (§4), only 4 iterations on average are needed for an of 0.1.
InnerCore vs. Alphacore. InnerCore discovery of a graph does not require a complete decomposition of all graph cores by varying , as it is done in AlphaCore (Victor et al., 2021). Instead, we set an value (e.g., ) just once, and then use the value to iteratively prune nodes until all remaining nodes, relative to themselves, satisfy a data depth less than . The InnerCore approach is also different from graph--core decomposition (Batagelj and Zaversnik, 2011), where the outer cores are computed first before the higher -core can be determined. As a result, InnerCore discovery is quite scalable and can be applied to very large graphs. Our experiments in §4 reveal that InnerCore discovery has a running time that is only one-tenth of that required for AlphaCore decomposition.
3.2. InnerCore Expansion and Decay
By analyzing how a temporal graph expands and shrinks in relation to the entry and exit of nodes on a daily basis, we can gain valuable insights into market sentiment. Specifically, we investigate how the InnerCore of a network expands and decays on a given day compared to previous days. We define two measures to quantify the activity of influential nodes in the network: expansion and decay. Expansion measures the ratio of influential nodes on day that were also influential in the preceding days, while decay quantifies the ratio of influential nodes from the previous days that are not present in the influential nodes of day . We define the influential nodes of a graph as its InnerCore nodes (i.e., ).
To this end, we first discover as the set of nodes in the InnerCore of the snapshot graph at timestamp , and define as the union set of nodes in the InnerCore of snapshot graphs from timestamps for . Next, we define the expansion and decay measures at timestamp as follows:
Definition 0 (Expansion).
The expansion values have a range , where a value greater than 1 indicates a growth in the size of InnerCore.
Definition 0 (Decay).
The decay values have a range , where a value of 0 indicates that all InnerCore members from are present at as well.
Example 1 (Expansion and Decay).
Suppose we have a temporal graph that produces two daily snapshot graphs at days and . On day , the InnerCore is composed of five nodes: . On day , the InnerCore has expanded to include eight nodes: .
If we set , we can calculate the expansion and decay measures for day based on the previous day. In this case, the union of the InnerCores is . Therefore, we have:
The expansion measure is equal to , which yields a value of 1. The decay measure is equal to , which yields a value of 0.4.
3.3. Behavioral Patterns in Temporal Networks
Temporal networks, such as blockchain networks, are constantly evolving and may undergo significant changes in user sentiment and node activity due to technological updates and cataclysmic events in as little as a few days.
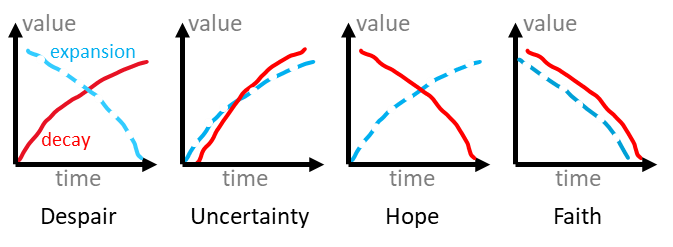
By utilizing expansion and decay, we have identified four behavioral patterns that capture user sentiment and node activity. These patterns serve as the foundation for network analysis in our experiments detailed in §4. Figure 1 illustrates the expansion and decay values for each pattern. To gain a better understanding of these patterns, particularly when examining the temporal graph of a financial network such as the Ethereum transaction network, it is helpful to consider the network’s underlying transaction semantics.
-
•
The Despair pattern is characterized by a reduction in expansion and an increase in decay, implying that previously influential nodes are leaving the network, while the InnerCore is shrinking due to a decrease in the number of new influential nodes.
-
•
The Uncertainty pattern is distinguished by an increase in both expansion and decay. This is primarily due to the influx of many new investors into the network who do not remain active for a significant period of time.
-
•
The Hope pattern is characterized by a reduction in decay and an increase in expansion, indicating the presence of many newcomers to the network who remain active within the network.
-
•
The Faith pattern is identified by a decrease in both decay and expansion, which initially suggests a state of confusion. On the positive side, nodes, such as investors, may have faith in the network’s ability to withstand a catastrophic event, as demonstrated in the LunaTerra case in our experimental results. On the negative side, it may indicate a sense of hopelessness as investors may hold onto their assets without engaging in transactions or exiting the system altogether.
3.4. Motif Analysis in Innercore
Our rationale behind using motif analysis in conjunction with InnerCore is to accurately discover larger and potentially influential players in the daily network. The structure of a motif defines a behavior of interest and its existence in a network indicates the presence of such behavior.

Motif analysis has been a popular tool to identify subgraph patterns and the addresses involved in them (Lee et al., 2020; Bailey et al., 2009; Zhang and Parthasarathy, 2012; Paranjape et al., 2017; Milo et al., 2002). We have decided to use three-node motifs since they can be identified more quickly than higher-order motifs, while still capturing the direct buying or selling behavior between addresses. Our decision is consistent with previous research on temporal motifs (Paranjape et al., 2017).
Scalability. The fastest triangular motif discovery algorithm has time complexity , where is the fast matrix product exponent (Latapy, 2008; Coppersmith and Winograd, 1987). The number of nodes in the InnerCore is denoted by . We demonstrate in §4 that triangular motif discovery on InnerCores has low time costs because of the relatively small size of daily networks’ InnerCores.
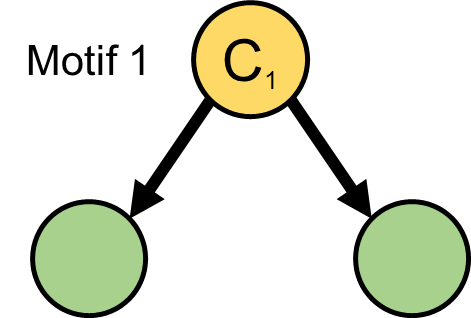
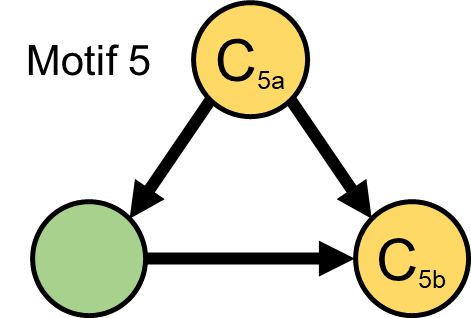
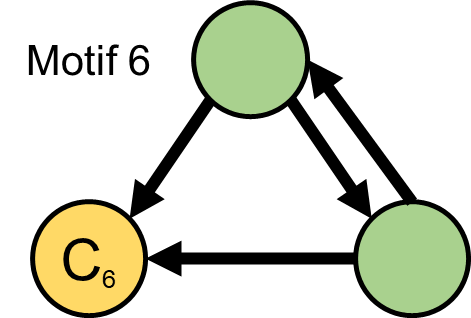
We define the center of each 3-node motif as a node that either receives incoming edges from the two other nodes (buy behavior) or delivers outgoing edges to two other nodes (sell behavior). This definition ensures that motif centers exhibit buy or sell behavior, and they do not act as intermediary nodes between the other two nodes in a motif.
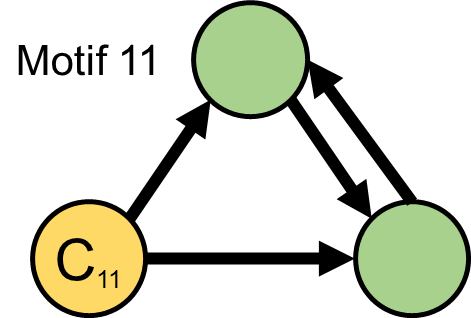
Out of the 16 connected three-node motifs (see Figure 1B in (Milo et al., 2002)), only five of them contain a center node (Figure 2). We identify all instances of these five motifs and their centers from our daily networks’ InnerCores. Finally, we utilize the well-known TF-IDF measure from information retrieval (Salton and Buckley, 1988) to rank the discovered center nodes.
TF-IDF is a statistical measure to reflect the relevance of a word in a collection of documents. In our setting, we treat each discovered center address as a word and daily instances of each motif as a collection of documents to propose a novel node relevance score for temporal graphs: NF-IAF.
Formally, let be the set of five motifs of interest, and let be the set of days under consideration. For each and , let denote the number of occurrences of node in all instances of motif on day . For all , , and , we define the node frequency (NF) and inverse-appearance frequency (IAF) as follows:
Definition 0 (Node Frequency).
We define the node frequency of node for motif on day as
The NF measures how frequently a particular node occurs in a specific motif on a specific day relative to the total number occurrences of all nodes in that motif on that day.
Definition 0 (Inverse Appearance Frequency).
We define the inverse appearance frequency of node for motif as
where is the total number of days in the dataset, and is defined as the number of days where .
The IAF measures the importance of a node by how frequently it appears across all days for a motif. If a node appears in many days for a motif, its IAF will be low, indicating that it is not very informative. On the other hand, if a node appears in only a few days for a motif, its IAF will be high, indicating that it is a rare and potentially important node.
Definition 0 (NF-IAF Score).
The NF-IAF score of node for motif on day is given as
A greater NF-IAF score of a center node on a particular day indicates greater relevance between that node and the behavior associated with the motif type. Therefore, a node corresponding to a motif center on a particular day with a high NF-IAF score has an increased likelihood that it has more influence on the network on that day, while a lower NF-IAF score indicates the opposite.
Example 2.
Table 2 shows the number of occurrences of three nodes over three days for motifs and . For example, to compute , we divide the number of times appears in instances of on day , by the total number of occurrences of all nodes in instances of on day . Similarly, we compute as appears in all three days for . Thus, . The resulting NF-IAF score for each node, motif, and day combination is given in the right panel of Table 2.
| Occurrence | NF-IAF Score | |||||||||||
| node | ||||||||||||
| 5 | 4 | 3 | 0 | 0 | 15 | 0.25 | 0.25 | 0.25 | 0 | 0 | 0.92 | |
| 15 | 12 | 9 | 4 | 7 | 9 | 0.75 | 0.75 | 0.75 | 0.16 | 0.23 | 0.26 | |
| 0 | 0 | 0 | 21 | 23 | 35 | 0 | 0 | 0 | 0.84 | 0.74 | 0.71 | |
4. Experimental Study
In this section we first describe two large temporal blockchain graphs that we use to answer our research questions (§2.4). Next, we analyze the scalability of InnerCore discovery and centered-motif analysis on these graphs. Upon demonstrating our scalability results, we illustrate how our methods provide predictive insights into anomalies stemming from external events and identify the addresses that played a significant role in such events. Our code and datasets are available at https://github.com/JZ-FSDev/InnerCore.
4.1. Environment Setup
4.1.1. Datasets
Our experiments investigate the Ethereum transaction network and Ethereum stablecoin networks during three events: the LunaTerra collapse, Ethereum PoS (proof-of-stake) phase 1, and Ethereum PoS phase 2.
Ethereum Stablecoin Networks. We retrieve transaction data for the top five stablecoins based on market capitalization (USDT, USDC, DAI, UST, PAX) and WLUNA from the Chartalist repository (Shamsi et al., 2022). The data pertains only to transactions conducted on the Ethereum blockchain; each transaction in the data set corresponds to a transfer of the asset indicated by the contract address. However, the UST collapse event that we are studying involved another blockchain called Terra with its own network, and the cryptocurrency called Luna, acting as a parallel to ether on Ethereum. Terra also issued a stablecoin named TerraUSD, which offered high-interest rates to lenders. Additionally, Terra’s owners created another stablecoin called UST on the Ethereum blockchain, which was pegged to the value of USD$1. Furthermore, a Wrapped LUNA (WLUNA) token was established to trade Luna tokens on Ethereum.
In May 2022, the Terra blockchain and its cryptocurrency Luna collapsed, owing to TerraUSD loans that could not be repaid. A Luna coin that was valued at $USD116 in April plummeted to a fraction of a penny during the collapse. This resulted in a loss of confidence in both WLUNA and UST on Ethereum. On May 9th, 2022, UST lost its $USD1 peg and fell as low as 35 cents. The dataset covers the period from April 1st, 2022, to November 1st, 2022, spanning about one month before the crash to six months after the crash. In addition to the transactions, we also use the address labels dataset from (Shamsi et al., 2022) where labels of 296 addresses from 149 centralized and decentralized Ethereum exchange addresses are listed publicly.
Ethereum Transaction Network. We collected ether transactions from the Ethereum blockchain for the period between August 23rd and September 29th, 2022. On an average day during this period, there were 480,000 addresses, with approximately 1 million edges connecting them. Ether is a type of cryptocurrency, similar to bitcoin, and its value can be converted to various fiat currencies such as USD and JPY. The nodes on the graph could represent investors who anticipate future price increases for ether, or traders who engage in buying and selling goods and services. Ethereum changed its block creation process during this time, moving from the costly Proof-of-Work method to the more efficient Proof-of-Stake algorithm in two phases on September 9th and 15th, 2022.
4.1.2. Parameters
In the context of InnerCore expansion and decay, a greater (i.e., the history parameter from §3.2) produces an averaging effect, coupled with the tendency to depress expansion rates and inflate decay rates. Setting a specific value depends on the application; in general, higher reduces fluctuations between expansion and decay rates of each day. In our applications, we use = 1 to improve the accentuation of expansion and decay in the InnerCore to better depict the shift in market sentiment during the days of significant events in our case studies.
In AlphaCore decomposition, depth values range between ; nodes with high property values (e.g., many transactions, higher transacted amounts) tend to have low depth, while nodes with low property values tend to have high depth (Victor et al., 2021). With data depth threshold , all nodes will be returned as InnerCore members; while for , the empty set will be returned. Setting an appropriate depends on the desired size of the InnerCore returned specific to an application. In our applications, we set to ensure that the average number of nodes in each daily InnerCore is above 150.
4.2. Scalability Analysis
System Specifications. The machine used for experiments is an Intel Core i7-8700K CPU @ 3.70GHz processor, 32.0GB RAM, Windows10 OS, and GeForce GTX1070 GPU. A combination of Python and R was used for coding.
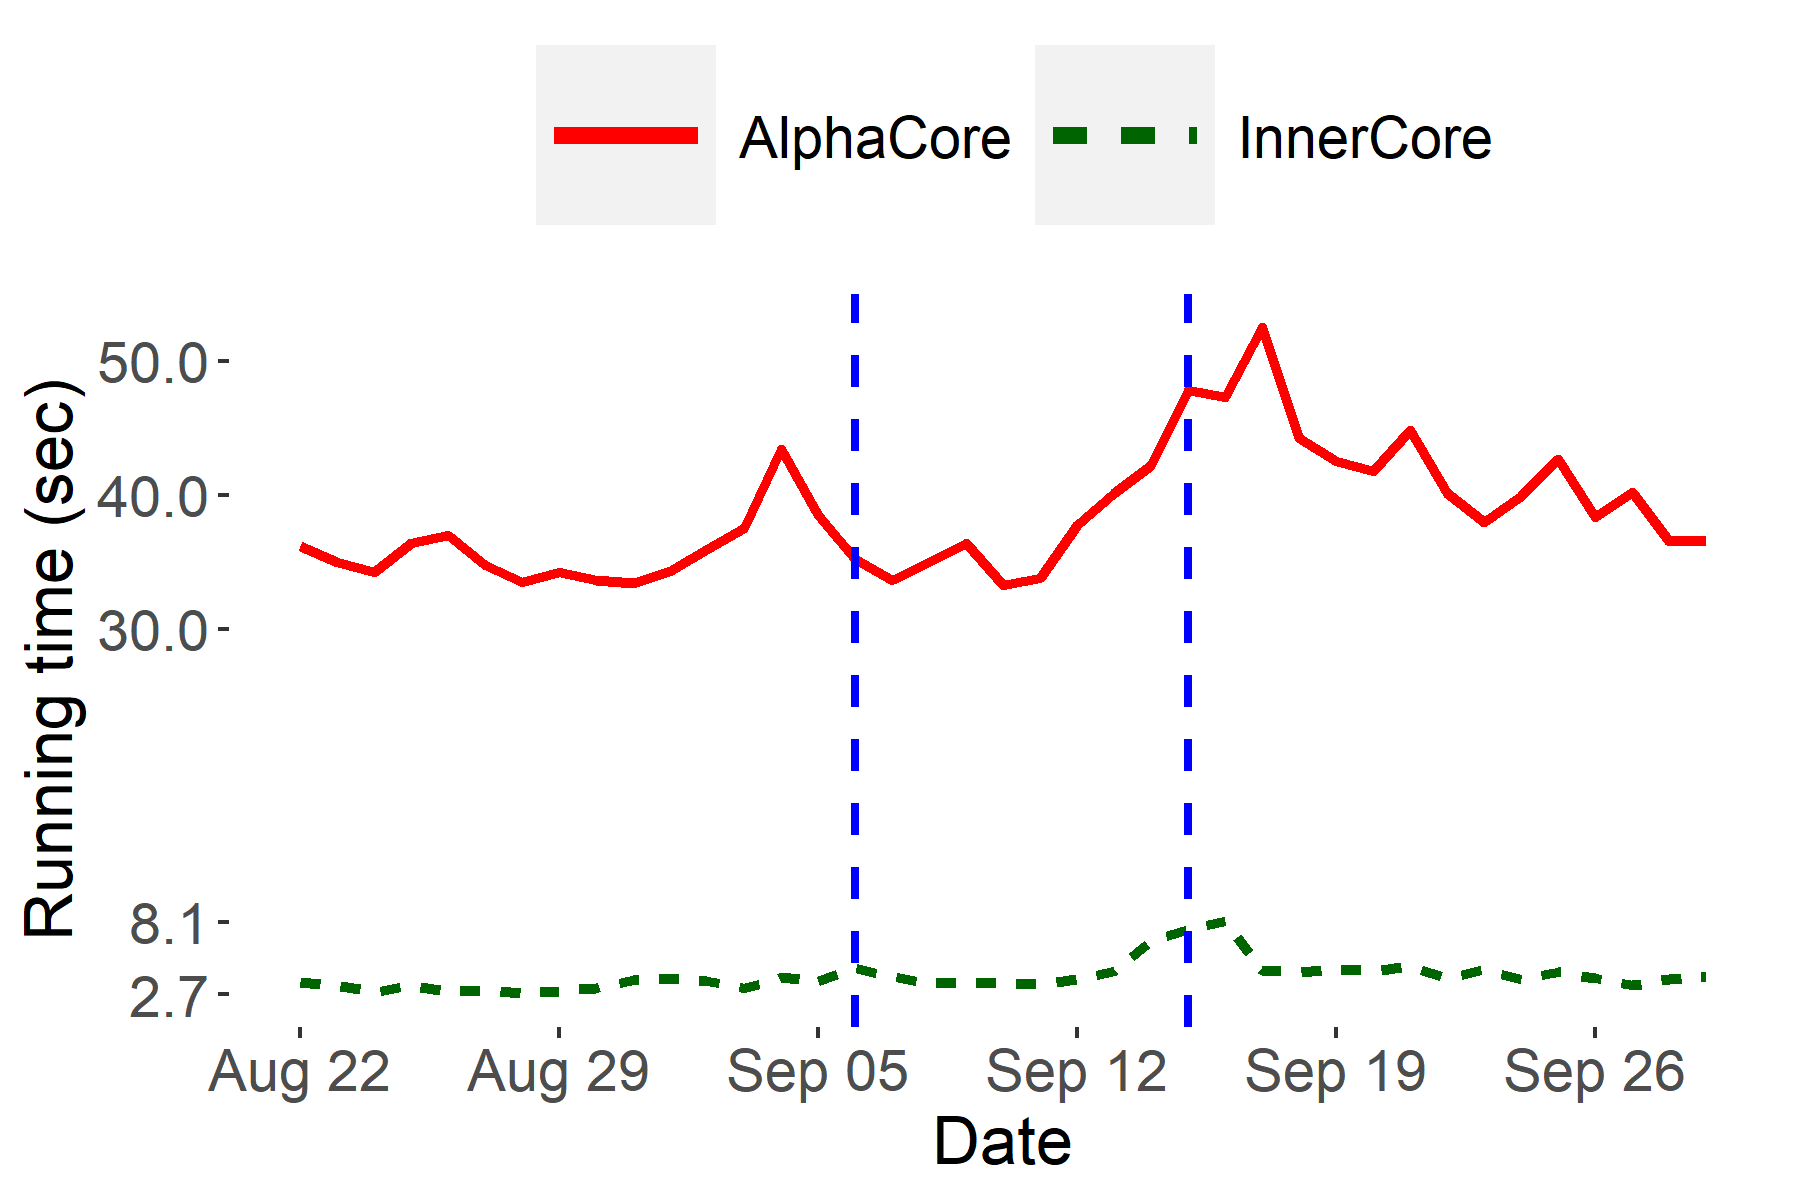
InnerCore Discovery. Since we are interested in directly finding the InnerCore, compared to AlphaCore decomposition (Victor et al., 2021), our InnerCore discovery method (§3.1) does not associate different values to intermediate cores generated in an iterative stepwise fashion. Instead, a fixed threshold , or upper bound for depth, is set and all nodes with a depth greater than are pruned repetitively until all remaining nodes relative to each other in the resulting network have a depth ¡ . Effectively, this allows InnerCore discovery to run approximately 1/stepsize times faster than AlphaCore decomposition, since the computations of all intermediate cores are skipped. As depicted in Figure 3, InnerCore discovery has a running time of only one-tenth of that for AlphaCore decomposition. Furthermore, the average running time for InnerCore discovery is only 4.06 seconds on graphs with approximately 480,000 nodes and 1 million edges, which demonstrates the scalability of our approach.
Three-Node Motifs Counting. Instead of conducting motif analysis on all nodes, our approach utilizes the InnerCore. By focusing on this core subset of nodes, we are able to reduce the number of nodes in a daily network consisting of approximately 480,000 nodes and 1 million edges to an induced subgraph of roughly 300 nodes and 90,000 edges (counting multi-edges), resulting in a more manageable and efficient approach. Although motif counting on each snapshot graph takes 1 day to complete, motif counting inside InnerCore significantly improves the processing speed, requiring only 1 sec to complete, which illustrates our scalability.
4.3. Case 1: The Collapse of LunaTerra
Stablecoins are meant to be a safe house as they are generally pegged to and maintain a 1:1 ratio with a fiat currency, resisting the volatility associated with other popular cryptocurrencies. Commonly, investors keep blockchain assets not needed for immediate use in a transaction as a stablecoin, analogous to people keeping extra money in a bank. For this reason, the LunaTerra collapse was a historic event in the decentralized financial space as it questioned investors’ trust in cryptocurrencies; if even stablecoins are susceptible to collapse, then is any cryptocurrency truly safe?
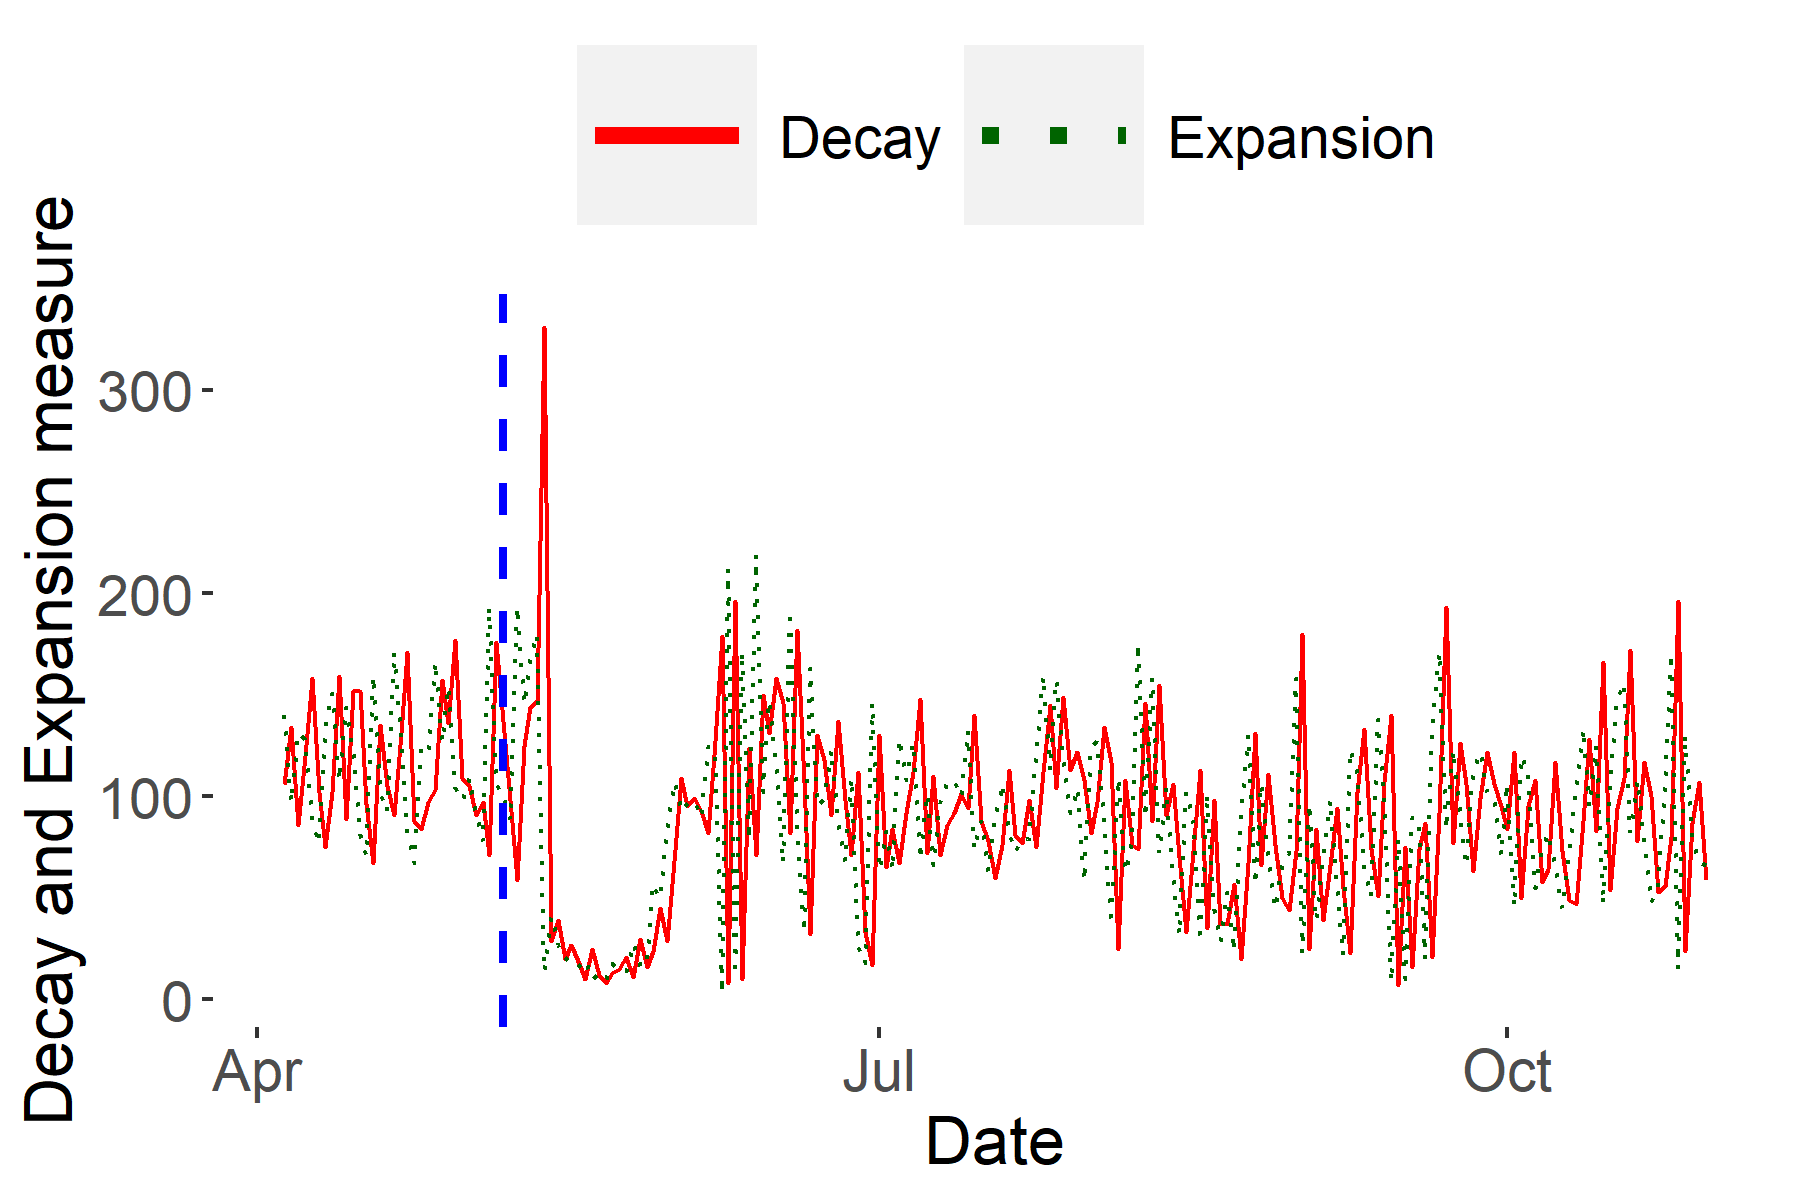
First, we analyze this event from the perspective of investors’ market sentiment in the stablecoin network. Specifically, we examine behavioral patterns in the expansion and decay measures of the temporal stablecoin network of the days surrounding the collapse. From Figure 4, we observe that four days after the collapse unfolded, on May 13, 2022, there is a substantial increase in decay and a decrease in expansion: a prime indicator of the despair behavioral pattern (§3.3). We can infer from this signal that a large majority of regular investors stopped trading by this time, either from the conversion or sale of any assets stored as UST out of the stablecoin ecosystem, or simply due to uncertainty and inaction in response to the collapse. Following this cue, for approximately two weeks afterward, we see a consistent behavioral pattern of faith characterized by low expansion and low decay. During this period, few new investors entered or left the stablecoin network. There was still faith in the remaining investors that perhaps a large stablecoin such as UST could rebound and restore its peg with USD and thus, they refrained from engaging in any transactions. On the other hand, decay and expansion values also indicate a sign of hopelessness as bulk of investors already exited the network since the first signal of despair. We understand from this behavioral analysis that there is a delayed reaction from investors when a significant unannounced event occurs due to indecision, and there is a general trend of inactivity in the following period.
| # Unique Addresses | # Exchange Addresses | |
|---|---|---|
| Motif 1 | 1221 | 15 |
| Motif 4 | 1762 | 15 |
| Motif 5 | 1447 | 17 |
| Motif 6 | 1513 | 4 |
| Motif 11 | 939 | 11 |
| Address/Motif Center | ||||||
|---|---|---|---|---|---|---|
| Celsius | - | 81.2 | - | 78.9 | - | - |
| hs0327.eth | 88.2 | 67.0 | 96.2 | 69.7 | 81.6 | - |
| Smart LP: 0x413 | - | 68.4 | - | - | 95.1 | - |
| Token Millionaire 1 | 84.6 | 89.7 | - | 86.2 | 74.2 | 88.9 |
| Token Millionaire 2 | 69.7 | 99.5 | - | 98.7 | 98.9 | 37.6 |
| masknft.eth | 90.9 | 90.7 | - | 82.1 | 93.3 | 92.2 |
| Heavy Dex Trader | 71.3 | 96.2 | - | - | 81.2 | - |
| Oapital | 91.6 | 78.9 | 60.5 | 58.5 | 71.8 | 92.5 |
| Hodlnaut | 39.9 | 98.9 | - | 90.6 | 99.4 | - |
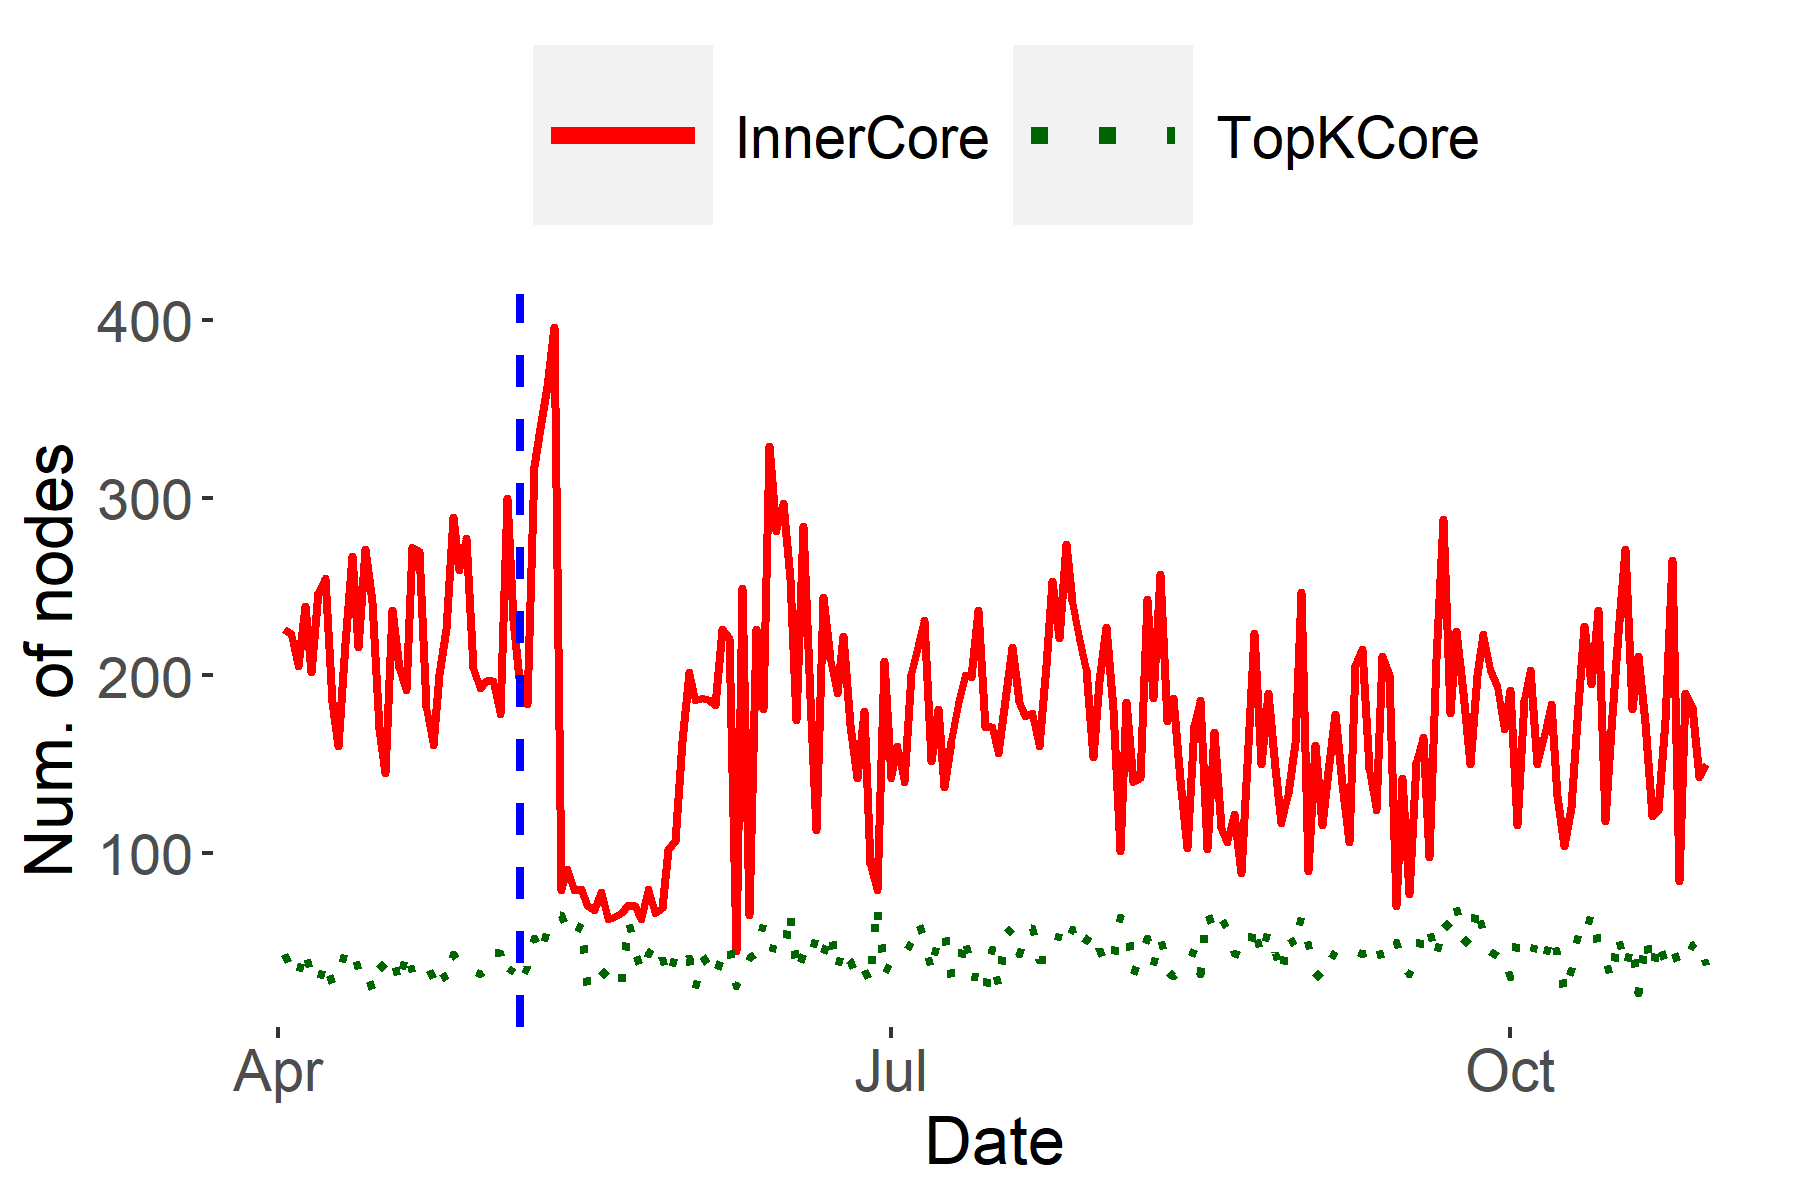
Compared to traditional graph--core decomposition where the target is the highest -core, AlphaCore with a fixed core target of = 0.1 (i.e., = 1 - 0.1 = 0.9) better accentuates the LunaTerra collapse when applied to temporal networks and comparing the sizes of the target cores. From Figure 5, it is evident that the size of the highest graph--core fluctuates randomly across each day and does not respond to changes in the health of the network. This can be attributed to the fact that graph--core decomposition only considers the degree of nodes irrespective of the edge weights. Conversely, AlphaCore considers all the provided node features (§3 and Table 1) into consideration when computing each node’s depth, which includes edge weights in addition to node degree. Therefore, if a node is incident to a single edge of extremely high edge weight, the highest graph--core will exclude this node; whereas AlphaCore will, depending on the target , maintain it in its InnerCore as the high edge weight offsets the low node degree.
We next focus on the unknown addresses that occurred most frequently as motif centers in InnerCores (defined in §3.4) on days immediately before the Luna Terra crash, since they could have influenced the initial phase of the crash.
Generally, a large amount of tokens transferred from one address to another is easily detectable due to the sheer volume. However, if an investor tries to confiscate detection, the investor could produce multiple transactions with smaller volumes. Additionally, often in a transaction where one token is exchanged for another, a series of multiple transfers can arise for a single conversion transaction due to interactions with exchanges.111https://etherscan.io/tx/0xa3663b813b2c13a88daeeb5b48b32b7024fc07cbf250f2c2a9318ec1950c9da9 Therefore, an investor is more likely to create transfers to various receiving addresses and receive transfers from various sending addresses, making the investor a prime candidate as a 3-node motif center.
To capture the transactions of investors converting between different stablecoins, we have included four stablecoins in our network along with UST. Specifically, before the LunaTerra collapse, it is reasonable to assume that investors responsible for the collapse would prepare for the anticipated negative consequences by exiting the UST network and entering another reliable stablecoin.
In a conversion transaction, participants sell their current assets to acquire different assets. Therefore, we anticipate that the investors responsible for the LunaTerra collapse will be highly relevant motif centers exhibiting both selling and buying behaviors.
Ground Truth. Nansen (https://www.nansen.ai/) is a prominent blockchain analytics platform that frequently publishes comprehensive analyses of blockchain events, which are followed with great interest by the industry. Six forensics experts from Nansen.ai conducted a thorough analysis of the LunaTerra collapse in May 2022 and identified 11 important addresses that played central roles in the collapse (Barthere et al., 2022). We aim to compare the addresses of interest detected by our InnerCore analysis using the centered-motif approach with those identified by Nansen.ai (Table 4) as the primary candidates for triggering the collapse.
Exchanges are an intermediary hub to facilitate transfers between investors. The addresses of exchanges are well-known for this reason, making them not very interesting in our context. In contrast, addresses that are not exchanges are mostly owned by investors and thus, the existence of such addresses and their edges in a network is a direct consequence of an investor’s activity in the network. From Table 3, we observe that motif centers identified from InnerCores have a high ratio of non-exchange addresses to exchange addresses (99%). This shows the effectiveness of our method to identify potentially meaningful addresses in a network different from high-traffic exchange addresses.
In particular, we capture 9 of 11 externally owned addresses (EoAs) in Table 4 identified by Nansen.ai that occurred as center addresses for our motif types (Figure 2) on days immediately leading up to the LunaTerra collapse. We notice that the NF-IAF score-based percentile ranks of these addresses are higher compared to that of other center addresses for the same motif type on the same day, indicating that these addresses were important investors contributing to the buy or sell behavior associated with the motif on the day. We surmise the possibility that certain EoAs found by our InnerCore method, coupled with centered-motif analysis, could have been responsible for the initial phase of the collapse.
Recall that in Figure 2, we defined motif centers , , and as exhibiting sell behavior; while motif centers , , and as exhibiting buy behavior. It is evident from Table 4 that every motif center on May 8, 2022 has at least one corresponding investor with an NF-IAF score-based percentile rank above 91. This suggests that addresses with greater NF-IAF percentiles exhibit a higher buy or sell behavior associated with the particular motif type on the day before the collapse. Specifically, we identify the two investors, masknft.eth and Oapital, as the most likely candidates for influencing the initial phase of the crash, since they are the two addresses with greater NF-IAF percentiles (above 90) occurring consistently across at least two motif types exhibiting sell behavior.
K-Core vs. InnerCore. We compare the addresses identified by InnerCore + centered-motif analysis with those in the highest graph--core on the May 8 (i.e., one day before the crash) stablecoin temporal network. We find that graph--core cannot identify any of the 11 addresses indicated by Nansen.ai as prime candidates for triggering the initial phase of the LunaTerra collapse. In comparison, InnerCore + centered-motif analysis captures potentially anomalous buy and sell behaviors by identifying 9 of the 11 addresses.
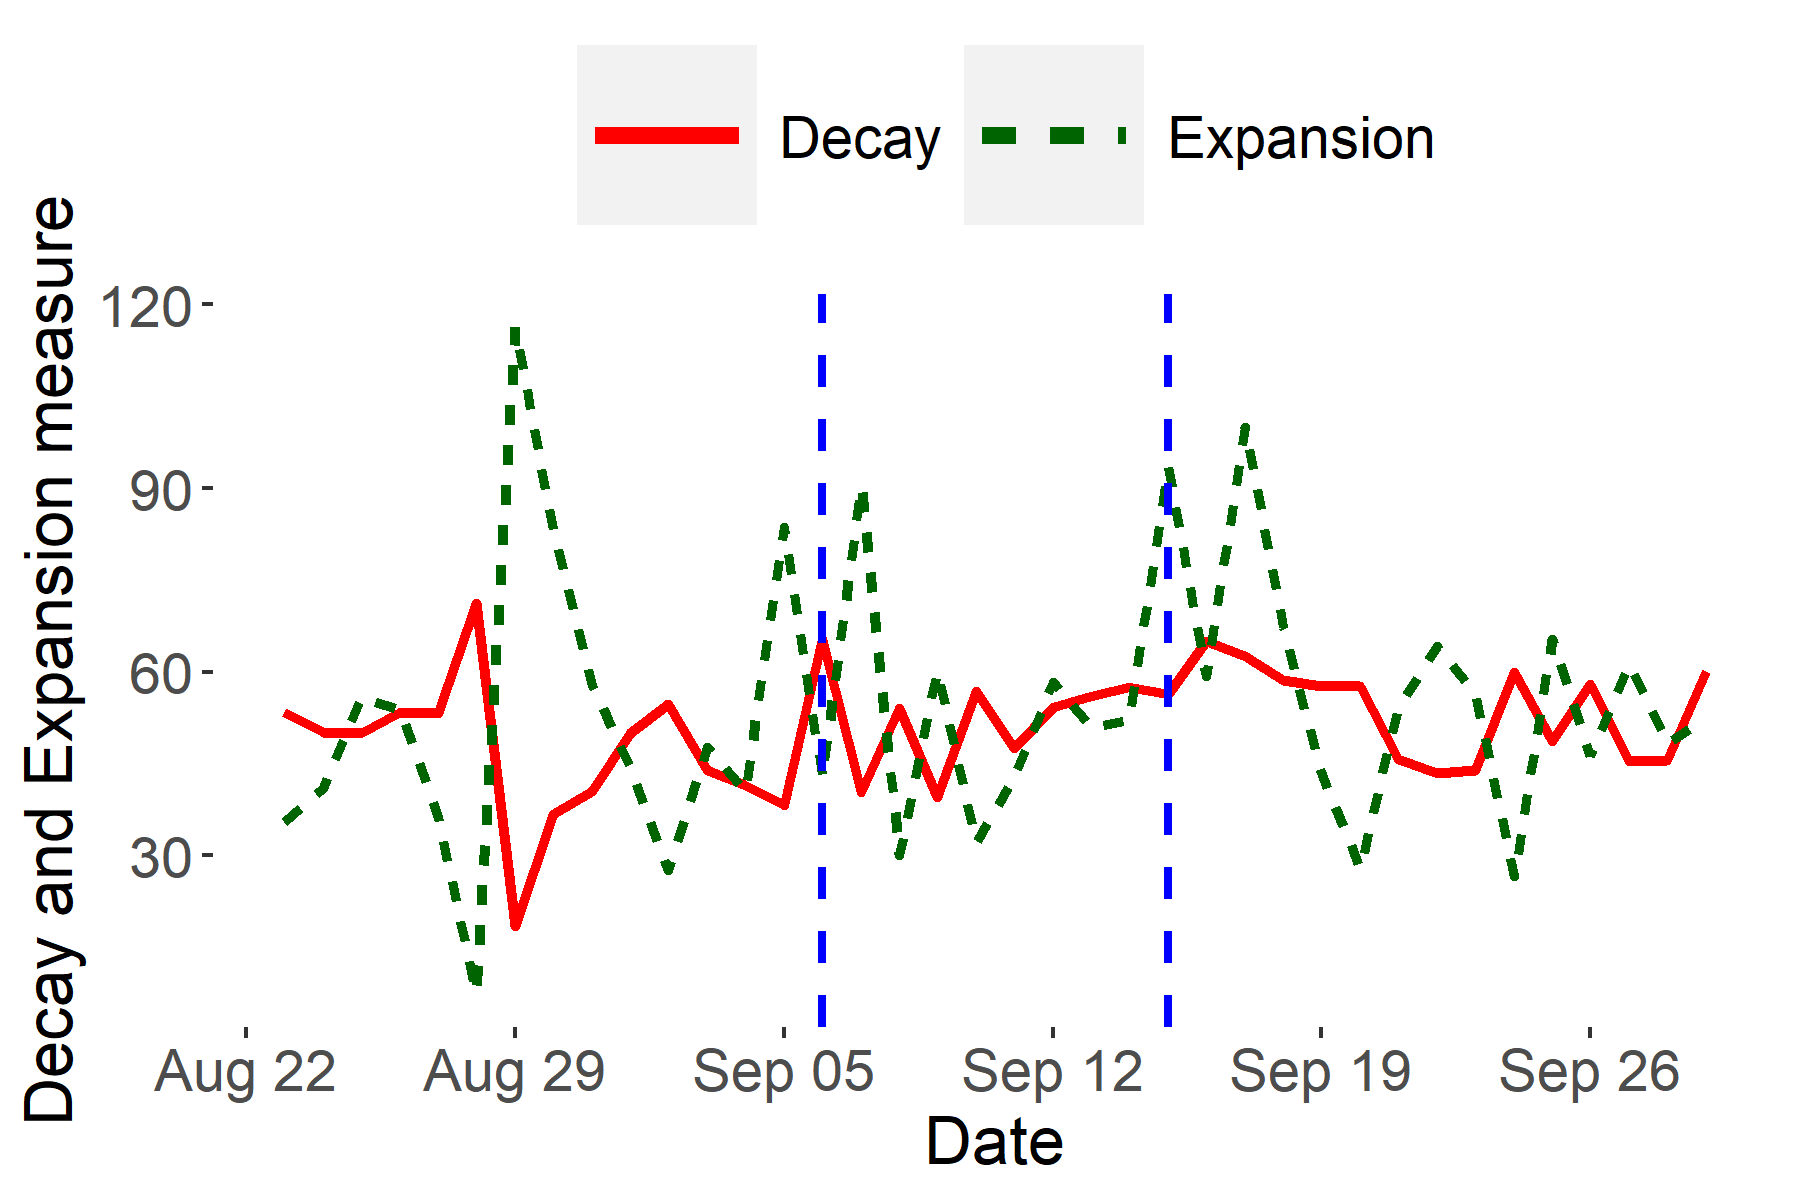
4.4. Case 2: Ethereum’s Switch to Proof-of-Stake
Ethereum’s transition from Proof-of-Work (PoW) to Proof-of-Stake (PoS) came with many benefits including enhanced security for users and lower energy consumption. Together, these positives incentivized new investors to participate in the Ethereum network due to increased trust in the blockchain and lower barriers to entry. The transition occurred in two phases; the first phase was a preparatory hard forking of the blockchain into a PoS structure and the second phase was a finalization of the upgrade. A pattern of hope was expected as the upgrade was highly anticipated due to the positives, transparency, and consistent updates regarding the official dates of the upgrade. From Figure 6, we indeed verify this behavioral pattern of hope characterized by inflated expansion values, coupled with relatively stable decay values, on three separate occasions. The first occurrence of hope is observed approximately a week before the first phase of the upgrade took place. It was around this time, the end of August 2022, that official news regarding the concrete dates of when the upgrade would be expected to take place was released to the public. We observe a surge of new hopeful investors participating in the Ethereum network and a significant dip in existing investors leaving the network in anticipation of the upgrade. The other two instances of hope are seen during the immediate days surrounding and between each of the phases of the upgrade. These occurrences provide insight into the market sentiment during the upgrade as positive and the overall transition of Ethereum to PoS as being well-received by investors.
5. Conclusions
In this article, we introduced InnerCore, which utilizes data depth-based core discovery to identify the most influential nodes in temporal blockchain networks. Furthermore, we proposed two metrics, InnerCore expansion and decay, that provide a sentiment indicator for the networks and explain investor mood. These metrics help in understanding the behavior of the network and predicting its long-term stability. The scalability and computational efficiency of InnerCore discovery make it well-suited for analyzing large temporal graphs, including those found in Ethereum transaction and stablecoin networks. Our experiments, which included comparing our findings with those of six forensic experts from the prominent blockchain data analytics company Nansen.ai, show that InnerCore can efficiently extract useful information from large networks. As a future work, we plan to use InnerCore to explore network robustness against Decentralized Finance (DeFi) attacks.
6. Appendix
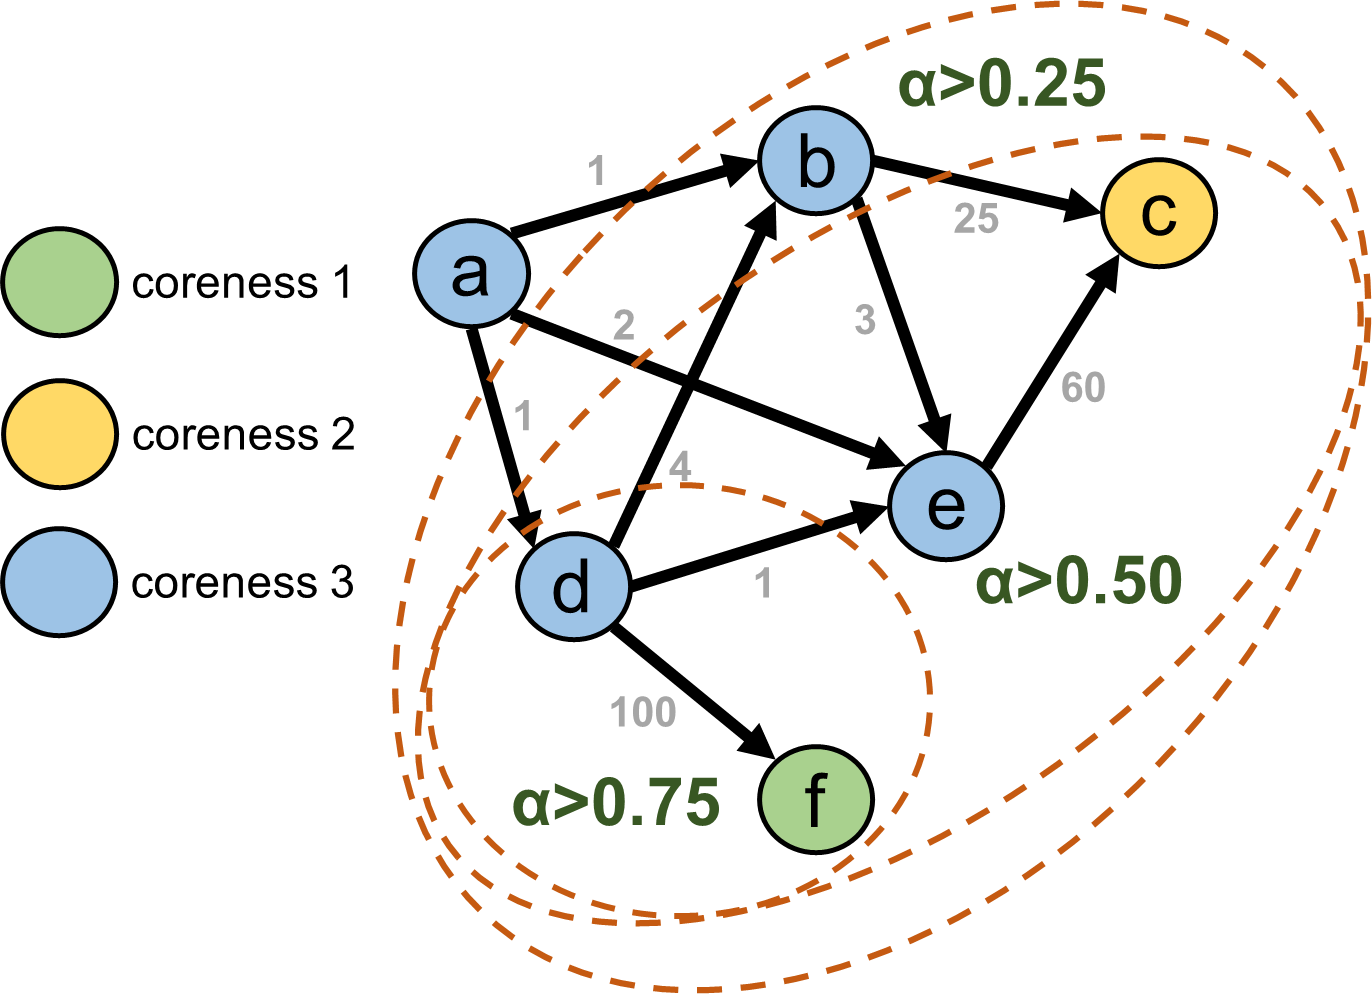
6.1. An Example of AlphaCore
To better illustrate the differences between the traditional graph--core and AlphaCore decomposition methods, we showcase an example in Figure 7. We are interested in the inner core that captures only the most important investors of a financial network. In the case of graph--core, the innermost core is the 3-core, whereas the inner core of AlphaCore would be the core of ¿ 0.75. Note that the 3-core consists of investors that trade frequently with themselves, but their trade volumes with themselves are not that significant compared to other transactions which exist in the network. In certain analyses of financial networks such as anomalous address detection, being able to filter out these negligible transactions and their participating investors, while still capturing more meaningful ones, significantly improves the accuracy and scalability of subsequent computations on the decomposed network core. On the other hand, the AlphaCore of ¿ 0.75 is able to capture both the investors that participate in the largest transactions which occur in the example network, while filtering the negligible transactions and their participating investors. We point out that the main limitation with graph--core is that it only considers node degrees, whereas AlphaCore is flexible and can consider any combination of node features as outlined in Table 1, without requiring to specify any feature weighting parameters to perform effectively on a particular task. Therefore, in networks where edge weights fall under a broad range and they are meaningful distinguishing factors, we recommend AlphaCore over the traditional graph--core decomposition.
6.2. Additional Related Work
In recent years, several studies focused on analyzing different aspects of the blockchain networks (Chen et al., 2019; Akcora et al., 2020; Kalodner et al., 2017; Guidi and Michienzi, 2020), particularly in the Ethereum network. Researchers working on natural language processing and sentiment analysis using tweets, news articles, cryptocurrency prices and charts, Google Trends about blockchains (Vo et al., 2019; Kraaijeveld and D. Smedt, 2020) could find supporting evidences based on blockchain data analysis. Oliveira et al. (Oliveira et al., 2022) performed an analysis of the effects of external events on the Ethereum platform, highlighting short-term changes in the behavior of accounts and transactions on the network. Aspembitova et al. (Aspembitova et al., 2021) used temporal complex network analysis to determine the properties of users in the Bitcoin and Ethereum markets and developed a methodology to derive behavioral types of users.
Other studies focused on specific aspects of the Ethereum network. For instance, Casale et al. (Casale-Brunet et al., 2021) analyzed the networks of Ethereum Non-Fungible Tokens using a graph-based approach, while Silva et al. (Silva, 2020) characterized relationships between primary miners in Ethereum using on-chain transactions. Meanwhile, Victor et al. (Victor and Lüders, 2019) measured Ethereum-based ERC20 token networks and Kiffer et al. (Kiffer et al., 2018) examined how contracts in Ethereum are created and how users interact with them.
Zhao et al. (Zhao et al., 2021) investigated the evolutionary nature of Ethereum interaction networks from a temporal graphs perspective, detecting anomalies based on temporal changes in global network properties and forecasting the survival of network communities using relevant graph features and machine learning models. Li et al. (Li et al., 2021) analyzed the magnitude of illicit activities in the Ethereum ecosystem using proprietary labeling data and machine learning techniques to identify additional malicious addresses. Kilic et al. (Kılıç et al., 2022) predicted whether given addresses are blacklisted or not in the Ethereum network using a transaction graph and local and global features.
Our approach for analyzing the effects of external events on a blockchain platform is similar to the one used by Anoaica et al. (Anoaica and Levard, 2018). The authors examined the temporal variation of transaction features in the Ethereum network and observed an increase in activity following the announcement of the Ethereum Alliance creation. Gaviao et al. (Gaviao Mascarenhas et al., 2020) also studied the evolution of users and transactions over time, showing the centralization tendency of the transaction network. Kapengut et al.(Kapengut and Mizrach, 2022) study the Ethereum blockchain around the BeaconChain phase of the PoS transition (September 15, 2022), but the authors focus on the power efficiency and miners’ rewards around the transition.
Finally, Khan (Khan, 2022) conducted a survey of datasets, methods, and future work related to graph analysis of the Ethereum blockchain data, while Ramezan Poursafaei’s PhD thesis (Ramezan Poursafaei, 2022) presented results on temporal anomaly detection in blockchain networks.
References
- (1)
- Abay et al. (2019) Nazmiye Ceren Abay, Cuneyt G. Akcora, Yulia R. Gel, Murat Kantarcioglu, Umar D. Islambekov, Yahui Tian, and Bhavani Thuraisingham. 2019. ChainNet: learning on blockchain graphs with topological features. In IEEE ICDM. 1–7.
- Akcora et al. (2018) Cuneyt G. Akcora, Asim Kumer Dey, Yulia R. Gel, and Murat Kantarcioglu. 2018. Forecasting bitcoin price with graph chainlets. In The PAKDD, Melbourne, Australia. 1–12.
- Akcora et al. (2020) Cuneyt G. Akcora, Yitao Li, Yulia R. Gel, and Murat Kantarcioglu. 2020. BitcoinHeist: topological data analysis for ransomware prediction on the bitcoin blockchain. In Proceedings of the Twenty-Ninth International Joint Conference on Artificial Intelligence, IJCAI. 4439–4445.
- Al-garadi et al. (2017) Mohammed Ali Al-garadi, Kasturi Dewi Varathan, and Sri Devi Ravana. 2017. Identification of influential spreaders in online social networks using interaction weighted k-core decomposition method. Physica A: Statistical Mechanics and its Applications 468 (2017), 278–288.
- Anoaica and Levard (2018) Andra Anoaica and Hugo Levard. 2018. Quantitative description of internal activity on the Ethereum public blockchain. In 2018 9th IFIP international conference on New technologies, Mobility and security (NTMS). IEEE, 1–5.
- Aspembitova et al. (2021) Ayana T Aspembitova, Ling Feng, and Lock Yue Chew. 2021. Behavioral structure of users in cryptocurrency market. Plos one 16, 1 (2021), e0242600.
- Bailey et al. (2009) Timothy L Bailey, Mikael Boden, Fabian A Buske, Martin Frith, Charles E Grant, Luca Clementi, Jingyuan Ren, Wilfred W Li, and William S Noble. 2009. MEME SUITE: tools for motif discovery and searching. Nucleic acids research 37, suppl_2 (2009), W202–W208.
- Barthere et al. (2022) Aurelie Barthere, Beili Baraki, Yong Li Khoo, Philip Grushyn, Xin Yi Lim, and Joshua Ho. 2022. On-chain forensics: demystifying TerraUSD de-peg. https://www.nansen.ai/research/on-chain-forensics-demystifying-terrausd-de-peg
- Batagelj and Zaveršnik (2002) Vladimir Batagelj and Matjaž Zaveršnik. 2002. Generalized cores. CoRR cs.DS/0202039 (2002).
- Batagelj and Zaversnik (2011) Vladimir Batagelj and Matjaz Zaversnik. 2011. Fast algorithms for determining (generalized) core groups in social networks. Adv. Data Anal. Classif. 5, 2 (2011), 129–145.
- Casale-Brunet et al. (2021) Simone Casale-Brunet, Paolo Ribeca, Patrick Doyle, and Marco Mattavelli. 2021. Networks of Ethereum non-fungible tokens: A graph-based analysis of the ERC-721 ecosystem. In 2021 IEEE International Conference on Blockchain (Blockchain). IEEE, 188–195.
- Chen et al. (2020) Ting Chen, Zihao Li, Yuxiao Zhu, Jiachi Chen, Xiapu Luo, John Chi-Shing Lui, Xiaodong Lin, and Xiaosong Zhang. 2020. Understanding Ethereum via graph analysis. ACM Transactions on Internet Technology (TOIT) 20, 2 (2020), 1–32.
- Chen et al. (2019) Weili Chen, Jun Wu, Zibin Zheng, Chuan Chen, and Yuren Zhou. 2019. Market manipulation of bitcoin: evidence from mining the Mt. Gox transaction network. In IEEE Conference on Computer Communications, INFOCOM. 964–972.
- Coppersmith and Winograd (1987) Don Coppersmith and Shmuel Winograd. 1987. Matrix multiplication via arithmetic progressions. In Proceedings of the nineteenth annual ACM symposium on Theory of computing. 1–6.
- Faux and Shen (2022) Zeke Faux and Muyao Shen. 2022. A $60 billion crypto collapse reveals a new kind of bank run. Online. https://www.bloomberg.com/news/articles/2022-05-19/luna-terra-collapse-reveal-crypto-price-volatility
- Garas et al. (2012) Antonios Garas, Frank Schweitzer, and Shlomo Havlin. 2012. A k-shell decomposition method for weighted networks. New Journal of Physics 14, 8 (2012), 083030.
- Gaviao Mascarenhas et al. (2020) Juliana Zanelatto Gaviao Mascarenhas, Artur Ziviani, Klaus Wehmuth, Alex Borges Vieira, et al. 2020. On the transaction dynamics of the Ethereum-based cryptocurrency. Journal of Complex Networks 8, 4 (2020).
- Giatsidis et al. (2011) Christos Giatsidis, Dimitrios M Thilikos, and Michalis Vazirgiannis. 2011. Evaluating cooperation in communities with the k-core structure. In International Conference on Advances in Social Networks Analysis and Mining. 87–93.
- Guidi and Michienzi (2020) Barbara Guidi and Andrea Michienzi. 2020. Users and bots behaviour analysis in blockchain social media. In Seventh International Conference on Social Networks Analysis, Management and Security, SNAMS. IEEE, 1–8.
- Huang et al. (2018) Danny Yuxing Huang, Maxwell Matthaios Aliapoulios, Vector Guo Li, Luca Invernizzi, Elie Bursztein, Kylie McRoberts, Jonathan Levin, Kirill Levchenko, Alex C. Snoeren, and Damon McCoy. 2018. Tracking ransomware end-to-end. In IEEE Symposium on Security and Privacy, SP. 618–631.
- Jiang et al. (2021) Chuxuan Jiang, Jack Foye, Roderic Broadhurst, and Matthew Ball. 2021. Illicit firearms and other weapons on darknet markets. Trends and Issues in Crime and Criminal Justice [electronic resource] 622 (2021), 1–20.
- Kalodner et al. (2017) Harry Kalodner, Steven Goldfeder, Alishah Chator, Malte Möser, and Arvind Narayanan. 2017. BlockSci: Design and applications of a blockchain analysis platform. arXiv preprint arXiv:1709.02489 (2017).
- Kapengut and Mizrach (2022) Elie Kapengut and Bruce Mizrach. 2022. An event study of the Ethereum transition to proof-of-stake. arXiv preprint arXiv:2210.13655 (2022).
- Khan (2022) Arijit Khan. 2022. Graph analysis of the Ethereum blockchain data: a survey of datasets, methods, and future work. In 2022 IEEE International Conference on Blockchain (Blockchain). IEEE, 250–257.
- Khan and Akcora (2022) Arijit Khan and Cuneyt Gurcan Akcora. 2022. Graph-based management and mining of blockchain data. In Proceedings of the 31st ACM International Conference on Information & Knowledge Management (CIKM). 5140–5143.
- Kiffer et al. (2018) Lucianna Kiffer, Dave Levin, and Alan Mislove. 2018. Analyzing Ethereum’s contract topology. In Proceedings of the Internet Measurement Conference 2018. 494–499.
- Kılıç et al. (2022) Baran Kılıç, Alper Sen, and Can Özturan. 2022. Fraud detection in blockchains using machine learning. In 2022 Fourth International Conference on Blockchain Computing and Applications (BCCA). IEEE, 214–218.
- Kraaijeveld and D. Smedt (2020) Olivier Kraaijeveld and J. D. Smedt. 2020. The Predictive power of public twitter sentiment for forecasting cryptocurrency prices. Journal of International Financial Markets, Institutions and Money 65, C (2020), S104244312030072X.
- Latapy (2008) Matthieu Latapy. 2008. Main-memory triangle computations for very large (sparse (power-law)) graphs. Theoretical computer science 407, 1-3 (2008), 458–473.
- Lee et al. (2020) Xi Tong Lee, Arijit Khan, Sourav Sen Gupta, Yu Hann Ong, and Xuan Liu. 2020. Measurements, analyses, and insights on the entire Ethereum blockchain network. In WWW: The Web Conference. 155–166.
- Li et al. (2021) Jiasun Li, Foteini Baldimtsi, Joao P Brandao, Maurice Kugler, Rafeh Hulays, Eric Showers, Zain Ali, and Joseph Chang. 2021. Measuring illicit activity in DeFi: the case of Ethereum. In Financial Cryptography and Data Security. FC 2021 International Workshops: CoDecFin, DeFi, VOTING, and WTSC, Virtual Event, March 5, 2021, Revised Selected Papers 25. Springer, 197–203.
- Liao et al. (2022) Xuankun Liao, Qing Liu, Jiaxin Jiang, Xin Huang, Jianliang Xu, and Byron Choi. 2022. Distributed d-core decomposition over large directed graphs. Proc. VLDB Endow. 15, 8 (2022), 1546–1558.
- Luo et al. (2009) Feng Luo, Bo Li, Xiu-Feng Wan, and Richard H Scheuermann. 2009. Core and periphery structures in protein interaction networks. In BMC bioinformatics, Vol. 10. Springer, S8.
- Malliaros et al. (2020) Fragkiskos D Malliaros, Christos Giatsidis, Apostolos N Papadopoulos, and Michalis Vazirgiannis. 2020. The core decomposition of networks: theory, algorithms and applications. The VLDB Journal 29, 1 (2020).
- Milo et al. (2002) R. Milo, S. Shen-Orr, S. Itzkovitz, N. Kashtan, D. Chklovskii, and U. Alon. 2002. Network motifs: simple building blocks of complex networks. Science 298, 5594 (2002), 824–827.
- Moin et al. (2019) Amani Moin, Emin Gün Sirer, and Kevin Sekniqi. 2019. A classification framework for stablecoin designs. arXiv preprint arXiv:1910.10098 (2019).
- Mosler (2012) Karl Mosler. 2012. Multivariate Dispersion, Central Regions, and Depth: The Lift Zonoid Approach. Vol. 165. Springer Science & Business Media.
- Nakamoto (2008) Satoshi Nakamoto. 2008. Bitcoin: A peer-to-peer electronic cash system.
- Oliveira et al. (2022) Pedro Henrique FS Oliveira, Daniel Muller Rezende, Heder Soares Bernardino, Saulo Moraes Villela, and Alex Borges Vieira. 2022. Analysis of account behaviors in Ethereum during an economic impact event. arXiv preprint arXiv:2206.11846 (2022).
- Paranjape et al. (2017) Ashwin Paranjape, Austin R Benson, and Jure Leskovec. 2017. Motifs in temporal networks. In Proceedings of the Tenth ACM International Conference on Web Search and Data Mining. ACM, 601–610.
- Ramezan Poursafaei (2022) Farimah Ramezan Poursafaei. 2022. Anomaly detection in cryptocurrency networks and beyond. (2022).
- Salton and Buckley (1988) Gerard Salton and Christopher Buckley. 1988. Term-weighting approaches in automatic text retrieval. Information processing & management 24, 5 (1988), 513–523.
- Seidman (1983) Stephen B Seidman. 1983. Network structure and minimum degree. Social networks 5, 3 (1983), 269–287.
- Shamsi et al. (2022) Kiarash Shamsi, Friedhelm Victor, Murat Kantarcioglu, Yulia R. Gel, and Cuneyt G. Akcora. 2022. Chartalist: labeled graph datasets for UTXO and account-based blockchains. 36th Conference on Neural Information Processing Systems (NeurIPS 2022) 36 (2022), 1–10.
- Silva (2020) Daniel Rincon Silva. 2020. Characterizing relationships between primary miners in Ethereum by analyzing on-chain transactions. In 2020 2nd Conference on Blockchain Research & Applications for Innovative Networks and Services (BRAINS). IEEE, 240–247.
- Su et al. (2022) Voon Hou Su, Sourav Sen Gupta, and Arijit Khan. 2022. Automating ETL and mining of Ethereum blockchain network. In WSDM: The Fifteenth ACM International Conference on Web Search and Data Mining. 1581–1584.
- Victor et al. (2021) Friedhelm Victor, Cuneyt G Akcora, Yulia R Gel, and Murat Kantarcioglu. 2021. Alphacore: data depth based core decomposition. In Proceedings of the 27th ACM SIGKDD Conference on Knowledge Discovery & Data Mining. 1625–1633.
- Victor and Lüders (2019) Friedhelm Victor and Bianca Katharina Lüders. 2019. Measuring Ethereum-based ERC20 token networks. In International Conference on Financial Cryptography and Data Security. Springer, 113–129.
- Vo et al. (2019) Anh-Dung Vo, Quang-Phuoc Nguyen, and Cheol-Young Ock. 2019. Sentiment analysis of news for effective cryptocurrency price prediction. International Journal of Knowledge Engineering 5, 2 (2019), 47–52.
- Wood (2014) G. Wood. 2014. Ethereum: A secure decentralised generalised transaction ledger. Ethereum project yellow paper 151 (2014), 1–32.
- Wu et al. (2022) Jiajing Wu, Kaixin Lin, Dan Lin, Ziye Zheng, Huawei Huang, and Zibin Zheng. 2022. Financial crimes in web3-empowered metaverse: taxonomy, countermeasures, and opportunities. CoRR abs/2212.13452 (2022).
- Zhang and Parthasarathy (2012) Yang Zhang and Srinivasan Parthasarathy. 2012. Extracting analyzing and visualizing triangle k-core motifs within networks. In 2012 IEEE 28th International Conference on Data Engineering. IEEE, 1049–1060.
- Zhao et al. (2021) Lin Zhao, Sourav Sen Gupta, Arijit Khan, and Robby Luo. 2021. Temporal analysis of the entire ethereum blockchain network. In Proceedings of the Web Conference 2021. 2258–2269.
- Zhou et al. (2021) Wei Zhou, Hong Huang, Qiang-Sheng Hua, Dongxiao Yu, Hai Jin, and Xiaoming Fu. 2021. Core decomposition and maintenance in weighted graph. World Wide Web 24, 2 (2021), 541–561.