Disk settling and dynamical heating: histories of Milky Way-mass stellar disks across cosmic time in the FIRE simulations
Abstract
We study the kinematics of stars both at their formation and today within 14 Milky Way (MW)-mass galaxies from the FIRE-2 cosmological zoom-in simulations. We quantify the relative importance of cosmological disk settling and post-formation dynamical heating. We identify three eras: a Pre-Disk Era (typically ago), when stars formed on dispersion-dominated orbits; an Early-Disk Era ( ago), when stars started to form on rotation-dominated orbits but with high velocity dispersion, ; and a Late-Disk Era ( ago), when stars formed with low . increased with time during the Pre-Disk Era, peaking ago, then decreased throughout the Early-Disk Era as the disk settled and remained low throughout the Late-Disk Era. By contrast, the dispersion measured today, , increases monotonically with age because of stronger post-formation heating for Pre-Disk stars. Importantly, most of was in place at formation, not added post-formation, for stars younger than . We compare the evolution of the three velocity components: at all times, . Post-formation heating primarily increased at ages but acted nearly isotropically for older stars. The kinematics of young stars in FIRE-2 broadly agree with the range observed across the MW, M31, M33, and PHANGS-MUSE galaxies. The lookback time that the disk began to settle correlates with its dynamical state today: earlier-settling galaxies currently form colder disks. Including stellar cosmic-ray feedback does not significantly change disk rotational support at fixed stellar mass.
keywords:
galaxies: kinematics and dynamics — galaxies: evolution — Galaxy: disk — Galaxy: formation — methods: numerical1 Introduction
The present-day kinematics of stars encode a galaxy’s dynamical history. A star’s orbit is set by both its initial dynamics, as inherited from the star-forming interstellar medium (ISM) at its formation, and all post-formation dynamical perturbations that the star experienced over its lifetime. Thus, stellar kinematics provide dual insight into the past state of the ISM and the dynamical processes that shaped the galaxy. However, the extent to which a star’s current motion results from its initial state or from post-formation perturbations remains poorly understood. The inability to reliably disambiguate these two remains a significant obstacle in connecting the kinematics and morphology of a galaxy today to its formation history (for example Somerville & Davé, 2015; Naab & Ostriker, 2017).
Overcoming this ambiguity requires understanding the kinematics with which stars formed throughout the entire lifetime of a galaxy. In the solar neighborhood, the youngest stellar populations share the kinematics of the gas disk from which they formed: young stars are on nearly circular orbits with total velocity dispersions, (Edvardsson et al., 1993; Casagrande et al., 2011). However, the kinematics of stars that formed at earlier times are likely different than those forming in the Milky Way (MW) today, based on observations of high-redshift galaxies, which provide statistics on how the initial state of stars evolved over cosmic time. Such observations reveal that MW-like thin disks today are the endpoint of a metamorphosis: galactic disks at higher redshifts () were thicker, clumpier, and more turbulent than their thin counterparts at lower redshifts (for example Förster Schreiber et al., 2009; Stott et al., 2016; Birkin et al., 2023) (though see Rizzo et al., 2020). The high turbulence of MW-mass progenitors probably arose from the combination of stellar feedback, given their higher star formation rates (SFRs) (for example Madau & Dickinson, 2014; Förster Schreiber & Wuyts, 2020), gravitational instabilities (for example Elmegreen et al., 2007; Dekel et al., 2009; Lehnert et al., 2009), and higher merger and accretion rates, which lead to higher gas fractions and surface densities (for example Genzel et al., 2015; Tacconi et al., 2020).
Thus, high-redshift observations show that disk galaxies ‘settled’ over cosmic time (Kassin et al., 2012), becoming less turbulent and more rotationally supported since (for example Wisnioski et al., 2015; Johnson et al., 2018). Specifically, the velocity dispersion, , of gas disks decreased while their rotational velocity, , increased. Although most works used emission lines from ionized gas to measure high-redshift kinematics, recent works indicate that the dispersions of atomic and molecular gas, while lower, evolved similarly (for example Übler et al., 2019; Girard et al., 2021). Thus, stars, which are born from cold dense gas, formed with larger dispersions at earlier times when turbulence was higher, and later formed with progressively lower dispersions as turbulence decreased and the galaxy’s disk settled.
Alongside understanding how stars kinematically formed, it is equally important to understand how they evolved post-formation. Over their lifetimes, stars undergo repeated scattering interactions with perturbations within the disk, such as giant molecular clouds (GMCs) (Spitzer & Schwarzschild, 1951; Wielen, 1977; Lacey, 1984), spiral arms (Barbanis & Woltjer, 1967; Carlberg & Sellwood, 1985; Minchev & Quillen, 2006), and bars (Saha et al., 2010; Grand et al., 2016). Stars are effectively collisionless and dissipationless, and thus these interactions result in enduring increases to their random orbital energy, or ‘dynamical heating’. In turn, a stellar population’s increases over its lifetime. Additional heating may arise from feedback-driven outflows and potential fluctuations (El-Badry et al., 2016), the galaxy’s global asymmetries – including torquing from the misalignment of the stellar and gaseous disk (Roškar et al., 2010) – cosmic accretion, mergers, and interactions with satellites(for example Quinn et al., 1993; Brook et al., 2004; Villalobos & Helmi, 2008; Belokurov et al., 2018). However, the relative impact of each mechanism remains uncertain.
Furthermore, the scattering environment of the disk evolves across cosmic time. At earlier times, a galaxy’s gas fraction and gas surface density were higher (for example Shapley, 2011; Swinbank et al., 2012; Tacconi et al., 2020), such that scattering by GMCs was likely more frequent. Prior to the formation of a disk, galaxies generally lacked strong spiral structure and thus spiral-driven heating (for example Margalef-Bentabol et al., 2022). On the other hand, certain processes that can drive non-adiabatic rapid heating were more prevalent earlier, including mergers (for example Conselice et al., 2005) and feedback-driven outflows (for example Genzel et al., 2015).
One can understand the relative strength of these heating mechanisms by comparing the observed relationship between velocity dispersion and stellar age with predictions from various heating models. The magnitude of each component of (along , , or ) provides insight into the relative strength of different mechanisms: spiral structure increases the in-plane dispersion but is generally inefficient at increasing the vertical, whereas GMCs heat stars more isotropically and can redirect in-plane heating (for example Carlberg & Innanen, 1987; Jenkins & Binney, 1990; Sellwood, 2013).
The MW is an ideal test-bed for such comparisons because it offers unparalleled access to the 3D motions, positions, and ages of individual stars. In particular, the observed monotonic increase in velocity dispersion with age for stars in the solar neighborhood provides an important benchmark (for example Strömberg, 1946; Wielen, 1977; Casagrande et al., 2011). Nordström et al. (2004) and Holmberg et al. (2009) argued that this observed trend is consistent with MW stars forming on ‘disky’ orbits that then underwent dynamical heating by the combination of GMCs and spiral arms. Mackereth et al. (2019b) and Ting & Rix (2019) extended this analysis to include stars located outside the solar neighborhood () and found similar results: the observed relations are consistent with stars younger than having formed with a low, constant dispersion and subsequently being heated by both GMCs and spiral arms. However, as before, the observed dispersions of older stars (age ) are higher than those predicted by heating models (Mackereth et al., 2019b). This discrepancy could arise if old stars were born kinematically hotter, or if their dynamical heating differed from what current models predict. Likely, both factors contribute, but disentangling this requires insight into the MW’s early history.
Fortunately, recent MW observations now allow us to characterize this bygone era. Astrometric data from Gaia (Gaia Collaboration et al., 2016) along with stellar properties from large spectroscopic surveys, such as APOGEE (Majewski et al., 2017), GALAH (De Silva et al., 2015; Buder et al., 2018), and LAMOST (Cui et al., 2012), now provide 6D kinematics and elemental abundances for stars throughout the Galaxy. Most notably, this data revealed that the MW underwent a massive merger – the Gaia-Sausage-Enceladus (GSE) – to ago (for example Belokurov et al., 2018; Helmi et al., 2018). The GSE merger, probably the most major merger of the MW, contributed most of the stars in the MW’s stellar halo, and it likely dynamically heated MW stars to more eccentric halo-like orbits, and potentially it triggered intense star-formation and even the formation of the MW’s low- disk (for example Haywood et al., 2018; Gallart et al., 2019; Mackereth et al., 2019a; Bonaca et al., 2020; Das et al., 2020). Recent works suggest that the MW developed this thick – but continuously-settling – disk early in its history, with estimates for the onset of coherent rotation ranging from to ago (Belokurov & Kravtsov, 2022; Conroy et al., 2022; Xiang & Rix, 2022), and that the MW’s thin-disk began to form later, ago. However, post-formation dynamical heating leads to ambiguity about the nature and timing of these transitions, highlighting the difficulties innate to separating birth kinematics from post-formation dynamical heating, especially for old, metal-poor stars.
Cosmological simulations of the formation of MW-mass galaxies provide important tools for understanding the relative impacts of cosmological disk settling and post-formation dynamical heating (see Naab & Ostriker, 2017; Vogelsberger et al., 2020, for recent reviews). Cosmological zoom-in simulations provide the high resolution needed to model a galaxy’s internal structure, including the multi-phase ISM that sets the birth kinematics of stars and thus the dynamical structure of the disk, within an accurate cosmological context, allowing for non-equilibrium dynamical perturbations, mergers, mass growth, and so forth. Many works used such cosmological zoom-in simulations to show that (1) MW-like galaxies form radially ‘inside-out’ and vertically ‘upside-down’, transitioning from a thick, turbulent galaxy at early times to a thin, rotationally dominated disk at later times, and (2) the present-day kinematics of stars result from their kinematics at birth and subsequent dynamical heating, both of which change over cosmic time (for example Bird et al., 2012; Brook et al., 2012; Martig et al., 2014; Grand et al., 2016; Bonaca et al., 2017; Ceverino et al., 2017; Ma et al., 2017; Buck et al., 2020; Agertz et al., 2021; Bird et al., 2021).
We build upon a series of papers that used FIRE-2 simulations to study the formation of galactic disks. Stern et al. (2021) found that virialization of the inner circumgalactic medium (CGM), that is, the onset of a stable hot halo, coincided with the formation of a thin disk, a change from ‘bursty’ to ‘steady’ star formation, and the suppression of gaseous outflows; the presence of a hot halo can allow infalling gas to align coherently with a galaxy’s disk before it accretes onto the disk (Hafen et al., 2022). Additional works found that the virialization of the inner CGM and the associated transition from bursty to steady star formation coincided with the transition from ‘thick-disk’ to ‘thin-disk’ formation Yu et al. (2021, 2022) and the emergence of a rotationally-supported thin gaseous disk from a previously quasi-isotropic ISM (Gurvich et al., 2023). More recently, Hopkins et al. (2023) investigated the physical causes of such transitions. While the initial formation of a disk depends on the development of a sufficiently centrally concentrated mass profile, the transition from bursty to smooth star formation generally arises later, when the absolute depth of the gravitational potential (within the radius of star formation) crosses a critical threshold. This threshold is similar to the threshold for virialization of the inner CGM.
In this work, we use the FIRE-2 cosmological zoom-in simulations to study cosmological disk settling and dynamical heating across the formation histories of MW-mass galaxies. We study the kinematics of stars both at birth and today, emphasizing different phases of disk-galaxy formation. We examine how stellar formation kinematics manifest themselves today, that is, how post-formation dynamical heating alters the initial orbits of stars. By doing so, we aim to understand how the current kinematics of the MW and nearby galaxies relate to their formation histories.
2 Methods
2.1 FIRE-2 Simulations
We analyze 14 cosmological zoom-in simulations of MW/M31-mass galaxies from the Feedback in Realistic Environments (FIRE) project111 FIRE project web site: http://fire.northwestern.edu , which include both dark matter and baryons (gas and stars). The simulations use the GIZMO gravity plus hydrodynamics code (Hopkins, 2015) with the meshless finite-mass (MFM) Godunov method, which provides adaptive spatial resolution while maintaining excellent conservation of energy and (angular) momentum.
We ran these simulations using the FIRE-2 physics model (Hopkins et al., 2018). FIRE-2 models the dense, multi-phase ISM and incorporates metallicity-dependent radiative cooling and heating processes for gas across temperatures K, including free-free, photoionization and recombination, Compton, photoelectric and dust collisional, cosmic ray, molecular, metal-line, and fine structure processes. The simulations self-consistently generate and track 11 elements (H, He, C, N, O, Ne, Mg, Si, S, Ca, Fe), including a model for sub-grid mixing/diffusion via turbulence (Hopkins, 2016; Su et al., 2017; Escala et al., 2018). FIRE-2 also includes photoionization and heating from a spatially uniform, redshift-dependent UV background (Faucher-Giguère et al., 2009) that reionizes the Universe at .
Crucially for this work, FIRE-2 simulations resolve the phase structure in the ISM, allowing gas to collapse into giant molecular clouds and form stars (Benincasa et al., 2020; Guszejnov et al., 2020). Star formation occurs in locally self-gravitating, Jeans-unstable, dense ( ), molecular (following Krumholz & Gnedin, 2011) gas. After reaching these criteria, a gas cell probabilistically converts to a star particle in a local free-fall time. Our simulations, like all simulations, have a finite resolution. As such, our star-formation model is an extrapolation of the collapse below the resolution scale. That said, numerous resolution tests carried out in Hopkins et al. (2018) indicate that uncertainties induced by our resolution limit are minor; for example, the GMC mass function and the relation between internal gas velocity dispersion and GMC size for these simulations are both independent of resolution.
Each star particle represents a single stellar population sampled from a Kroupa (2001) initial mass function, with mass and metallicity inherited from its progenitor gas cell. Once formed, star particles follow stellar evolution models that tabulate feedback event rates, luminosities, energies, and mass-loss rates from STARBURST99 v7.0 (Leitherer et al., 1999). FIRE-2 implements the major channels for stellar feedback, including core-collapse and white-dwarf (Ia) supernovae, stellar winds, radiation pressure, photoionization, and photoelectric heating.
We generated cosmological zoom-in initial conditions at using MUSIC (Hahn & Abel, 2011). Each zoom-in region is embedded within a cosmological box of side length . The simulations use a flat CDM cosmology with parameters broadly consistent with Planck Collaboration et al. (2020): , , , , and .
Our simulation set consists of 14 MW/M31-mass galaxies: 8 isolated galaxies from the Latte suite, and 6 galaxies from the ELVIS on FIRE suite of Local Group (LG)-like pairs of galaxies. The Latte suite, with the exception of m12z, has an initial baryon particle mass of , although stellar mass loss leads to star particles having typical masses , and dark matter particle mass of . m12z has initial baryon and dark matter particle masses of and , respectively. The ELVIS on FIRE suite has a mass resolution better than the Latte suite: Romeo & Juliet have initial baryon particle masses of , while Romulus & Remus and Thelma & Louise have .
Both star and dark-matter particles have fixed gravitational force softenings (comoving at and physical thereafter) with a Plummer equivalent of and . Gas cells have fully adaptive gravitational softenings that match the hydrodynamic kernel smoothing: softening lengths are at typical ISM densities () and in the densest regions.
Certain aspects of the FIRE-2 ISM model have been subject to scrutiny within the literature. In particular, Kim et al. (2023) and Wibking & Krumholz (2023) argued that the equilibrium gas cooling in FIRE-2 transitions between the warm and cold phase in the neutral ISM at unphysically low pressures and densities due to our order of too-low free-electron fraction at a given gas density. This implies that the diffuse ISM in FIRE-2 is entirely in the cold neutral phase. However, their idealized tests did not encompass how FIRE-2 simulations actually implement gas cooling; instead, they only tested one aspect of gas cooling in FIRE-2 and only in the presence of a metagalactic UV background, with no local sources. The free-electron fraction and ISM phase structure in actual FIRE-2 simulations agree much better with the observations presented in those works.222 The FIRE collaboration has made numerous improvements to the gas cooling model in recent years: the default cooling in FIRE-2 since 2020, and in FIRE-3, includes all terms claimed to be missing from earlier FIRE models. See the GIZMO user guide: http://www.tapir.caltech.edu/phopkins/Site/GIZMO_files/gizmo_documentation.html Furthermore, the specifics of the ISM cooling model are largely inconsequential for the properties that we examine here, because the thermal pressure essentially never dominates over the turbulent pressure in the cold, dense ISM resolved in these simulations. Indeed, as Hopkins et al. (2018) showed, dramatic changes to the assumed ISM cooling rates lead to only minor effects on most galaxy dynamical properties. Indeed, we tested re-simulating one of our simulations (m12i) over the last using the newer FIRE-3 model (Hopkins et al., 2023), which includes numerous updates to gas cooling, and this results in nearly identical velocity dispersions for cold gas and stars.
For our main results (Sections 3.1, 3.3, 3.4, and 3.5), we present properties averaged across our galaxy sample, not including the lower-mass galaxies m12r and m12z or Juliet from the ELVIS on FIRE suite. However, in Sections 3.6, 3.7 and 3.8, where we explore dependence on galaxy mass, we include all 14 galaxies. m12r and m12z have stellar masses of 1.8 and , lower than the MW’s and M31’s stellar masses of and , respectively. Furthermore, m12r and m12z have stellar kinematics that are weakly or never dominated by disk-like motion. Juliet has a stellar mass closer to the MW’s, at , and disk-dominated kinematics at , but we exclude it, because a rapid gas accretion event late in its history leads to anomalous properties that skew the sample-averaged properties towards trends unique to Juliet. We will examine these cases in more detail in future work.
2.2 Measuring Stellar Dynamics Today and at Formation
Motivated primarily by measurements of the MW, we select stars that are in each galaxy’s ‘solar annulus’: and today. In future work, we will examine trends with radius, to understand the drivers of post-formation dynamical heating and their application to MW observations in greater detail; briefly, we find that the dispersion today generally decreases with today, but that neither the dispersion at formation nor the dispersion today depend on at . The effect of the vertical selection on our results is minimal, as we show in Appendix A.
For all of our results besides those in Section 8, we show ‘disk-wide’ (or more aptly, ‘annulus-wide’) kinematics. That is, we compute median velocity and velocity dispersions using all the stars (in a given age bin) within the ‘solar annulus’. However, in Section 8, we show ‘local’ kinematics, meaning we compute the median velocity and dispersion within smaller patches (of diameter 150 or 500 pc) spanning an annulus centered at 8 kpc, and then average across all patches.
A key advantage of simulations is their ability to study properties both today and when stars formed. In both cases, we select stars on the basis of their current coordinates. However, when determining properties at formation, we only include stars that formed in situ, which we define following Bellardini et al. (2022) as forming within a total distance of 30 kpc comoving from the galactic center. We do not apply this in-situ selection when measuring properties today, to more directly compare with observations. Across our simulations, ex-situ stars comprise only of all stars currently within the disk ( and ), but they can make up a non-trivial percentage within our oldest age bins: we show the effect of our in-situ selection on velocity dispersion versus age in Appendix B.
We compute stellar positions and velocities relative to the galaxy’s center. We determine the orientation of the galaxy at each snapshot (independently) by computing the rotation tensor and axis ratios of the principal axes of the stellar disk, which we define via the moment of inertia tensor of the 25% youngest star particles inside a radius enclosing 90% of the total stellar mass within 10 kpc physical. We compute properties at formation using the galaxy’s orientation at that time, not at .
Our simulations store 600 snapshots from to 0, with a time between snapshots of , and the past 20 Myr (immediately before today) includes 10 snapshots spaced by 2 Myr. We measure a star’s ‘formation’ properties at the first snapshot after it formed, so a star particle on average experienced of evolution when we record its properties. This limits to some extent our ability to measure the earliest dynamical evolution, especially because, in our simulations, stars are born clustered in GMCs (for example Benincasa et al., 2020; Guszejnov et al., 2020), where they can be subject to various gravitational interactions on short timescales. Thus, ‘formation’ properties in our analysis necessarily refer to the combination of birth properties and early dynamical evolution.
When computing the velocities of a stellar population, we select star particles using 250 Myr bins of age, which corresponds to the dynamical/orbital time at the solar annulus today. When plotting velocities, we use the mass-weighted median velocity of all star particles within a given age range; we find nearly identical results using the mass-weighted mean instead. To ensure that outlier stars do not skew our results, we compute the velocity dispersion by finding half of the difference between the mass-weighted 16th and 84th-percentile velocities of all stars in a given age range, which is equivalent to the standard deviation for normal distribution. We compute these quantities (in each age bin) individually for each galaxy and then show the mean and standard deviation across our 11 galaxies.
| Name | ||||||||||
|---|---|---|---|---|---|---|---|---|---|---|
| [km/s] | [km/s] | [km/s] | [km/s] | [km/s] | [Gyr] | [Gyr] | [Gyr] | [Gyr] | ||
| m12m | 10.0 | 288 | 16.7 | 50.1 | 13.3 | 33.1 | 9.21 | 6.90 | 7.68 | 3.81 |
| Romulus | 8.0 | 265 | 20.4 | 55.9 | 16.6 | 41.8 | 7.42 | 7.16 | 7.16 | 4.90 |
| m12b | 7.3 | 272 | 17.9 | 56.6 | 13.1 | 37.5 | 7.42 | 7.42 | 7.42 | 6.32 |
| m12f | 6.9 | 256 | 19.9 | 74.9 | 13.5 | 31.6 | 7.42 | 6.39 | 6.39 | 5.01 |
| Thelma | 6.3 | 230 | 21.2 | 62.8 | 19.4 | 43.9 | 4.35 | 4.35 | 4.25 | 2.57 |
| Romeo | 5.9 | 249 | 14.1 | 40.3 | 12.2 | 31.3 | 11.0 | 10.2 | 10.2 | 6.52 |
| m12i | 5.3 | 238 | 20.1 | 52.4 | 12.8 | 27.5 | 6.65 | 6.39 | 6.39 | 3.14 |
| m12c | 5.1 | 240 | 23.1 | 62.8 | 19.5 | 38.4 | 6.49 | 6.14 | 6.39 | 3.70 |
| m12w | 4.8 | 163 | 16.6 | 83.9 | 5.5 | 29.8 | 4.09 | 4.6 | 5.89 | 0 |
| Remus | 4.0 | 216 | 13.9 | 40.3 | 10.7 | 25.0 | 7.93 | 7.93 | 7.93 | 5.88 |
| Juliet | 3.3 | 211 | 16.6 | 45.6 | 15.0 | 32.6 | 4.35 | 4.61 | 4.61 | 4.40 |
| Louise | 2.3 | 177 | 14.6 | 37.5 | 11.0 | 26.1 | 7.16 | 6.9 | 7.16 | 5.56 |
| m12z | 1.8 | 92.6 | 21.4 | 67.6 | 19.0 | 39.0 | 0.51 | - | - | - |
| m12r | 1.5 | 127 | 17.4 | 47.1 | 7.3 | 15.4 | 5.9 | 0.26 | 2.3 | - |
| sample mean | 6.0 | 236 | 18.0 | 56.1 | 13.5 | 32.4 | 7.19 | 6.76 | 6.98 | 4.31 |
3 Results
3.1 Stellar Kinematics versus Age
3.1.1 Defining the Eras of Disk Evolution
Motivated by the kinematic trends that we explore and by previous analyses of these galaxies (for example Garrison-Kimmel et al., 2018; Ma et al., 2017; Faucher-Giguère, 2018; Yu et al., 2021; Gurvich et al., 2023), we divide our galaxies’ histories into three eras, which we term the ‘Pre-Disk’, ‘Early-Disk’, and ‘Late-Disk’ Eras. Each of our galaxies began in the Pre-Disk Era, when the gas lacked coherent rotation, such that stars formed on nearly isotropic orbits. Then, each galaxy formed a stable, coherent disk and transitioned into the Early-Disk Era. Specifically, the start of the Early-Disk Era marks the time when all subsequent generations of stars that formed with rotationally-dominated kinematics, with . Table 1 lists the lookback time, , that each galaxy transitioned into the Early-Disk Era, .
These disks were kinematically hot, with high , at the start of the Early-Disk Era, but they became increasingly settled, with increasingly cold and rotationally-dominated kinematics, throughout it. As a result, grew most rapidly throughout this era. Eventually, the growth of slowed and the galaxies transitioned into the Late-Disk Era, when the kinematics at formation did not evolve much as stars formed on highly rotational orbits in a dynamically cold disk. On average, galaxies in our sample transitioned from the Pre-Disk to the Early-Disk Era ago and from the Early-Disk to the Late-Disk Era ago, though with significant galaxy-to-galaxy scatter in these ages.
Hopkins et al. (2023) argued that two aspects of the galaxy’s gravitational potential drive the transitions between these eras. The shape of the potential, specifically the formation of a sufficiently centrally-concentrated mass profile, drives the initial formation of a disk, that is, the Pre-Disk to Early-Disk transition. Separately, the absolute depth of the potential (within the radius of star formation) drives the transition from bursty to smooth star formation, which roughly coincides with the transition from the Early-Disk to Late-Disk era, although this connection may be less direct. Similarly, our Pre-Disk and Early-Disk Eras generally correspond to the ‘bursty star formation’ phase, in Stern et al. (2021), Gurvich et al. (2023) and Yu et al. (2021), while our Late-Disk Era corresponds to their ‘steady star formation’ phase.
3.1.2 Median velocity versus age
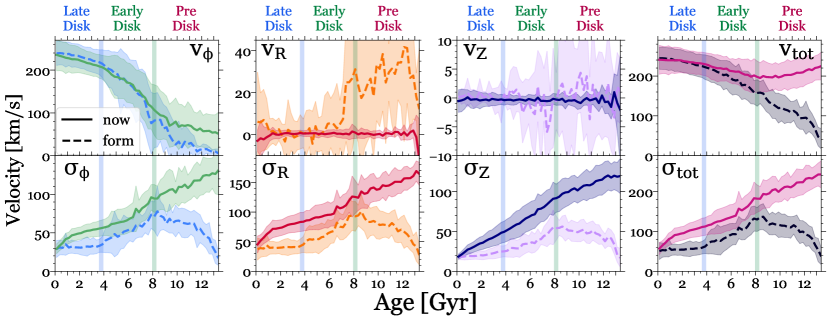
We start by analyzing the general dynamic evolution of our simulated galaxies. Figure 1 (top) shows the sample-averaged azimuthal, radial, vertical, and total median velocities at formation (dashed lines) and at present (solid lines) versus stellar age. We label the Late-, Early-, and Pre-Disk Eras on the top of each column, and we mark the start of the Early and Late-Disk Eras with shaded bars. The time that one era ended and another began is not exact, in part because Figure 1 shows sample-averaged quantities, so the shaded bars represent the approximate transition time and not an instantaneous boundary.
Figure 1 (top left) shows the median azimuthal (rotational) velocity, , versus age. For most of the Pre-Disk Era, stars formed with : in the early galaxy, stars did not coherently rotate. Eventually, began to increase as the disk began to settle, and the galaxy transitioned into the Early-Disk Era. The slight growth of towards the end of the Pre-Disk Era arises because we average over multiple galaxies, so earlier-transitioning galaxies bias the sample’s mean: within individual galaxies, the rise of is generally (but not always) sharp and coincident with the transition to the Early-Disk Era (see Figure 3). strongly rose throughout the Early-Disk Era, but its growth weakened once the galaxy transitioned into the Late-Disk Era ( ago), likely because the total mass within our radial range changed little during this period (Garrison-Kimmel et al., 2018). primarily follows the same trends with age as . However, stars that formed in the Pre-Disk Era have significantly larger now than at formation, because they were torqued onto more coherent rotational orbits as the disk subsequently formed and settled. Likely, gas-rich mergers that seeded the disk’s orientation also torqued up these existing stars (for example Santistevan et al., 2021). Bellardini et al., in preparation, show that this increase in corresponds to an increase in specific angular momentum for these pre-existing stars, that is, they were indeed torqued. In contrast, stars that formed in the Late-Disk Era on nearly circular orbits now have slightly smaller now than at formation because of dynamical heating/scattering.
Figure 1 (top row, column 2 and column 3) shows the median radial velocity, , and the median vertical velocity, , versus stellar age. Previous work analyzing FIRE simulations found that bursty star formation in the Pre-Disk galaxy drove significant gaseous outflows (for example Muratov et al., 2015; Anglés-Alcázar et al., 2017; Feldmann et al., 2017; Sparre et al., 2017; Pandya et al., 2021; Stern et al., 2021). These outflows sometimes remained star-forming and produced stars that inherited their progenitor’s outflowing dynamics (El-Badry et al., 2016; Yu et al., 2021). We find complementary results: stars that were born in the Pre-Disk Era had positive (outward) , indicating the presence of star-forming outflows, and that rapidly fluctuated around 0. Once the early disk formed, decreased to 0, in part because feedback-driven outflows declined and eventually ceased: throughout the rest of the Early-Disk and Late-Disk Eras, stars had .
At present, both and for stars that formed in all eras, meaning that old stars’ subsequent dynamical evolution overrode any preference for outward/upward/downward motion. This difference also reflects our selection of stars that remain within the disk today. Our galaxies largely formed radially ‘inside-out’ (for example Garrison-Kimmel et al., 2018), such that old in-situ stars typically formed inside of our current radial range of , and as El-Badry et al. (2016) and Ma et al. (2017) discussed for the FIRE simulations, old in-situ stars typically reside at larger radii today, compared to when they formed, because bursts of feedback-driven outflows generated large fluctuations in the gravitational potential at early times that moved these stars outward. We note that this change in radius for old stars is distinct from ‘radial migration’, in that the vast majority of these stars have moved coherently outward, while radial migration entails a roughly equal number of inward and outward moving stars. As such, old stars in our sample are more likely than young stars to be near their apocenters, and as a result, have closer to 0. Bellardini et al., in preparation will examine this radial redistribution in detail.
Figure 1 (top right) shows the median total velocity, , versus age. The growth of the galaxy’s mass drove much of the evolution of , because the underlying gravitational potential determines its virial velocity. In turn, the evolution of indicates that the galaxy’s mass increased over time, most rapidly in the Pre-Disk Era and only minimally in the Late-Disk Era. The evolution of largely resembles that of , with the exception of the Pre-Disk Era, when grew steadily, while remained near 0. This is not surprising: depends only on the magnitude of each component, while also depends on the sign. In the Pre-Disk Era, stars rotated, just not coherently, such that the median while . However, once the galaxy transitioned into the Early-Disk Era, stars had larger and larger fractions of their (increasing) in rotation. At present, has almost no dependence on age, with all stars near , as a result of virialization and dynamical heating.
3.1.3 Velocity dispersion versus age
Figure 1 (bottom) shows the azimuthal, radial, vertical, and total stellar velocity dispersion, , versus age, at both the time of the star’s formation and at present. All components exhibit similar trends with age, albeit with different normalizations. Here we focus on general trends with age; we compare the 3 components in Section 3.3.
reflects the turbulence in star-forming gas and shows distinct behavior in each kinematic era. The oldest stars formed with the lowest , reflecting their low in the low-mass galaxy progenitor at early times. As the galaxy grew during the Pre-Disk Era, grew, reflecting the deepening of the gravitational potential in addition to an increase in absolute gas turbulence, from accretion, mergers, bursty and more vigorous star formation, and outflows (for example Ma et al., 2017; El-Badry et al., 2018a; Hung et al., 2019; Flores Velázquez et al., 2021).
reached a maximum during the transition to the Early-Disk Era. This peak in reflects the competing effects of the galaxy continuing to become more massive (increasing ) but also starting to settle into a disk, decreasing the relative contribution to . steadily decreased throughout the Early-Disk Era as the disk settled. This steady decrease in turbulence could occur only after the initial onset of the disk, when it could self-regulate to maintain a turbulent Toomre in star-forming gas (for example Hopkins et al., 2012; Faucher-Giguère et al., 2013; Wisnioski et al., 2015; Krumholz et al., 2018; Gurvich et al., 2020; Orr et al., 2020). As such, equilibrium models imply that a gas disk maintains , so reduced as did.
Finally, upon the transition to the Late-Disk Era, reached a floor and remained nearly constant, reflecting the plateauing gas fraction and correspondingly steady and low turbulence and SFR during this era (Ma et al., 2017; Yu et al., 2021; Garrison-Kimmel et al., 2018; Hung et al., 2019; Gurvich et al., 2023).
While shows distinct trends in each era, shows markedly different behavior, monotonically increasing with age across all eras. Thus, the additional dispersion from post-formation dynamical heating, in combination with , produces the observed continuous increase in dispersion with stellar age; neither process alone explains it. This also means that does not directly and simply reflect the formation history of the galaxy. This difference is most evident for stars that formed in the Pre-Disk Era, which have the highest values of today but formed with the smallest values of . By contrast, stars forming in the Early-Disk Era exhibit an age evolution that follows a similar slope at formation and at present, modulo a normalization offset. Finally, stars that formed in the Late-Disk Era have increasing with age their while is constant. We examine the age dependence of post-formation dynamical heating in detail in Section 3.4.
In conclusion, the age dependence of differed in the Pre-Disk, Early-Disk, and Late-Disk Eras, reflecting the distinct kinematics of these eras. At present, increases monotonically with age, with a relation to that differs for each era.
3.1.4 Rotational support versus age
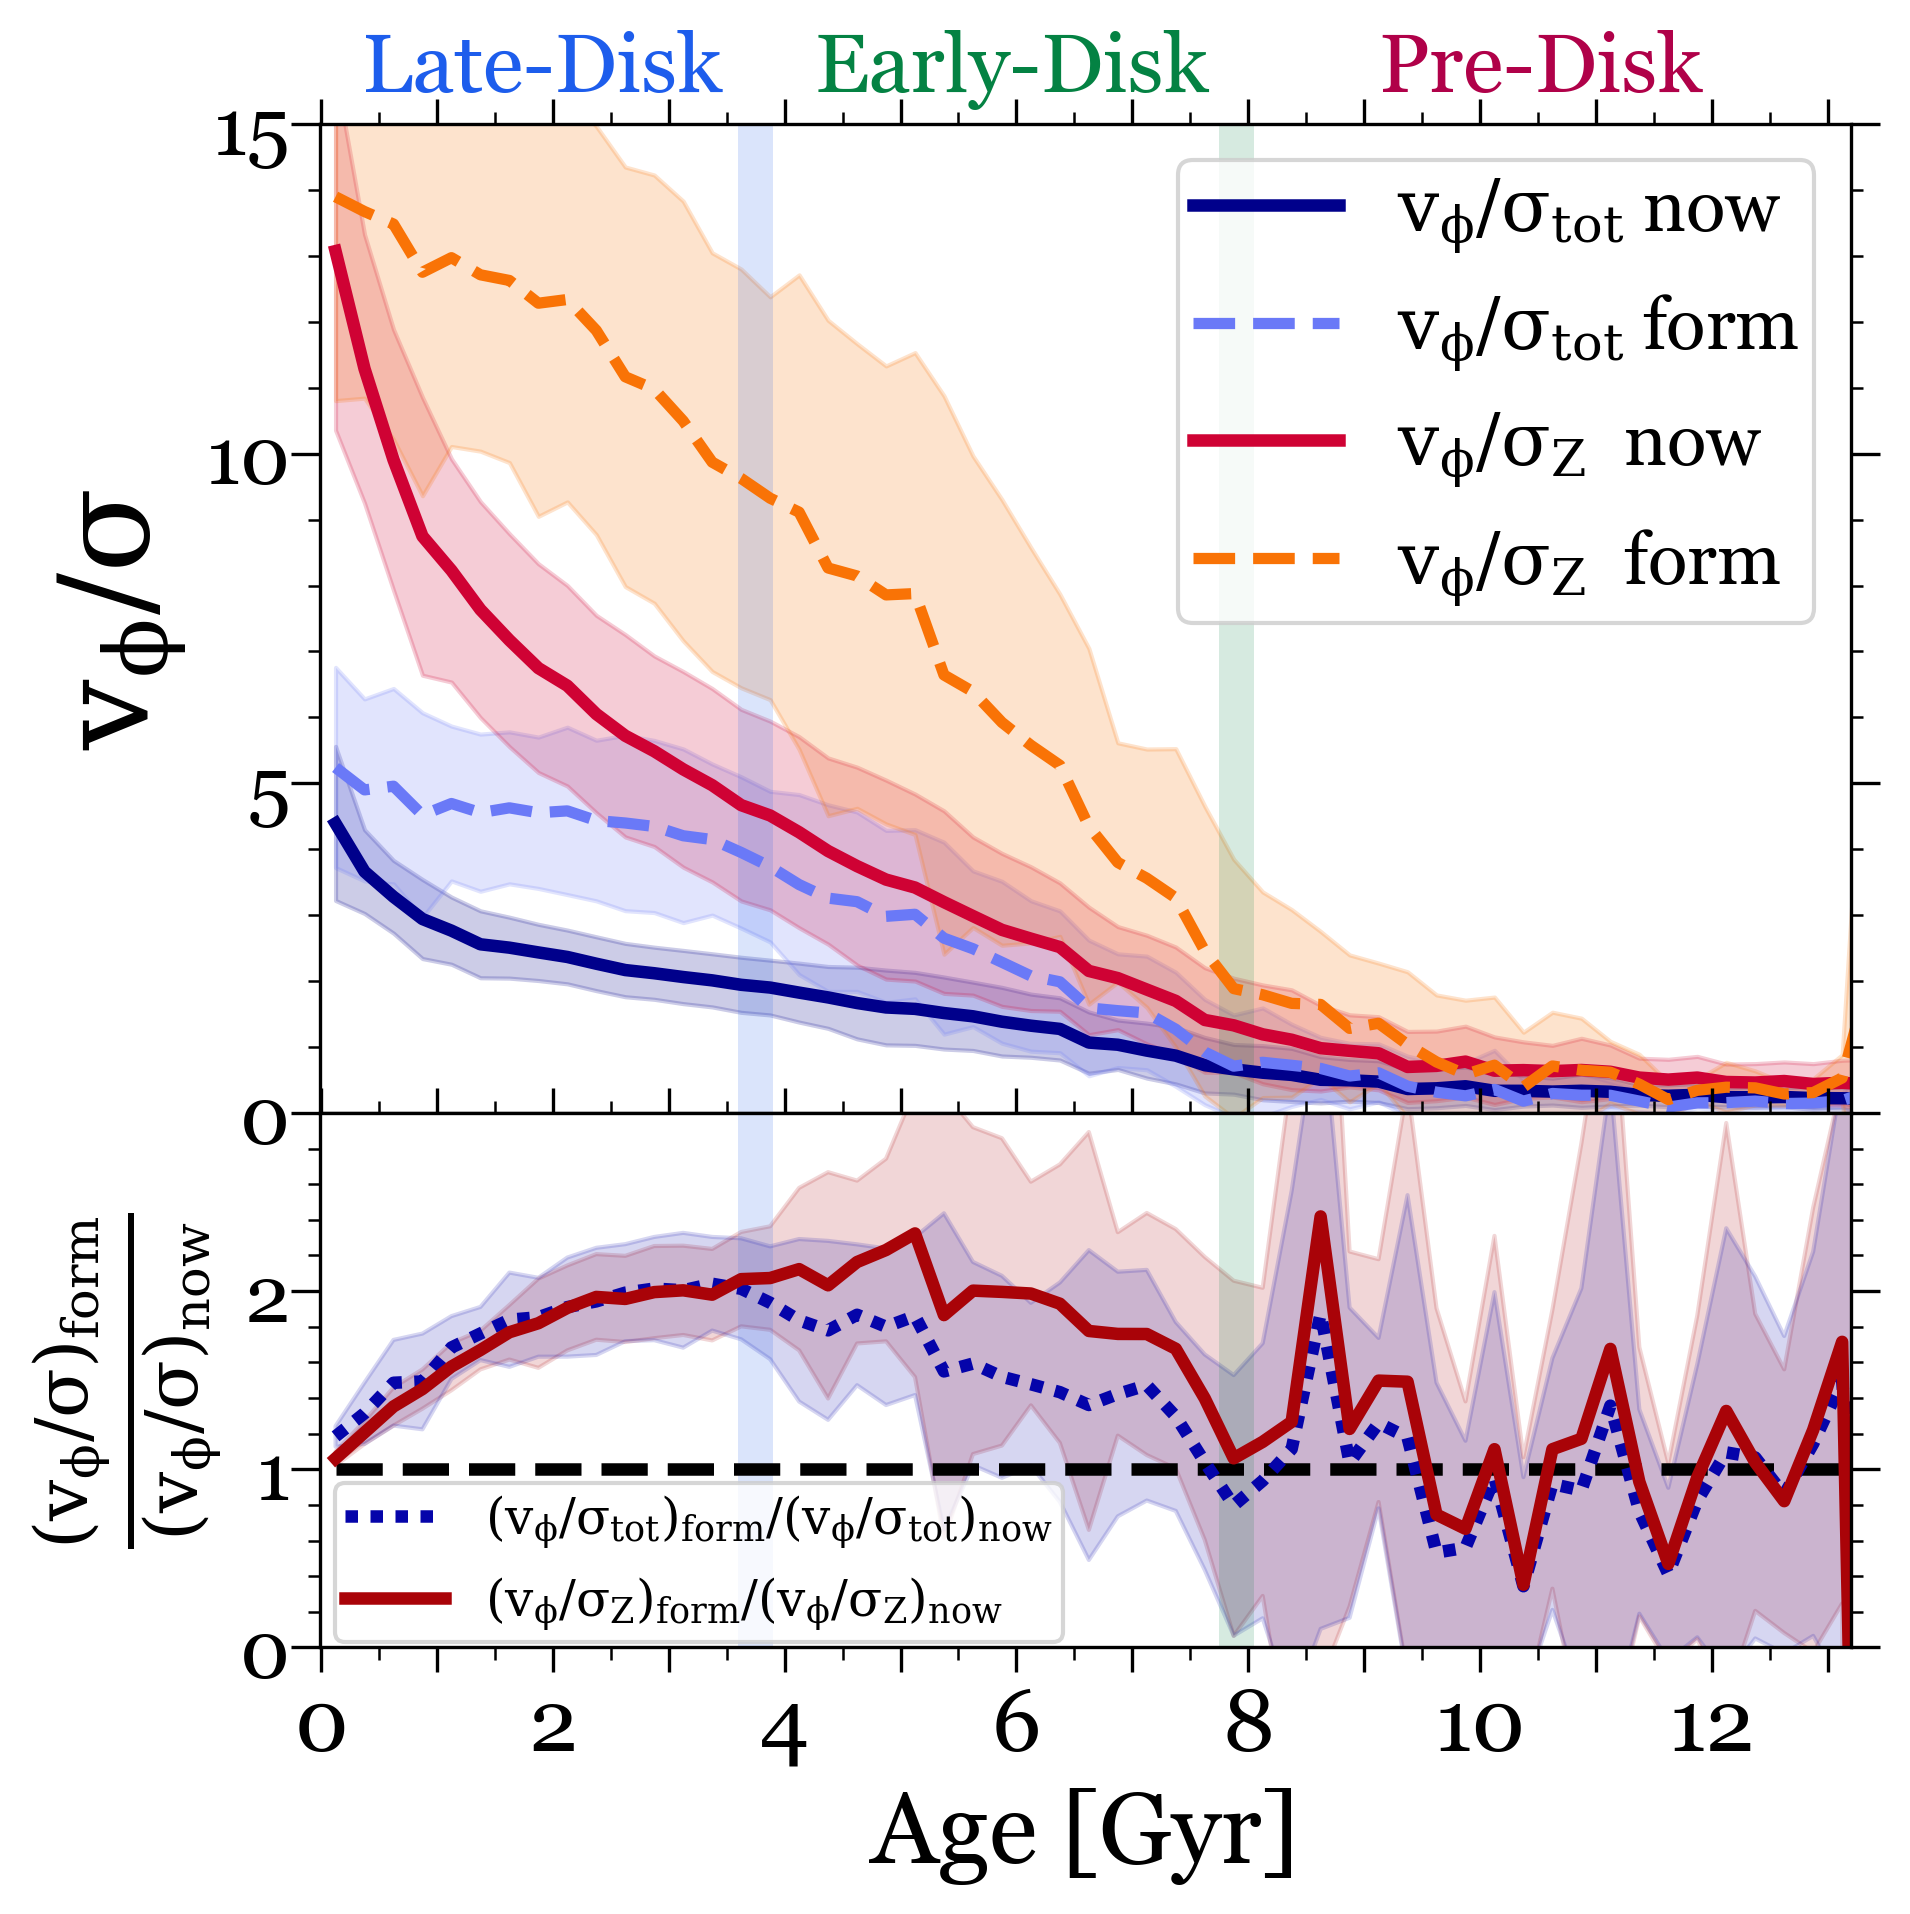
The ratio is a dimensionless measure of the degree of rotational support, that is, how ‘disky’ or ‘dynamically cold’ a disk is. Figure 2 (top) shows the ratio of median to and , versus stellar age, averaged across our 11 galaxies. We do not show the ratios with or , because they exhibit qualitatively similar trends as , albeit with higher normalizations.
In the Pre-Disk era, (by definition). When permanently exceeded ( ago on average), a galaxy transitioned into the Early-Disk Era, when successively younger populations were born with increasing and . After the galaxy transitioned into the Late-Disk Era ( ago on average), grew only slightly, so stars during this era formed with the same degree of total rotational support. By contrast, continued to increase throughout the Late-Disk Era, with only slightly slower growth than in the Early-Disk Era, reflecting the more significant reduction in over time. Thus, we find more significant vertical ‘settling’ during the Late-Disk Era.
Relative to formation, stars have lower as measured today. To better understand how the post-formation change in depends on age, Figure 2 (bottom) shows the ratio versus age. This ratio indicates how ‘disky’ a stellar population formed relative to how disky it is today, from the combined effect of post-formation dynamical heating and coherent torquing.
Younger stars, which formed in the Late-Disk Era, became increasingly less disky with age, as post-formation dynamical heating increased their dispersion. Stars older than exhibit ratios near 2, meaning they are currently half as disky as when they formed. For stars that formed in the Early-Disk Era, this trend reverses, as the post-formation change in diskiness lessens with age, and the oldest stars in this era are now equally as disky as when they formed. This arises because decreased with age faster than the post-formation change in increased. Now, the ratio with exhibits nearly identical behavior as the ratio with , indicating that both ‘3D diskiness’ and ’vertical diskiness’ evolved after formation identically relative to their values at formation.
Stars that formed in the Pre-Disk Era have values of that fluctuate around 1. Some stars have higher now than when they formed, from post-formation torquing from events like mergers. Also, the division of intrinsically small velocity values amplifies the fluctuations.
3.2 Case Studies
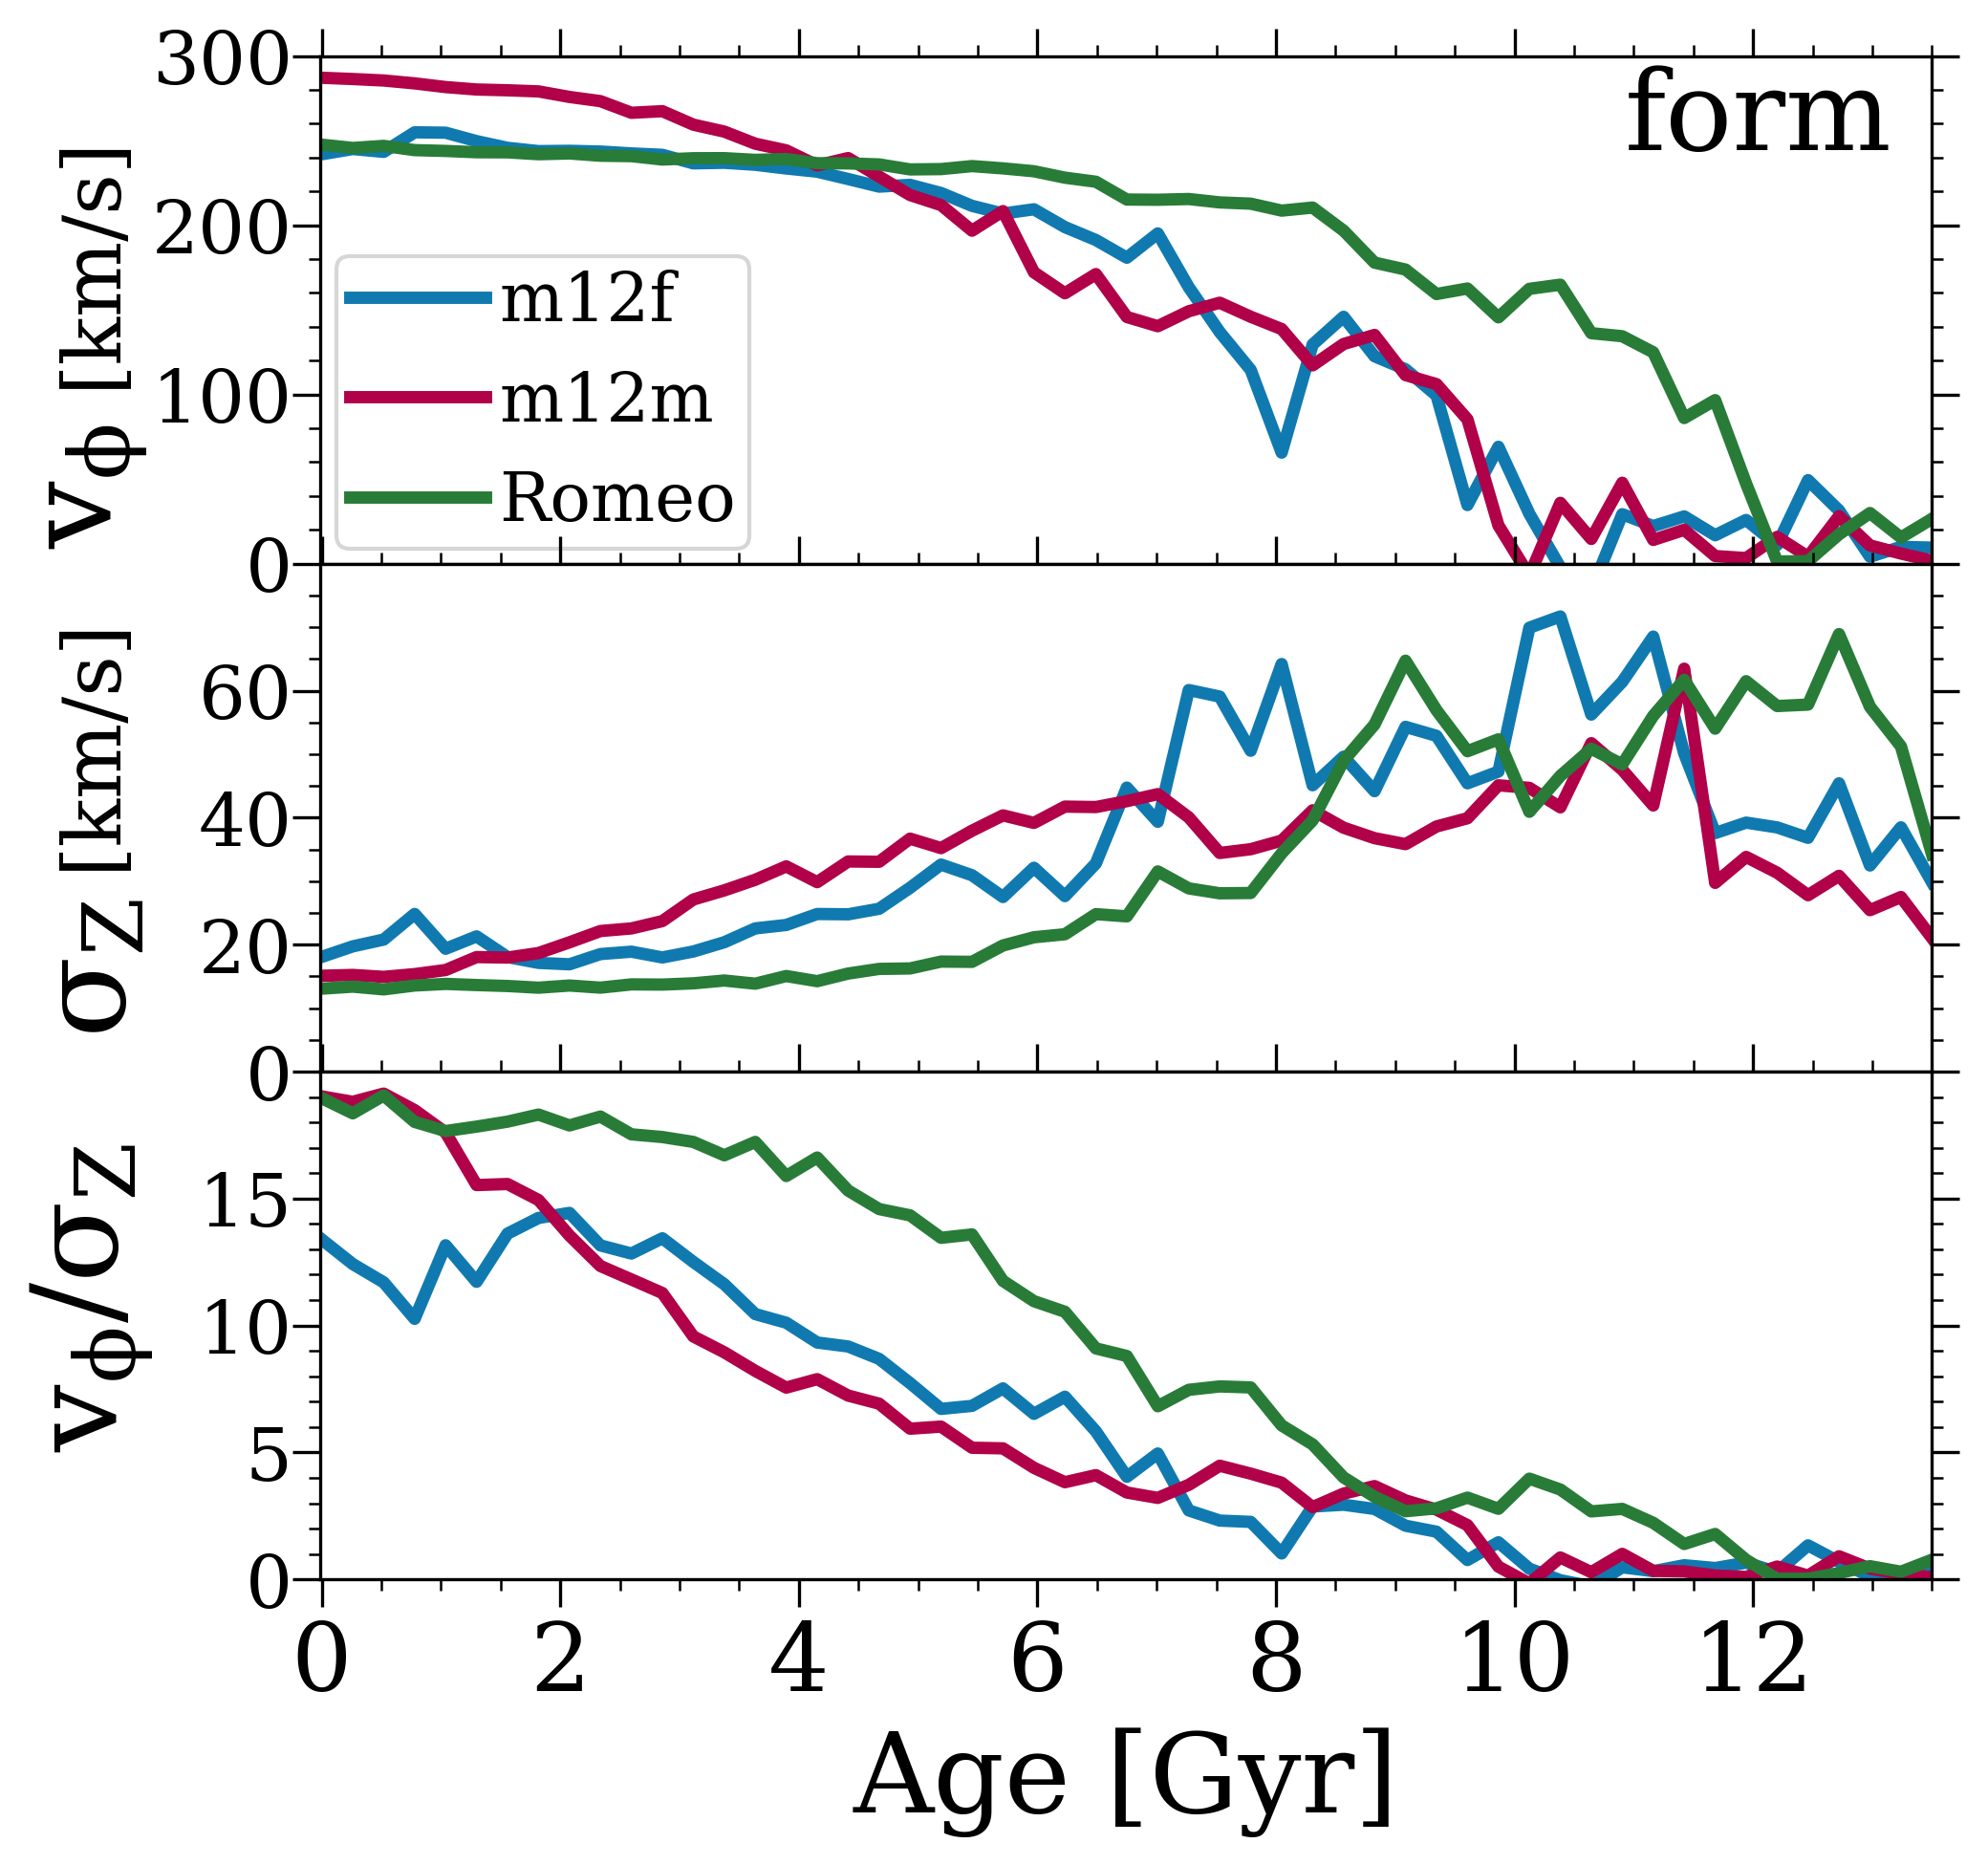
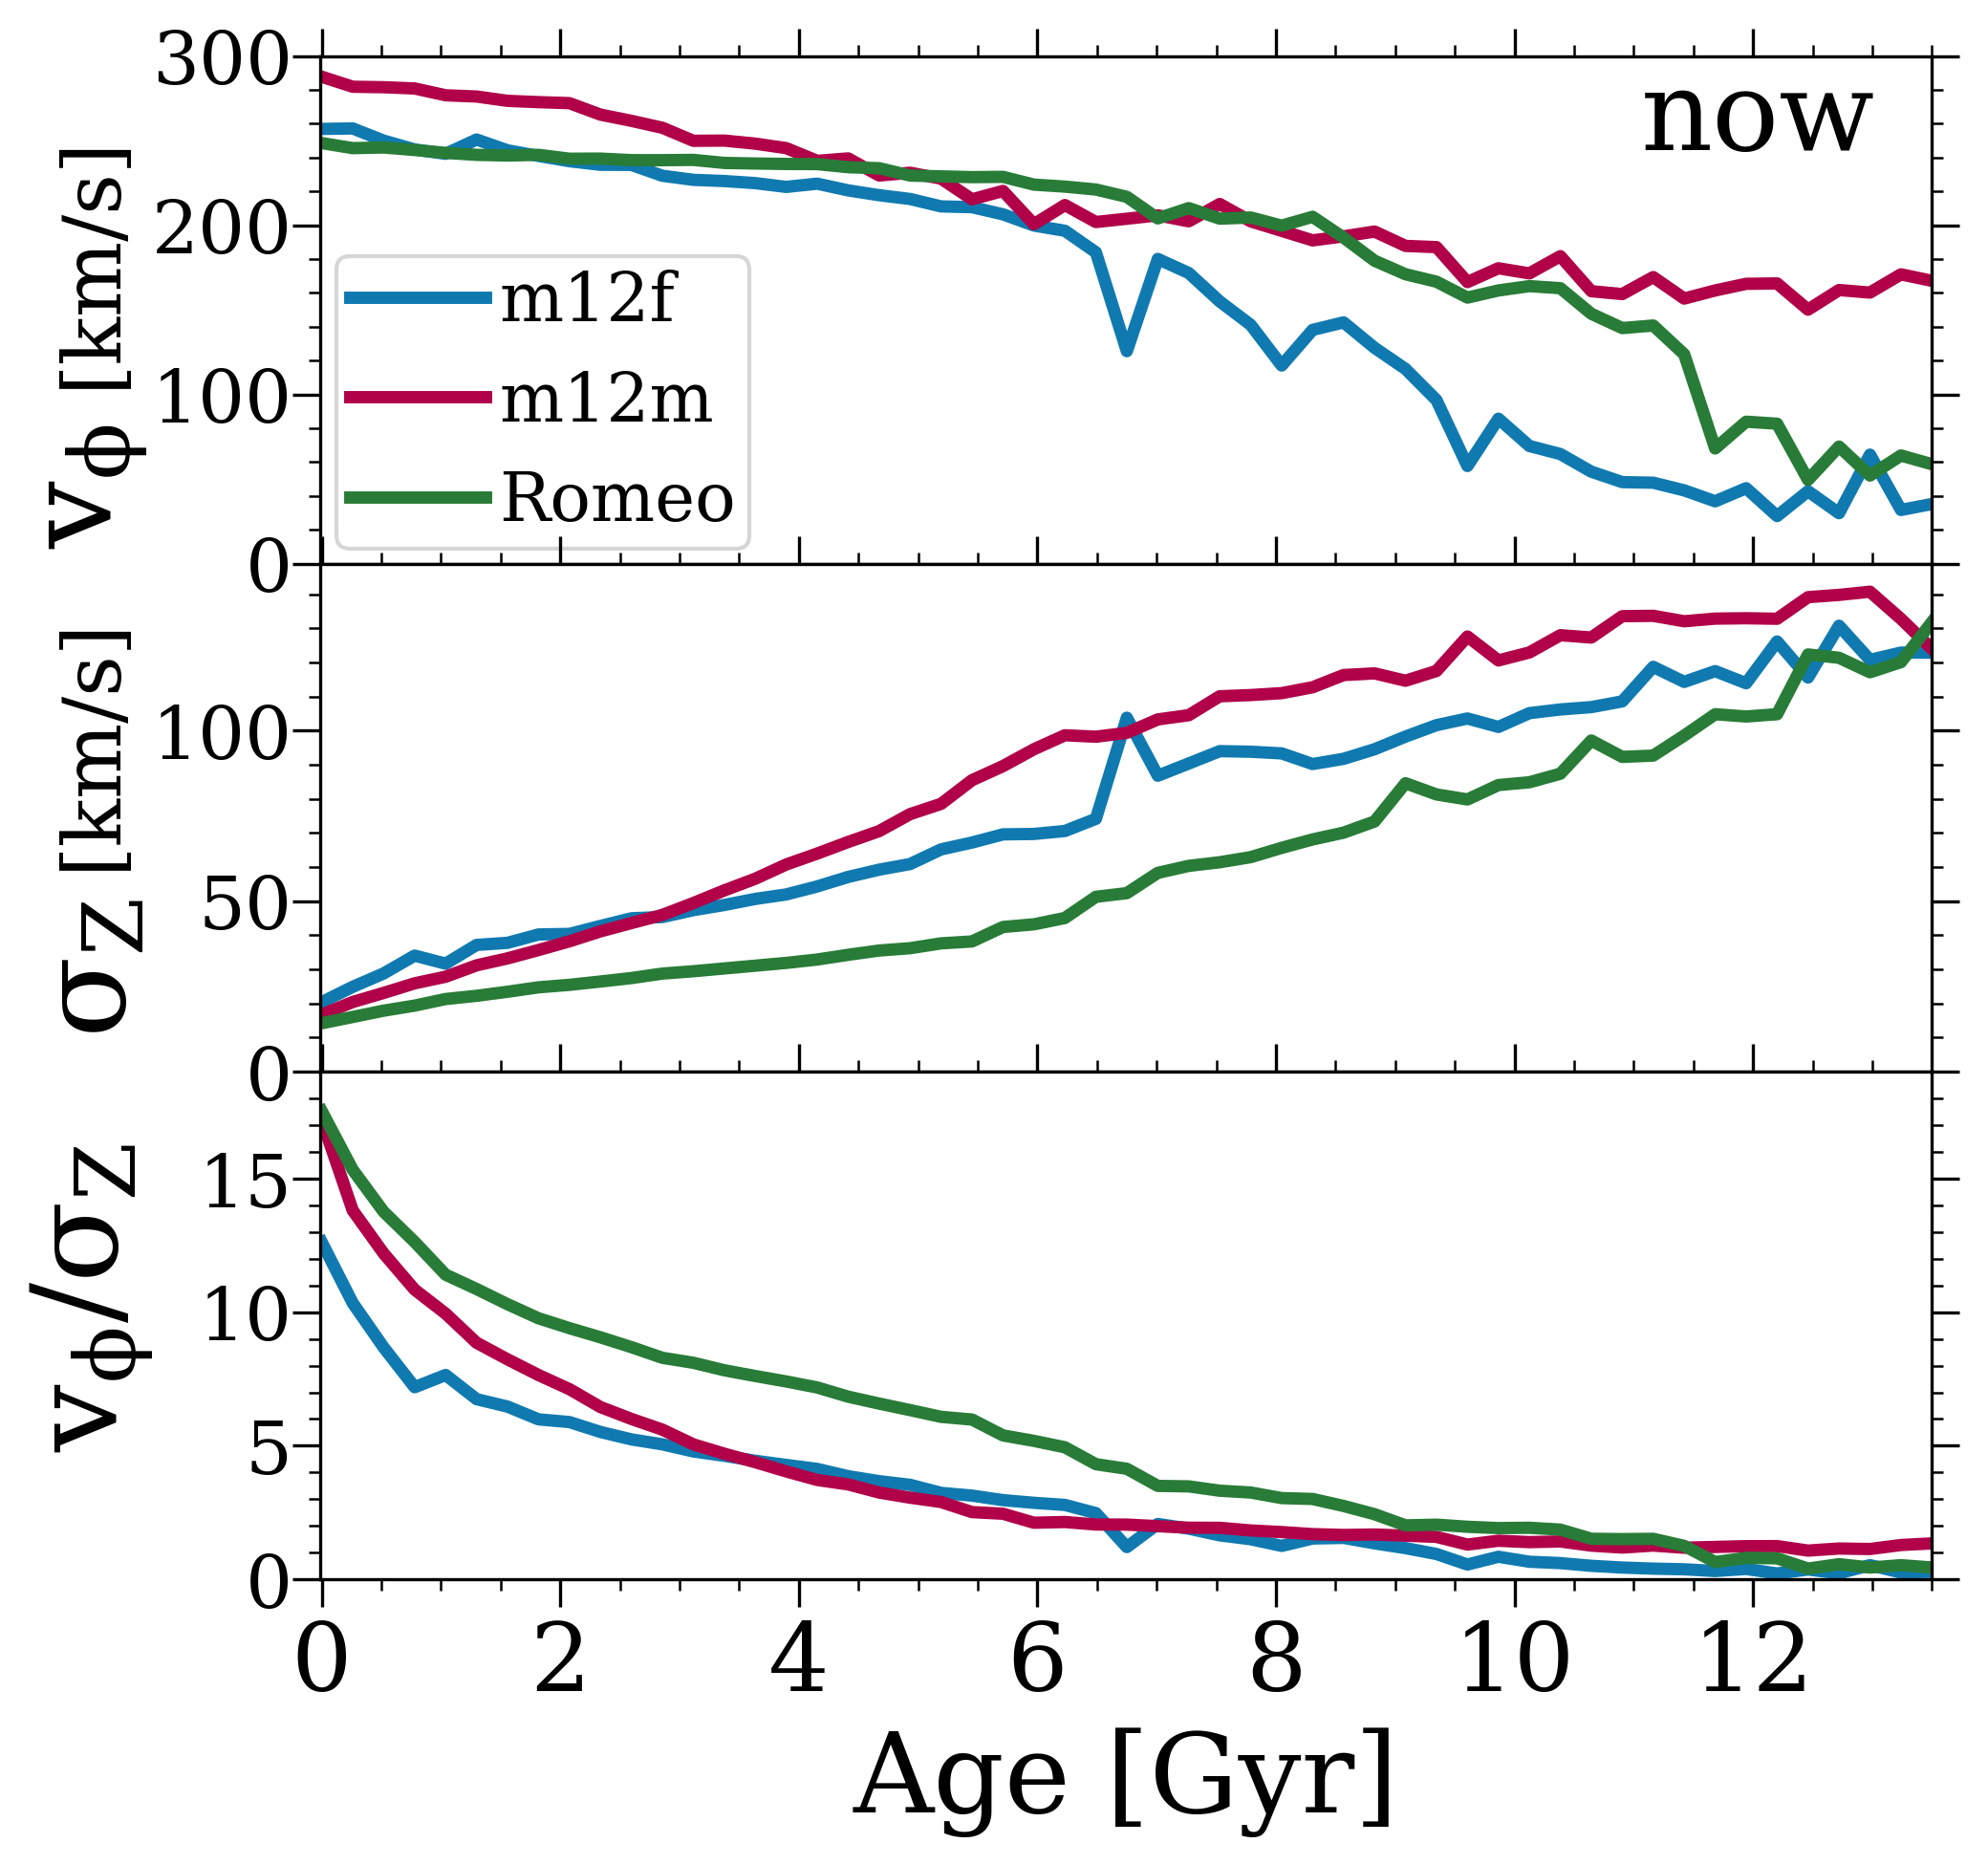
While Figures 1 and 2 show trends averaged across 11 galaxies, Figure 3 shows these trends for 3 individual galaxies: m12f (blue), m12m (pink), and Romeo (green).
Romeo is one of our closest analogues to the MW today, residing in a LG-like pair and having a stellar mass of , similar to the MW. Furthermore, recent observational analysis suggests that the MW’s disk began to form ago (Belokurov & Kravtsov, 2022; Conroy et al., 2022; Xiang & Rix, 2022), and as we quantify further below, of all our galaxies, Romeo’s disk began to form the earliest and thus nearest in time to this estimate for the MW, likely because of its forming in LG-like environment (Garrison-Kimmel et al., 2018; Santistevan et al., 2020). Figure 3 (left) shows that Romeo’s rapidly increased and its began to rise Gyr ago and it transitioned into its Early-Disk Era ago. Although Romeo transitioned the earliest, its evolution largely follows the same trends as most of our other galaxies.
m12f highlights the effect of major mergers on stellar kinematics. Its and began to increase ago, during its transition to the Early-Disk Era. However, both decreased Gyr ago, when a galaxy flew by and torqued its disk. After this, and increased again. m12f then experienced a major merger Gyr ago. Although the dispersion was high during the merger, afterwards sharply decreased while increased. Thus, a major merger led to a more rotationally-supported disk and may have triggered its transition to the Late-Disk Era. This agrees with previous work that found that gas-rich mergers can trigger the settling of galactic disks, particularly if they occur when the potential is sufficiently deep to prevent outflows after bursts of merger-triggered star formation (for example Hopkins et al., 2009; Moreno et al., 2021; Santistevan et al., 2021; McElroy et al., 2022; He et al., 2023).
At present, the high dispersion during the merger and the sharp decline after remain discernible. Although the merger more dramatically impacts the in-plane components of the dispersion (notably, at present spikes from to back down to within 1 Gyr during the merger), for consistency, we display only the vertical component. Thus, the present-day kinematics of stars, specifically ‘spikes’ in the velocity dispersion versus age, can reveal past merger events, as we will explore in future work. After its disk began to settle, m12f underwent a smaller, prograde merger Gyr ago that triggered a significant burst of star formation (Yu et al., 2021), increased , and decreased . Thus, certain mergers occurring in the Pre- or Early-Disk Eras increased the galaxy’s rotational support, while mergers occurring in the Late-Disk Era decreased the disk’s rotational support.
We next highlight m12m, whose evolution deviates from our other galaxies. m12m has the largest stellar mass at in our sample, , more similar to M31. Furthermore, m12m underwent numerous early mergers, including two particularly massive mergers and 9 Gyr ago, but it had a quiescent merger history over the past 8 Gyr.
m12m has our second earliest transition into the Early-Disk Era: its permanently surpassed unity Gyr ago. Despite this, m12m has yet at to transition fully into its Late-Disk Era: its continues to increase (albeit only slightly), all but its vertical component of have yet to become constant, and continues to strongly increase. This may be because m12m began to develop a bar Gyr ago, leading to a bar-buckling event that formed a significant X-shaped bulge composed primarily of younger stars (age ) (Debattista et al., 2019). m12m’s kinematics are also unique at present; most notably, its exhibits no significant decrease for old stars; instead, all ages have , which is almost faster than our sample’s average, likely as a result of its multiple major mergers. Of our 3 case studies, m12m generally had the lowest for stars older than Gyr, but at present m12m has the highest at almost all ages, because its stars have been more dynamically heated.
Comparing these case studies provides useful context and caution for interpreting population-wide trends. First, the dispersion of young stars does not necessarily reflect the dispersion of older stars: across the three galaxies, the difference in is only a few for the youngest stars (age Myr), but jumps to at 1 Gyr old and at 6 Gyr old. In fact, the rate at which increases with age varies between galaxies. On a related note, how compares between galaxies can be different than how does. That is, stars of a certain age may now have larger/smaller dispersions than those in another galaxy despite forming with smaller/larger dispersions. For example, Romeo generally had the highest values of for stars older than 6 Gyr while m12m had the lowest. However, this ordering flips at present: today, in m12m is higher than in Romeo. Thus, the dispersion with which stars formed does not set their present dispersion, because the amount and age dependence of post-formation heating can differ significantly between galaxies.
On the contrary, provides a similar comparison between galaxies at both formation and present-day. maintains its relative ordering between galaxies from formation and even largely preserves the trends with age exhibited by each individual galaxy: Romeo still has the highest values for stars younger than Gyr, m12f and m12m still have similar values for intermediate-aged stars, and m12f still has the lowest values for young stars. Although the differences between each galaxy’s are less pronounced today than at formation, present day observations of (versus age) give a better representation of a galaxy’s formation history than and alone.
3.3 Comparing Velocity Components
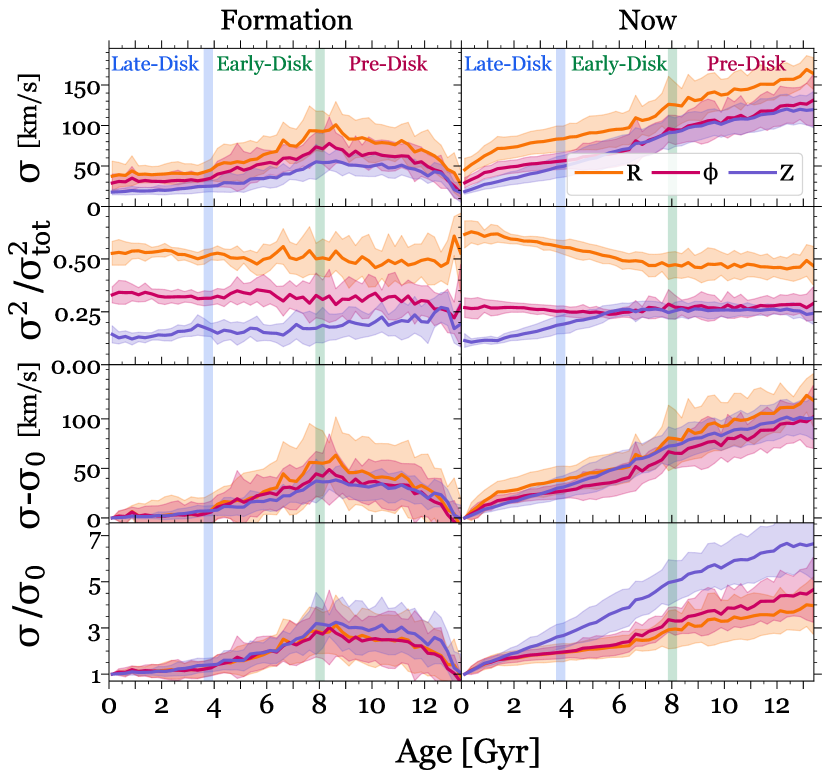
All three spatial components of velocity dispersion share similar trends with age, but we now compare them in detail. Figure 4 shows the radial, azimuthal, and vertical velocity dispersions, averaged across the 11 galaxies, at formation (left) and at present (right).
Figure 4 (top row) compares the dispersions. The relative order of the components at formation is constant with age: > > . At present, dominates at all ages. However, now matches for stars that formed in the Early- and Pre-Disk Eras. Thus, the similarity between and for intermediate-aged and old stars arises from vertical post-formation dynamical heating, not from formation. Measurements of in the Solar neighborhood find > > (for example Wielen, 1977; Dehnen & Binney, 1998; Nordström et al., 2004). While our results agree for stars that formed in the Late-Disk Era, we find that for stars that formed in the Early and Pre-Disk Eras, potentially indicating that post-formation heating of is greater for older stars in our galaxies than in the MW.
Figure 4 (second row) shows the ratio of each component’s to the total at that age, which compares each component’s contribution to the overall kinetic energy in dispersion. Because , the sum of this ratio in all three components is 1. Remarkably, the ordering and relative value of each component at formation are independent of age. That is, was distributed across its 3 components the same way across the galaxy’s entire formation history, with , , and accounting for , 32%, and 17% of , on average. This roughly constant partitioning across cosmic time is striking, given that it persists across the eras of disk formation, including the transition from dispersion-dominated to rotation-dominated orbits, from bursty to steady star formation, and the abatement of galactic outflows. Given this consistent partitioning at formation during both early and late times, we posit that the drivers of (star-forming) gas dispersion common in the early galaxy, such as star-burst driven outflows, and those common in the later galaxy, such as spiral arms, have similar impacts on how the energy in dispersion at formation is partitioned between components. However, we we relegate testing this hypothesis to future work.
Currently, dominates in all ages, as Figure 4 (top) shows. However, unlike at formation, the relative contributions of and are constant with age only for stars older than Gyr, which formed in the Pre-Disk Era and the beginning of the Early-Disk Era. still contributes of the random kinetic energy of these old stars, while and both contribute .
For stars younger than 6 Gyr, the relative contribution of increases for younger stars, even surpassing its contribution at formation, because young stars have been heated most strongly along their radial component, as we show below. In contrast, the relative contribution of decreases for younger stars, more directly reflecting the low of these young stars. Interestingly, stars of all ages have approximately 25% of their random kinetic energy from , slightly less than when they formed.
We define as the dispersion of our youngest stars (age < 250 Myr at ). To examine the degree of self-similarity in the evolution of the different velocity components, Figure 4 (third row) shows , the absolute change in the velocity dispersion with age. All velocity components have more similar evolution in than in . This is most self-similar at formation, but it also holds to a lesser degree at present. In particular, exhibits a greater absolute change only for intermediate-aged stars ( Gyr), whereas has a greater absolute change at all ages, because had the largest amount of dispersion added by post-formation dynamical heating for all but intermediate-aged stars, as we discuss below.
Figure 4 (bottom row) shows , the fractional change in the velocity dispersion with age, relative to today. At formation, this exhibits significant self-similarity, with all components showing near identical evolution for stars that formed in the Early- and Late-Disk Eras. In particular, at the onset of the Early-Disk Era, stars formed with the dispersion as young stars today for all velocity components. However, the striking self-similarity at formation does not hold at present. Although all components evolve relatively similarly for ages Gyr, the vertical component increasingly dominates for older stars, with the oldest stars having vertical dispersions . Because had similar fractional evolution at formation, its distinctive behavior at present must arise from a greater fractional amount of post-formation heating for stars that formed in the Early- and Pre-Disk Eras, which we explore next.
3.4 Disk Settling versus Post-Formation Heating
As we have shown, both disk settling and dynamical heating shape the relation between and stellar age. We now quantify the relative importance of these two processes versus age.
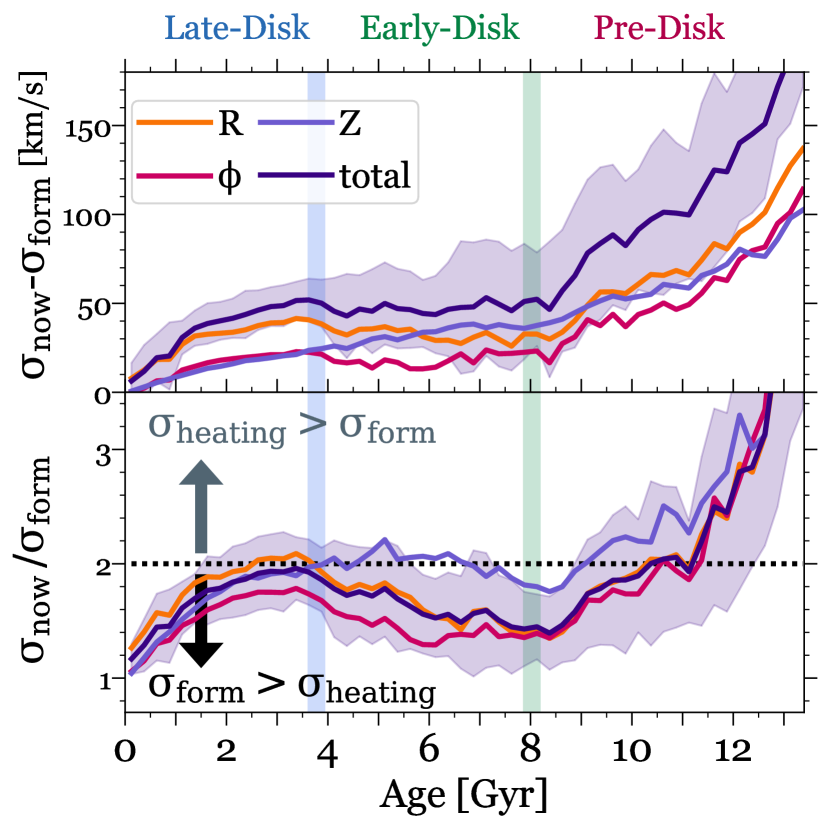
Figure 5 shows the absolute and fractional impact of post-formation dynamical heating on the present-day radial, azimuthal, vertical, and total velocity dispersion of stars versus age. Most notably, both absolute and fractional post-formation dynamical heating follow distinct trends with age for stars that formed in each of our three kinematic eras.
Figure 5 (top) shows the difference between dispersion at present and formation, , versus age, which directly conveys the amount of dispersion added post-formation. We focus primarily on the total dispersion, noting that the radial and azimuthal components show similar behavior. However, we discuss the vertical dispersion separately below, because it shows qualitatively different behavior.
For stars that formed in the Late-Disk Era, the amount of dispersion added post-formation increases with age, but at a declining rate, consistent with the idea that post-formation dynamical heating from scattering processes causes the observed increase in with age (for example Spitzer & Schwarzschild, 1951). However, stars that formed in the Early-Disk Era have been dynamically heated by the same total amount, , regardless of age. Considering the monotonic increase of in Figure 1, one may not intuitively expect this plateau. For example, stars that formed at the start of the Early-Disk Era ( ago) currently have that is almost higher than stars born at the end of the Early-Disk Era ( ago), but have less added post-formation. Thus, the monotonic increase of with age for stars that formed in the Early-Disk Era ( ago) arose not from the dependence of post-formation heating on age, but rather, from the amount of disk settling in versus age.
Once a disk started to form, scattering with structures within the now well-defined disk plane likely drove most post-formation heating, though interactions with satellite galaxies likely also contributed. As stars were dynamically heated, they experienced larger radial and vertical oscillations. Larger vertical oscillations decrease the amount of time that stars spend near the midplane, and increase their vertical velocities when passing through the midplane. In turn, the ability of stars to be heated along the in-plane direction decreases as vertical oscillations increase. Similarly, stars with large radial eccentricities encounter spiral structure at different orbital phases; the effects of these varied encounters tend to average out, such that spiral-driven heating becomes progressively weaker for increasingly eccentric orbits (Binney & Tremaine, 2008). Thus, stars that formed with low dispersions in the Late-Disk Era were initially efficiently heated. However, this efficiency correspondingly decreased as their dispersions increased over their lifetimes, which explains their near-exponential behavior for , as shown in the top row of Figure 5. Similarly, because stars that formed in the Early-Disk and Pre-Disk Eras had large dispersions at birth, they likely underwent little post-formation heating over the course of the Late-Disk and Early-Disk Era (though old stars likely experienced significant heating within the Pre-Disk Era ).
On the other hand, post-formation vertical heating shows different trends than in-plane heating across the Late and Early-Disk Eras. The amount of added post-formation never plateaus but instead monotonically increases with age by per Gyr. Therefore, post-formation vertical heating is likely a steady, continuous process, implying a different dynamical origin than in-plane post-formation heating. We will pursue a detailed analysis of the origin of in-plane and vertical heating in future work.
For stars that formed in the Pre-Disk Era, the amount of post-formation heating increases steadily with age for all components, including vertical. Older stars have more dispersion added post-formation, not only because they have had more time to be heated, but also because the early galaxy experienced the most frequent mergers, starbursts, and potential fluctuations that increased the dispersion of existing stars (for example El-Badry et al., 2018b). Likely, this phase accounted for most of the heating of stars that formed in the Pre-Disk Era. In later eras, more localized, temporally-stable processes (that is, scattering by non-axisymmetric structures within the disk) primarily heated the stars.
Figure 5 (bottom) shows the ratio of dispersion at present to dispersion at formation, , versus age, which quantifies the fraction of the present dispersion that existed at formation versus arose from post-formation heating. Values of indicate that post-formation heating contributes more to the current dispersion than the dispersion from formation, while values indicate that most of the dispersion was in place at the time of formation.
The evolution of the total dispersion largely matches that of the radial and azimuthal components. has an ‘S’-shaped dependence on age, somewhat different than in the top panel. Post-formation heating increases rapidly with age for stars that formed in the Late-Disk Era. This era’s oldest stars have current (radial, vertical, and total) dispersions with approximately equal contributions from heating and formation. Furthermore, stars that formed ago, during the transition to the Late-Disk Era, experienced the largest fractional increase from post-formation heating of all stars younger than 10 Gyr (for all but the vertical dispersion). These stars formed in a dynamically-settled thin disk with low dispersion and had more time to experience dynamical heating than stars that formed afterward.
However, strikingly, this dependence on age reverses in the Early-Disk Era, when decreases with age. As Figure 5 (top row) showed, the absolute amount of dispersion added post-formation is constant throughout this era. However, as Figure 1 showed, increases with age throughout this era. Thus, the fractional contribution of at birth became increasingly important with age in this era. Besides stars younger than , the oldest stars from the Early-Disk Era have the lowest dependence on post-formation heating, with only 40% of their current from post-formation heating, corresponding with their maximum and comparatively low amount of post-formation heating. In essence, stars were not able to be dynamically heated efficiently during this Early-Disk Era, because they already were born with high dispersions.
For stars that formed in the Pre-Disk Era, increases rapidly with age, because decreases with age (given the galaxy’s lower mass) while the amount of post-formation heating (and thus ) increases with age (from mergers, starbursts, and strong outflows). Thus, the current total dispersion of stars is primarily from post-formation heating for stars older than Gyr, and primarily inherited at formation for stars younger than 11 Gyr.
The evolution of the vertical component largely resembles that of the other components for stars that formed in the Late-Disk Era. However, while of the in-plane components noticeably decrease with age for stars that formed in the Early-Disk Era, the vertical component remains relatively constant near 2. In fact, for stars with ages between , meaning that the current vertical dispersions of stars with ages Gyr have equal contributions from post-formation heating and formation. Thus, for most stars, the fractional impacts of vertical post-formation heating and vertical disk settling are about the same. For stars younger than 2 Gyr, is more important, while for stars older than 10 Gyr, vertical post-formation heating is.
In summary, the monotonic rise of the current velocity dispersion with stellar age arises from the combined effects of both cosmological disk settling and the dynamical processes that heat stars after they form. In understanding the origin of the current shape of the relation between the total velocity dispersion and age, we conclude that: (1) post-formation heating dominates the dispersion for stars that formed in the Late-Disk Era (age ), when the dispersion at formation was flat with age, (2) disk settling dominates for stars that formed in the Early-Disk Era (age , when post-formation heating was flat with age, and (3) post-formation heating strongly dominates for stars that formed in the Pre-Disk Era (age ). Overall, post-formation dynamical heating only dominates the current dispersion for stars that formed Gyr before the disk started to form, or, equivalently, the stellar velocity dispersion at present is primary inherited at formation and not from post-formation dynamical heating for stars younger than .
Our results agree with Yu et al. (2022), who also analyzed these FIRE-2 galaxies and found that most stars currently on ‘thin-disk-like’, ‘thick-disk-like’, or ‘spheroid-like’ orbits were born that way, that is, the type of orbit a star is currently on primarily reflects its formation orbit, not its post-formation evolution.
3.5 Effective Rate of Post-formation Heating
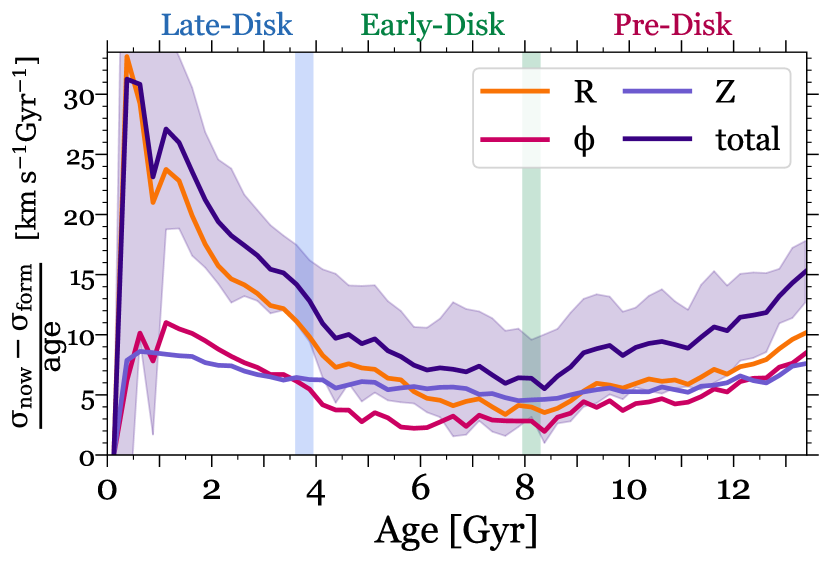
Stars that formed in the Pre-Disk Era have the most dispersion added post-formation, as Figure 5 (top) shows. One might assume (naively) that the amount of heating simply scales with age, because older stars have had more time to be heated. However, Figure 5 (top) showed that the amount of post-formation heating does not necessarily increase with age across all eras. For example, stars old have experienced the same absolute amount of post-formation heating as stars old. To provide more insight, we examine the ‘effective’ rate that stars today experienced post-formation heating, on average, via . This quantity is not the actual instantaneous rate of increase in dispersion. Rather, it represents the time-averaged, overall rate at which the dispersion increased since formation. Thus, one can think of this effective rate as the amount of post-formation heating normalized to the stellar populations’ age.
Figure 6 shows this effective rate versus stellar age, for radial, vertical, azimuthal, and total dispersions. First, we focus on the total dispersion: . The youngest stars experienced the largest effective rate of increase, which rapidly decreases with age for stars that formed during the Late-Disk Era. For stars that formed in the Early-Disk Era, the effective rate was low, reaching a minimum near the transition to the Pre-Disk Era. This strong age dependence implies that, for stars that formed in a disk, most dynamical heating occurred shortly after birth, and their heating rate slowed as they became progressively dynamically hotter (excepting the vertical component). By contrast, stars that formed in the Pre-Disk Era had effective rates of heating that increase with age, likely because more dramatic, galaxy-wide, non-equilibrium perturbations like mergers and accretion, starbursts, and galactic winds, were more prominent. The number of these perturbation events that stars in the Pre-Disk era experienced increases with stellar age, such that the oldest stars have experienced the most cumulative heating.
Furthermore, for stars that formed in the Late-Disk Era, the increase in strongly dominates over the other components, so radial heating dominates the total heating. For example, the youngest stars have effective rates near 10 km/s/Gyr for and , but above 30 km/s/Gyr for , which may indicate that heating by spiral arms and/or bars dominates most early heating for stars forming in the Late-Disk Era. However, the effective radial rate decreases with age while the other components remain more constant. Thus, stars that formed in the Early- and Pre-Disk Eras have nearly identical rates for all components of , indicating that heating was more isotropic in the early galaxy. Thus, post-formation heating operated differently over cosmic time. Any model of post-formation heating thus should treat early cosmic times (prior to the initial formation of the disk) and later cosmic times (after the formation of the disk) separately.
3.6 Disk Kinematics versus Galaxy Mass
So far, we showed trends averaged across our 11 galaxies that are similar to the MW in stellar mass. Now, we analyze all 14 galaxies in our sample individually, including the lower-mass m12r, m12z, and Juliet to expand the mass range (see Table 1 for details).
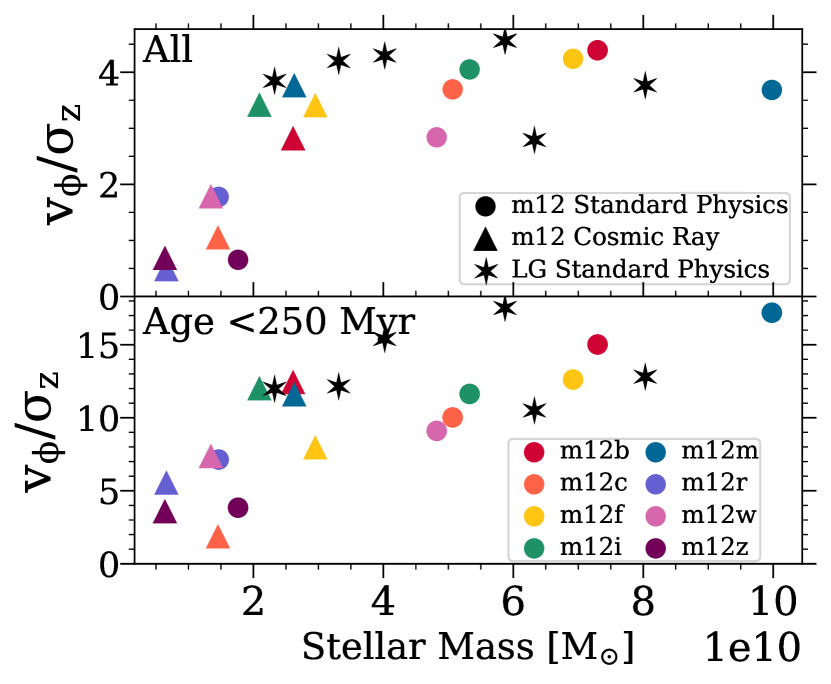
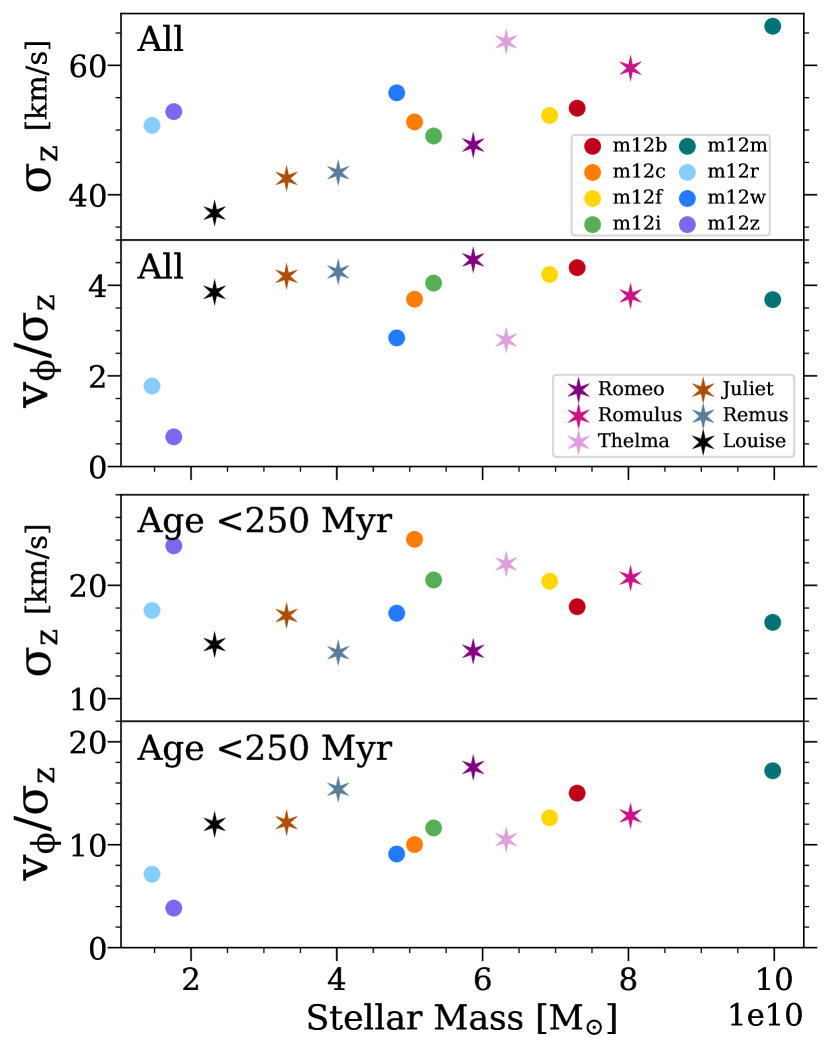
Figure 7 shows how stellar kinematics depend on the current stellar mass (within ) of a galaxy. We focus on and , as before. Although we do not show it, increases strongly with stellar mass, which follows from the deeper gravitational potential of more massive galaxies (see also Hopkins et al., 2023). We show the isolated galaxies from the Latte suite as circles and the galaxies in LG-like pairs from the ELVIS on FIRE suite as stars.
Figure 7 (top panels) shows (top row) and (second row), for stars of all ages. If we exclude the two lowest-mass galaxies, m12r and m12z, whose disks have yet to or have just begun to settle, increases with stellar mass. This trend is remarkably strong among LG-like galaxies, with the exception of Thelma, which underwent the most major mergers and has a higher than galaxies of similar or higher mass. Unlike , of all stars does not depend on mass at . Although we do not show it, we performed an identical analysis for and and found similar trends.
On average, galaxies in LG-like pairs have lower dispersions and more rotational support than isolated galaxies. These colder kinematics likely relates to their more extended disk sizes at present: LG-like galaxies have larger than isolated galaxies for all stars and larger among stars younger than 250 Myr (Garrison-Kimmel et al., 2018; Bellardini et al., 2022). These larger sizes likely relate to these galaxies transitioning to the Early-Disk Era earlier than our isolated galaxies, on average, as we show below.
Figure 7 (middle panels) shows the same but for stars younger than 250 Myr, which reflects the current dynamical state of the ISM and star formation, less affected by the galaxy’s integrated merger and heating histories. Now, does not depend on stellar mass, while increases modestly with stellar mass, which implies that more massive galaxies have more vertically settled gas disks.
Figure 7 (bottom panels) shows the same but for of young stars, which exhibits broadly similar trends as each component: does not depend much on stellar mass while increases moderately, although weaker than for . Thus, a galaxy’s stellar mass has little effect on the current velocity dispersion of young stars in the solar annulus and at most a modest effect on , for the masses we explore.
3.7 Comparisons with observations
Thus far, we have focused on our galaxies’ disk-wide kinematics, that is, the median velocities and dispersions for all stars (in a given age bin) within our simulated ‘solar annulus’ of and at . However, observational measurements of nearby external galaxies typically measure kinematics in smaller-scale ‘patches’ and then average over these spatial patches to discuss trends with age within the galaxy. Similarly, most published dispersion values for the MW are for stars within one ‘patch’ – the solar neighborhood. We now examine how the type of measurement – ‘disk-wide’ or ‘local’ – impacts our measured velocity dispersions.
We measure a local velocity dispersion within annular bins of side length 150 pc, motivated by the typical ALMA-resolution scale for nearby galaxies, and then we compute the average across the annulus at a given radius. For more context of our results on velocity dispersions of young stars, we also determine the local dispersions of cold and dense gas, and , as a proxy for molecular gas, following Orr et al. (2018).
Figure 8 shows the average vertical (top) and total (bottom) dispersion of cold dense gas at present (left) and young (age < 250 Myr) stars at formation (right), averaged our 14 galaxies, for both local dispersions (light blue) and disk-wide dispersions (magenta). Our disk-wide dispersions use the same geometric selection as all of our previous analyses, while our local dispersions are the annulus-averaged dispersion in patches of side length 150 pc centered at . However, for the local dispersion of cold gas, we instead average between the dispersion within annuli centered at and (corresponding to 1/3 and 2/3 of our observational radial range), to match the radial range of the PHANGS observations we compare against (see below). Velocity dispersions in cold gas at are of those at in our simulations.
As the results for (top) show, FIRE-2 galaxies have 1D local velocity dispersions in cold gas of at (as shown, and at not shown) – much lower than the typical disk-wide dispersions in our previous results. We compare against ALMA-measured dispersions of molecular gas CO(2–1) on scales in PHANGS galaxies from Sun et al. (2020), where we restrict the observed sample to the 19 galaxies that also have resolved stellar kinematics in Pessa et al. (2023). We include only gas observations within , and we measure the local dispersion of cold gas in our FIRE-2 galaxies at concordant radii ( and ). We measure the mean for each PHANGS galaxy and assume isotropy to convert to a 3D . Figure 8 (bottom left) shows the PHANGS-ALMA sample’s full range of mean as a shaded light-blue region and scatter in darker blue. Although our FIRE-2 galaxies have local velocity dispersions in cold gas somewhat higher than typical in PHANGS, all of our FIRE-2 galaxies fall within the observed range. While a rigorous comparison would require synthetic CO observations, our comparison here indicates that velocity dispersions in cold gas are broadly consistent with those of molecular gas in nearby galaxies.
Most importantly, Figure 8 shows that the dispersion of cold gas in our simulations is significantly larger ( times) if we measure it disk-wide rather than locally. Similarly, stars at formation have disk-wide and that are times larger than their local values at . These values broadly agree with those from Orr et al. (2020) ( km/s), who examined the spatially-resolved dispersion of neutral gas in 7 of our isolated (m12) simulations. This motivates the need to use local velocity dispersions to compare against spatially-resolved observations of nearby galaxies.
Finally, the local and for young stars at formation are 1.5 and 1.9 times larger, respectively, than cold gas (at ). On the other hand, young stars at formation have a disk-wide that is about the same as cold dense gas, while the disk-wide is lower for stars at formation than cold dense gas. The higher local dispersion for stars than cold gas is expected, given that we measure them typically after formation. However, the weaker (and even negative) change from cold gas to stars at formation for the disk-wide dispersion suggests that rapid dynamical heating has less of an effect on the galaxy-wide dispersion, which may be more influenced by spiral arms, warps, etc. We defer a more detailed investigation to future work.
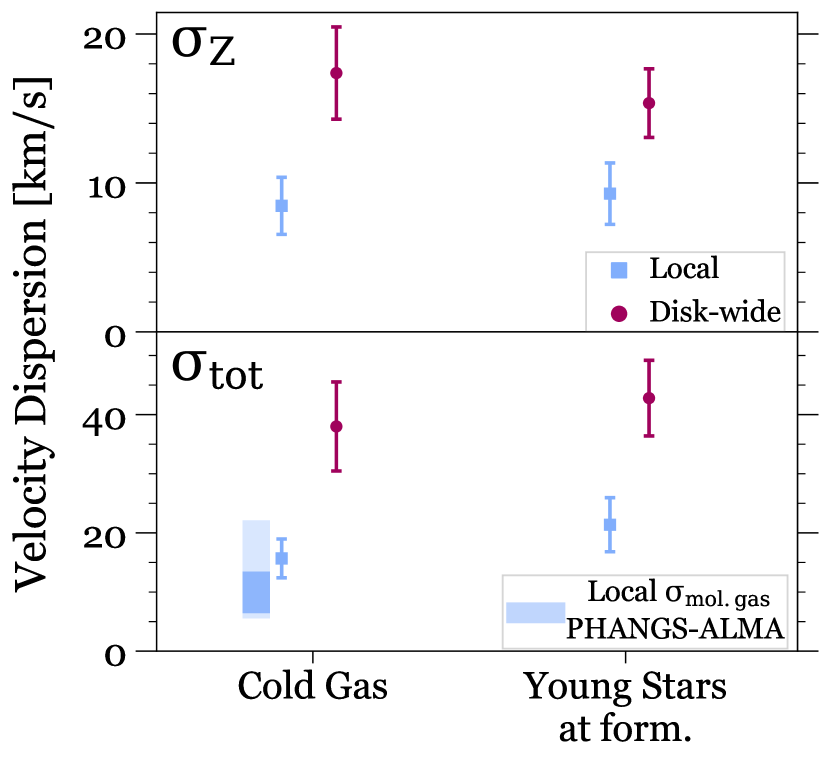
Figure 7 showed that the disk-wide vertical velocity dispersion of young stars in FIRE-2 galaxies is higher than the MW’s (Nordström et al., 2004; Casagrande et al., 2011; Anders et al., 2023). However, there are key differences in the spatial scales over which we measured our dispersions in Figure 7 versus the scales used for MW observations. Given the non-trivial differences between the disk-wide and local velocity dispersions shown in Figure 8, we now revisit our previous comparison between galaxy kinematics and stellar mass from Figure 7, and now include observed values from the MW and nearby galaxies. This more detailed comparison between stellar kinematics in our simulations, in the MW, and in nearby galaxies is especially important, because detailed MW observations lay the bedrock for much of our understanding of disk formation and dynamical heating. However, the MW is only one galaxy, and it remains unclear how representative the MW is of similarly-massive galaxies.
For these comparisons, we compute the average local velocity dispersion of our galaxies, as opposed to the disk-wide dispersion of our previous results. Specifically, motivated by the typical measurement scales of the observations that we compare against here, we measure the ‘local’ velocity dispersion within annular bins centered at 8 kpc and then compute the average across the annulus.
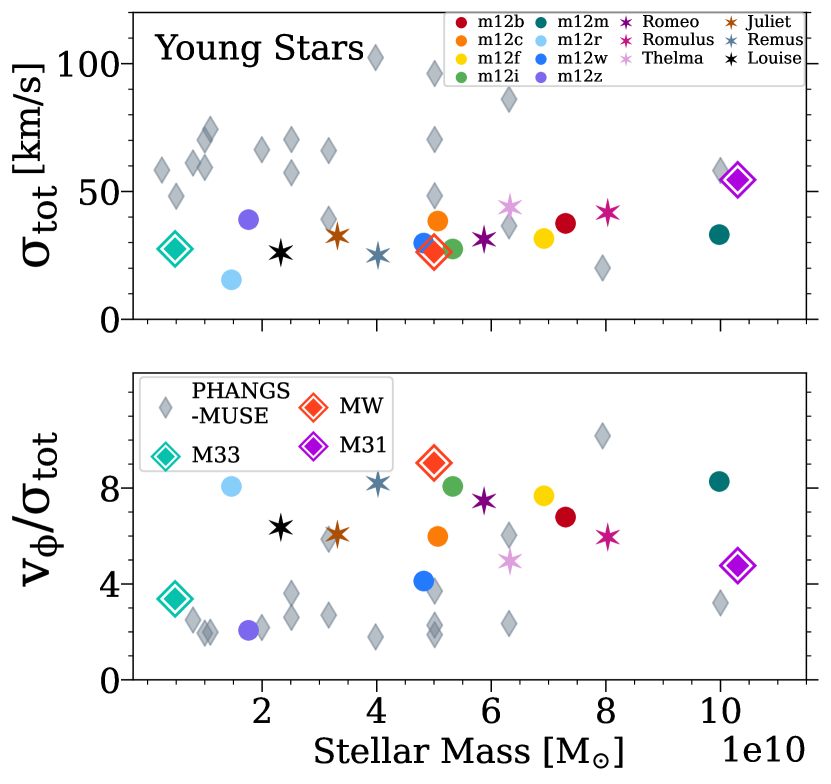
Figure 9 shows the local (top) and (bottom) for young (age < 100 Myr) stars versus stellar mass. We also show the observed velocity dispersion of young stars from Casagrande et al. (2011) for the MW, Dorman et al. (2015) for M31 (Andromeda), Quirk et al. (2022) for M33 (Triangulum), and Pessa et al. (2023) for 19 galaxies from PHANGS-MUSE. We show velocity dispersions for only young stars; in McCluskey et al. (in prep.), we will pursue a more rigorous comparison of the full relation between velocity dispersion and age using mock observations.
An important caveat is that each of these observational works measured stellar populations and velocity dispersions somewhat differently. In particular, while measurements of M31, M33, and the MW used individual stars, PHANGS-MUSE measurements used the integrated spectra from regions of size , which may include some contribution from older stars, leading to larger velocity dispersions. Nonetheless, the larger sample from PHANGS-MUSE provides important statistical context for both our simulations and the Local Group. M31 and M33 observations measure resolved stars in multiple apertures of radius and 350 pc, respectively, while the MW measurement includes stars within 60 pc of the Sun, so this represents only a single region of the MW. As a compromise to matching all of these works, and to limit numerical noise in our simulations, we use an intermediate aperture of diameter 250 pc (unlike in Figure 8, where we used smaller 150 pc patches to better match ALMA’s resolution). Using a larger region in our simulations increases the measured dispersion, but this effect is minimal for regions .
Moreover, we show the youngest stellar population from each work, but their age binning varies: the average age is 100 Myr for the MW, 30 Myr for M31, 80 Myr for M33, and 100 Myr for PHANGS-MUSE. Therefore, for this comparison only, we measure stars in our simulations today younger than 100 Myr. This reasonably matches the MW and PHANGS-MUSE, but these younger stars in M31 and M33 may have undergone somewhat less post-formation heating than in the MW, PHANGS-MUSE, or our simulations.
Finally, full 3D kinematics are available only for the MW: measurements of M31, M33, and the PHANGS-MUSE sample are limited to line-of-sight dispersions, . To estimate a total 3D dispersion, we assume isotropy, such that , given the wide variety of observed inclination angles across these observations. This is a simplification, given that our simulated galaxies show that is not isotropic, with > > . As such, our assumption may underestimate the total dispersion of galaxies observed with smaller inclinations (more face-on), including the PHANGS-MUSE sample, which generally has inclinations , while our assumption likely overestimates the total dispersion of highly-inclined galaxies, such as M31 at .
Our 14 FIRE-2 galaxies have an average local for young stars, with isolated and LG-like galaxies exhibiting similar values, on average. While our average is slightly higher than the MW and M33’s values of 26.3 and 27.5 km/s, it is considerably lower than M31’s value of 55 km/s. However, the local total velocity dispersion of young stars shows a slight increase with galaxy mass, unlike the disk-wide vertical dispersion in Figure 7. In turn, the high dispersion of M31 is likely (at least in part) because of its higher stellar mass. We emphasize that MW’s value of is lower than all but 1 of the 21 galaxies in this PHANGS-MUSE sample. That said, 5 of our galaxies exhibit dispersions within 5 km/s of the MW’s value, while 9 lie within 10 km/s, and 3, the fairly low-mass m12r, Remus, and Louise, have even lower dispersions than the MW at 15.5, 25.0, and 26.1 km/s, respectively.
Sanderson et al. 2020 (Figure 2) also compared three FIRE-2 galaxies—m12i, m12f, m12m—against observations of the MW and M31; but for M31, they compared the disk-wide total (3D) dispersion in FIRE-2 against just the local line-of-sight (1D) dispersion of M31. Therefore, our comparison is more accurate and shows better agreement between FIRE-2 and the MW and M31.
Figure 9 (bottom) compares , which is a better, dimensionless metric of ‘diskiness’ and the degree of rotational support. For each of the PHANGS-MUSE galaxies, we use their maximum in Lang et al. (2020), which they determined using PHANGS-ALMA measurements of CO (2–1) emission. We note that Lang et al. (2020) do not include values for 3 of the PHANGS galaxies; as such, we do not show these 3 galaxies in the bottom panel. As above, we emphasize that this observational compilation shows that young stars in the MW are kinematically colder, in terms of both and , than those in all but 1 of 21 nearby galaxies, including M31 and M33. Specifically, young stars in the MW have 9, while M31, M33, and the average PHANGS galaxy have values of 4.8, 3.4, and 3.4. In turn, this initial comparison indicates that the MW is a kinematic outlier compared to similar-mass nearby galaxies; however, we will test this hypothesis more rigorously in McCluskey et al. (in prep.).
Secondly, young stars in FIRE-2 galaxies show a range of that is consistent with the range of the observed sample: all FIRE-2 galaxies reside within the observed range. The average of FIRE-2 is 6.4, with LG-like and isolated galaxies having similar values. If anything, the typical FIRE-2 galaxy is kinematically colder than M31, M33, and the typical galaxy in PHANGS-MUSE. Although none of the FIRE-2 galaxies have quite as high as the MW’s value ( 9), two galaxies, Remus and m12m, are within 10% of the MW’s value, at 8.3 and 8.2, respectively. Thus, this tentative comparison indicates that young stars in FIRE-2 have statistically realistic/representative values of and , provided we measure both on spatial scales comparable to those of observations.
3.8 Time of disk onset
Galaxies transitioned from their Pre-Disk to their Early-Disk Era at their ‘time of disk onset’, which marks the start of the continuous process of disk settling. Most of our galaxies transitioned ago, although Romeo transitioned particularly early, ago. We now examine the time of disk onset across our sample, including how it relates to a galaxy’s stellar kinematics today. We also reiterate that unlike in the previous subsection, all values are now disk-wide quantities, just as in the first 6 subsections of our Results.
We defined the transition to the Early-Disk Era as when all stellar populations that formed after this time had . Of course, measured today can differ from its formation value. To examine how transition times derived using present-day kinematics compare to our fiducial formation-based times, we also measure the age when permanently exceeds 1. Furthermore, we show that evolved somewhat differently post-formation than the other components, so we additionally test this by also finding the oldest age after which permanently exceeds , under the simplifying (and in detail incorrect) approximation of isotropy. For all of these metrics, we tested a range of threshold values, and while this shifts the exact lookback time that a galaxy transitioned, it has little effect on the relative ordering within our sample, which is our primary metric of interest. We also tested transition times determined using only (at both formation and present-day) and found that they broadly agree with our derived times, differing by for thresholds above 100 km/s. However, we limit our analysis to -based metrics, because, unlike alone, is dimensionless, largely independent of galaxy stellar mass in this mass range, and has a logical threshold ().
In summary, we use three thresholds to measure the time of disk onset that defines the transition from the Pre-Disk to Early-Disk Era:
-
•
at formation
-
•
as measured today
-
•
as measured today
Table 1 lists the lookback times/ages of disk onset for each galaxy.
These three metrics give times within of each other for most galaxies. Times based on and agree best with each other. Thus, the present vertical and total kinematics of stars provide similar insights into the disk’s formation. However, lookback times from the kinematics at formation are generally earlier, because dynamical heating tends to decrease of stars post-formation. A few galaxies yield substantially different times for different metrics. Notably, formation kinematics indicate that m12r transitioned 5.9 Gyr ago, while current kinematics indicate that it settled only 0.26 Gyr ago, because m12r experienced a merger with an LMC-mass galaxy ago, which significantly heated existing stars. This lends caution to using present-day kinematics to infer the exact timing of events in a galaxy’s formation history.
As Figure 2 shows, once our galaxies transitioned to the Early-Disk Era, their stars formed on progressively cooler orbits as the disk continuously settled. If, after the time of disk onset, grew at a broadly similar rate in each galaxy, then galaxies that had earlier times of disk onset would have higher today, simply from having more time to settle.
Figure 10 tests this idea, showing the time of disk onset versus of stars younger than 250 Myr for our 14 galaxies. The three rows show our three thresholds in for the onset of disk settling, which all show similar trends. We show isolated galaxies as circles and galaxies in LG-like pairs as stars, as in Figure 7. Figure 10 shows that the time of disk onset was ago () for the majority of our galaxies, although Romeo (see Section 3.2) has the earliest time of disk onset, Gyr ago ().
Figure 10 shows that galaxies that experienced earlier disk onset have young stars (age < 250 Myr) with larger today, that is, currently form stars on dynamically cooler orbits. While we do not show it, we find similarly strong correlation between the time of disk onset and the average and for both all and young stars. Table 2 lists the Pearson correlation coefficients, which are close to 0.9, and their corresponding p-values, which are , indicating a strong correlation. We find similar results using instead the Spearman rank coefficients.
We also examined correlations with other galaxy properties. Surprisingly, the time of disk onset does not correlate much with the galaxy’s current stellar mass, within our sample. It also does not correlate with any component of , for either all or young stars. However, the time of disk onset does correlate with the median of all or young stars, with Pearson coefficients ranging between 0.75 and 0.85 for all stars and 0.73 and 0.80 for young stars. Despite the lack of correlation with , each threshold has its highest correlations with , not with alone, further supporting that is a more fundamental (and dimensionless) metric than to compare different galaxies’ formation histories.
The strong correlation with the of young stars today is particularly striking, considering it only moderately correlates with of young stars. This correlation implies that, after disk onset, these disks settled at relatively similar rates, in order to preserve rank ordering. In particular, after disk onset, mergers and internal processes tend not to significantly alter the overall Hubble-time-averaged rate of disk settling.
In general, galaxies in LG-like pairs experienced earlier disk onset than isolated galaxies. This follows from Section 3.6, where LG-like galaxies had lower disk-wide and higher disk-wide than isolated galaxies of similar (current) stellar mass, consistent with their larger radii (Bellardini et al., 2022). The earlier settling times for galaxies in LG-like environments follows from the fact that such galaxies assemble (form stars) earlier than those in isolated environments, which in turn follows from the fact that their dark-matter halos formed earlier (Garrison-Kimmel et al., 2019; Santistevan et al., 2020). Thus, galaxies in LG-like environments, despite ending up at similar stellar mass today as galaxies in isolated environments, formed stars earlier, their disks started to settle earlier, and their disks are radially larger and dynamically cooler today.
This dependence on LG environment provides important insight into the assembly history of the MW (and M31) compared with other galaxies of similar mass today. As discussed in Section 3.7, young stars in the MW are dynamically colder than those in other nearby galaxies. If we naively extrapolate and place the MW’s (local) along the relation in Figure 10, the trends within our simulated sample indicate that the MW disk began to settle earlier than our galaxies’ disks ( ago). Remarkably, this simple extrapolation agrees with recent estimates of the age of the MW’s thick disk: recent works argue that its coherent rotation may have begun ago (Conroy et al., 2022; Xiang & Rix, 2022). We postulate that this dependence on LG environment provides critical insight into this seemingly early assembly of the MW.
| metric | ||||
|---|---|---|---|---|
| corr. coeff. (p-value) | corr. coeff. (p-value) | corr. coeff. (p-value) | corr. coeff. (p-value) | |
| ) | ) | ) | ) | |
| ) | ) | ) | ) | |
| ) | ) | ) | ) | |
| ) |
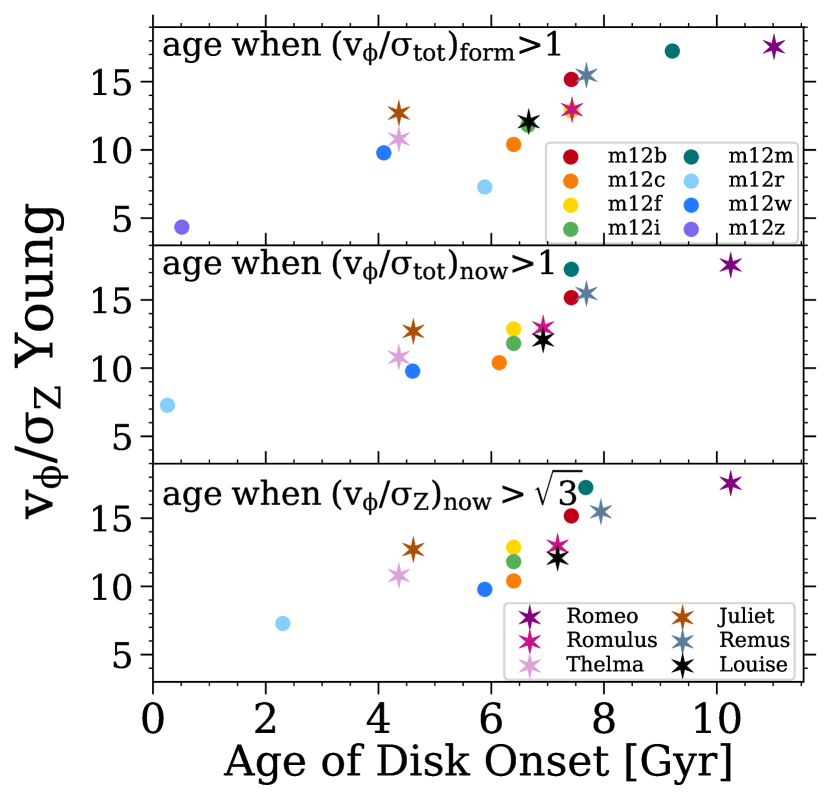
4 Summary and Discussion
4.1 Summary of Results
We summarize the main results from our analysis of stellar disks across the formation histories of 14 MW-mass galaxies from the FIRE-2 simulations. Most importantly, the kinematics of stars today do not simply reflect their kinematics at formation, but neither do they simply reflect post-formation dynamical heating; both processes are important. In particular, although the present-day dispersion of stars, , increases monotonically with age, does not.
We identified Three Eras of Disk Formation, when stars formed with different kinematics and experienced different degrees of post-formation dynamical heating:
1) Pre-Disk Era (typically ago): stars formed on dispersion-dominated orbits, with and . increased over time, reflecting the deepening of the gravitational potential. Thus, the oldest stars formed with the lowest dispersion. However, present-day dynamics versus stellar age do not reflect this trend: increases monotonically with age, meaning that the oldest stars now have the highest dispersion. Thus, post-formation dynamical heating is most important during this era. Furthermore, the typical , so the oldest stars often have been ‘spun up’ since formation. As a result of both of these trends, remains below 1, similar to formation.
2) Early-Disk Era (typically ago): began at the time of disk onset, when and grew rapidly, and it ended when the growth of slowed significantly. Similarly, peaked at the start of this era, and it decreased steadily throughout, reaching a minimum by the era’s end. The amount of dispersion added by post-formation heating was constant with age throughout this era, so the slope of with age is unchanged from that at formation. The majority of for these stars was in place at formation, not added via post-formation dynamical heating.
3) Late-Disk Era (typically ago): began when the growth of slowed. Stars formed with nearly constant . increases monotonically with age, because post-formation dynamical heating increases with age, and the oldest stars in this era have with an equal contribution from post-formation heating and formation.
We examined the evolution of the three different components of velocity. At formation, for all ages. Remarkably, across all eras and ages, the relative amount in each component is relatively unchanged. At present, continues to dominate at all ages, but for stars that formed in the Early- and Pre-Disk Eras (ages ). Post-formation dynamical heating primarily increased at ages but acted nearly isotropically for older stars.
We examined the dependence of stellar kinematics on galaxy stellar mass. of all stars increases with galaxy stellar mass, but of all stars is nearly constant. Young stars (age < 250 Myr) exhibit opposite trends: is independent of mass, while increases with mass.
We compared disk-wide and local () velocity dispersions for cold gas and young stars at formation: local dispersions are 3 times lower than disk-wide dispersions for cold gas and 2 times lower for stars at formation. Thus, the velocity dispersion strongly depends on the spatial scale measured over, which is critical for observational comparisons.
We compared locally-measured kinematics in our 14 simulated galaxies to those observed in 3 Local Group galaxies and nearby star-forming galaxies, compiling measurements of and for young stars (age ) in the MW, M31, M33, and 19 galaxies from PHANGS-MUSE. The MW is significantly kinematically colder than both M31 and M33, and all but one of the PHANGS galaxies. For young stars, all of our simulations show broad agreement with observations, with 3 of our galaxies even exhibiting lower locally-measured than the MW.
We quantified the time of disk onset, the lookback time that each galaxy’s disk began to settle, using thresholds in , measured both today and at formation. The degree of rotational support of young stars today correlates strongly with the time of disk onset: earlier-settling galaxies currently form colder disks. Most of our galaxies began to settle ago, with galaxies in LG-like environments generally starting to settle earlier than isolated galaxies. Romeo, a galaxy in a LG-like pair, began to settle the earliest, ago, likely the closest to the MW.
In Appendix C, we examine the impact of including self-consistent cosmic-ray injection/transport from stars, assuming a constant diffusion coefficient, which in the FIRE-2 simulations leads to galaxies with lower stellar masses, lower rotational velocities, and lower dispersions. Overall, the inclusion of cosmic rays does not significantly change at a given stellar mass.
4.2 Discussion
4.2.1 Caveats
We first discuss key limitations and caveats to our analysis of 14 MW-mass galaxies from the FIRE-2 simulations.
First, we reiterate the selection function of our simulated sample. We selected isolated or LG-like paired dark-matter halos from dark-matter-only simulations at with , with no additional selection based on galaxy properties or merger/formation history, etc. Thus, we did not choose our galaxies specifically to be analogues of the MW (or M31 or M33). As such, our galaxy-averaged results represent randomly sampled formation histories of MW-mass galaxies, which should fairly sample the cosmological scatter in formation histories.
Second, these FIRE-2 simulations do not model all of the physics that may be relevant for disk formation, in particular, AGN feedback from black holes. The degree to which AGN may impact stellar dynamics in the solar annuli of MW-mass galaxies (which in this work we define as and ) is unclear. While AGN feedback is likely most crucial for more massive galaxies and most significantly alters stellar dynamics in the galaxy’s innermost regions (Dubois et al., 2013; Weinberger et al., 2017; Mercedes-Feliz et al., 2023; Wellons et al., 2023), growing evidence from simulations indicates that AGN can both directly and indirectly effect the kinematic and structural properties of MW-mass and low-mass galaxies (Dashyan et al., 2018; Koudmani et al., 2021; Irodotou et al., 2022). For example, Grand et al. (2017) found that the primary effect of AGN in MW-mass galaxies was to suppress central star formation, which in turn prevents the formation of overly massive bulges. Indeed, Grand et al. (2017) found that a simulation of a MW-mass galaxy reran from without AGN feedback had a smaller fraction of stars on disc-like orbits (defined as having orbital circularities > 0.7), more dominant bulges, and enhanced star formation in the outer disk leading to a more extended disk component compared with versions ran with AGN feedback.
Additionally, our analysis of birth kinematics has limitations. We determined a star particle’s position and velocity relative to the galaxy’s major axes, which are stable and well-defined at present, but not necessarily at earlier times, when accretion and mergers were more significant and even the notion of a single main galaxy progenitor can be ill-defined (Wechsler et al., 2002; Giocoli et al., 2007; Santistevan et al., 2020). Thus, cleanly separating the , , and components is difficult at early times. However, all components of the dispersion at formation display similar trends as , which is independent of the axes’ determination, implying that this limitation’s impact on our overall qualitative results is likely minor.
Furthermore, as we discussed in Section 2.2, our simulations store snapshots every , so our star ‘formation’ properties include this additional of post-formation dynamical evolution, on average. This early heating can be significant: using an idealized simulation of an isolated MW-like galaxy with sub-parsec resolution (0.05 pc), Renaud et al. (2013) found that stars that formed with were heated to in just 10 Myr. Similarly, our Figure 6 shows that most rapidly increased post-formation by in . We tested if this early evolution could change our conclusions about the relative importance of ‘formation’ dispersion versus post-formation heating. For stars younger than 10 Gyr, for all but old stars, meaning that post-formation heating is less than 95% of their . If we assume that stars were heated at the same effective rate as the youngest stars in Figure 6 for , our revised still remains below 1.95 for the same ages. Even if we assume an initial effective heating rate that is larger, remains less than 2 for the same ages. Thus, our results about the relative importance of post-formation heating remain unchanged.
Lastly, our analysis did not account for uncertainties in stellar age. Stellar ages are difficult to measure accurately, and uncertainties on stellar ages for large populations are generally (for example Soderblom, 2010), though the synergy of astrometric and spectroscopic surveys with asteroseismological data has driven tremendous progress in the past decade (for example Silva Aguirre et al., 2018; Mackereth et al., 2019b). Previous works showed that the inclusion of observationally-motivated age uncertainties of 20 - 30% in simulations can (1) obscure features from mergers in the age-velocity dispersion relationship (Martig et al., 2014; Buck et al., 2020), and (2) decrease inferred exponential heating rates via the ‘smearing’ of age bins (Aumer et al., 2016). In McCluskey et al. ( in prep.) we will examine the kinematic trends of our simulations versus age at , incorporating realistic age uncertainties, which will allow us to compare to observational trends in much more detail.
4.2.2 Disk galaxy formation in FIRE simulations
As we discussed in the Introduction, our work builds upon a series of analyses of FIRE simulations that studied the formation histories of MW-mass galaxies, in particular, the co-evolution of their stellar and gaseous dynamics, morphology, star formation burstiness, metallicity spatial variations, and virialization of the inner CGM (Ma et al., 2017; Garrison-Kimmel et al., 2018; Yu et al., 2021; Stern et al., 2021; Bellardini et al., 2022; Gurvich et al., 2023; Hafen et al., 2022; Trapp et al., 2022; Yu et al., 2022; Hopkins et al., 2023). We further quantified the notion that MW-mass disk galaxy formation occurred in distinct phases, showing that stellar kinematics, both at formation and at present, follow broadly contemporaneous evolutionary phases.
In particular, what we define as the transition from the Early-Disk to the Late-Disk Era coincides with the virialization of the inner CGM (Stern et al., 2021), the transition from bursty to steady star formation (Yu et al., 2021), and a transformation in the energetics and angular momentum of both accreted gas (Hafen et al., 2022) and the ISM (Gurvich et al., 2023). During this stage of steady star formation in the Late-Disk Era, was low and constant, with the gas turbulence reaching a floor maintained by the thermal and turbulent pressure of the warm neutral/ionized medium (for example Leroy et al., 2008), stellar feedback, and spiral arms.
Yu et al. (2021) quantified the lookback time that star-formation transitioned from bursty to steady – the ‘burst time’ or – for 12 of the 14 galaxies that we analyze. Table 1 lists each galaxy’s from Yu et al. (2021). The transition to steady star formation typically occurred after our ‘time of disk onset’, when stellar . Nominally, this implies that star formation remained bursty for a while during the Early-Disk Era, in agreement with our finding that remained high (but declining) throughout this era. However, our times of disk onset are based on stellar dynamics within the solar annulus today ( and ) and only moderately correlate with , having Spearman coefficients between . By contrast, Yu et al. (2021) included all stars that formed within 20 kpc physical of the galactic center. If instead we extend our radial range to , this yields times that (1) are on average 1.2 Gyr later than our original times, because of the hotter kinematics of the inner region, and (2) more strongly correlate with , with Spearman coefficients between 0.94 and 0.96 for our three dynamical thresholds. Thus, these estimates for when a galaxy’s disk began to form/settle can depend on the selection of stars today, with stars in the solar neighborhood yielding earlier settling times. We will investigate radial trends in these simulations in future work.
Using the same FIRE-2 simulations, Yu et al. (2022) argued that they can subdivide their bursty star-formation era into two eras: an early bursty and chaotic phase, when stars formed with irregular morphology, and a subsequent bursty phase when stars formed with disky morphology. These bursty star-formation eras generally correspond to our Pre-Disk and Early-Disk eras. Yu et al. (2022) also studied how both the birth and present-day orbits of stars reflect the era when they formed, classifying stars as belonging to the thin-disc, thick-disc, and isotropic spheroid based on their orbital circularity at both formation and at . They found that, in general, a star’s orbital classification at formation reflects the era in which it formed: stars primarily formed on isotropic spheroid orbits in the early bursty star-formation phase, thick-disc orbits in the later bursty star-formation phase, and thin-disc orbits in the steady star-formation phase. However, Yu et al. (2022) noted that this is not a one-to-one mapping: of stars that formed with thin-disc orbits now have thick-disc orbits, while a similar fraction of stars that formed with thick-disc orbits now have isotropic spheroid orbits. Furthermore, the fraction of stars that were born ‘thin’ but are now ‘thick’ increases with age. Our results agree with theirs, and we further quantify the degree of post-formation heating/perturbations that stars experienced.
4.2.3 Comparison to other cosmological zoom-in simulations
Various works have used different cosmological zoom-in simulations to study the formation histories of MW-mass galaxies (for example Bird et al., 2012; Brook et al., 2012; Martig et al., 2014; Grand et al., 2016; Buck et al., 2020; Agertz et al., 2021; Bird et al., 2021). Across a wide range of different numerical implementations of hydrodynamics, star formation, and feedback, cosmological simulations consistently agree that the dynamical history of a MW-mass disk arises from both cosmological disk settling and post-formation dynamical heating; one cannot neglect one or the other. As we discuss below, most current-generation zoom-in simulations of MW-mass galaxies also broadly agree in both the typical disk-wide velocity dispersion of young stars at and the shape/magnitude of the stellar age dependence, as measured today.
Our results agree with the VINTERGARTEN simulation (Agertz et al., 2021), which used the same initial conditions as m12i but simulated with the adaptive mesh refinement code RAMSES (Teyssier, 2002). Their versus age (Figure 14 of Agertz et al., 2021) is nearly identical to ours for m12i, both in value and shape: both of our simulations show near exponential increases in with age for stars younger than 6 Gyr and a jump at 6 Gyr. Our results also agree well with the NIHAO-UHD suite (Buck et al., 2020): their 5 galaxies, which span , have for young stars, and for stars 12 Gyr old, similar to ours. Any difference in the exact age dependence of each galaxy’s dispersion follows from its unique formation history.
Grand et al. (2016) analyzed 16 MW-mass galaxies from the Auriga simulations, also finding broadly similar disk-wide and as we do. Similarly to FIRE, NIHAO-UHD, and VINTERGARTEN, Auriga simulations have typical disk-wide . They also concluded that cosmological disk settling was generally the primary effect that set the relation between the velocity dispersion and the age of stars today. However, Grand et al. (2016) found that bars were the strongest contributor to vertical dynamical heating. This seemingly contradicts our results, because stars in all of our galaxies had significant post-formation increases to their disk-wide , including stars in unbarred or weakly-barred galaxies. Furthermore, even our galaxies that do house significant bars near (such as m12m) did not at early times, and our results indicate that heating is most significant for stars that formed in the Pre-Disk Era. Although we do not study the effect of bars in this work, Ansar et al., (in prep.) quantifies the incidence of bars in the FIRE-2 simulations, and in future work we will address the drivers of dynamical heating in our simulations, including bars. While it is possible that the bar heated these old stars more recently, bars most likely do not heat only old stars.
Our results may differ from those of Grand et al. (2016) because of numerical differences. First, Auriga uses the subgrid model from Springel & Hernquist (2003), treating the ISM as a two-phase medium with an effective equation of state that inhibits the formation of dense gas, so that star formation occurs at much lower density, cm-3, compared with cm-3 in FIRE-2. House et al. (2011) found that low thresholds in density impose a dispersion ‘floor’ in , even in high-resolution simulations (50 pc), because stars form from higher-temperature gas. House et al. (2011) find that this floor effectively goes away if one increases the star-formation threshold from to 1000 cm-3 (see also Martig et al., 2014; Kumamoto et al., 2017). That said, given that Grand et al. (2016) find that decreases over time, this dispersion ‘floor’ may have little effect on their results.
Second, certain mechanisms that induce dynamical heating in our simulations may be different (and less significant) in the Auriga simulations. The simulations in Grand et al. (2016) had baryonic mass resolution of , times larger than ours, and they used lower spatial resolution, with gravitational force softenings of 375 pc physical for stars and gas (which is comparable to the thin-disk scale height of the MW), while our FIRE-2 simulations use pc for star particles and pc minimum and pc ISM-averaged for gas cells. Thus, Auriga simulations do not resolve the dense ISM, including important dynamical structures like GMCs that likely heat stars particles after their formation in FIRE. Furthermore, the modeling of stellar feedback in Auriga is markedly different: supernovae launch ‘wind particles’ that are temporarily decoupled from the hydrodynamics until the particle encounters sufficiently low-density gas, which does not couple that feedback directly to dense gas in a star-forming region. In turn, our simulations may exhibit more gas turbulence. That said, the Auriga simulations do model certain physics that these FIRE-2 simulations do not include, most importantly, AGN feedback.
Grand et al. (2016) also found that spiral arms did not considerably heat the disk, while we proposed that spiral arms are likely responsible for the significant increase in of young stars, in part because dominates the overall dispersion (see also Orr et al., 2022). However, Grand et al. (2016) only considered vertical heating. Because the Auriga simulations do not resolve GMCs, spiral arms likely have negligible effects on the vertical dispersion, but may have more significant impacts on the in-plane dispersions. For example, while the FIRE-2 simulations resolve GMCs, young stars in FIRE-2 have vertical effective heating rates that are lower than their radial rates, as Figure 6 showed. Many previous works – both observational and theoretical – only examined the vertical velocity dispersion. However, vertical post-formation dynamical heating operates differently than total and in-plane heating. For example, Figure 3.4 (top) shows that the amount of vertical dispersion added post-formation increases approximately linearly across all ages, while in-plane heating plateaus for Early-Disk stars. Similarly, Figure 3.4 (bottom) shows that the present-day vertical dispersion has the largest relative impact from post-formation heating: the dispersion added from heating typically begins to equal (or surpass) the dispersion from formation at 4 Gyr for the vertical component, but does not rival the in-plane dispersions from formation until 11 Gyr. Furthermore, the vertical dispersion typically exhibits the smallest values. For these reasons, we do not recommend using vertical heating to draw inferences regarding total heating.
As we discussed above, nearly all current cosmological zoom-in simulations form MW-mass galaxies with typical disk-wide , not as dynamically cold as the (solar-neighborhood) measurements of MW today. However, Bird et al. (2021) analyzed a single MW-mass galaxy, h277, selected from the g14 suite of simulations (Christensen et al., 2012), generated using the parallel –body+SPH code GASOLINE (Wadsley et al., 2004). That simulation had disk-wide , measured within an annulus of , for stars younger than 1 Gyr, similar to (primarily locally-measured) values for the MW (for example Nordström et al., 2004; Mackereth et al., 2019b).
The cold disk-wide kinematics of h277 likely reflect its formation history: its disk began to settle early, ago, and it had no major mergers since . That said, one of our galaxies, Romeo, has a similar time of disk onset and merger history as h277 but has a larger (disk-wide) for stars 1 Gyr old today. However, we note that Romeo has a local , which is closer, albeit still higher, than measurements of the MW. Therefore, differences in our simulations’ physical and numerical modeling likely contribute to our unequal dispersions. Although the baryonic mass resolution, modeling of dense ISM, and molecular-based star-formation criteria are broadly similar between our FIRE-2 simulations and h277, key numerical differences exist between our simulations: h277 used SPH for the hydrodynamics solver (instead of MFM); used larger gravitational force softening of 173 pc for all particle species; used the ‘blastwave’ feedback model for core-collapse supernovae in which cooling is turned off for gas within the blast wave radius to mimic the adiabatic expansion of a remnant (Stinson et al., 2006); used only thermal energy injection for white-dwarf (Type Ia) supernovae; and did not include stellar winds or radiative feedback. While it is unclear how any of these individual aspects do or do not affect their results, differences in feedback modeling may contribute to their lower dispersions to some degree. FIRE-2 accounts for energy and momentum injection for both core-collapse and white-dwarf supernovae, and includes stellar winds, radiation pressure, and photo-ionization. This feedback launches starburst-induced, star-forming outflows at early times (see the top-right panel of our Figure 1 and El-Badry et al. (2018a)), which Bird et al. (2021) notes are absent in their simulation. As such, it is possible that our additional feedback channels contribute to larger gas velocity dispersions and subsequently larger values in our simulations, though it is unclear if this persists to later cosmic times. Similarly, Hopkins et al. (2012) and Agertz et al. (2013) both show that the structure of the ISM can non-trivially vary depending on the feedback model used. Despite any differences, we again emphasize that both the disk-wide and exhibited similar trends with age in h277 and our FIRE-2 simulations.
4.2.4 Connections to the early formation of the MW
As we discussed in Sections 3.6 and 3.8, the cold kinematics of MW stars may indicate that the MW’s disk began to settle unusually early in its history. For example, using our predicted result that the disk-wide kinematics of young stars today correlates with when the disk began to settle, and placing the MW’s value of along the relation from our simulations in Figure 10, this implies that the MW’s time of disk onset was ago, which agrees with recent estimates from observations (for example Belokurov & Kravtsov, 2022; Conroy et al., 2022; Xiang & Rix, 2022). Thus, our analysis of disk settling times in cosmological simulations and its relation to present-day kinematics complements and augments these works.
That said, measurements of the MW’s kinematics are largely restricted to one local patch: the solar neighborhood. As we show in Figure 8, locally-measured velocity dispersions in our simulations (at formation) are typically times smaller than disk-wide measurements. In turn, while all of our disk-wide dispersions are larger than the MW’s, 3 of our galaxies have present-day local dispersions lower than the MW’s. Furthermore, the galaxy-to-galaxy scatter in the relation between disk-wide and local kinematics is significant. For example, stars today younger than 100 Myr in one of our most MW-like galaxies, Romeo, have disk-wide that is times higher than its local value, while m12i, which is otherwise similar to Romeo, has disk-wide values that are times higher than local values. More work is needed to determine how the MW’s disk-wide dispersion compares to its local dispersion, and if these differences affect its placement on our disk onset - young stellar kinematics relation. In McCluskey et al. (in prep.) we will more rigorously compare our simulations to the MW as well as other observed galaxies.
We now discuss connections with some of these recent observational works. Conroy et al. (2022) combined Gaia astrometry and H3 Survey spectroscopy to posit that the MW disk formed in three dynamical eras, broadly consistent with our Pre-Disk, Early-Disk, and Late-Disk Eras. Conroy et al. (2022) proposed that the MW began in a ‘simmering phase’, during which the star formation efficiency was low and stars formed kinematically hot, but that ago the MW transitioned into a ‘boiling phase’, during which the SFE strongly increased and stars formed with increasingly ‘disky’ dynamics, marking the ‘birth of the Galactic disk’. This thick disk continued to grow and settle in a ‘boiling phase’ for (from to ) until the Gaia-Sausage-Enceladus (GSE) merger, after which the star formation efficiency decreased and stars formed in a dynamically-colder, thin disk until today.
Similarly, Belokurov & Kravtsov (2022) combined Gaia astrometry with spectroscopy from the APOGEE Data Release 17. Although Belokurov & Kravtsov (2022) lacked empirical age estimates, their general picture agrees with ours: old, metal-poor, in-situ stars were born in a ‘messy’ phase, then the MW ‘spun-up’ as stars rapidly became metal-rich and rotational earlier than Gyr ago. Belokurov & Kravtsov (2022) posited that this rapid formation of the MW’s disk took place over 1 - 2 Gyr, with the GSE merger occurring after the initial formation of a thick-disk, such that the merger heated disk stars onto halo-like orbits.
On the other hand, Xiang & Rix (2022) conclude that the formation of the in-situ halo and thick-disk overlapped. In this picture, the GSE merger then occurred ago, earlier than previous estimates, and did not strongly heat pre-existing disk stars, or cause a transition to a thin-disk, but instead enhanced thick-disk formation.
Our results help connect these present-day observations to understanding the MW’s formation history. In particular, the presence of coherent rotation in a stellar population today does not necessarily indicate the presence of coherent rotation at the time of formation. Observations show that older, more metal-poor stars in the MW rotate slower than younger stars, but they still display some coherent rotation. In our simulations, this is not primarily the result of these Pre-Disk stars being born with coherent rotation, but rather, this tends to arise from post-formation torquing (see Figure 1), for example, caused by mergers (see Bellardini et al. in preparation). m12m provides an illustrative example: it experienced several major mergers at early times, broadly similar to estimates of when the GSE merger occurred. As Figure 3 shows, m12m has old stars with , despite having . Thus, mergers like the GSE merger could have torqued old stars in the MW onto more coherently-rotating orbits.
Ultimately, the MW’s kinematics reflect its individual formation history. While the MW provides a useful benchmark, the fact that most current cosmological simulations form galaxies with hotter kinematics than the MW may speak to the MW’s early settling time rather than to limitations of the simulations. Indeed, the comparison of the MW to M31 and M33 in Figure 7 affirms that the MW may be an outlier among galaxies at its mass. Therefore, future works that study the kinematics of stars and their relation to stellar ages in external galaxies will provide excellent opportunities to place the MW in a statistical context, to study the combination of cosmological disk settling and dynamical heating across a range of formation histories (Dorman et al., 2015; Leaman et al., 2017; Quirk et al., 2022).
Acknowledgements
We thank Jonathan Stern for helpful comments and the participants of the Disk Formation Workshop at UC Irvine for their enlightening discussions. FM and AW received support from: NSF via CAREER award AST-2045928 and grant AST-2107772; NASA ATP grant 80NSSC20K0513; HST grants AR-15809, GO-15902, GO-16273 from STScI; and a Scialog Award from the Heising-Simons Foundation. CAFG was supported by NSF through grants AST-2108230 and CAREER award AST-1652522; by NASA through grants 17-ATP17-0067 and 21-ATP21-0036; by STScI through grant HST-GO-16730.016-A; by CXO through grant TM2-23005X; and by the Research Corporation for Science Advancement through a Cottrell Scholar Award. PFH recieved supported by NSF Research Grants 1911233 and 20009234, NSF CAREER grant 1455342, and NASA grants 80NSSC18K0562 and HST-AR-15800.001-A. We performed some of this work at the Aspen Center for Physics, supported by NSF grant PHY-1607611. We ran simulations using: XSEDE, supported by NSF grant ACI-1548562; Blue Waters, supported by the NSF; Frontera allocations AST21010 and AST20016, supported by the NSF and TACC; Pleiades, via the NASA HEC program through the NAS Division at Ames Research Center.
Data Availability
All of the Python code that we used to generate these figures are available at https://fmccluskey.github.io, which uses the publicly available package https://bitbucket.org/awetzel/gizmo_analysis (Wetzel & Garrison-Kimmel, 2020). The FIRE-2 simulations are publicly available (Wetzel et al., 2023) at http://flathub.flatironinstitute.org/fire. Additional FIRE simulation data is available at https://fire.northwestern.edu/data. A public version of the Gizmo code is available at http://www.tapir.caltech.edu/~phopkins/Site/GIZMO.html.
References
- Agertz et al. (2013) Agertz O., Kravtsov A. V., Leitner S. N., Gnedin N. Y., 2013, ApJ, 770, 25
- Agertz et al. (2021) Agertz O., et al., 2021, MNRAS, 503, 5826
- Anders et al. (2023) Anders F., et al., 2023, arXiv e-prints, p. arXiv:2304.08276
- Anglés-Alcázar et al. (2017) Anglés-Alcázar D., Faucher-Giguère C.-A., Kereš D., Hopkins P. F., Quataert E., Murray N., 2017, MNRAS, 470, 4698
- Aumer et al. (2016) Aumer M., Binney J., Schönrich R., 2016, MNRAS, 462, 1697
- Barbanis & Woltjer (1967) Barbanis B., Woltjer L., 1967, ApJ, 150, 461
- Bellardini et al. (2022) Bellardini M. A., Wetzel A., Loebman S. R., Bailin J., 2022, MNRAS, 514, 4270
- Belokurov & Kravtsov (2022) Belokurov V., Kravtsov A., 2022, MNRAS, 514, 689
- Belokurov et al. (2018) Belokurov V., Erkal D., Evans N. W., Koposov S. E., Deason A. J., 2018, MNRAS, 478, 611
- Benincasa et al. (2020) Benincasa S. M., et al., 2020, MNRAS, 497, 3993
- Binney & Tremaine (2008) Binney J., Tremaine S., 2008, Galactic Dynamics: Second Edition
- Bird et al. (2012) Bird J. C., Kazantzidis S., Weinberg D. H., 2012, MNRAS, 420, 913
- Bird et al. (2021) Bird J. C., Loebman S. R., Weinberg D. H., Brooks A. M., Quinn T. R., Christensen C. R., 2021, MNRAS, 503, 1815
- Birkin et al. (2023) Birkin J. E., et al., 2023, arXiv e-prints, p. arXiv:2301.05720
- Bonaca et al. (2017) Bonaca A., Conroy C., Wetzel A., Hopkins P. F., Kereš D., 2017, ApJ, 845, 101
- Bonaca et al. (2020) Bonaca A., et al., 2020, ApJ, 897, L18
- Boulares & Cox (1990) Boulares A., Cox D. P., 1990, ApJ, 365, 544
- Brook et al. (2004) Brook C. B., Kawata D., Gibson B. K., Freeman K. C., 2004, ApJ, 612, 894
- Brook et al. (2012) Brook C. B., et al., 2012, MNRAS, 426, 690
- Buck et al. (2020) Buck T., Obreja A., Macciò A. V., Minchev I., Dutton A. A., Ostriker J. P., 2020, MNRAS, 491, 3461
- Buder et al. (2018) Buder S., et al., 2018, MNRAS, 478, 4513
- Carlberg & Innanen (1987) Carlberg R. G., Innanen K. A., 1987, AJ, 94, 666
- Carlberg & Sellwood (1985) Carlberg R. G., Sellwood J. A., 1985, ApJ, 292, 79
- Casagrande et al. (2011) Casagrande L., Schönrich R., Asplund M., Cassisi S., Ramírez I., Meléndez J., Bensby T., Feltzing S., 2011, A&A, 530, A138
- Ceverino et al. (2017) Ceverino D., Primack J., Dekel A., Kassin S. A., 2017, MNRAS, 467, 2664
- Chan et al. (2019) Chan T. K., Kereš D., Hopkins P. F., Quataert E., Su K. Y., Hayward C. C., Faucher-Giguère C. A., 2019, MNRAS, 488, 3716
- Chan et al. (2021) Chan T. K., Keres D., Gurvich A. B., Hopkins P., Trapp C., Ji S., Faucher-Giguere C.-A., 2021, arXiv e-prints, p. arXiv:2110.06231
- Christensen et al. (2012) Christensen C., Quinn T., Governato F., Stilp A., Shen S., Wadsley J., 2012, MNRAS, 425, 3058
- Conroy et al. (2022) Conroy C., et al., 2022, arXiv e-prints, p. arXiv:2204.02989
- Conselice et al. (2005) Conselice C. J., Blackburne J. A., Papovich C., 2005, ApJ, 620, 564
- Cui et al. (2012) Cui X.-Q., et al., 2012, Research in Astronomy and Astrophysics, 12, 1197
- Das et al. (2020) Das P., Hawkins K., Jofré P., 2020, MNRAS, 493, 5195
- Dashyan et al. (2018) Dashyan G., Silk J., Mamon G. A., Dubois Y., Hartwig T., 2018, MNRAS, 473, 5698
- De Silva et al. (2015) De Silva G. M., et al., 2015, MNRAS, 449, 2604
- Debattista et al. (2019) Debattista V. P., Gonzalez O. A., Sanderson R. E., El-Badry K., Garrison-Kimmel S., Wetzel A., Faucher-Giguère C.-A., Hopkins P. F., 2019, MNRAS, 485, 5073
- Dehnen & Binney (1998) Dehnen W., Binney J. J., 1998, MNRAS, 298, 387
- Dekel et al. (2009) Dekel A., et al., 2009, Nature, 457, 451
- Dorman et al. (2015) Dorman C. E., et al., 2015, ApJ, 803, 24
- Dubois et al. (2013) Dubois Y., Gavazzi R., Peirani S., Silk J., 2013, MNRAS, 433, 3297
- Edvardsson et al. (1993) Edvardsson B., Andersen J., Gustafsson B., Lambert D. L., Nissen P. E., Tomkin J., 1993, A&A, 275, 101
- El-Badry et al. (2016) El-Badry K., Wetzel A., Geha M., Hopkins P. F., Kereš D., Chan T. K., Faucher-Giguère C.-A., 2016, ApJ, 820, 131
- El-Badry et al. (2018a) El-Badry K., et al., 2018a, MNRAS, 473, 1930
- El-Badry et al. (2018b) El-Badry K., et al., 2018b, MNRAS, 480, 652
- Elmegreen et al. (2007) Elmegreen D. M., Elmegreen B. G., Ravindranath S., Coe D. A., 2007, ApJ, 658, 763
- Escala et al. (2018) Escala I., et al., 2018, MNRAS, 474, 2194
- Faucher-Giguère (2018) Faucher-Giguère C.-A., 2018, MNRAS, 473, 3717
- Faucher-Giguère et al. (2009) Faucher-Giguère C.-A., Lidz A., Zaldarriaga M., Hernquist L., 2009, ApJ, 703, 1416
- Faucher-Giguère et al. (2013) Faucher-Giguère C.-A., Quataert E., Hopkins P. F., 2013, MNRAS, 433, 1970
- Feldmann et al. (2017) Feldmann R., Quataert E., Hopkins P. F., Faucher-Giguère C.-A., Kereš D., 2017, MNRAS, 470, 1050
- Flores Velázquez et al. (2021) Flores Velázquez J. A., et al., 2021, MNRAS, 501, 4812
- Förster Schreiber & Wuyts (2020) Förster Schreiber N. M., Wuyts S., 2020, ARA&A, 58, 661
- Förster Schreiber et al. (2009) Förster Schreiber N. M., et al., 2009, ApJ, 706, 1364
- Gaia Collaboration et al. (2016) Gaia Collaboration et al., 2016, A&A, 595, A1
- Gallart et al. (2019) Gallart C., Bernard E. J., Brook C. B., Ruiz-Lara T., Cassisi S., Hill V., Monelli M., 2019, Nature Astronomy, 3, 932
- Garrison-Kimmel et al. (2018) Garrison-Kimmel S., et al., 2018, MNRAS, 481, 4133
- Garrison-Kimmel et al. (2019) Garrison-Kimmel S., et al., 2019, MNRAS, 489, 4574
- Genzel et al. (2015) Genzel R., et al., 2015, ApJ, 800, 20
- Giocoli et al. (2007) Giocoli C., Moreno J., Sheth R. K., Tormen G., 2007, MNRAS, 376, 977
- Girard et al. (2021) Girard M., et al., 2021, ApJ, 909, 12
- Grand et al. (2016) Grand R. J. J., Springel V., Gómez F. A., Marinacci F., Pakmor R., Campbell D. J. R., Jenkins A., 2016, MNRAS, 459, 199
- Grand et al. (2017) Grand R. J. J., et al., 2017, MNRAS, 467, 179
- Gurvich et al. (2020) Gurvich A. B., et al., 2020, MNRAS, 498, 3664
- Gurvich et al. (2023) Gurvich A. B., et al., 2023, MNRAS, 519, 2598
- Guszejnov et al. (2020) Guszejnov D., Grudić M. Y., Offner S. S. R., Boylan-Kolchin M., Faucher-Giguère C.-A., Wetzel A., Benincasa S. M., Loebman S., 2020, MNRAS, 492, 488
- Hafen et al. (2022) Hafen Z., et al., 2022, MNRAS, 514, 5056
- Hahn & Abel (2011) Hahn O., Abel T., 2011, MNRAS, 415, 2101
- Haywood et al. (2018) Haywood M., Di Matteo P., Lehnert M. D., Snaith O., Khoperskov S., Gómez A., 2018, ApJ, 863, 113
- He et al. (2023) He H., Bottrell C., Wilson C., Moreno J., Burkhart B., Hayward C. C., Hernquist L., Twum A., 2023, arXiv e-prints, p. arXiv:2301.13250
- Helmi et al. (2018) Helmi A., Babusiaux C., Koppelman H. H., Massari D., Veljanoski J., Brown A. G. A., 2018, Nature, 563, 85
- Holmberg et al. (2009) Holmberg J., Nordström B., Andersen J., 2009, A&A, 501, 941
- Hopkins (2015) Hopkins P. F., 2015, MNRAS, 450, 53
- Hopkins (2016) Hopkins P. F., 2016, MNRAS, 455, 89
- Hopkins et al. (2009) Hopkins P. F., Cox T. J., Younger J. D., Hernquist L., 2009, ApJ, 691, 1168
- Hopkins et al. (2012) Hopkins P. F., Quataert E., Murray N., 2012, MNRAS, 421, 3488
- Hopkins et al. (2018) Hopkins P. F., et al., 2018, MNRAS, 480, 800
- Hopkins et al. (2020) Hopkins P. F., et al., 2020, MNRAS, 492, 3465
- Hopkins et al. (2023) Hopkins P. F., et al., 2023, arXiv e-prints, p. arXiv:2301.08263
- House et al. (2011) House E. L., et al., 2011, MNRAS, 415, 2652
- Hung et al. (2019) Hung C.-L., et al., 2019, MNRAS, 482, 5125
- Irodotou et al. (2022) Irodotou D., et al., 2022, MNRAS, 513, 3768
- Jenkins & Binney (1990) Jenkins A., Binney J., 1990, MNRAS, 245, 305
- Johnson et al. (2018) Johnson H. L., et al., 2018, MNRAS, 474, 5076
- Kassin et al. (2012) Kassin S. A., et al., 2012, ApJ, 758, 106
- Kim et al. (2023) Kim J.-G., Gong M., Kim C.-G., Ostriker E. C., 2023, ApJS, 264, 10
- Koudmani et al. (2021) Koudmani S., Henden N. A., Sijacki D., 2021, MNRAS, 503, 3568
- Kroupa (2001) Kroupa P., 2001, MNRAS, 322, 231
- Krumholz & Gnedin (2011) Krumholz M. R., Gnedin N. Y., 2011, ApJ, 729, 36
- Krumholz et al. (2018) Krumholz M. R., Burkhart B., Forbes J. C., Crocker R. M., 2018, MNRAS, 477, 2716
- Kumamoto et al. (2017) Kumamoto J., Baba J., Saitoh T. R., 2017, PASJ, 69, 32
- Lacey (1984) Lacey C. G., 1984, MNRAS, 208, 687
- Lang et al. (2020) Lang P., et al., 2020, ApJ, 897, 122
- Leaman et al. (2017) Leaman R., et al., 2017, MNRAS, 472, 1879
- Lehnert et al. (2009) Lehnert M. D., Nesvadba N. P. H., Le Tiran L., Di Matteo P., van Driel W., Douglas L. S., Chemin L., Bournaud F., 2009, ApJ, 699, 1660
- Leitherer et al. (1999) Leitherer C., et al., 1999, ApJS, 123, 3
- Leroy et al. (2008) Leroy A. K., Walter F., Brinks E., Bigiel F., de Blok W. J. G., Madore B., Thornley M. D., 2008, AJ, 136, 2782
- Ma et al. (2017) Ma X., Hopkins P. F., Wetzel A. R., Kirby E. N., Anglés-Alcázar D., Faucher-Giguère C.-A., Kereš D., Quataert E., 2017, MNRAS, 467, 2430
- Mackereth et al. (2019a) Mackereth J. T., et al., 2019a, MNRAS, 482, 3426
- Mackereth et al. (2019b) Mackereth J. T., et al., 2019b, MNRAS, 489, 176
- Madau & Dickinson (2014) Madau P., Dickinson M., 2014, ARA&A, 52, 415
- Majewski et al. (2017) Majewski S. R., et al., 2017, AJ, 154, 94
- Margalef-Bentabol et al. (2022) Margalef-Bentabol B., Conselice C. J., Haeussler B., Casteels K., Lintott C., Masters K., Simmons B., 2022, MNRAS, 511, 1502
- Martig et al. (2014) Martig M., Minchev I., Flynn C., 2014, MNRAS, 443, 2452
- McElroy et al. (2022) McElroy R., et al., 2022, MNRAS, 515, 3406
- Mercedes-Feliz et al. (2023) Mercedes-Feliz J., et al., 2023, arXiv e-prints, p. arXiv:2301.01784
- Minchev & Quillen (2006) Minchev I., Quillen A. C., 2006, MNRAS, 368, 623
- Moreno et al. (2021) Moreno J., et al., 2021, MNRAS, 503, 3113
- Muratov et al. (2015) Muratov A. L., Kereš D., Faucher-Giguère C.-A., Hopkins P. F., Quataert E., Murray N., 2015, MNRAS, 454, 2691
- Naab & Ostriker (2017) Naab T., Ostriker J. P., 2017, ARA&A, 55, 59
- Nordström et al. (2004) Nordström B., et al., 2004, A&A, 418, 989
- Orr et al. (2018) Orr M. E., et al., 2018, MNRAS, 478, 3653
- Orr et al. (2020) Orr M. E., et al., 2020, MNRAS, 496, 1620
- Orr et al. (2022) Orr M. E., et al., 2022, arXiv e-prints, p. arXiv:2209.14159
- Pandya et al. (2021) Pandya V., et al., 2021, MNRAS, 508, 2979
- Pessa et al. (2023) Pessa I., et al., 2023, A&A, 673, A147
- Planck Collaboration et al. (2020) Planck Collaboration et al., 2020, A&A, 641, A6
- Quinn et al. (1993) Quinn P. J., Hernquist L., Fullagar D. P., 1993, ApJ, 403, 74
- Quirk et al. (2022) Quirk A. C. N., et al., 2022, AJ, 163, 166
- Renaud et al. (2013) Renaud F., et al., 2013, MNRAS, 436, 1836
- Rizzo et al. (2020) Rizzo F., Vegetti S., Powell D., Fraternali F., McKean J. P., Stacey H. R., White S. D. M., 2020, Nature, 584, 201
- Roškar et al. (2010) Roškar R., Debattista V. P., Brooks A. M., Quinn T. R., Brook C. B., Governato F., Dalcanton J. J., Wadsley J., 2010, MNRAS, 408, 783
- Saha et al. (2010) Saha K., Tseng Y.-H., Taam R. E., 2010, ApJ, 721, 1878
- Sanderson et al. (2020) Sanderson R. E., et al., 2020, ApJS, 246, 6
- Santistevan et al. (2020) Santistevan I. B., Wetzel A., El-Badry K., Bland-Hawthorn J., Boylan-Kolchin M., Bailin J., Faucher-Giguère C.-A., Benincasa S., 2020, MNRAS, 497, 747
- Santistevan et al. (2021) Santistevan I. B., Wetzel A., Sanderson R. E., El-Badry K., Samuel J., Faucher-Giguère C.-A., 2021, MNRAS, 505, 921
- Sellwood (2013) Sellwood J. A., 2013, ApJ, 769, L24
- Shapley (2011) Shapley A. E., 2011, ARA&A, 49, 525
- Silva Aguirre et al. (2018) Silva Aguirre V., et al., 2018, MNRAS, 475, 5487
- Soderblom (2010) Soderblom D. R., 2010, ARA&A, 48, 581
- Somerville & Davé (2015) Somerville R. S., Davé R., 2015, ARA&A, 53, 51
- Sparre et al. (2017) Sparre M., Hayward C. C., Feldmann R., Faucher-Giguère C.-A., Muratov A. L., Kereš D., Hopkins P. F., 2017, MNRAS, 466, 88
- Spitzer & Schwarzschild (1951) Spitzer Lyman J., Schwarzschild M., 1951, ApJ, 114, 385
- Springel & Hernquist (2003) Springel V., Hernquist L., 2003, MNRAS, 339, 289
- Stern et al. (2021) Stern J., et al., 2021, ApJ, 911, 88
- Stinson et al. (2006) Stinson G., Seth A., Katz N., Wadsley J., Governato F., Quinn T., 2006, MNRAS, 373, 1074
- Stott et al. (2016) Stott J. P., et al., 2016, MNRAS, 457, 1888
- Strömberg (1946) Strömberg G., 1946, ApJ, 104, 12
- Su et al. (2017) Su K.-Y., Hopkins P. F., Hayward C. C., Faucher-Giguère C.-A., Kereš D., Ma X., Robles V. H., 2017, MNRAS, 471, 144
- Sun et al. (2020) Sun J., et al., 2020, ApJ, 901, L8
- Swinbank et al. (2012) Swinbank A. M., Smail I., Sobral D., Theuns T., Best P. N., Geach J. E., 2012, ApJ, 760, 130
- Tacconi et al. (2020) Tacconi L. J., Genzel R., Sternberg A., 2020, ARA&A, 58, 157
- Teyssier (2002) Teyssier R., 2002, A&A, 385, 337
- Ting & Rix (2019) Ting Y.-S., Rix H.-W., 2019, ApJ, 878, 21
- Trapp et al. (2022) Trapp C. W., et al., 2022, MNRAS, 509, 4149
- Übler et al. (2019) Übler H., et al., 2019, ApJ, 880, 48
- Villalobos & Helmi (2008) Villalobos Á., Helmi A., 2008, MNRAS, 391, 1806
- Vogelsberger et al. (2020) Vogelsberger M., Marinacci F., Torrey P., Puchwein E., 2020, Nature Reviews Physics, 2, 42
- Wadsley et al. (2004) Wadsley J. W., Stadel J., Quinn T., 2004, New A, 9, 137
- Wechsler et al. (2002) Wechsler R. H., Bullock J. S., Primack J. R., Kravtsov A. V., Dekel A., 2002, ApJ, 568, 52
- Weinberger et al. (2017) Weinberger R., et al., 2017, MNRAS, 465, 3291
- Wellons et al. (2023) Wellons S., et al., 2023, MNRAS, 520, 5394
- Wetzel & Garrison-Kimmel (2020) Wetzel A., Garrison-Kimmel S., 2020, GizmoAnalysis: Read and analyze Gizmo simulations (ascl:2002.015)
- Wetzel et al. (2023) Wetzel A., et al., 2023, ApJS, 265, 44
- Wibking & Krumholz (2023) Wibking B. D., Krumholz M. R., 2023, MNRAS, 521, 5972
- Wielen (1977) Wielen R., 1977, A&A, 60, 263
- Wisnioski et al. (2015) Wisnioski E., et al., 2015, ApJ, 799, 209
- Xiang & Rix (2022) Xiang M., Rix H.-W., 2022, Nature, 603, 599
- Yu et al. (2021) Yu S., et al., 2021, MNRAS, 505, 889
- Yu et al. (2022) Yu S., et al., 2022, arXiv e-prints, p. arXiv:2210.03845
Appendix A Effect of Vertical Selection
By default, we select stars currently at , which includes stars in both the thin and thick disk, to sample disk stars at all ages in an unbiased manner and avoid assumptions about thin- versus thick-disk dynamics. Figure 11 shows the effect of the vertical selection on and versus stellar age, specifically, the fractional change relative to our fiducial selection of . We also examined the effect on and and they show trends nearly identical to so we do not show them separately.
At most ages, our vertical selection has minimal impact on any component of the dispersion, . This is because most disk stars lie well within , so they dominate regardless of vertical selection. Thinner vertical selection does yield slightly higher , although with significant scatter. Interestingly, thinner selection only yields higher for stars older than , and instead yield slightly lower values of for younger stars. The youngest population formed near the mid-plane and experienced of post-formation heating, on average, so most are still near the mid-plane and have low dispersions. Any that are above likely experienced an atypical amount of heating. Again, all of these effects are at the level of , where non-equilibrium effects like disk warping and asymmetries may become important.
If instead we measure the dispersion for the galaxy overall (not in age bins) as in Section 7, larger vertical selections non-trivially increase the dispersion. Vertical dispersions within are 10 - 35% larger than within , because larger vertical selections include a higher fraction of older, higher-dispersion stars.
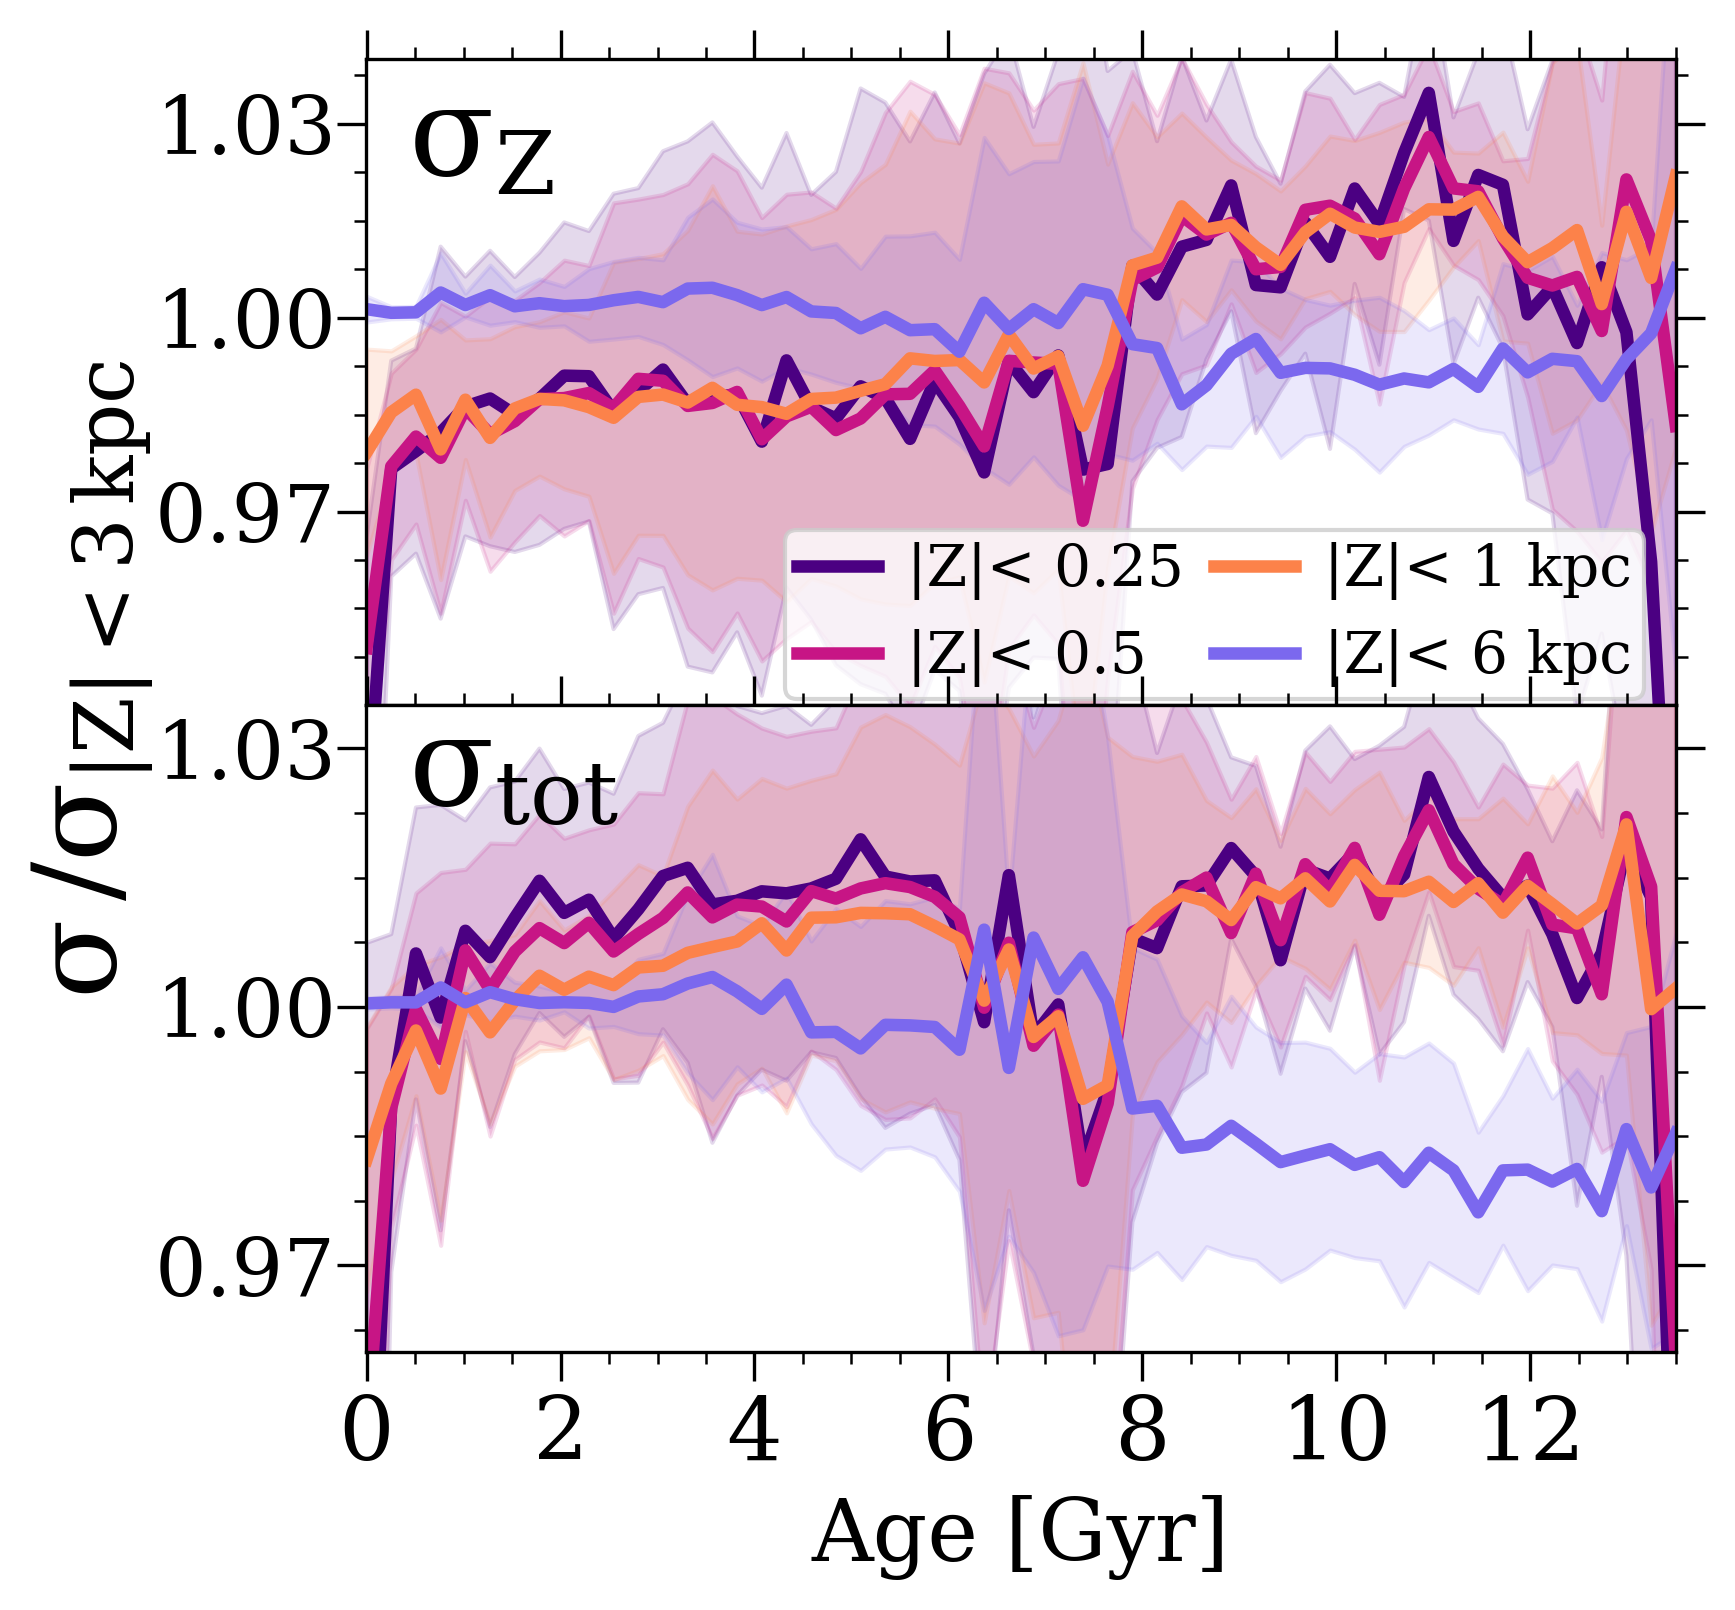
Appendix B Effect of In-Situ Selection
By default, we select only stars that are at and at present. We include all of these stars when measuring present-day kinematics, but when measuring kinematics at formation, we select only in-situ stars that formed within 30 kpc comoving of the galactic center. Figure 12 shows the effect of also including this in-situ selection on the current velocity dispersion versus stellar age. As above, we only show and , because and exhibit the same trends as . Overall, our in-situ selection has no effect on stars younger than , because almost all of them formed in situ. However, the effects of in-situ selection become increasingly significant for older stars, when a more significant fraction formed ex situ. Not surprisingly, including those older ex-situ stars increases the dispersion. That said, this effect is for all but the oldest stars (see El-Badry et al., 2018b, for analysis of these ancient stars).
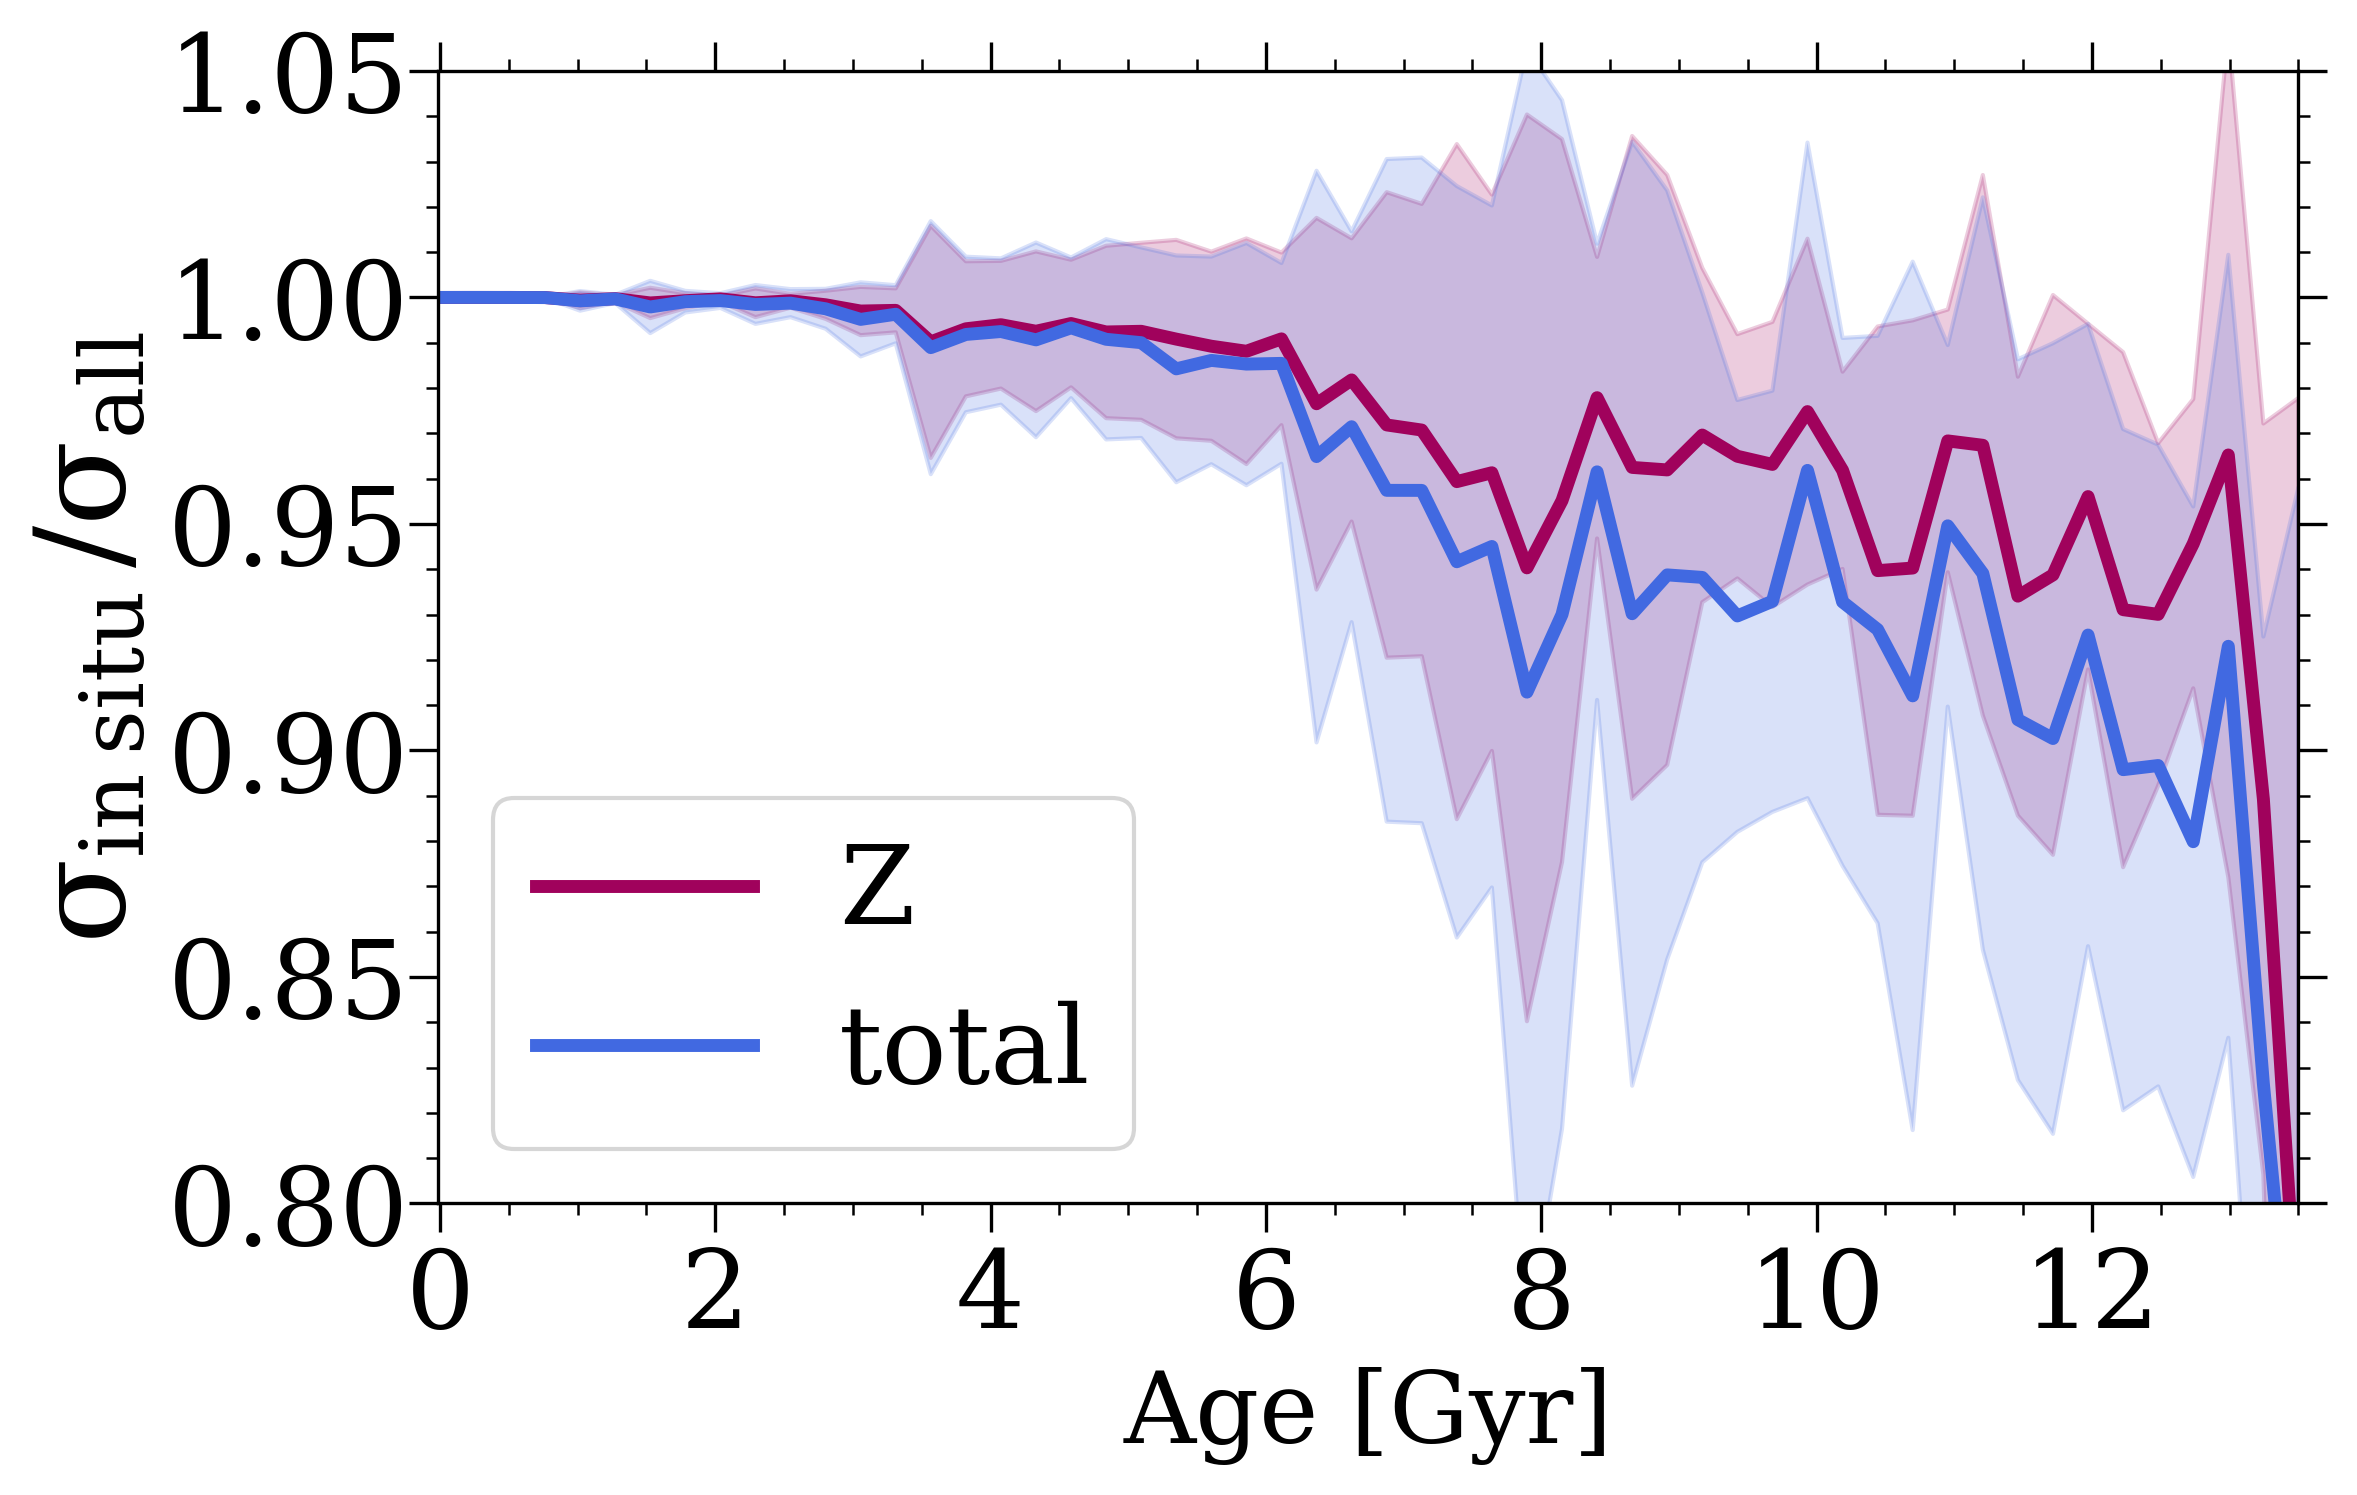
Appendix C Effect of Cosmic-Ray Feedback

The fiducial FIRE-2 simulations that we examine do not include self-consistent cosmic ray (CR) injection and transport. However, CRs may be important in regulating the dynamical state of the ISM, and therefore the resultant stellar populations, because in the solar neighborhood the CR energy density is comparable to the gas thermal and turbulent energy densities (for example Boulares & Cox, 1990).
Here, we explore the effects of CR feedback from stars on the dynamical state of our MW-mass disks. One proposed way to form kinematically colder disks in cosmological simulations is the inclusion of previously neglected feedback channels, including CRs, because they can provide a spatially and temporally smoother form of feedback and potentially launch cooler galactic winds. Previous work using FIRE-2 simulations found that the inclusion of magnetic fields, anisotropic conduction, and viscosity has no appreciable effects on any bulk galaxy properties, but that the inclusion of CRs, within reasonable uncertainty for the treatment of the CR diffusion coefficient, significantly can alter galaxy properties (Su et al., 2017; Hopkins et al., 2020). FIRE-2 simulations with CRs also include anisotropic CR transport with stream and advection / diffusion (with constant parallel diffusivity, ), CR cooling (hadronic and Compton, adiabatic, and streaming losses), CR injection in supernova shocks, and CR–gas coupling (see Chan et al., 2019, for details of the numerical implementation of CRs in these simulations).
Hopkins et al. (2020) showed in the FIRE-2 simulations that the primary effect of CR feedback is to prevent the accretion of halo gas into the galaxy, leading to lower star formation and stellar mass by in MW-mass galaxies at . Furthermore, Chan et al. (2021) found that the inclusion of CRs in FIRE-2 leads to lower velocity dispersions in gas, which might suggest dynamically cooler disks, although they did not examine . We show here that the opposite is true for young stars when considering , that is, the inclusion of CRs leads to dynamically hotter stellar disks.
Figure 13 shows the effect of CRs on present-day stellar kinematics versus age. We include only the isolated galaxies from the Latte suite, which have versions with CR feedback. We also include the lower-mass galaxies m12r and m12z, because our goal is only to examine the differential effects of including CRs. Figure 13 (top) shows the current median azimuthal velocity, , versus stellar age, averaged across the same galaxies in the CR simulations and the fiducial simulations. At all ages, galaxies with CR feedback have lower , with the largest absolute difference for the youngest stars, which arises primarily because of their lower stellar masses.
Figure 13 (middle) shows the present vertical velocity dispersion, , versus age. The CR simulations have lower at all ages, except for the youngest stars, which may arise from the effects of CRs on the ISM and halo gas occurring over long timescales. We also examined , , and and found qualitatively similar results. Overall, the inclusion of CR feedback leads to lower velocity dispersions in stars, consistent with analyses of gas in these simulations (Hopkins et al., 2020; Chan et al., 2021).
Figure 13 (bottom) shows the sample-averaged versus age. For most ages, stars in the CR simulations have slightly less rotational support than in the simulations without CR feedback; the youngest stars show the most significant reduction at . Thus, including CR feedback leads to fractionally dynamically hotter galaxies, despite their lower absolute velocity dispersions. However, Figure 14 shows that CR feedback leads to galaxies with lower stellar mass at present, as Hopkins et al. (2020) showed.
Figure 14 (top row) shows for all stars versus stellar mass, while Figure 14 (bottom row) shows the same but for young stars (age < 250 Myr). We show our 6 fiducial LG-like galaxies (as black stars) to clarify our fiducial sample’s mass-relation across this entire mass range, given that none of our fiducial isolated simulations have masses within , the range containing half of their CR counterparts. That said, we advise against making direct comparisons between any individual fiducial LG-like simulations and CR isolated simulations, because each galaxy has its own unique history and our fiducial LG-like simulations generally have slightly colder kinematics than our isolated simulations. We emphasize that Figure 14 shows the same trends with stellar mass as for our fiducial simulations without CR feedback in Figure 7. Thus, the inclusion of CR feedback primarily acts to reduce a galaxy’s stellar mass and correspondingly shifts its and along the existing relation. This leads to galaxies that are slightly less disky, with slightly lower . We conclude that the inclusion of CR feedback, at least as implemented in FIRE-2 and assuming a constant diffusion coefficient, does not lead to dynamically colder disks.