DeepEpiSolver: Unravelling Inverse problems in Covid, HIV, Ebola and Disease Transmission
Abstract
The spread of many infectious diseases is modeled using variants of the SIR compartmental model, which is a coupled differential equation. The coefficients of the SIR model determine the spread trajectories of disease, on whose basis proactive measures can be taken. Hence, the coefficient estimates must be both fast and accurate. Shaier et al. in [14] used Physics Informed Neural Networks (PINNs) to estimate the parameters of the SIR model. There are two drawbacks to this approach. First, the training time for PINNs is high, with certain diseases taking close to 90 hrs to train. Second, PINNs don’t generalize for a new SIDR trajectory, and learning its corresponding SIR parameters requires retraining the PINN from scratch. In this work, we aim to eliminate both of these drawbacks. We generate a dataset between the parameters of ODE and the spread trajectories by solving the forward problem for a large distribution of parameters using the LSODA algorithm. We then use a neural network to learn the mapping between spread trajectories and coefficients of SIDR in an offline manner. This allows us to learn the parameters of a new spread trajectory without having to retrain, enabling generalization at test time. We observe a speed-up of 3-4 orders of magnitude with accuracy comparable to that of PINNs for 11 highly infectious diseases. Further finetuning of neural network inferred ODE coefficients using PINN further leads to 2-3 orders improvement of estimated coefficients.
1 Introduction
In the past century alone, mankind has been suffering from various deadly diseases, with Spanish flu (1918-1920), Hong Kong Flu (1968-1969), Ebola Virus (1976-ongoing), Middle East Respiratory Syndrome (MERS) (2012-ongoing), Ebola Virus (2014), Severe acute respiratory syndrome coronavirus-2 (SARS-CoV-2) just to name a few. The recent outbreak of SARS-CoV-2 has led to a few million infections across the globe, and the importance of mathematical modeling of these infectious diseases has never been more important. In the early stages of the pandemic, mathematical models helped public health officials understand the potential impact of the disease and predict how quickly it could spread. This information was used to make informed decisions about which mitigation measures were necessary and which were most effective. Additionally, mathematical models were also used to evaluate the effectiveness of different vaccination strategies and make predictions about the future course of the pandemic. This information was critical in helping countries prioritize vaccine distribution and allocate resources.
One of the earliest methods for predicting the spread of infectious disease was formulated by the Kermack–McKendrick epidemic model [9]. In this model, the population under consideration is divided into three classes, susceptible (S), infective (I), and removed (R). Over the years, the SIR model has been improved to account for hospitalizations, latent dynamics, posthumous transmissions, etc to improve the predictions of mathematical models like COVID [4], Anthrax[13], HIV[11], Zika[6], Smallpox[5], Tuberculosis[3], Pneumonia[15], Ebola[10], Dengue[7], Polio[2] and Measles[1]. Shaier et al. in [14] used Physics-informed Neural Networks [12] to predict the coefficients of mathematical models in [4, 13, 11, 6, 5, 3, 15, 10, 7, 2, 1] for one specific SIR trajectory instance. The PINNs are trained in an unsupervised manner and use a physics-informed loss to solve the inverse problem of coefficient estimation of differential equations. The physics-informed loss, however, has a complex loss landscape [16] and struggles to converge quickly, leading to larger training durations, with some diseases requiring around 90 hrs to train. Furthermore, PINNs must be retrained for a new trajectory estimation, as the underlying parameters governing the trajectory differ. In this work, we circumvent both these problems. We generate a dataset wherein we solve the computationally cheaper forward problem multiple times to generate spread trajectories, given the parameters of the SIR model. Then we use a neural network to learn the inverse mapping between trajectories and parameters. We use this trained neural network to estimate the parameters of the SIR model for a new test task, avoiding retraining. We observe a speed-up of 3-4 orders of magnitude, while parameter estimations are on par with PINNs. Further finetuning of neural network inferred parameters using PINNs outperform PINNs from scratch by 2-3 orders of magnitude at 25 times lower train time.
2 DeepEpiSolver Methodology
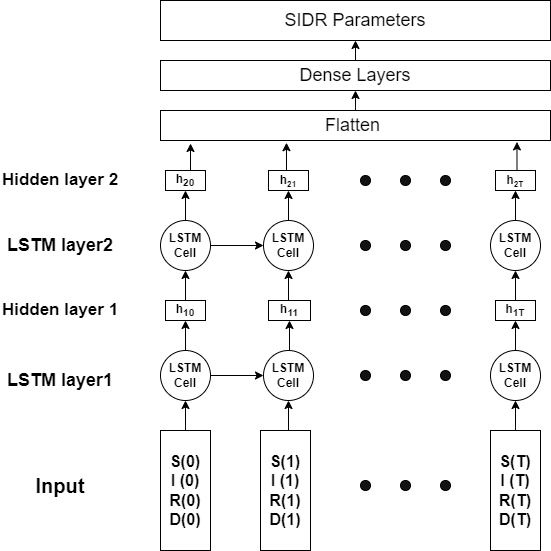
We first generate the dataset. We solve the forward problem of generating spread trajectories, given the parameters of the disease ODEs using the LSODA [8] algorithm. The LSODA algorithm is computationally very cheap and just takes 2-3 seconds for simulating the trajectories per example. In the next step, we use a neural network to learn the mapping between spread trajectory and parameters. As the spread trajectories have temporal variations, a multi-layered LSTM [17] is the most natural choice of Neural Network. Figure 1 represents our multi-layered LSTM architecture. At every time step, we pass the spread population ,,,, where as input, which is fed to the multilayered LSTM. The final hidden output layers of LSTM are flattened and passed through dense layers to obtain the final estimations of the parameters of the ODE. We further finetune the inferred LSTM-obtained parameters using a Physics-informed Neural Network using the same training settings as described in [14].
3 Experiments
Table 1 consists of the information on the differential equations governing the diseases. We normalize our inputs (trajectories) before passing through the neural network. We use a multi-layer LSTM architecture with 2 layers and 256 hidden neurons to learn the mapping between the trajectories and the parameters, followed by flattening and 2 dense layers with 64 neurons. We consider 9000 training examples, 500 validation, and 500 test examples for every disease. Table LABEL:tab:parameterwise_error consists of the ranges of each parameter to be estimated for every disease. We use an Adam Optimizer for 60k epochs with multiplicative decay of 0.1 every 20k epochs with an initial learning rate of . We use relative percentage-L2-error as our metric for parameters with non-zero ground-truth value, and mean-average-error for parameters having zero as their true value. All experiments were conducted on NVIDIA P100 GPU with 16 GB GPU Memory and 1.32 GHz GPU Memory clock using Pytorch framework.
4 Covid-19
In this section, we elaborate upon the mathematical model of Covid-19 and discuss the impact of its coefficients. The mathematical model governing the spread of Covid-19 [4] is modeled as follows:
| (1a) | ||||
| (1b) | ||||
| (1c) | ||||
| (1d) | ||||
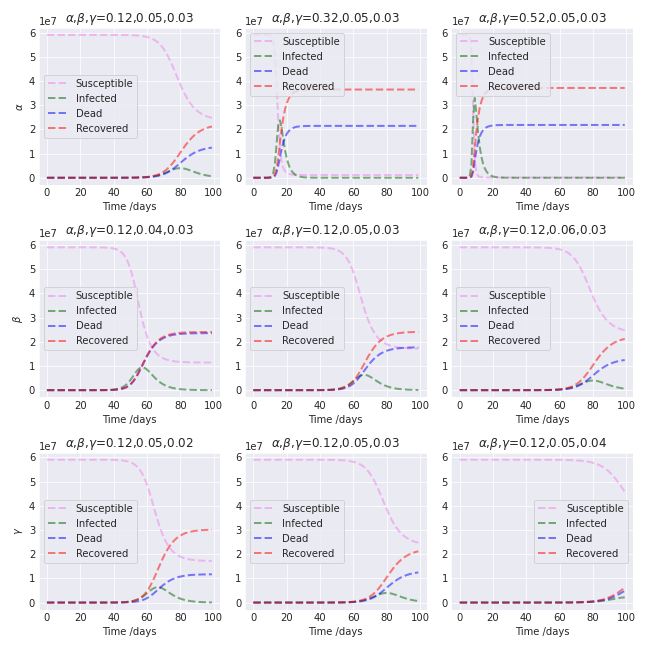
Here S, I, D, and R stand for susceptible, infected, dead, and recovered populations respectively. , and are the parameters that control the trajectories. Figure 2 provides a visualization of how the trajectories are influenced by changes in the range of parameters, with the first, second, and third rows representing changes w.r.t ,, respectively. We observe, as the value of increases, the infection peaks in a lesser number of days, and reaches a higher peak. An increase in and leads to lowering and delaying the infection and death trajectory peak. and has an opposite effect as .
5 Observations
| % Relative L2-error | Time statistics | |||||||
| LSTM | PINN-Finetune | LSTM | PINN | |||||
| Mean | Std-dev | Mean | Std-dev | Training | Test | Training | Finetuning | |
| Covid | 0.7366 | 0.067 | 0.85 hrs | 2 s | 20 mins | 11 mins | ||
| HIV | 0.1691 | 0.0124 | 1.14 hrs | 2 s | 22 hrs | 1.25 hrs | ||
| Small Pox | 3.2057 | 1.2611 | 1.25 hrs | 2 s | 14 hrs | 0.75 hrs | ||
| Tuberculosis | 2.9033 | 0.2271 | 1.16 hrs | 2 s | 12 hrs | 0.75 hrs | ||
| Pneumonia | 2.2597 | 0.3917 | 1.34 hrs | 2 s | 41 hrs | 1.25 hrs | ||
| Dengue | 1.5690 | 0.1609 | 1.62 hrs | 2 s | 33 hrs | 1.45 hrs | ||
| Ebola | 2.4076 | 0.1741 | 1.46 hrs | 2 s | 58 hrs | 1.5 hrs | ||
| Anthrax | 2.0815 | 0.7015 | 2.21 hrs | 2 s | 91 hrs | 1.5 hrs | ||
| Polio | 0.2601 | 0.025 | 1.75 hrs | 2 s | 66 hrs | 1.5 hrs | ||
| Measles | 2.4145 | 0.355 | 1.82 hrs | 2 s | 28 hrs | 2 hrs | ||
| Zika | 0.2416 | 0.0375 | 2.06 hrs | 2 s | 13 hrs | 2.25 hrs | ||
Table 5 summarizes the results of our experiments. We provide two results: LSTM-inferred parameters (Column 2,3) and fine-tuned parameters by PINNs using LSTM-inferred parameters (Column 4,5) as initialization. The statistics of mean and standard deviation of relative-L2-error for every disease are across all test tasks and all parameter coefficients of interest. We observe that PINN-based finetuning improves the error estimates by 2-3 orders, almost learning the true parameters perfectly, and also reduces the standard deviation by 4 orders. HIV, Small Pox has the smallest and largest LSTM mean error, while Anthrax and Measles have the smallest and largest PINN-finetuned mean errors. Columns 6-9 provide the time statistics. We observe the training time for LSTM to generalize for 9000 train tasks is approximately 18.64 times faster than the train time for PINN for just 1 task. Furthermore, as LSTMs generalize the mapping between trajectories and SIR parameters, they can directly infer the parameters of the SIR differential equation for a new set of spread trajectories without retraining, unlike PINNs. Thus, LSTMs take just 2 s to infer for a new task. Additionally, the convergence time of PINN finetuning is on average 25 times lower than PINNs from scratch, indicating the importance of better initialization to faster convergence of PINNs.
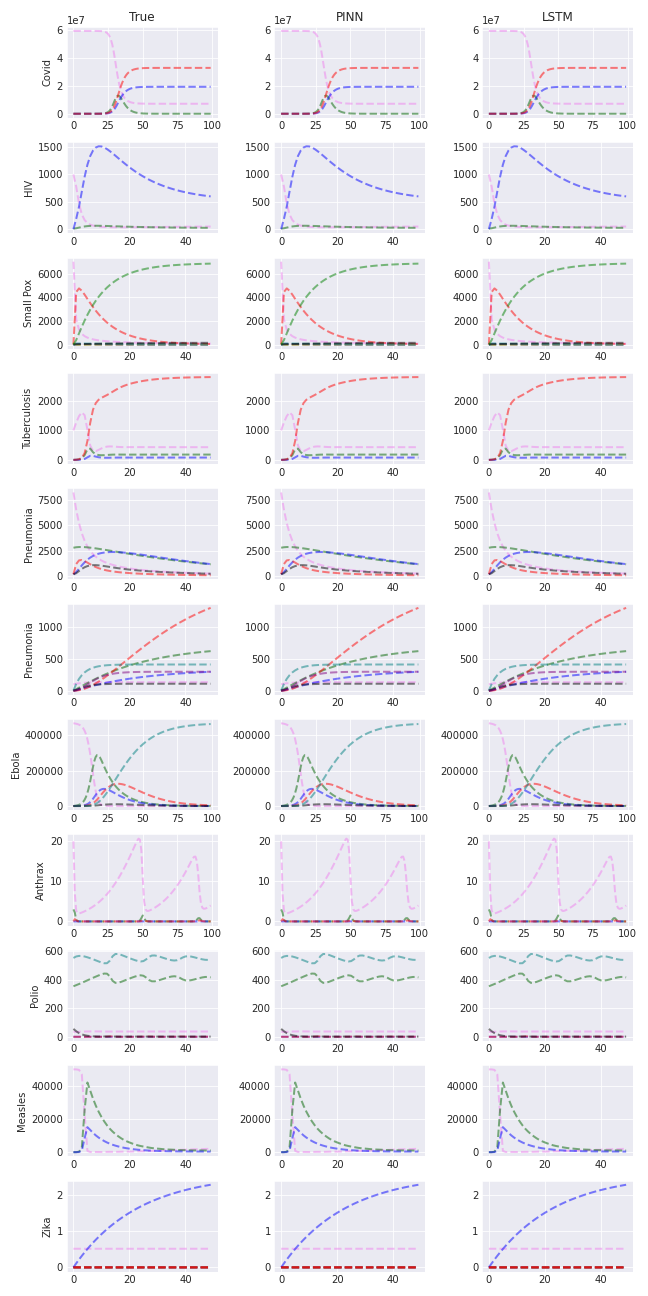
In table LABEL:tab:parameterwise_error, for every disease, we provide the range of the parameter of the differential equation and its corresponding parameter-wise relative-L2-errors for LSTM inference and PINN finetuning. For LSTM, we observe across all diseases, the parameters which higher magnitude values (in the range of or higher) have a lower mean and standard deviation in contrast to parameters with low magnitude values ( and lower). For a fair comparison with existing literature, we compare the performance of LSTM at test-time viz-a-viz with PINNs for the spread trajectories in [14], and compile its results in table LABEL:tab:Comparison and Figure 3. We observe, apart from Covid, HIV, and Zika, LSTMs provide better estimates than PINNs for a majority of the parameters. Even on the parameters where LSTMs are worse (all diseases including Covid, HIV, and Zika), the estimates are not too far off from PINNs and have a negligible difference from the true trajectories, as observed in figure 3. Finetuning the parameters using PINNs on top of LSTM inference further improves the parameter estimates, as observed by 2-3 orders lower error over both LSTM inferred parameters and PINNs trained from scratch.
6 Conclusion
In this work, we show NNs are capable of learning the mapping between disease spread trajectories and the coefficients of the differential equation governing them. NNs can generalize for a new system of trajectories and predict the ODE coefficients accurately without requiring re-training. This eliminates the two drawbacks suffered by PINNs: Longer time and inability to generalize for a new task. Finetuning ODE parameters using PINNs leads to an even better estimate of ODE parameters at 25 times lesser train time than PINNs with the random initialization, further improving the training cost. Quicker and more accurate estimation of governing parameter coefficients allows for proactive measures like hospitalization, vaccination, or lockdowns, which can significantly help reduce human casualties.
References
- Bolker & Grenfell [1995] Benjamin M. Bolker and Bryan T. Grenfell. Space, persistence and dynamics of measles epidemics. Philosophical transactions of the Royal Society of London. Series B, Biological sciences, 348 1325:309–20, 1995.
- Bunimovich-Mendrazitsky & Stone [2005] Svetlana Bunimovich-Mendrazitsky and Lewi Stone. Modeling polio as a disease of development. Journal of Theoretical Biology, 237(3):302–315, 2005. ISSN 0022-5193. doi: https://doi.org/10.1016/j.jtbi.2005.04.017. URL https://www.sciencedirect.com/science/article/pii/S0022519305001815.
- Castillo-Chávez & Feng [1997] Carlos Castillo-Chávez and Zhilan Feng. To treat or not to treat: The case of tuberculosis. Journal of mathematical biology, 35:629–56, 07 1997. doi: 10.1007/s002850050069.
- Fernández-Villaverde & Jones [2020] Jesús Fernández-Villaverde and Charles I Jones. Estimating and simulating a sird model of covid-19 for many countries, states, and cities. Working Paper 27128, National Bureau of Economic Research, May 2020. URL http://www.nber.org/papers/w27128.
- Gani & Leach [2001] Raymond Gani and Steve Leach. Transmission potential of smallpox in contemporary populations. Nature, 414:748–751, 2001.
- Gao et al. [2016] Daozhou Gao, Yijun Lou, Daihai He, Travis C. Porco, Yang Kuang, Gerardo Chowell, and Shigui Ruan. Prevention and control of zika as a mosquito-borne and sexually transmitted disease: A mathematical modeling analysis. Scientific Reports, 6(1), jun 2016. doi: 10.1038/srep28070. URL https://doi.org/10.1038%2Fsrep28070.
- Garba et al. [2008] Salisu Garba, Abba Gumel, and Mohd Bakar. Backward bifurcation in dengue transmission dynamics. Mathematical biosciences, 215:11–25, 06 2008. doi: 10.1016/j.mbs.2008.05.002.
- Hindmarsh & Petzold [Sep 2005] A. C. Hindmarsh and L. R. Petzold. Lsoda, ordinary differential equation solver for stiff or non-stiff system, Sep 2005. URL http://inis.iaea.org/search/search.aspx?orig_q=RN:41086668. MATHEMATICAL METHODS AND COMPUTING.
- Kermack et al. [1927] William Ogilvy Kermack, A. G. McKendrick, and Gilbert Thomas Walker. A contribution to the mathematical theory of epidemics. Proceedings of the Royal Society of London. Series A, Containing Papers of a Mathematical and Physical Character, 115(772):700–721, 1927. doi: 10.1098/rspa.1927.0118. URL https://royalsocietypublishing.org/doi/abs/10.1098/rspa.1927.0118.
- Legrand et al. [2007] J. Legrand, R. F. Grais, P. Y. Boelle, A. J. Valleron, and A. Flahault. Understanding the dynamics of ebola epidemics. Epidemiology and Infection, 135(4):610–621, 2007. ISSN 09502688, 14694409. URL http://www.jstor.org/stable/4617539.
- Perelson et al. [1993] Alan S. Perelson, Denise E. Kirschner, and Rob De Boer. Dynamics of hiv infection of cd4+ t cells. Mathematical Biosciences, 114(1):81–125, 1993. ISSN 0025-5564. doi: https://doi.org/10.1016/0025-5564(93)90043-A. URL https://www.sciencedirect.com/science/article/pii/002555649390043A.
- Raissi et al. [2019] M. Raissi, P. Perdikaris, and G.E. Karniadakis. Physics-informed neural networks: A deep learning framework for solving forward and inverse problems involving nonlinear partial differential equations. Journal of Computational Physics, 378:686–707, 2019. ISSN 0021-9991. doi: https://doi.org/10.1016/j.jcp.2018.10.045. URL https://www.sciencedirect.com/science/article/pii/S0021999118307125.
- Saad-Roy et al. [2016] Chadi Saad-Roy, P. Driessche, and Abdul-Aziz Yakubu. A mathematical model of anthrax transmission in animal populations. Bulletin of Mathematical Biology, 79, 12 2016. doi: 10.1007/s11538-016-0238-1.
- Shaier & Raissi [2021] Sagi Shaier and Maziar Raissi. Disease informed neural networks. CoRR, abs/2110.05445, 2021. URL https://arxiv.org/abs/2110.05445.
- Tilahun et al. [2017] Getachew Tilahun, Oluwole Makinde, and David Malonza. Modelling and optimal control of pneumonia disease with cost-effective strategies. Journal of Biological Dynamics, 11:1–27, 06 2017. doi: 10.1080/17513758.2017.1337245.
- Wang et al. [2021] Sifan Wang, Xinling Yu, and Paris Perdikaris. When and why pinns fail to train: A neural tangent kernel perspective. Journal of Computational Physics, pp. 110768, 10 2021. doi: 10.1016/j.jcp.2021.110768.
- Yang et al. [2018] Libin Yang, Yu Zheng, Xiaoyan Cai, Hang Dai, Dejun Mu, Lantian Guo, and Tao Dai. A lstm based model for personalized context-aware citation recommendation. IEEE Access, 6:59618–59627, 2018. doi: 10.1109/ACCESS.2018.2872730.
Appendix A Appendix
Comparison of LSTM with PINN in literature task
| HIV | |
|---|---|
| Small-Pox | |
| Tuberculosis | |
| Pneumonia | |
| Dengue | |
| Ebola | |
| Anthrax | |
| Polio | |
| Measles | |
| Zika | |
| Predicted Parameter | % Relative L2-Error | |||||||
| Actual | PINN | LSTM | Finetune | PINN | LSTM | Finetune | ||
| Covid | 0.193 | 0.191 | 0.837 | |||||
| 0.050 | 0.049 | 0.400 | ||||||
| 0.029 | 0.029 | 1.701 | ||||||
| HIV | 10 | 10.05 | 10.001 | 0.500 | ||||
| 0.0198 | 0.0200 | 4.633 | ||||||
| 0.260 | 0.257 | 1.154 | ||||||
| 0.239 | 0.240 | 0.417 | ||||||
| 2.407 | 2.400 | 0.292 | ||||||
| 0.030 | 0.03 | 1.333 | ||||||
| 250 | 248.85 | 250.001 | 0.460 | |||||
| 1500 | 1499.96 | 0.563 | ||||||
| 2.19e-5 | 8.75 | |||||||
| 1.94e-5 | 1.99e-5 | 3.00 | ||||||
| Small Pox | 0.5994 | 11.31 | ||||||
| 0.0407 | 0.040 | 1.749 | ||||||
| 1 | 0.9625 | 0.975 | 1.282 | |||||
| 2 | 0.2951 | 0.3 | 1.633 | |||||
| 0.971 | 0.975 | 0.574 | ||||||
| 0.981 | 0.95 | 3.263 | ||||||
| 0.065 | 0.068 | 4.558 | ||||||
| 0.111 | 0.11 | 1.181 | ||||||
| Tuberculosis | 500 | 483.48 | 500.011 | 3.3039 | ||||
| 13 | 12.87 | 13.0004 | 2.514 | |||||
| 1 | 0.984 | 1.0003 | 2.16 | |||||
| 0.141 | 0.143 | 1.398 | ||||||
| 0.4985 | 0.5001 | 0.300 | ||||||
| 2 | 2.034 | 1.9996 | 1.69 | |||||
| 1 | 1.0431 | 1.0013 | 4.31 | |||||
| 13 | 12.99 | 13.001 | 0.076 | |||||
| 0 | 0.012 | 0.012 | ||||||
| 0.0101 | 0.010004 | 1.000 | ||||||
| 0.0994 | 0.1 | 0.600 | ||||||
| 0.5086 | 0.5 | 1.72 | ||||||
| 0.00195 | 0.00201 | 2.500 | ||||||
| Pneumonia | 0.8858 | 0.0890 | 0.4917 | |||||
| 0.0024 | 4.00 | |||||||
| 0.0009 | 10.00 | |||||||
| 0.1985 | 0.2001 | 0.7500 | ||||||
| 0.0081 | 1 | 1.249 | ||||||
| 0.0103 | 0.010 | 2.999 | ||||||
| 0.0556 | 0.057 | 2.456 | ||||||
| 0.0489 | 0.0499 | 2.200 | ||||||
| 0.0113 | 0.011501 | 1.739 | ||||||
| 0.1958 | 0.200 | 2.100 | ||||||
| 0.5037 | 0.5004 | 0.7400 | ||||||
| 0.1106 | 0.1003 | 10.59 | ||||||
| Dengue | 10 | 9.6514 | 9.9995 | 0.3538 | ||||
| 30 | 30.042 | 30.001 | 0.1400 | |||||
| 0.0551 | 0.055 | 0.18 | ||||||
| 0.0495 | 00499 | 1.00 | ||||||
| 1.003 | 0.9902 | 1.31 | ||||||
| 0.0558 | 0.057 | 2.1052 | ||||||
| 0.01952 | 0.0195 | 0.1025 | ||||||
| 0.0163 | 0.016 | 1.874 | ||||||
| 0.5219 | 0.5301 | 1.528 | ||||||
| 0.2004 | 0.2 | 0.199 | ||||||
| 0.1013 | 0.1001 | 1.299 | ||||||
| Ebola | 3.5474 | 2.532 | 0.6317 | |||||
| 0.0118 | 0.0120 | 5.5134 | ||||||
| 0.4629 | 0.46201 | 0.2784 | ||||||
| 0.0866 | 0.0833 | 3.9320 | ||||||
| 0.2392 | 0.2380 | 3.6124 | ||||||
| 0.6534 | 0.6497 | 0.5624 | ||||||
| 0.0906 | 0.0999 | 9.400 | ||||||
| 0.4750 | 0.4699 | 1.0638 | ||||||
| 0.1199 | 0.12499 | 4.079 | ||||||
| 0.4169 | 0.42003 | 0.7380 | ||||||
| 0.5074 | 0.4998 | 1.479 | ||||||
| 0.0809 | 0.08207 | 1.3416 | ||||||
| 0.0704 | 0.070 | 0.5714 | ||||||
| Anthrax | 0.0032 | 0.00332 | 1.2043 | |||||
| 0.0017 | 0.001667 | 0.5754 | ||||||
| 0.0999 | 0.100 | 0.100 | ||||||
| 0.4979 | 0.5001 | 0.420 | ||||||
| 0.1014 | 0.1003 | 1.400 | ||||||
| 0.0101 | 0.0100 | 0.999 | ||||||
| 0.0995 | 0.0999 | 0.500 | ||||||
| 0.1429 | 0.14285 | 0.030 | ||||||
| 0.0505 | 0.0500 | 1.002 | ||||||
| 100 | 98.73 | 100.005 | 1.269 | |||||
| 0.0199 | 0.0199 | 0.499 | ||||||
| 0.1006 | 0.1004 | 0.6014 | ||||||
| Polio | 0.0199 | 0.020 | 0.4995 | |||||
| 0.5007 | 0.5002 | 0.140 | ||||||
| 18 | 17.9751 | 18.003 | 0.135 | |||||
| 36 | 35.9541 | 36.007 | 0.1388 | |||||
| 40 | 39.9814 | 40.005 | 0.050 | |||||
| 90 | 89.4736 | 89.994 | 0.5888 | |||||
| 0 | 0.0019 | 0.0019 | ||||||
| 0 | -0.0004 | 0.0004 | ||||||
| Measles | 0.0198 | 0.0200 | 0.999 | |||||
| 0.2633 | 0.2801 | 5.9642 | ||||||
| 100 | 100.59 | 100.003 | 0.5900 | |||||
| 36.18 | 36.007 | 0.9486 | ||||||
| 0.5116 | 0.5001 | 2.32 | ||||||
| 0.3965 | 0.4 | 1.6865 | ||||||
| 0.4986 | 0.5001 | 0.2800 | ||||||
| 0.0963 | 0.1007 | 3.6036 | ||||||
| 0.0502 | 0.05 | 0.4098 | ||||||
| 0.5967 | 0.6004 | 0.5486 | ||||||
| 0.2969 | 0.3 | 2.3087 | ||||||
| Zika | 18 | 18.821 | 18.006 | 4.5611 | ||||
| 5 | 4.9621 | 5.0009 | 0.7600 | |||||
| 0.2014 | 0.2003 | 0.6999 | ||||||
| 10 | 9.965 | 10.001 | 0.3049 | |||||
| 0.2009 | 0.2006 | 0.449 | ||||||
| 0.0497 | 0.05 | 0.6003 | ||||||
| 0.1412 | 0.1427 | 1.16 | ||||||
| 0.0725 | 0.0714 | 1.499 | ||||||
Parameter-wise statistics for inferred-LSTM and finetuned-PINN
| LSTM-inference | finetuned-PINN | |||||
| Parameter | Range | Mean | Std. Dev | Mean | Std. Dev | |
| Covid | 1.04 | 0.15 | ||||
| 0.18 | 0.03 | |||||
| 0.99 | 0.02 | |||||
| HIV | 0.0109 | 0.008 | ||||
| 2.5614 | 0.3917 | |||||
| 0.5564 | 0.0318 | |||||
| 0.7548 | 0.0147 | |||||
| 0.8767 | 0.0435 | |||||
| 2.1614 | 0.1947 | |||||
| 0.0878 | 0.0314 | |||||
| 0.4519 | 0.041 | |||||
| 2.031 | 0.414 | |||||
| 1.6514 | 0.0056 | |||||
| Small Pox | 4.4817 | 1.0814 | ||||
| 2.136 | 0.465 | |||||
| 1 | 0.775 | 0.064 | ||||
| 2 | 3.3954 | 1.0314 | ||||
| 0.619 | 0.155 | |||||
| 2.235 | 1.16 | |||||
| 4.175 | 2.19 | |||||
| 4.523 | 2.74 | |||||
| Tuberculosis | 1.1936 | 0.043 | ||||
| 2.5617 | 0.0716 | |||||
| 2.5514 | 0.3926 | |||||
| 2.9147 | 0.1007 | |||||
| 7.0414 | 0.3591 | |||||
| 0.5115 | 0.0321 | |||||
| 5.3147 | 0.3628 | |||||
| 4.0225 | 0.7762 | |||||
| 0.0184 | 0.0065 | |||||
| Pneumonia | 1.165 | 0.134 | ||||
| 0.6514 | 0.2014 | |||||
| 0.5017 | 0.0091 | |||||
| 6.6911 | 1.5614 | |||||
| 0.0514 | 0.0412 | |||||
| 5.218 | 0.631 | |||||
| 1.054 | 0.365 | |||||
| 1.555 | 0.008 | |||||
| 3.871 | 0.514 | |||||
| 5.591 | 1.135 | |||||
| 0.0004 | 0.0001 | |||||
| 1.835 | 0.3217 | |||||
| 3.162 | 0.821 | |||||
| 0.756 | 0.026 | |||||
| 0.642 | 0.115 | |||||
| 3.311 | 0.515 | |||||
| 0.4334 | 0.1124 | |||||
| 0.4251 | 0.0514 | |||||
| 0.3014 | 0.0314 | |||||
| 1.1129 | 0.128 | |||||
| 2.336 | 0.217 | |||||
| Dengue | 0.497 | 0.025 | ||||
| 0.333 | 0.117 | |||||
| 0.8325 | 0.0469 | |||||
| 1.265 | 0.4112 | |||||
| 0.6317 | 0.072 | |||||
| 9.092 | 0.464 | |||||
| Ebola | 0.6525 | 0.0759 | ||||
| 4.165 | 1.114 | |||||
| 0.2256 | 0.1035 | |||||
| 3.265 | 0.551 | |||||
| 3.157 | 0.556 | |||||
| 0.3911 | 0.393 | |||||
| 8.815 | 0.45 | |||||
| 0.3161 | 0.1014 | |||||
| 3.321 | 0.469 | |||||
| 1.078 | 0.1015 | |||||
| 3.963 | 0.062 | |||||
| 1.1374 | 0.0521 | |||||
| 0.8122 | 0.081 | |||||
| Anthrax | 1.016 | 0.085 | ||||
| 0.6951 | 0.1524 | |||||
| 2.2813 | 0.3621 | |||||
| 0.8561 | 0.2003 | |||||
| 2.1536 | 0.2718 | |||||
| 3.9365 | 1.5216 | |||||
| 1.1954 | 0.2008 | |||||
| 1.773 | 0.616 | |||||
| 2.2856 | 0.1062 | |||||
| 0.6117 | 0.0352 | |||||
| 2.9114 | 2.2214 | |||||
| 3.1815 | 1.774 | |||||
| Polio | 0.0051 | 0.0018 | ||||
| 0.242 | 0.071 | |||||
| 0.3915 | 0.018 | |||||
| 0.3714 | 0.033 | |||||
| 0.6116 | 0.0254 | |||||
| 0.6115 | 0.0515 | |||||
| 0.0003 | 0.0001 | |||||
| 0.0003 | 0.0002 | |||||
| Measles | 1.514 | 0.158 | ||||
| 2.614 | 0.723 | |||||
| 2.515 | 0.365 | |||||
| 3.015 | 0.176 | |||||
| 0.0471 | 0.0115 | |||||
| 0.621 | 0.153 | |||||
| 0.1757 | 0.106 | |||||
| 0.0555 | 0.012 | |||||
| 0.3516 | 0.0514 | |||||
| 0.5115 | 0.0341 | |||||
| 2.222 | 0.695 | |||||
| Zika | 0.3014 | 0.1112 | ||||
| 4.935 | 0.685 | |||||
| 0.1762 | 0.085 | |||||
| 0.159 | 0.014 | |||||
| 0.4425 | 0.0319 | |||||
| 0.358 | 0.264 | |||||
| 1.081 | 0.362 | |||||
| 1.355 | 0.415 | |||||