Ultrafast dynamics of optically excited charge carriers in the room-temperature antiferromagnetic semiconductor -MnTe
Abstract
We report on time-resolved optical and terahertz ultrafast spectroscopy of charge-carrier dynamics in the room-temperature antiferromagnetic semiconductor -MnTe. By optically pumping the system with 1.55 eV photons at room temperature, we excite charge carriers in the conduction band through the indirect band gap and investigate dynamical response of the nonequilibrium states using optical as well as terahertz transmission probes. Three relaxation processes are revealed by their characteristic relaxation times of the order of 1, 10, and 100 ps, whose exact values are function of the pump fluence. For high pump fluences nonlinear dependence on the pump fluence is observed both in the optical and terahertz probes.
I Introduction
Semiconductors with long-range antiferromagnetic order and zero net magnetic moment are promising versatile candidates for applications in spintronics [1, 2]. Especially for opto-spintronic applications the potential of antiferromagnetic semiconductors has not been fully investigated so far [3]. Hexagonal -MnTe is a representative antiferromagnetic semiconductor which can host a long-range antiferromagnetic order at room temperature because of its relatively high Néel temperature K [4]. A wide range of interesting magnetic properties and related functionalities have been reported recently in this material (see e.g. [5, 6, 7, 8, 9, 10, 11, 12, 13]).
The hexagonal crystalline structure of -MnTe with a space group of is constituted by alternating hexagonal layers of Mn and Te atoms [14, 12]. Below the Mn spins within the hexagonal layers are aligned ferromagnetically, while along the c axis these layers are coupled antiferromagnetically [15]. The magnetic phase transition at manifests not only as a peak in specific heat [4], but also as a pronounced change of electric resistivity and thermopower [7]. Below anisotropic magnetoresistance and anomalous Hall effect have been reported [5, 11], which also indicate coupling between magnetic and charge degrees of freedom. Moreover, coupling between spin and lattice was recently evidenced by optical spectroscopic studies [8, 9]. By optically pumping the system with a 2.4 eV laser pulse the magnetic response was probed by measuring time-resolved polarization rotation of another laser pulse of 1.72 eV [9]. While the change of polarization can be associated with the magneto-optic Faraday effect, an additional oscillatory behavior at a frequency of 5.3 THz was found from the probe beam [9], which corresponds to an optical phonon mode in -MnTe [16].
The experimentally determined indirect band gap in -MnTe is about 1.27–1.46 eV depending on temperature [17, 5, 8]. This value is consistent with ab initio band structure calculations [18, 11]. In the fabrication of heterostructures, -MnTe has been used as exchange bias for topological insulators and metals [6, 10], and was also found to affect the properties of superconductors [13]. The magnetic, electric, and thermal properties of -MnTe are sensitive to chemical doping [12] and external conditions [19]. For example, by 5% Li doping the spin order is tuned from in-plane to c-axis orientation [12]. At the same time, thermopower and electric resistivity are reduced by a factor of more than 50% and 70%, respectively [7]. Comparing with single crystals, -MnTe thin films grown on a substrate can exhibit a lower Néel temperature and a larger band gap [19].
In this work we investigate the ultrafast dynamics of optically excited charge carriers above the band gap in -MnTe at room temperature using both terahertz and optical probe beams. Relaxation processes are revealed by their characteristic relaxation time scales. While a linear dependence of the optical and terahertz response on pump fluence is found in the low-fluence limit, we observe a clear nonlinear dependence at high fluences. Our studies provide a systematic characterization of the ultrafast charge-carrier dynamics in -MnTe.
II Experimental details
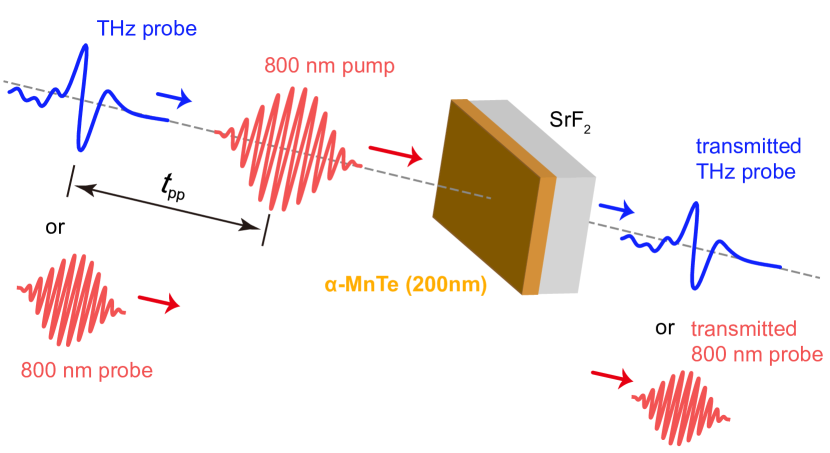
In our time-resolved pump-probe spectroscopic experiment, 800 nm laser pulses (corresponding to 1.55 eV in photon energy) from a Ti:Sapphire laser system (1 kHz, 100 fs) are used to excite the -MnTe sample (see Fig. 1 for an illustration). To probe the response of the optically excited states, we synchronize terahertz or 800 nm pulses with the pump pulses. Transmitted terahertz field or 800 nm intensity is recorded as a function of the tunable time delay between the pump and probe pulses. The terahertz probe pulses are generated using a LiNbO3 crystal [20] and gate-detected by electro-optic sampling with a 0.5 mm thick 110-cut ZnTe crystal [21]. The transmission of the 800 nm probe beam is measured by using a balanced photodetector. For the measurements an -MnTe thin-film sample with a thickness of 200 nm is epitaxially grown on a (111) oriented SrF2 substrate. All measurements are performed at room temperature.
III Experimental results
III.1 Optical-pump optical-probe measurements
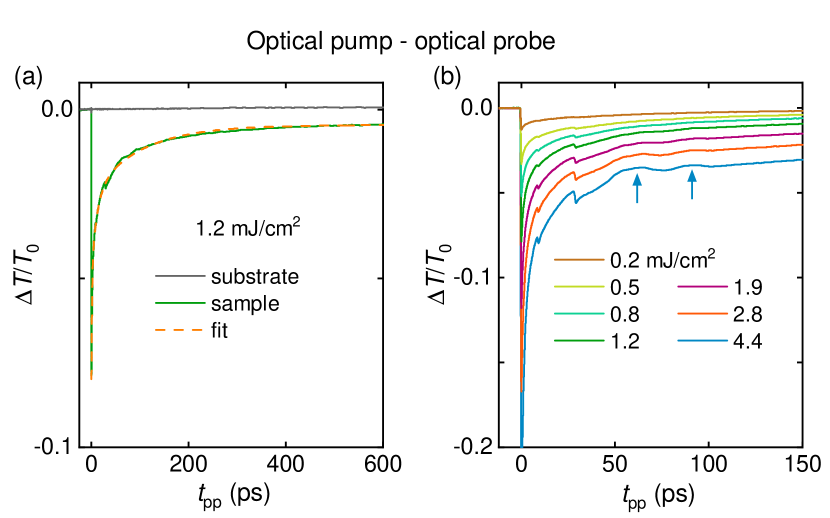
In order to study the relaxation dynamics of the excited charge carriers in -MnTe, we first use 800 nm laser pulses to probe the material after an excitation by 800 nm pulses. Fig. 2(a) displays the pump induced relative changes of transmission for a pump fluence of 1.2 mJ/cm2 through -MnTe on a SrF2 substrate, and through a bare substrate for reference. The bare substrate does not exhibit a detectable pump-induced response, therefore the pump-probe response obtained in our experiment is primarily from the -MnTe thin film. Due to the optical pump, the transmission at 800 nm drops by about 10% at zero pump-probe delay ps, which is followed by a continuous increase of the transmission towards the value of the equilibrium state.
The results for various pump fluences are presented in Fig. 2(b). With increasing pump fluence the pump induced changes are enhanced and the relaxation of the system becomes slower. For higher fluences than 1.9 mJ/cm2, one can clearly see oscillation-like behavior, as marked by the two arrows, which damps out after 100 ps. For ps, the two kinks around 10 ps and 30 ps are caused by a back-reflection of the laser pulse in the sample and by a parasitic post-pulse from the laser system, respectively. Both of them blur the observation of additional oscillation maxima at smaller . Since the time difference between the two observed maxima is about 28.3 ps, corresponding to a rather low frequency of 35 GHz, the oscillation-like behavior is likely due to acoustic phonons excited by the impact of the high laser fluence.
III.2 Optical-pump terahertz-probe measurements
Since the energy of terahertz photons is rather low (1 THz 4 meV) in comparison with 800 nm (1.55 eV) photons, the terahertz photons cannot induce interband transitions but are more sensitive to intraband dynamics [22, 23, 24, 25, 26]. Thus, by using terahertz probe beams we can provide complementary information on the ultrafast charge carrier dynamics in -MnTe. To comprehensively characterize the nonequilibrium dynamical response, we use both single-cycle and multi-cycle THz pulses, which are broad- and narrowband in frequency domain, respectively, to probe the optically excited states.
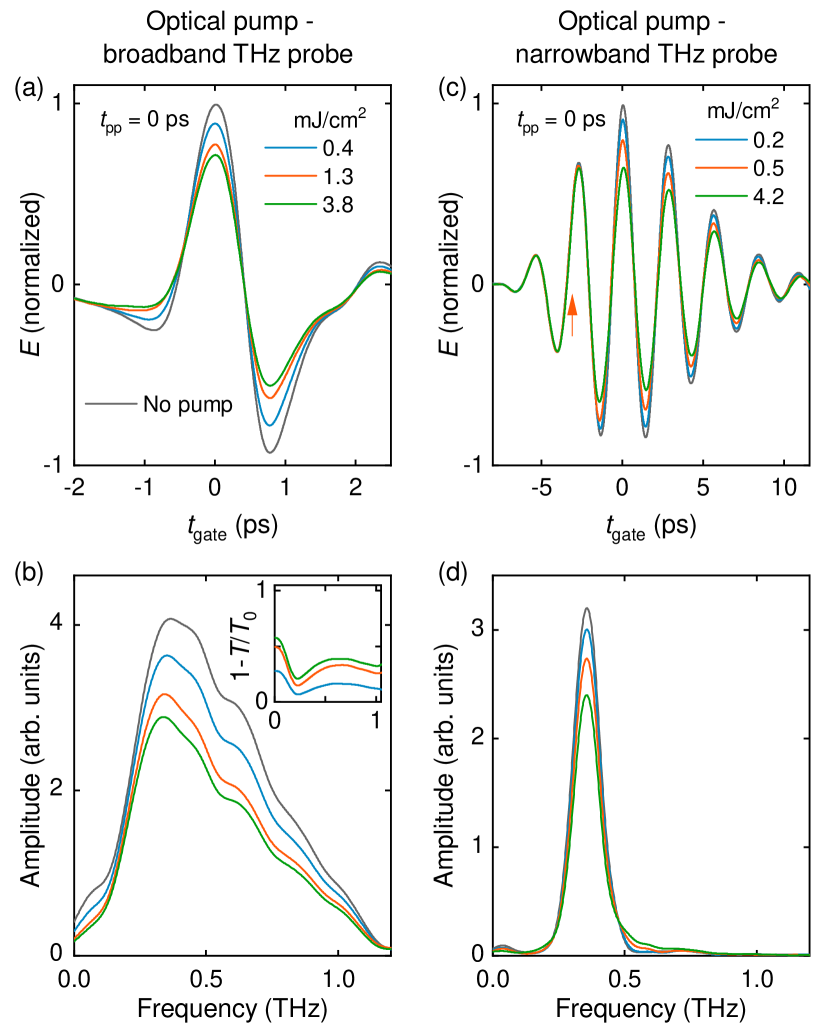
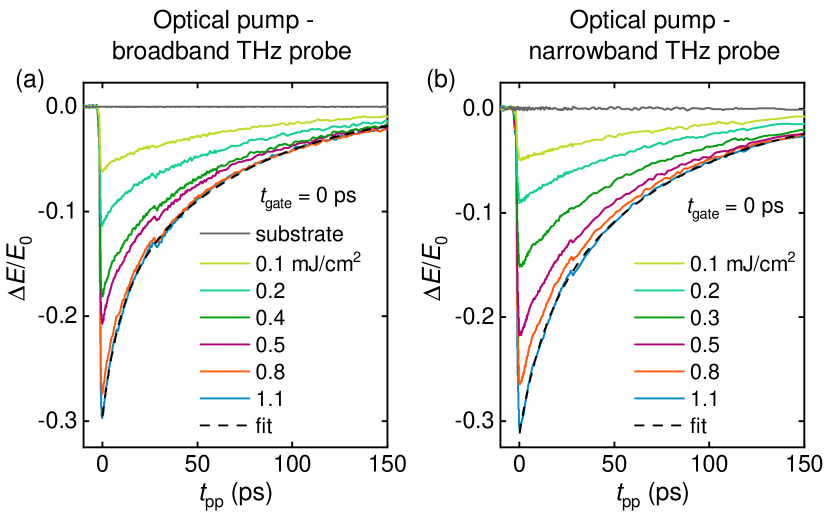
Figure 3(a) and 3(b) display the optically induced changes of the transmitted terahertz electric field for single-cycle and multi-cycle THz pulses, respectively, at a gate time delay ps, which means the gate laser pulse overlap with the peak-field position of the THz pulses in time. In the frequency domain, the spectrum of the broadband probe beam extends from about 0.1 to 1 THz [see Fig. 4(b)], while the narrowband spectrum is centered around 0.35 THz as a corresponding bandpass filter with 20% FWHM is used [see Fig. 4(d)]. The pump induced changes are qualitatively similar for the broad- and narrowband probes. The changes are negative, corresponding to a reduced transmission of the THz pulses due to the photoexcitation. For a pump fluence around 1 mJ/cm2, the maximum change of the probe pulses can be as high as 30%.
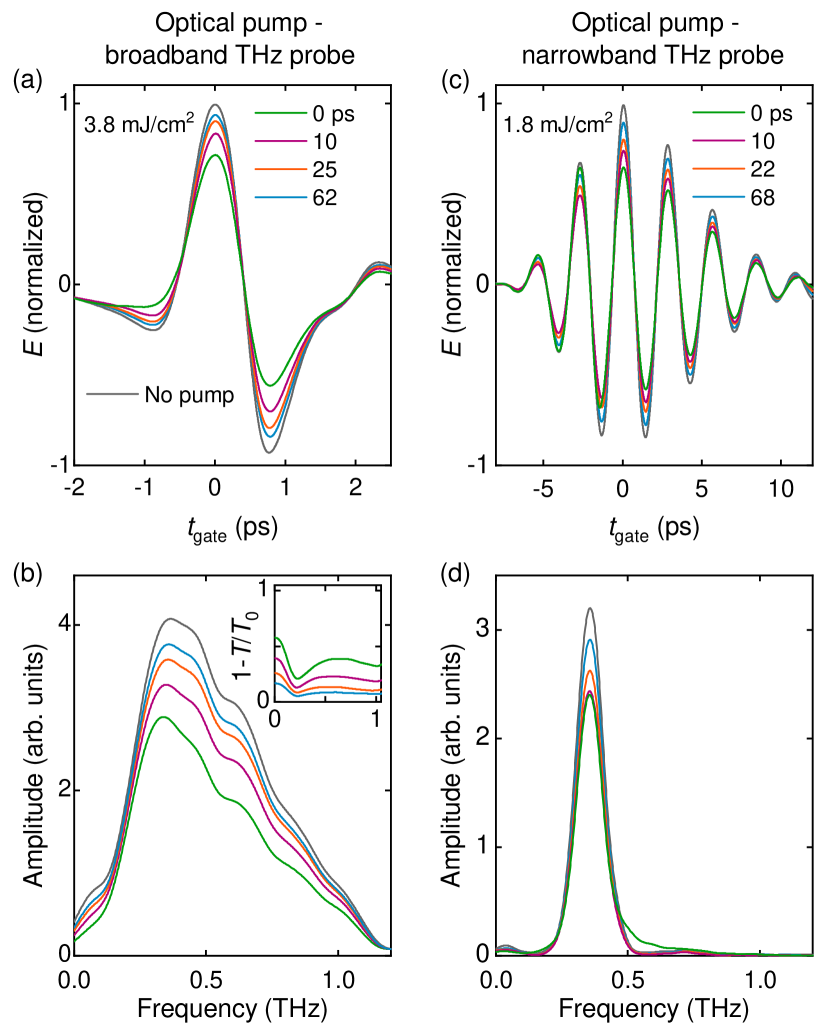
The pump-induced changes of the terahertz response can be further characterized by measuring of the transmitted terahertz waveforms in the time domain, which are shown in Fig. 4(a) and 4(c) for selected pump fluences and ps. The pump-probe time delay of ps is chosen corresponding to the maximum change induced by the pump pulse (see Fig. 3). Fourier transformation of the time-domain traces provides the spectra in frequency domain, which are presented in Fig. 4(b) and 4(d), respectively, for the broad- and narrowband probes. After the optical excitation the system becomes more absorptive not only for the narrowband probe but in the whole available terahertz frequency range. The optically induced absorption is already very evident for a relatively small pump fluence, e.g. 0.2 mJ/cm2 in Fig. 4(d). With increasing fluence the changes are however not linear, a quantitative discussion of which will be provided below (see Fig. 7). In the inset of Fig. 4(b), we present the pump-induced transmission changes in frequency domain for various pump fluences, where denotes the transmission without pump. The increase towards the low-frequency limit is expected as a Drude-type metallic response of optically excited charge carriers. Such response is stronger for higher pump fluence, in line with the enhanced population of photoinduced charge carriers. We shall note that for a far-from-equilibrium system, the Drude model may not necessarily provide a valid description of a metallic response.
Furthermore, to probe the relaxation dynamics we measure the changes of the terahertz waveforms at different pump-probe delays after ps, which are summarized in Fig. 5. For a fixed pump fluence of e.g. 3.8 mJ/cm2 [Fig. 5(a)(b)], the pump-induced changes reduce monotonically with increasing pump-probe delay for the whole THz waveform in time domain and also for the whole spectral range in frequency domain. A similar evolution of the transmitted terahertz waveform with pump-probe delay is observed for the narrowband probe [Fig. 5(c)(d)]. As reflected by time-dependence evolution of in the inset of Fig. 5(b) the Drude-type metallic response decreases with increasing pump-probe delay. By comparing Fig. 5 and Fig. 4 phenomenologically, one can see that the effects of reducing pump fluence are similar to that of increasing pump-probe delay. This qualitatively reflects the fact that both variations lead to a decrease of the optically excited charge carriers in the nonequilbrium states. However, such qualitative observation is valid essentially only in the linear regime. As we will discuss below, a nonlinear dependence regime can be found by a quantitative analysis of the experimental data.
IV Discussion
For the bare SrF2-substrate under the 800 nm pump, both the 800 nm and the THz responses are essentially zero (see Fig. 2 and Fig. 3). These are consistent with the fact that the pump photon energy of 1.55 eV is much smaller than the band gap of about 9–10 eV in SrF2 [27]. The observed pump-probe signals reflect the dynamical response of the optically excited charge carriers in the -MnTe thin films.
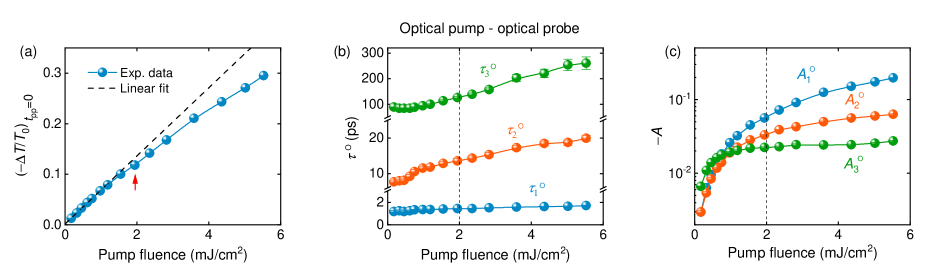
To quantify the 800 nm response of the nonequilibrium states, we plot the optically induced maximum change of the 800 nm transmission versus pump fluence in Fig. 6(a). For low pump fluences we can fit the fluence dependence by a linear function, as shown by the dashed line in Fig. 6(a)]. However, above 2 mJ/cm2, it clearly shows that the experimental data deviate evidently from the linear dependence.
To provide a further quantitative analysis of the experimental data, we simulate the relaxation behavior of the optically induced changes after ps by a sum of the exponential functions , where represents the characteristic relaxation time of different relaxation processes and is the corresponding amplitude. For the 800 nm (Fig. 2) and THz probes (Fig. 3), denotes 800 nm transmission and transmitted THz electric field, respectively. We find that the relaxation behavior probed by 800 nm transmission and THz transmission should be simulated by three and two relaxation functions, respectively.
A representative fit by three exponential functions to the 800 nm probe data is shown in Fig. 2(a). The obtained three relaxation times , , and are presented in Fig. 6(b) as a function of pump fluences. The three relaxation processes are characterized by very different relaxation times, which are of the order of ps, ps, and ps, respectively, at the lowest fluences. With increasing fluence, they increase continuously to about 2, 20, and 300 ps, respectively, at about 6 mJ/cm2. The corresponding amplitudes , and obtained from the fits are presented in Fig. 6(c). It evidently shows that the faster decaying process contributes a more dominant amplitude change. We should note that at the highest fluences due to the oscillation behavior [see Fig. 2(b)] the fit is rather a parameterization of the data. Although the obtained values of the relaxation times have larger uncertainty, they are still different by orders of magnitude, which clearly distinguish the three relaxation processes. The obtained relaxation times , , and are characteristic for processes involving electron-phonon scattering, phonon-phonon scattering, and heat diffusion, respectively. While quantitatively these values are consistent with those reported from 2.4 eV-pump 1.7 eV-probe measurements [9], we note that the THz pulses probe intraband processes whereas the 1.7 eV probe involved rather interband transitions.
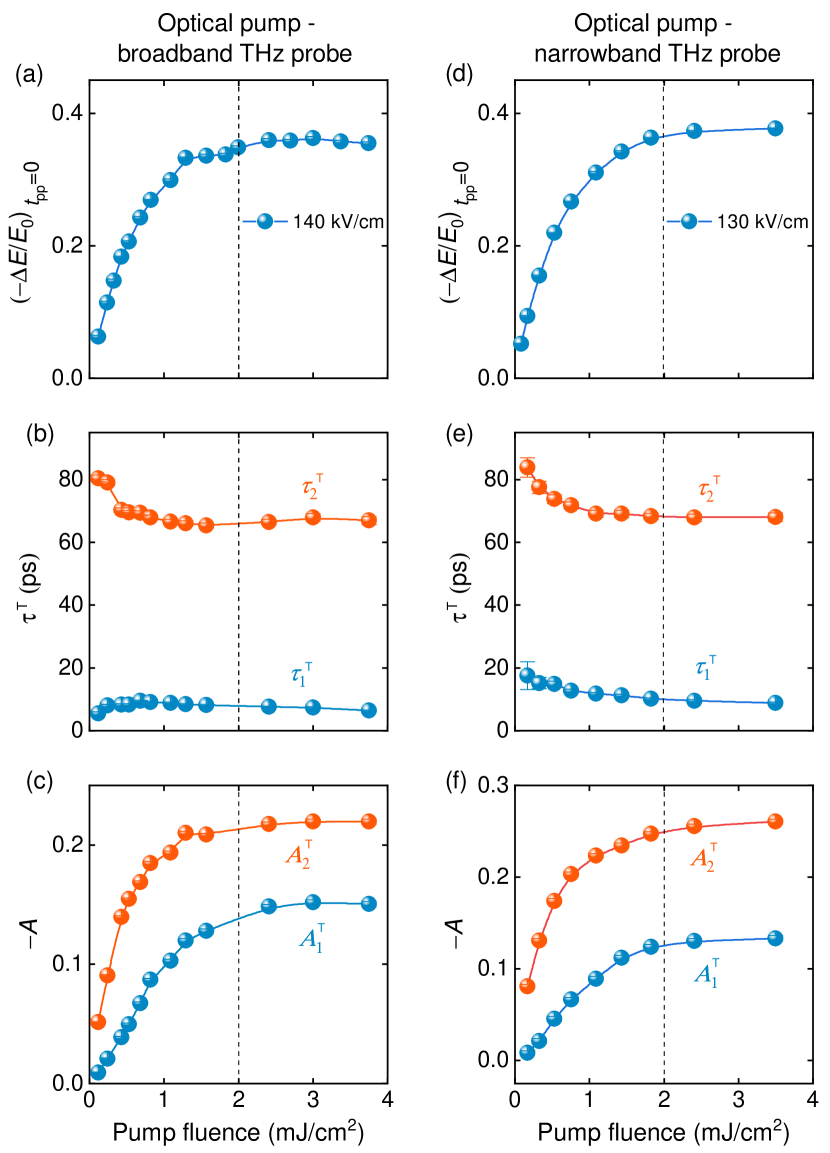
In contrast to the optical probe, we find that our terahertz probe is sensitive to only the two slower relaxation processes. As shown in Fig. 3, the relaxation behaviors can be fitted by a sum of two exponential relaxation functions, whose characteristic relaxation times are summarized in Fig. 7(b) and 7(e) for the broad- and narrowband THz probes, respectively, with the corresponding amplitudes presented in Fig. 7(c) and 7(f). For the two different probes, the obtained values of the relaxation times are similar. At the lowest fluence is about 80 ps which decreases slightly with increasing fluence and levels off above 2 mJ/cm2. The values of are about ps at high fluences, whereas at the lowest fluence they are slightly different for the broad- and the narrowband probe beams where the fit uncertainty is also larger due to the smaller signals.
The level-off of and occurs not only concomitantly with the appearance of the nonlinear dependence observed in the 800 nm probe [see Fig. 6(a)], but is also accompanied by a saturation-like feature in the terahertz response. As shown in Fig. 7(a) and 7(d), the pump induced maximum change of the transmitted electric field exhibits a saturation above the pump fluence of 2 mJ/cm2, while below this fluence the dependence increases monotonically.
For -MnTe the pump photon energy of 1.55 eV is just above the indirect band gap of 1.46 eV. The observed reduction of 800 nm and THz transmission is clear evidence of the optically excited charge carriers. Phenomenologically, the dependences of the THz probe on the pump fluence (Fig. 4) and on the pump-probe delay (Fig. 5) look very similar. At lower pump fluences the THz transmission is relatively higher (Fig. 4), because fewer charge carriers are excited. Also for longer pump-probe delays the THz transmission is relatively higher (Fig. 5), because an increased portion of the excited charge carriers have relaxed already. These qualitative dependencies hold for both the broad- and narrowband probes, at least for the available THz spectral range.
One possible reason for the observed nonlinear behavior in the 800 nm probe and in the terahertz probe could be the Pauli repulsion of the excited electrons. This effect may become evident only for sufficiently high density of optically excited charge carriers at high pump fluences. At the same time, for this indirect bandgap semiconductor, phonons should be involved to assist the interband excitations, therefore the available density of states for the involved phonons could be another limiting factor, which might lead to the observed nonlinear dependence at high fluences.
Since our experiment was carried out at a room temperature of 293 K, not far below K of a bulk -MnTe crystal [4], the magnetic moments remain largely disordered. For an -MnTe thin film previous studies showed that anisotropic magnetoresistance disappears already at 285 K [5], suggesting that in a thin film may be even lower than 285 K. Therefore, in the nonequilibrium dynamics we probed the majority of the magnetic degrees of freedom is essentially not involved. This means that to investigate magnetic dynamics, it is necessary to perform the measurements at much lower temperatures where the sublattice magnetization is strongly enhanced (see e.g. [19]).
In contrast to earlier time-resolved spectroscopic studies using a 2.4 eV pump pulse [9] which excited an optical phonon mode of about 5 THz ( meV) [16], we resolve rather an acoustic phonon-like feature at 35 GHz. The difference may result from the fact that the energy of the 2.4 eV photons was sufficiently high to allow various possible interband excitation mechanisms, whereas the photon energy of 1.55 eV is only slightly larger than the indirect band gap, which cannot trigger the dynamical processes involving the 5 THz optical phonons.
To conclude, we have studied the ultrafast dynamics of optically excited charge carriers in the antiferromagnetic semiconductor -MnTe at room temperature, by performing time-resolved 800 nm-pump terahertz-probe and 800 nm-pump 800 nm-probe spectroscopic measurements as a function of pump-probe delay for various pump fluences. Characteristic relaxation processes are identified not only in the low-fluence limit where a linear dependence occurs, but also tracked at high fluences beyond the linear regime. Our work motivates further investigation of the charge carrier dynamics deep into the antiferromagnetic phase.
Acknowledgements.
We thank D. Kriegner and K. Vỳbornỳ for helpful discussions. We acknowledge support by the European Research Council (ERC) under the Horizon 2020 research and innovation programme, Grant Agreement No. 950560 (DynaQuanta).References
- Jungwirth et al. [2016] T. Jungwirth, X. Marti, P. Wadley, and J. Wunderlich, Nature nanotechnology 11, 231 (2016).
- Baltz et al. [2018] V. Baltz, A. Manchon, M. Tsoi, T. Moriyama, T. Ono, and Y. Tserkovnyak, Reviews of Modern Physics 90, 015005 (2018).
- Němec et al. [2018] P. Němec, M. Fiebig, T. Kampfrath, and A. V. Kimel, Nature Physics 14, 229 (2018).
- Kelley [1939] K. K. Kelley, Journal of the American Chemical Society 61, 203 (1939).
- Kriegner et al. [2016] D. Kriegner, K. Vỳbornỳ, K. Olejník, H. Reichlová, V. Novák, X. Marti, J. Gazquez, V. Saidl, P. Němec, V. Volobuev, et al., Nature communications 7, 11623 (2016).
- He et al. [2018] Q. L. He, G. Yin, A. J. Grutter, L. Pan, X. Che, G. Yu, D. A. Gilbert, S. M. Disseler, Y. Liu, P. Shafer, B. Zhang, Y. Wu, B. J. Kirby, E. Arenholz, R. K. Lake, X. Han, and K. L. Wang, Nature Communications 9, 2767 (2018).
- Zheng et al. [2019] Y. Zheng, T. Lu, M. M. H. Polash, M. Rasoulianboroujeni, N. Liu, M. E. Manley, Y. Deng, P. J. Sun, X. L. Chen, R. P. Hermann, D. Vashaee, J. P. Heremans, and H. Zhao, Science Advances 5, eaat9461 (2019).
- Bossini et al. [2020] D. Bossini, M. Terschanski, F. Mertens, G. Springholz, A. Bonanni, G. S. Uhrig, and M. Cinchetti, New Journal of Physics 22, 083029 (2020).
- Bossini et al. [2021] D. Bossini, S. Dal Conte, M. Terschanski, G. Springholz, A. Bonanni, K. Deltenre, F. Anders, G. S. Uhrig, G. Cerullo, and M. Cinchetti, Physical Review B 104, 224424 (2021).
- Wang et al. [2021] F. Wang, H. Yang, H. Zhang, J. Zhou, J. Wang, L. Hu, D.-J. Xue, and X. Xu, Nano Letters 21, 7684 (2021).
- Gonzalez Betancourt et al. [2023] R. D. Gonzalez Betancourt, J. Zubáč, R. Gonzalez-Hernandez, K. Geishendorf, Z. Šobáň, G. Springholz, K. Olejník, L. Šmejkal, J. Sinova, T. Jungwirth, S. T. B. Goennenwein, A. Thomas, H. Reichlová, J. Železný, and D. Kriegner, Phys. Rev. Lett. 130, 036702 (2023).
- Moseley et al. [2022] D. H. Moseley, K. M. Taddei, J. Yan, M. A. McGuire, S. Calder, M. M. H. Polash, D. Vashaee, X. Zhang, H. Zhao, D. S. Parker, et al., Physical Review Materials 6, 014404 (2022).
- Yao et al. [2022] X. Yao, A. R. Mazza, M.-G. Han, H. T. Yi, D. Jain, M. Brahlek, and S. Oh, Nano Letters 22, 7522 (2022).
- Efrem D'Sa et al. [2005] J. Efrem D'Sa, P. Bhobe, K. Priolkar, A. Das, S. Paranjpe, R. Prabhu, and P. Sarode, Journal of Magnetism and Magnetic Materials 285, 267 (2005).
- Kunitomi, Nobuhiko et al. [1964] Kunitomi, Nobuhiko, Hamaguchi, Yoshikazu, and Anzai, Shuichiro, J. Phys. France 25, 568 (1964).
- Onari et al. [1974] S. Onari, T. Arai, and K. Kudo, Solid State Communications 14, 507 (1974).
- Ferrer-Roca et al. [2000] C. Ferrer-Roca, A. Segura, C. Reig, and V. Muñoz, Phys. Rev. B 61, 13679 (2000).
- Wei and Zunger [1987] S.-H. Wei and A. Zunger, Phys. Rev. B 35, 2340 (1987).
- Przezdziecka et al. [2005] E. Przezdziecka, E. Kaminska, E. Dynowska, R. Butkute, W. Dobrowolski, H. Kepa, R. Jakiela, M. Aleszkiewicz, E. Lusakowska, E. Janik, and J. Kossut, physica status solidi (c) 2, 1218 (2005).
- Hebling et al. [2002] J. Hebling, G. Almasi, I. Z. Kozma, and J. Kuhl, Optics Express 10, 1161 (2002).
- Planken et al. [2001] P. C. M. Planken, H.-K. Nienhuys, H. J. Bakker, and T. Wenckebach, J. Opt. Soc. Am. B 18, 313 (2001).
- Reinhoffer et al. [2020] C. Reinhoffer, Y. Mukai, S. Germanskiy, A. Bliesener, G. Lippertz, A. Uday, A. A. Taskin, Y. Ando, Z. Wang, and P. H. M. van Loosdrecht, Phys. Rev. Mater. 4, 124201 (2020).
- Kovalev et al. [2020] S. Kovalev, R. M. A. Dantas, S. Germanskiy, J.-C. Deinert, B. Green, I. Ilyakov, N. Awari, M. Chen, M. Bawatna, J. Ling, F. Xiu, P. H. M. van Loosdrecht, P. Surówka, T. Oka, and Z. Wang, Nature Commun. 11, 2451 (2020).
- Kovalev et al. [2021] S. Kovalev, T. Dong, L.-Y. Shi, C. Reinhoffer, T.-Q. Xu, H.-Z. Wang, Y. Wang, Z.-Z. Gan, S. Germanskiy, J.-C. Deinert, I. Ilyakov, P. H. M. van Loosdrecht, D. Wu, N.-L. Wang, J. Demsar, and Z. Wang, Phys. Rev. B 104, L140505 (2021).
- Germanskiy et al. [2022] S. Germanskiy, R. M. A. Dantas, S. Kovalev, C. Reinhoffer, E. A. Mashkovich, P. H. M. van Loosdrecht, Y. Yang, F. Xiu, P. Surówka, R. Moessner, T. Oka, and Z. Wang, Phys. Rev. B 106, L081127 (2022).
- Reinhoffer et al. [2022] C. Reinhoffer, P. Pilch, A. Reinold, P. Derendorf, S. Kovalev, J.-C. Deinert, I. Ilyakov, A. Ponomaryov, M. Chen, T.-Q. Xu, Y. Wang, Z.-Z. Gan, D.-S. Wu, J.-L. Luo, S. Germanskiy, E. A. Mashkovich, P. H. M. van Loosdrecht, I. M. Eremin, and Z. Wang, Phys. Rev. B 106, 214514 (2022).
- Myasnikova et al. [2020] A. Myasnikova, R. Shendrik, and A. Bogdanov, RSC Adv. 10, 13992 (2020).