OPDMulti: Openable Part Detection for Multiple Objects
Abstract
Openable part detection is the task of detecting the openable parts of an object in a single-view image, and predicting corresponding motion parameters. Prior work investigated the unrealistic setting where all input images only contain a single openable object. We generalize this task to scenes with multiple objects each potentially possessing openable parts, and create a corresponding dataset based on real-world scenes. We then address this more challenging scenario with OPDFormer: a part-aware transformer architecture. Our experiments show that the OPDFormer architecture significantly outperforms prior work. The more realistic multiple-object scenarios we investigated remain challenging for all methods, indicating opportunities for future work.
1 Introduction
Detecting the openable parts of real-world objects and predicting how the parts can move is useful in developing intelligent agents that can assist us with everyday household tasks. Consider the simple task of ‘getting a spoon from the cabinet drawer’. To achieve this, we need to identify what part of the cabinet is the drawer, that the drawer is openable, and that it opens with a translational motion. Interest in tackling this problem has led to recent work focusing on mobility prediction of articulated object parts.
Prior work on mobility prediction aims to identify moving parts of an object, and predict the motion type and parameters of each moving part from a complete mesh [10] or 3D point cloud [28, 10, 31, 26, 27]. Recent work also considered mobility prediction from partial point clouds [16] or depth images [11, 12]. These methods rely mainly on depth information as input. Another common limitation is strong category-specific assumptions or reliance on prior knowledge. For instance, Li et al. [16] assume a fixed kinematic chain (i.e. a separate model is trained for three-drawer cabinets vs two-drawer cabinets).
Recently, Jiang et al. [13] introduced the task of Openable Part Detection (OPD) where the openable parts and their corresponding motion parameters are predicted for a single articulated object from a single-view image (RGB, depth, or RGB-D). This approach is object category agnostic, as it detects an arbitrary number of openable parts using Mask R-CNN [6] and predicts motion parameters for each part independently. However, this work focus on single-object image and does not handle real-world scene layouts with potentially multiple objects, each with potentially multiple openable parts (e.g., real-world kitchens contain several cabinetry and drawer units). To study OPD in real-world scenes with multiple objects, we introduce OPDMulti, a challenging dataset of images with annotated part masks and motion parameters from real-world scenes containing multiple objects. We create this dataset by leveraging recent work on articulated 3D scenes by Mao et al. [21].
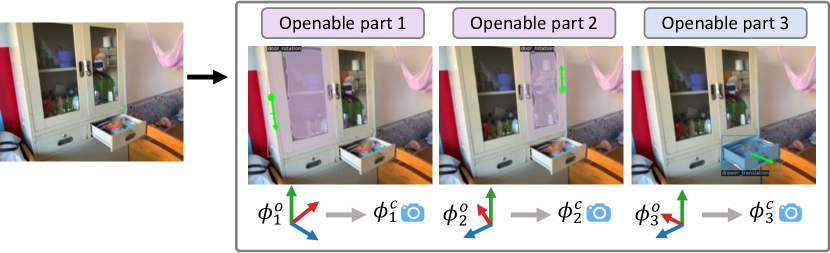
As noted in prior work [16, 13], the motion parameters of openable parts (e.g., the direction in which a drawer slides open) is strongly correlated. Since we have multiple objects in real scenes, we also need to model object pose for each part (in contrast to Jiang et al. [13] who only handle single objects). We observe that parts in a object inform the movement of other parts in the same object, and that the pose of one object can inform the pose of another. For instance, given the cabinets shown in Fig. 1, all the drawers move along the same axis, while the rotation axis of the doors is perpendicular to the translation axis of the drawers. Objects are also likely to be placed either parallel or perpendicular to each other. Thus, by leveraging features of other parts and the pose we can better detect and predict articulation parameters for each part.
We propose OpdFormer, a part-informed transformer architecture leveraging self-attention to produce more globally consistent motion predictions. The self-attention of this architecture better leverages the above observations of strong correlation between part positions, part mobility parameters, and object pose. We compare three variants of our model: predicting directly in camera coordinates, predicting parts with a naïve single global pose, and with object pose predicted per-part. We benchmark OpdFormer against prior work and show that with the stronger architecture and with per-part object pose prediction, we outperform prior methods by up to on openable part detection & motion prediction with the same R50 backbone. Performance is further improved relative to baselines using a Swin-L backbone.
In summary, we make the following contributions: i) we construct a more realistic image-dataset for OPD with multiple objects ii) we propose a part-informed transformer architecture that leverages part–part and part–object pose correlations; iii) we systematically evaluate our approach and show it achieves state-of-the-art performance on the OPD task for both the single and multi-object setting.
2 Related Work
2D instance segmentation. Instance segmentation in 2D is well-studied. Before the popularity of vision transformers, prior work adopted region proposal-based methods [5, 25, 6]. Carion et al. [1] used a transformer decoder to convert the instance segmentation task into a set prediction task with the Hungarian algorithm for a one-to-one matching loss. MaskFormer [2] further converted the problem into a mask classification problem to unify all 2D segmentation tasks (i.e. semantic segmentation, instance segmentation and panoptic segmentation) and achieved better results. Recently, Mask2Former [3] achieved state-of-the-art results in 2D instance segmentation. Our work builds on recent progress from instance segmentation, taking inspiration from transformer architectures that achieve state-of-the-art instance detection and segmentation performance.
Articulated object understanding. With the increasing interest in embodied AI, understanding articulated objects is an important research direction. A number of datasets of articulated objects have been recently introduced, including both synthetic [30, 28] and scanned datasets [13, 23, 19, 21]. These datasets have annotations of part segmentation and corresponding motion parameters. Such data has enabled data-driven methods for predicting motion parameters from 3D meshes [9] and points clouds [28, 31]. More recent work has focused on detecting articulated parts and their motion parameters from single-view point-clouds [16], images [32, 13] and videos [23, 7], which are closer to real applications. Researchers have also started to investigate how to use predicted segmentation and motion parameters to automatically create articulated objects [14, 4], including in scenes [8].
Openable part detection. Jiang et al. [13] introduced the openable part detection (OPD) task to address the articulated object motion prediction problem for single-view image inputs. In their work, they focused on images with a single main object and predicting the openable parts for that one object. Our work generalizes the OPD task to more realistic images with multiple objects. We also develop a part-informed transformer architecture that leverages object poses to predict more consistent and accurate part motions.
3 OPDMulti Task
The OPD task seeks to identify all openable parts and their motion parameters from a single-view image . Specifically, to output a set of openable parts where an openable part is defined to be a drawer, door, or lid. The output for each part is a segmentation mask , 2D bounding box , semantic label , and motion parameters specifying motion type , motion axis direction and motion origin (for revolute joints only). Jiang et al. [13] focused on single-object images, which feature one object with at least one openable part. Here, we generalize the task and create a new dataset of real-world scenes with multiple objects, each possessing potentially multiple openable parts. We call this new task and associated dataset OPDMulti, reflecting the multi-object setting.
3.1 OPDMulti dataset construction
| dataset | type | obj per frame | objects | categories | parts | frames |
| OPDSynth | synth | 1 | 683 | 11 | 1343 | 100K |
| OPDReal | real | 1 | 284 | 8 | 875 | 30K |
| OPDMulti | real | 0/1/1+ | 217 (4973) | 33 (458) | 688 (4387) | 64K |
| split | frames | none | single | multiple | parts/frame |
| train | 44002 | 31189 | 10911 | 1902 | 1.64 |
| val | 10168 | 6424 | 3055 | 689 | 1.85 |
| test | 10043 | 6818 | 2732 | 493 | 1.80 |
| total | 64213 | 44431 | 16698 | 3084 | 1.71 |
To create OPDMulti image dataset, we leverage MultiScan [21], a dataset of RGB-D reconstructions of real indoor scenes providing object and part-level annotations. We use the RGB-D video frames in this dataset along with part and part articulation annotations to create our OPDMulti dataset.
Specifically, we sample frames from RGB videos in the MultiScan dataset and project object and part segmentation masks to the image plane. We also process the annotated motion parameters and object poses to the same format as the OPDSynth and OPDReal datasets [13]. Unlike prior work, we keep the full image resolution instead of center-cropping to avoid dropping objects that appear on the sides. Since some frames may contain small or partial parts that are cropped and hard to detect, we ignore openable part annotations that cover less than of the image pixels. Overall, we use 273 scans from 116 MultiScan scenes to create our image dataset, following the MultiScan train/val/test set split.
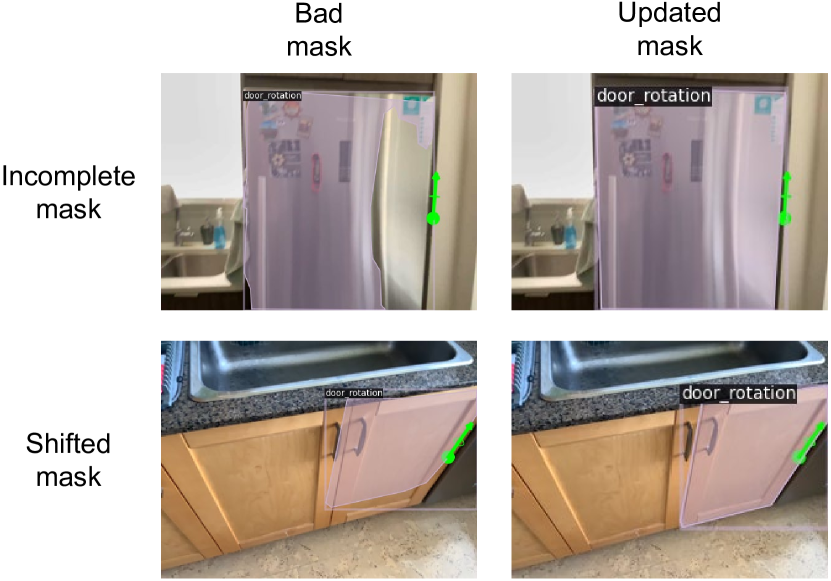
We find that some of the projected annotations are noisy and inaccurate. To ensure that our evaluation dataset is of high quality, we manually inspect all frames in the val and test splits and indicate whether they have mask or motion errors. Mask errors are typically caused by reconstruction issues (e.g., a door with glass panes is not fully reconstructed so when projected onto the image the annotated mask is incomplete). We also observe shifts in the mask for some frames if the estimated camera poses are not consistent with the final reconstruction. We find that 512 val set and 1749 test set openable part mask annotations are noisy (out of a total of 6077 val and 4704 test openable parts). For mask error cases, we manually correct the mask using the Toronto Annotation Suite [15]. See the supplement for details.
3.2 OPDMulti dataset statistics
Following OPDSynth and OPDReal [13], we focus on three openable part types (drawer, door, lid) that are common across many object categories. Tabs. 1 and 2 provides dataset statistics. Our OPDMulti contains 33 object categories with at least a door, drawer, or lid (23, 15, 8 categories respectively). Example categories include cabinets, refrigerators, wardrobes, microwaves, washing machines, nightstands, toilets, printers, and rice cookers, with a long-tailed distribution from frequent (182 cabinets) to infrequent (7 rice cookers). Since our focus is on rigid openable objects, we do not include non-rigid object such as bags in our dataset.
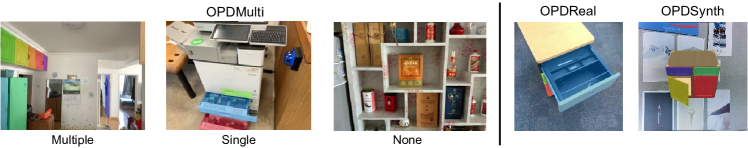
In Fig. 2 we compare the images in OPDMulti vs prior datasets. Note that images from OPDMulti are more varied with frames showing a variable number of openable objects including multiple openable objects, single openable object with natural background clutter, and frames with no openable objects. Fig. 3 shows the distribution over number of objects and location of part pixels for the images in the resulting dataset. From the inset, which shows the distribution of openable part pixels aggregated across the frames, we can see that OPDMulti has a broader part pixel distribution than OPDReal. For OPDReal, most of the openable parts are in the center while in OPDMulti the openable parts are spread more evenly across the frame. Overall, the images in OPDMulti are more diverse with both distant and close-up views and views from different angles.
4 Approach
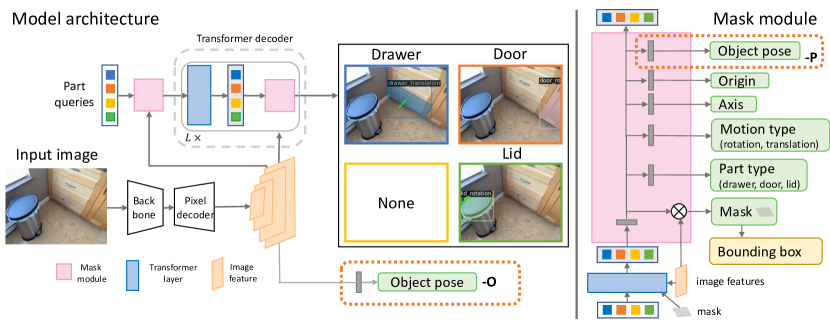
We adopt the detect-and-predict strategy for openable part detection and motion parameter estimation, following Jiang et al. [13]. Our architecture replaces the Mask R-CNN [6] detection component with Mask2Former [3]. Mask2Former uses the transformer decoder to predict instance masks and classes, matching against ground truth using the Hungarian algorithm during training. We extend the Mask2Former architecture to predict part motion parameters in the mask module, and create three variants of the architecture that predict the motion parameters using different coordinate frames. Our key differences from Jiang et al. [13] are that: 1) we replace the MaskRCNN segmentation architecture with Mask2Former; and 2) we introduce a per-part object pose prediction (instead of a global object pose prediction).
4.1 Model variants
All models eventually predict motion parameters in camera coordinates (C). However, as noted in prior work [16, 13], it is useful to predict motion parameters in the object coordinate frame as the motion axes are often parallel to one of the main axes of the object (see supplement). The object pose is used as a bridge to transform between the object coordinate frame and the camera coordinate frame.
Jiang et al. [13] used the entire image to predict a single object pose, ignoring the fact that there could be multiple objects with different poses. To alleviate this limitation, we develop two variants of our architecture for pose prediction, predicting a single global pose vs predicting a different object pose for each part. By predicting the object pose per part, we can handle multiple objects without explicitly detecting each object. This allows us to have an object-agnostic method that can generalize across object categories. In addition, we consider a base variant that predicts directly in the camera coordinates.
Camera coordinates. The base variant OpdFormer-C does not predict the object pose, and predict the motion parameters in the camera coordinate directly (see Fig. 4, without orange dashed boxes). Note that it is the direct analogue of the Mask R-CNN based baseline OPDRCNN-C from Jiang et al. [13].
Single global pose. In this variant, we predict a single global pose for all objects and parts in the input image. This is predicted directly from the image features of the entire image (see Fig. 4 dashed box with label ‘-O’). We call this variant OpdFormer-O as it is the direct analogue of the OPDRCNN-O introduced in OPD [13]. For OPDMulti, we train with the scene coordinates defining a global pose, and transform relevant motion parameters from camera coordinates to these scene coordinates.
Per-part object pose. When there are multiple objects in an image, each of the objects can have a different pose and its openable parts would have motion parameters strongly correlated with that object’s pose. To account for this, we add an additional head for each part that predicts the object’s pose (see Fig. 4 dashed box with ‘-P’ label). We call this variant OpdFormer-P and compare it against OPDRCNN-P, an extension of the MaskRCNN based model from Jiang et al. [13] to predict per-part object pose. For OPDMulti, we leverage the object oriented bounding boxes in MultiScan [21] to obtain object poses and transform motion parameters to object coordinates for training.
Parameterization. In all variants, the motion parameters and object pose are parameterized in the same way as Jiang et al. [13]’s OPDRCNN: motion axis and motion origin are 3-dim vectors and object pose is a 12-dim vector (9 for rotation and 3 for translation). Motion type prediction is trained with a cross-entropy loss and other motion parameters and object pose use a smooth L1 loss with .
4.2 Network Architecture and Losses
The overall architecture and mask module with per-part prediction heads are shown in the left and right sides of Fig. 4. Our architecture uses a Mask2Former module for part segmentation and self-attention over parts. We use the same multiscale pixel decoder and transformer decoder (with 100 queries) as in Cheng et al. [3], and an R50 backbone for fair comparison with Jiang et al. [13]’s OpdRcnn.
For the segmentation and motion losses, we add the auxiliary loss after each transformer decoder. The object pose loss is determined by the specific architecture variant and is either a single loss term or one loss term per part.
Segmentation losses. We use the same set of losses as Mask2Former [3], including the binary cross-entropy loss () and the dice loss () [22] for the mask segmentation, and cross-entropy loss () for the mask classification: . We adopt the loss weights proposed in Mask2Former, and for matched predictions and for unmatched.
Motion losses. Motion prediction losses are based on OPDRCNN [13]. We use a cross entropy loss for the motion type (), combined with smooth L1 losses for the motion axis () and motion origin (): . We also use the same loss weight ratios. Specifically, we set for our experiments.
Object pose loss. Object pose prediction is trained under the smooth L1 loss () with .
We sum all of the above losses to obtain the overall loss used during training: .
5 Experiments
We compare our proposed architecture against baselines on both single object datasets (OPDSynth, OPDReal from Jiang et al. [13]) and the new multiple object dataset we created (OPDMulti). We also conduct an analysis of part consistency on single objects and the challenges of handling multiple objects. In the main paper, we present experiments for RGB input images. See the supplement for results with depth only (D) and RGBD, and additional analysis.
5.1 Implementation details
Our architecture is based on Mask2Former [3] as implemented in Detectron2 [29]. We use the R-50 backbone Mask2Former model pretrained on COCO [18] instance segmentation to initialize our weights, and train with AdamW [20]. The learning rate and other hyperparameters match those used by Mask2Former. Our experiments are carried out on a machine with 64GB RAM and an RTX 2080Ti GPU. We train each model end-to-end for steps and pick the best checkpoint based on val set performance (+MAO). Models evaluated on OPDMulti are first pretrained on OPDReal and then finetuned on the OPDMulti train split. The OPDRCNN baselines are first pretrained on OPDSynth, then OPDReal, and finally OPDMulti.
We note that the predicted object pose rotation matrix is not guaranteed to be a valid rotation matrix. Jiang et al. [13] did not address this issue. We convert the predicted rotation matrix into a unit quaternion and back using PyTorch3D [24] to ensure a valid rotation. The results for OpdRcnn are approximately the same as without such post-processing. For OPDMulti, we use a confidence threshold of to determine whether a predicted part is valid.
5.2 Experimental setup
For single objects, we evaluate our method on two datasets introduced in OPD [13], OPDSynth and OPDReal. For multiple objects, we evaluate on OPDMulti.
Metrics. We use the evaluation metrics for part detection and motion prediction from Jiang et al. [13]. The metrics extend the traditional mAP metric for detection to the motion prediction task, including two main metrics: mAP@IoU=0.5 for the predicted part label and 2D bounding box (PDet). For each metric, the detection is further constrained by whether: motion type is matched (+M), motion type and motion axis are matched (+MA), and whether motion type, axis and origin are all matched (+MAO), within predefined error thresholds. Note that Jiang et al. [13]’s metrics were only defined for inputs with openable parts. Since we have frames with no openable parts, we measure the percentage of those we correctly predicted as having no openable parts.
Methods. We compare variants of our OpdFormer with the MaskRCNN-based OPDRCNN [13]. We compare the following variants: predicting directly in camera coordinates (-C), vs predicting a single global pose (-O) vs predicting per-part object poses (-P).
| Part-averaged mAP | |||||
| Dataset | Model | PDet | +M | +MA | +MAO |
| OPDSynth | OPDRCNN-C [13] | 74.30.27 | 72.30.29 | 40.20.09 | 36.50.17 |
| OPDRCNN-O [13] | 74.20.34 | 72.40.32 | 52.40.27 | 47.00.36 | |
| OPDRCNN-P | 73.20.64 | 71.20.69 | 51.60.47 | 44.80.32 | |
| OpdFormer-C | 77.30.40 | 74.90.42 | 48.90.23 | 43.90.09 | |
| OpdFormer-O | 77.80.54 | 75.70.47 | 57.50.15 | 52.40.35 | |
| OpdFormer-P | 79.00.23 | 76.70.23 | 58.60.94 | 53.40.28 | |
| OPDReal | OPDRCNN-C [13] | 57.60.10 | 55.50.24 | 15.60.28 | 14.70.29 |
| OPDRCNN-O [13] | 57.00.49 | 54.70.57 | 27.90.49 | 25.70.41 | |
| OPDRCNN-P | 57.60.62 | 54.70.59 | 26.90.03 | 25.10.19 | |
| OpdFormer-C | 57.91.31 | 56.01.09 | 29.70.51 | 28.30.49 | |
| OpdFormer-O | 61.80.58 | 59.40.55 | 31.20.58 | 28.90.57 | |
| OpdFormer-P | 58.80.66 | 56.20.58 | 35.40.20 | 33.70.18 | |
| OPDMulti | OPDRCNN-C [13] | 27.30.10 | 25.70.10 | 8.80.25 | 7.80.20 |
| OPDRCNN-O [13] | 20.20.42 | 18.30.62 | 3.90.07 | 0.50.12 | |
| OPDRCNN-P | 20.90.44 | 190.35 | 7.20.25 | 5.70.22 | |
| OpdFormer-C | 30.31.02 | 28.90.99 | 13.10.55 | 12.10.49 | |
| OpdFormer-O | 30.10.15 | 28.50.18 | 5.20.10 | 1.60.03 | |
| OpdFormer-P | 32.90.69 | 31.60.72 | 19.40.38 | 16.00.03 | |
| GT | |||||
| OPDRCNN-P | Miss | ||||
| Axis (origin) error | 7.537 | 2.098 | - | 6.078 (0.067) | 8.752 (0.149) |
| OpdFormer-P | |||||
| Axis (origin) error | 2.131 | 2.956 | 2.153 | 3.247 (0.019) | 1.975 (0.06) |
| GT | |||||
| OPDRCNN-P | Miss | ||||
| Axis (origin) error | 4.458 (0.013) | - | 6.329 (0.057) | 5.757 (0.056) | 8.305 (0.029) |
| OpdFormer-P | |||||
| Axis (origin) error | 2.021 (0.087) | 4.099(0.234) | 1.038 (0.058) | 1.619 (0.063) | 1.569 (0.096) |
5.3 Results
Tab. 3 evaluates the different methods on RGB input images from the val set of the three datasets. We report the mean and standard error across three runs with different seeds. See the supplement for depth and RGB-D input results, motion averaged metrics, and for performance on the test set. Fig. 5 shows example predictions on OPDMulti, and the supplement provides qualitative results on OPDSynth and OPDReal.
Our OpdFormer variants outperform the OPDRCNN baselines on all metrics. One reason is the stronger part detection (PDet) provided by the Mask2Former backbone. We note that the OpdFormer variants with the R50 backbone actually have fewer parameters than OPDRCNN methods, indicating that the performance gains are not due to increased parameters. For example, OPDRCNN-P has 46.1M parameters whereas OpdFormer-P has 42.0M parameters. This observation is similar for other OpdFormer variants and corresponding OPDRCNN baselines (see supplement).
Are camera coordinates useful? As observed in Jiang et al. [13], predicting motion parameters in object coordinates and predicting the object pose (OPDRCNN-O) outperform prediction in camera coordinates (OPDRCNN-C). This is true for the single object case (OPDSynth and OPDReal), but not for OPDMulti where the assumption of one global object coordinate does not hold.
Is having per-part object pose prediction important? When we take motion parameters into account, we see the advantage of per-part object pose predictions with the transformer-based architecture (OpdFormer-P). On the main metric (+MAO), our per-part OpdFormer-P consistently outperforms the global OpdFormer-O, which in turn outperforms OPDRCNN-O by Jiang et al. [13]. Interestingly, OPDRCNN-P does not help over OPDRCNN-O for the single object scenario.
| No AO | Single AO | Multiple AO | |||
| Model | Accuracy | PDet | +MAO | PDet | +MAO |
| OPDRCNN-C [13] | 58.6 | 43.6 | 11.8 | 37.6 | 8.6 |
| OPDRCNN-O [13] | 57.5 | 34.8 | 0.5 | 30.5 | 0.4 |
| OPDRCNN-P | 50.8 | 40.0 | 10.0 | 34.0 | 8.9 |
| OpdFormer-C | 27.3 | 60.1 | 21.9 | 36.1 | 14.6 |
| OpdFormer-O | 16.7 | 59.4 | 2.5 | 35.8 | 1.5 |
| OpdFormer-P | 35.0 | 61.4 | 28.7 | 40.2 | 15.2 |
| Pose Rotation | Pose Translation | ||||
| Dataset | Model | MedErr | Acc:5 | MedErr | Acc:0.1 |
| OPDSynth | OPDRCNN-P | 4.28 | 0.58 | 0.16 | 0.28 |
| OpdFormer-P | 2.47 | 0.78 | 0.11 | 0.46 | |
| OPDReal | OPDRCNN-P | 8.33 | 0.23 | 0.19 | 0.16 |
| OpdFormer-P | 4.96 | 0.51 | 0.14 | 0.29 | |
| OPDMulti | OPDRCNN-P | 19.86 | 0.05 | 0.27 | 0.06 |
| OpdFormer-P | 8.09 | 0.27 | 0.21 | 0.12 | |
How challenging is OPDMulti? OPDMulti is much more challenging than the single object OPDReal data. As expected, the best performing model (OpdFormer-P) for OPDMulti makes use of the per-part object pose prediction. There is a significant difference in performance between OpdFormer-P and OpdFormer-O for OPDMulti, but less for single objects. This is because in the single object scenario having one global pose is sufficient.
Analysis by number of openable objects. To better understand performance on OPDMulti we evaluate on all images in OPDMulti grouping into images with zero, one, or multiple openable (articulated) objects (AO). Tab. 4 shows that OPDRCNN-based methods are better at avoiding false predictions on images without any openable parts. For images with one or more openable objects, OpdFormer-P makes the most accurate predictions (highest +MAO). We also see that multiple AO is more challenging with both the part detection (PDet) and motion parameter predictions (+MAO) being much lower than the single AO case.
What part types are more challenging? We find that lid is the most challenging to detect on OPDSynth. We suspect this is due to limited data and variability of the lid shape. See the supplement for a detailed analysis.
| GT | |||||
| OPDRCNN-P | Miss | Miss | Miss | ||
| OpdFormer-P | Miss |
How good are the predicted object poses? To check whether OpdFormer provides improved object pose predictions, we evaluate the object pose directly by measuring the rotation error (angle between two rotation matrices) and translation error (Euclidean distance normalized by the object diagonal length). Following prior work [17], we report the median error and accuracy at different thresholds. For rotation accuracy, we use thresholds of degree, and for translation accuracy, we use a threshold of . Tab. 5 shows the results of above object pose evaluation metric on the val sets of OPDSynth and OPDMulti. We can see that OpdFormer variants all outperform OPDRCNN-O, indicating that the transformer structure can give better pose predictions. For OPDMulti, the rotation and translation error are much higher than for OPDSynth, illustrating the challenge of our OPDMulti scenario. Furthermore, our OpdFormer-P has better object pose prediction than OpdFormer-O, indicating the importance of having per-part object pose prediction. In the single setting (OPDSynth), the part-weight-average global pose gives the best object pose prediction.
| Part-averaged mAP | |||||
| Dataset | backbone | PDet | +M | +MA | +MAO |
| OPDSynth | R50 | 79.0 | 76.7 | 58.6 | 53.4 |
| Swin-L | 79.6 | 77.0 | 64.1 | 57.9 | |
| OPDReal | R50 | 58.8 | 56.2 | 35.4 | 33.7 |
| Swin-L | 69.2 | 66.6 | 44.0 | 40.7 | |
| OPDMulti | R50 | 32.9 | 31.6 | 19.4 | 16.0 |
| Swin-L | 42.2 | 40.6 | 26.4 | 23.4 | |
Effect of backbone. Most of our experiments use the R50 backbone as it is smaller and requires fewer resources to train. We check performance with Swin-L, a more powerful backbone compared to R50. Tab. 6 shows that with the Swin-L backbone, OpdFormer-P outperforms the R50 backbone in all cases. Even when the part detection performance is roughly the same for OPDSynth dataset, the motion prediction is considerably higher (by 4.5%). Note that OpdFormer-P with Swin-L backbone (with 200 queries for the transformer decoder) has 205.6M parameters, which is around larger than the R50 backbone.
Failure case analysis. Fig. 6 shows some failure cases. Many errors occur due to the limited field-of-view and significant cropping of openable parts (see first column). In the second and third column unclear edges lead to part detection failures. In the fourth column motion type prediction fails due to a rotating door with drawer-like features. The last column is an incorrect prediction of a wall as a door.
6 Limitations
Our work relies on projecting annotations from RGBD reconstructions in the MultiScan dataset to RGB frames. Noise and errors in the reconstruction compound with potential annotation errors and can produce inaccurate projected 2D annotations for the openable part masks and motion parameters. Moreover, the viewpoints from such RGBD video trajectories are biased by the path the human operators took to acquire a reconstruction and may not represent common viewpoints well. The diversity of objects and scenes is also limited by geographic bias. Furthermore, the sparsity of available real-world scene data with part-level motion annotations is a bottleneck for future work.
7 Conclusion
We generalized the openable part detection task to scenes with multiple objects. To study this more realistic task setting, we constructed a dataset of images from real-world scenes and developed OpdFormer, a part-informed transformer architecture that leverages insights about strong correlation between parts, and between object pose and parts. We systematically evaluate on datasets from prior work and our new dataset to show that OpdFormer achieves state-of-the-art performance on both single-object and multiple-object scenarios. Our results show that scenarios with multiple openable objects in real scenes remain challenging, leaving opportunities for future work. We hope our work catalyzes further investigation of openable part detection, enabling progress in 3D scene understanding, robotic vision, and embodied AI.
Acknowledgements: This work was funded in part by a Canada CIFAR AI Chair, a Canada Research Chair and NSERC Discovery Grant, and enabled in part by support from WestGrid and Compute Canada. We thank Yongsen Mao for helping us with the data processing procedure. We also thank Jiayi Liu, Sonia Raychaudhuri, Ning Wang, Yiming Zhang for feedback on paper drafts.
References
- Carion et al. [2020] Nicolas Carion, Francisco Massa, Gabriel Synnaeve, Nicolas Usunier, Alexander Kirillov, and Sergey Zagoruyko. End-to-end object detection with transformers. In Proc. of the European Conference on Computer Vision (ECCV), pages 213–229. Springer, 2020.
- Cheng et al. [2021] Bowen Cheng, Alex Schwing, and Alexander Kirillov. Per-pixel classification is not all you need for semantic segmentation. Advances in Neural Information Processing Systems, 34, 2021.
- Cheng et al. [2022] Bowen Cheng, Ishan Misra, Alexander G Schwing, Alexander Kirillov, and Rohit Girdhar. Masked-attention mask transformer for universal image segmentation. In Proc. of the Conference on Computer Vision and Pattern Recognition (CVPR), 2022.
- Collins et al. [2023] Jasmine Collins, Anqi Liang, Jitendra Malik, Hao Zhang, and Frédéric Devernay. Ca2T-Net: Category-agnostic 3D articulation transfer from single image. arXiv preprint arXiv:2301.02232, 2023.
- Girshick [2015] Ross Girshick. Fast R-CNN. In Proceedings of the IEEE international conference on computer vision, pages 1440–1448, 2015.
- He et al. [2017] Kaiming He, Georgia Gkioxari, Piotr Dollár, and Ross Girshick. Mask R-CNN. In Proc. of the International Conference on Computer Vision (ICCV), pages 2961–2969, 2017.
- Heppert et al. [2022] Nick Heppert, Toki Migimatsu, Brent Yi, Claire Chen, and Jeannette Bohg. Category-independent articulated object tracking with factor graphs. arXiv preprint arXiv:2205.03721, 2022.
- Hsu et al. [2023] Cheng-Chun Hsu, Zhenyu Jiang, and Yuke Zhu. Ditto in the house: Building articulation models of indoor scenes through interactive perception. arXiv preprint arXiv:2302.01295, 2023.
- Hu et al. [2017] Ruizhen Hu, Wenchao Li, Oliver Van Kaick, Ariel Shamir, Hao Zhang, and Hui Huang. Learning to predict part mobility from a single static snapshot. ACM Transactions on Graphics (TOG), 36(6):227, 2017.
- Hu et al. [2018] Ruizhen Hu, Manolis Savva, and Oliver van Kaick. Functionality representations and applications for shape analysis. Computer Graphics Forum, 37(2):603–624, 2018.
- Jain et al. [2020] Ajinkya Jain, Rudolf Lioutikov, and Scott Niekum. ScrewNet: Category-independent articulation model estimation from depth images using screw theory. arXiv preprint arXiv:2008.10518, 2020.
- Jain et al. [2022] Ajinkya Jain, Stephen Giguere, Rudolf Lioutikov, and Scott Niekum. Distributional depth-based estimation of object articulation models. In Proc. of the Conference on Robot Learning (CoRL), pages 1611–1621. PMLR, 2022.
- Jiang et al. [2022a] Hanxiao Jiang, Yongsen Mao, Manolis Savva, and Angel X Chang. OPD: Single-view 3D openable part detection. In Proc. of the European Conference on Computer Vision (ECCV), 2022a.
- Jiang et al. [2022b] Zhenyu Jiang, Cheng-Chun Hsu, and Yuke Zhu. Ditto: Building digital twins of articulated objects from interaction. In Proc. of the Conference on Computer Vision and Pattern Recognition (CVPR), 2022b.
- Kar et al. [2021] Amlan Kar, Seung Wook Kim, Marko Boben, Jun Gao, Tianxing Li, Huan Ling, Zian Wang, and Sanja Fidler. Toronto annotation suite. https://aidemos.cs.toronto.edu/toras, 2021.
- Li et al. [2020] Xiaolong Li, He Wang, Li Yi, Leonidas Guibas, A Lynn Abbott, and Shuran Song. Category-level articulated object pose estimation. In Proc. of the Conference on Computer Vision and Pattern Recognition (CVPR), 2020.
- Li et al. [2021] Xiaolong Li, Yijia Weng, Li Yi, Leonidas Guibas, A Lynn Abbott, Shuran Song, and He Wang. Leveraging SE(3) equivariance for self-supervised category-level object pose estimation. Advances in neural information processing systems, 2021.
- Lin et al. [2014] Tsung-Yi Lin, Michael Maire, Serge Belongie, James Hays, Pietro Perona, Deva Ramanan, Piotr Dollár, and C Lawrence Zitnick. Microsoft COCO: Common objects in context. In Proc. of the European Conference on Computer Vision (ECCV), pages 740–755. Springer, 2014.
- Liu et al. [2022] Liu Liu, Wenqiang Xu, Haoyuan Fu, Sucheng Qian, Yang Han, and Cewu Lu. AKB-48: A real-world articulated object knowledge base. In Proc. of the Conference on Computer Vision and Pattern Recognition (CVPR), 2022.
- Loshchilov and Hutter [2018] Ilya Loshchilov and Frank Hutter. Decoupled weight decay regularization. In Proc. of the International Conference on Learning Representations (ICLR), 2018.
- Mao et al. [2022] Yongsen Mao, Yiming Zhang, Hanxiao Jiang, Angel X Chang, and Manolis Savva. MultiScan: Scalable RGBD scanning for 3D environments with articulated objects. Advances in neural information processing systems, 2022.
- Milletari et al. [2016] Fausto Milletari, Nassir Navab, and Seyed-Ahmad Ahmadi. V-net: Fully convolutional neural networks for volumetric medical image segmentation. In Proc. of the International Conference on 3D Vision (3DV), pages 565–571, 2016.
- Qian et al. [2022] Shengyi Qian, Linyi Jin, Chris Rockwell, Siyi Chen, and David F Fouhey. Understanding 3D object articulation in internet videos. In Proc. of the Conference on Computer Vision and Pattern Recognition (CVPR), 2022.
- Ravi et al. [2020] Nikhila Ravi, Jeremy Reizenstein, David Novotny, Taylor Gordon, Wan-Yen Lo, Justin Johnson, and Georgia Gkioxari. Accelerating 3D deep learning with PyTorch3D. arXiv preprint arXiv:2007.08501, 2020.
- Ren et al. [2015] Shaoqing Ren, Kaiming He, Ross Girshick, and Jian Sun. Faster R-CNN: Towards real-time object detection with region proposal networks. Advances in neural information processing systems, 28, 2015.
- Shi et al. [2021] Yahao Shi, Xinyu Cao, and Bin Zhou. Self-supervised learning of part mobility from point cloud sequence. In Computer Graphics Forum, volume 40, pages 104–116. Wiley Online Library, 2021.
- Shi et al. [2022] Yahao Shi, Xinyu Cao, Feixiang Lu, and Bin Zhou. P3-Net: Part mobility parsing from point cloud sequences via learning explicit point correspondence. In Association for the Advancement of Artificial Intelligence (AAAI), 2022.
- Wang et al. [2019] Xiaogang Wang, Bin Zhou, Yahao Shi, Xiaowu Chen, Qinping Zhao, and Kai Xu. Shape2Motion: Joint analysis of motion parts and attributes from 3D shapes. In Proc. of the Conference on Computer Vision and Pattern Recognition (CVPR), pages 8876–8884, 2019.
- Wu et al. [2019] Yuxin Wu, Alexander Kirillov, Francisco Massa, Wan-Yen Lo, and Ross Girshick. Detectron2. https://github.com/facebookresearch/detectron2, 2019.
- Xiang et al. [2020] Fanbo Xiang, Yuzhe Qin, Kaichun Mo, Yikuan Xia, Hao Zhu, Fangchen Liu, Minghua Liu, Hanxiao Jiang, Yifu Yuan, He Wang, et al. Sapien: A simulated part-based interactive environment. In Proceedings of the IEEE/CVF Conference on Computer Vision and Pattern Recognition, pages 11097–11107, 2020.
- Yan et al. [2019] Zihao Yan, Ruizhen Hu, Xingguang Yan, Luanmin Chen, Oliver Van Kaick, Hao Zhang, and Hui Huang. RPM-Net: recurrent prediction of motion and parts from point cloud. ACM Transactions on Graphics (TOG), 38(6):240, 2019.
- Zeng et al. [2021] Vicky Zeng, Timothy E Lee, Jacky Liang, and Oliver Kroemer. Visual identification of articulated object parts. In Proc. of the International Conference on Intelligent Robots and Systems (IROS), 2021.
In this supplement, we provide dataset details (App. A) and additional quantitative and qualitative results (App. B).
Appendix A Additional dataset details
We provide more statistics for the OPDMulti dataset (Sec. A.1), examples of different part ratio coverages in frames (Sec. A.2), details about correcting inaccurate masks (Sec. A.3), and distribution of part and motion types for the train/val/test splits (Sec. A.4). We also provide example visualization clarifying the difference between the different coordinate frames we consider for our models (Sec. A.5) and information about how we extract object poses for training (Sec. A.6).
A.1 Distribution of openable parts
The OPDMulti dataset we constructed is composed of approximately RGBD frames extracted from the MultiScan dataset [21]. Since our task focuses on detecting openable parts in images from more realistic real-world scenes with variable number of parts, we report the distribution of the openable parts across the dataset frames (see Tab. 7). In OPDMulti, around of the frames that have at least one openable object (ignoring the frames that has 0 part) contain 1 part. This distribution is approximately the same across train/val/test sets. Overall, we observe that there is a long-tail distribution for the number of openable parts observed in these RGBD frames captured by people from real scenes.
| # Parts | |||||
| split | 0 | 1 | 2 | 3 | 4+ |
| train | 31189 | 7705 | 3183 | 1261 | 664 |
| val | 6424 | 1853 | 1055 | 516 | 320 |
| test | 6818 | 1839 | 826 | 336 | 224 |
| total | 44431 | 11397 | 5064 | 2113 | 1208 |
A.2 Part mask image coverage ratio examples
We show examples of parts with different part coverage ratios (e.g. fraction of the frame covered by the part) in Fig. 7. We note that images with low part coverage ratio (below 5%) do not provide sufficient information for openable part detection, thus we exclude these parts from our evaluation.
A.3 Mask correction
As noted in the main paper, it is possible for some frames to have inaccurate masks due to issues in the reconstruction. Since the annotations are on the 3D reconstructions, if the reconstruction is incomplete or the camera pose for the frame is inaccurate, then the annotated mask when projected onto the image will be inaccurate. Fig. 8 shows examples of inaccurate projected mask annotations. From the top row, we see an example of an incomplete mask due to a shiny surface that is not reconstructed well. The bottom row shows an example of a shifted mask due to an inaccurate camera pose estimate for the frame. We note that despite the inaccurate masks, the projected motion axis is good.
To ensure that the data for our evaluation is accurate and high-quality, we manually inspect all frames in the validation and test splits and flag frames with bad mask annotations. We then use the Toronto Annotation Suite [15] to re-annotate the bad masks manually. Considering there may be multiple parts in one frame, we directly re-annotate on the images with bad part masks. During the annotation procedure, we draw the polygon segmentation for the specific openable part. In total, we re-annotate 2261 openable part mask segmentations across both the validation and test sets.
| Part Type | Motion Type | |||||
| split | # part | door | drawer | lid | revolute | prismatic |
| train | 18479 | 15904 | 2097 | 478 | 15760 | 2719 |
| val | 6077 | 5124 | 752 | 201 | 4695 | 1382 |
| test | 4704 | 3592 | 981 | 131 | 3449 | 1255 |
| total | 29260 | 24620 | 3830 | 810 | 23904 | 5356 |
A.4 Distribution of motion and openable part type
We report the distribution of different motion types and openable part types in the OPDMulti dataset in Tab. 8. This distribution is counted from the data we used for our experiments, which means it is after excluding small parts as described in Sec. A.2. From Tab. 8, we see that door is the most frequent part type with around ratio in all splits, and revolute is more common than prismatic. Since OPDMulti is constructed from real-world indoor scenes, the distribution shows the frequency of openable parts in a realistic setting. We analyze the model performance for different part types in Sec. B.3.
A.5 Coordinate frames
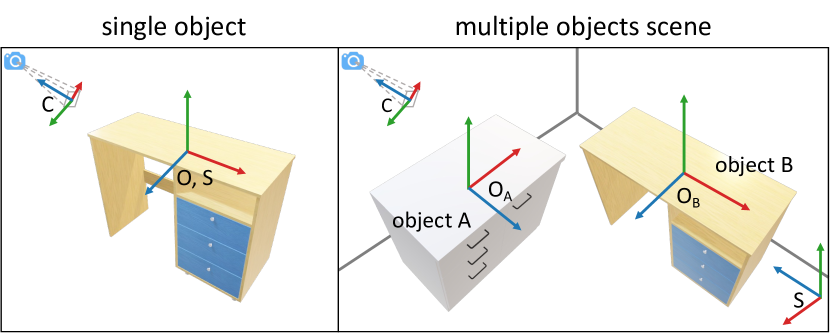
Fig. 9 illustrates the difference between the different coordinate frames. Jiang et al. [13]’s dataset contained images with only a single object (see Fig. 9 left). When a scene contains only one object, the object coordinate is the same as the global scene coordinate. In contrast, when there are multiple objects, the global scene coordinates and the object coordinate frame can be different. The object coordinate frame ( and for objects and in Fig. 9) for each object are centered at the center of each object, with the axes aligned to the bounding box of the object (with +Z as front, and +Y as up), while the global scene coordinate is a single coordinate frame at the center of the scene. The camera coordinate frame is used for projecting the 3D scene onto the image plane and has +Z facing into the camera, and +Y as up.
| Scene | Objects |
| Parts | Object poses |
A.6 Object pose for training
Fig. 10 shows an example kitchen scene in our dataset containing multiple objects with openable parts. In such scenarios, some care has to be taken to construct appropriate single global pose and multiple object poses information to train each of the architecture variants.
Single global pose. Since OPDMulti images contain an arbitrary number of objects, there is no notion of a single global object pose. Therefore, we train with the scene coordinates defining a global pose, and transform from camera coordinates to these scene coordinates. All relevant motion parameters are also transformed to the scene coordinates.
Multiple object poses. In this case, the object pose is defined by the transformation between camera coordinates and canonical object coordinates, using a consistently defined front and up orientation for each object pose. See Fig. 10 bottom right for example object coordinate frames.
Appendix B Additional results
In this section, we provide information about the size of our models (Sec. B.1), additional quantitative results on depth, RGB-D images, and the test set (Sec. B.2), breakdown of OpdFormer-P performace on different parts and comparisons of different training strategies for OpdFormer-P (Sec. B.3). In addition, we provide additional qualitative examples (Sec. B.4), visualization of the transformer attention maps (Sec. B.5), and a discussion of object part consistency (Sec. B.6).
| Model | Backbone | Parameters | FLOP |
| OPDRCNN-C | R50 | 44.5M | 47.4G |
| OPDRCNN-O | R50 | 45.1M | 49.3G |
| OPDRCNN-P | R50 | 46.1M | 46.9G |
| OpdFormer-C | R50 | 41.9M | 20.3G |
| OpdFormer-O | R50 | 43.5M | 20.3G |
| OpdFormer-P | R50 | 42.0M | 20.3G |
| OpdFormer-P | Swin-L | 205.6M | 92.1G |
| Part-averaged mAP | |||||
| Dataset | Model | PDet | +M | +MA | +MAO |
| OPDSynth | OPDRCNN-C [13] | 69.5 | 67.7 | 37.7 | 35.3 |
| OPDRCNN-O [13] | 69.3 | 67.5 | 50.7 | 44.8 | |
| OPDRCNN-P | 68.6 | 66.8 | 48.7 | 42.5 | |
| OpdFormer-C | 78.9 | 76.9 | 51.2 | 47.8 | |
| OpdFormer-O | 79.6 | 78.1 | 62.4 | 54.9 | |
| OpdFormer-P | 77.6 | 75.8 | 56.6 | 53.2 | |
| OPDReal | OPDRCNN-C [13] | 40.0 | 38.0 | 7.2 | 6.7 |
| OPDRCNN-O [13] | 39.9 | 37.8 | 12.6 | 11.1 | |
| OPDRCNN-P | 40.0 | 37.6 | 18.8 | 17.9 | |
| OpdFormer-C | 48.3 | 47.4 | 29.9 | 28.8 | |
| OpdFormer-O | 50.4 | 49.6 | 32.4 | 30.3 | |
| OpdFormer-P | 50.8 | 50.1 | 37.3 | 35.1 | |
| OPDMulti | OPDRCNN-C [13] | 18.9 | 16.5 | 2.5 | 2.3 |
| OPDRCNN-O [13] | 17.3 | 15.1 | 0.8 | 0.1 | |
| OPDRCNN-P | 18.8 | 16.3 | 4.4 | 3.1 | |
| OpdFormer-C | 22.1 | 19.9 | 11.4 | 10.2 | |
| OpdFormer-O | 24.9 | 22.6 | 5.8 | 1.9 | |
| OpdFormer-P | 23.0 | 20.8 | 16.1 | 13.9 | |
| Part-averaged mAP | |||||
| Dataset | Model | PDet | +M | +MA | +MAO |
| OPDSynth | OPDRCNN-C [13] | 72.8 | 70.6 | 39.2 | 36.6 |
| OPDRCNN-O [13] | 72.5 | 70.6 | 51.7 | 47.0 | |
| OPDRCNN-P | 70.5 | 68.4 | 49.6 | 44.1 | |
| OpdFormer-C | 77.1 | 75.0 | 49.6 | 45.8 | |
| OpdFormer-O | 77.2 | 75.2 | 60.8 | 54.0 | |
| OpdFormer-P | 77.2 | 75.3 | 59.7 | 55.7 | |
| OPDReal | OPDRCNN-C [13] | 56.2 | 54.1 | 15.1 | 14.6 |
| OPDRCNN-O [13] | 55.8 | 53.3 | 30.0 | 27.5 | |
| OPDRCNN-P | 57.8 | 54.7 | 30.2 | 28.0 | |
| OpdFormer-C | 65.0 | 62.1 | 34.4 | 33.7 | |
| OpdFormer-O | 61.6 | 60.1 | 36.3 | 34.1 | |
| OpdFormer-P | 61.6 | 58.9 | 40.7 | 39.7 | |
| OPDMulti | OPDRCNN-C [13] | 23.4 | 21.1 | 6.8 | 6.0 |
| OPDRCNN-O [13] | 23.2 | 21.2 | 2.9 | 0.6 | |
| OPDRCNN-P | 25.5 | 23.6 | 9.1 | 7.8 | |
| OpdFormer-C | 25.3 | 23.6 | 14.2 | 13.5 | |
| OpdFormer-O | 24.1 | 22.0 | 6.6 | 2.6 | |
| OpdFormer-P | 28.6 | 26.5 | 18.7 | 17.2 | |
| Part-averaged mAP | |||||
| Dataset | Model | PDet | +M | +MA | +MAO |
| OPDSynth | OPDRCNN-C | 67.4 | 66.2 | 40.9 | 38.0 |
| OPDRCNN-O | 66.6 | 65.5 | 50.8 | 47.0 | |
| OPDRCNN-P | 66.7 | 65.1 | 49.9 | 45.8 | |
| OpdFormer-C | 69.0 | 67.7 | 52.4 | 49.0 | |
| OpdFormer-O | 68.6 | 67.4 | 56.3 | 53.2 | |
| OpdFormer-P | 72.8 | 71.2 | 55.9 | 52.1 | |
| OPDReal | OPDRCNN-C | 58.0 | 57.0 | 22.2 | 21.3 |
| OPDRCNN-O | 57.8 | 56.4 | 33.1 | 30.7 | |
| OPDRCNN-P | 55.9 | 52.2 | 33.0 | 31.3 | |
| OpdFormer-C | 54.7 | 50.6 | 34.1 | 32.9 | |
| OpdFormer-O | 54.4 | 51.9 | 35.8 | 33.6 | |
| OpdFormer-P | 57.3 | 55.6 | 39.7 | 38.1 | |
| OPDMulti | OPDRCNN-C | 25.2 | 24.7 | 5.6 | 4.7 |
| OPDRCNN-O | 16.9 | 16.1 | 3.6 | 0.8 | |
| OPDRCNN-P | 22.6 | 21.7 | 5.5 | 4.2 | |
| OpdFormer-C | 29.8 | 29 | 9.3 | 8.2 | |
| OpdFormer-O | 26.9 | 25.3 | 3.8 | 1.4 | |
| OpdFormer-P | 31.7 | 30.7 | 18.4 | 16.8 | |
| drawer | door | lid | |||||||||||
| Dataset | Model | PDet | +M | +MA | +MAO | PDet | +M | +MA | +MAO | PDet | +M | +MA | +MAO |
| OPDSynth | OPDRCNN-C [13] | 81.3 | 80.9 | 60.7 | 60.7 | 85.3 | 79.8 | 46.2 | 42.8 | 57.5 | 57.3 | 13.5 | 5.7 |
| OPDRCNN-P | 79.8 | 79.6 | 68.8 | 68.8 | 85.1 | 80.1 | 59.0 | 53.0 | 57.1 | 56.9 | 27.6 | 12.9 | |
| OpdFormer-C | 81.4 | 80.8 | 68.8 | 68.8 | 82.9 | 76.4 | 54.6 | 50.3 | 67.6 | 67.5 | 23.3 | 12.5 | |
| OpdFormer-P | 83.1 | 82.3 | 73.5 | 73.5 | 84.0 | 78.0 | 60.0 | 55.8 | 68.3 | 68.1 | 39.9 | 27.4 | |
| OPDReal | OPDRCNN-C | 77.6 | 76.8 | 23.0 | 23.0 | 56.0 | 51.7 | 22.5 | 20.3 | 39.4 | 26.1 | 0.8 | 0.1 |
| OPDRCNN-P | 76.9 | 76.3 | 48.3 | 48.3 | 57.9 | 52.3 | 30.2 | 26.8 | 38.2 | 36.2 | 2.4 | 0.2 | |
| OpdFormer-C | 74.6 | 73.6 | 50.0 | 50.0 | 54.8 | 51.3 | 36.0 | 33.2 | 44.4 | 43.3 | 3.1 | 1.6 | |
| OpdFormer-P | 76.0 | 75.0 | 61.3 | 61.3 | 58.1 | 53.8 | 42.8 | 38.6 | 39.5 | 36.7 | 1.4 | 0.1 | |
| OPDMulti | OPDRCNN-C | 24.3 | 24.1 | 8.1 | 8.1 | 41.9 | 37.4 | 16.1 | 13.5 | 15.6 | 15.6 | 2.2 | 1.8 |
| OPDRCNN-P | 13.9 | 13.5 | 4.5 | 4.5 | 39.1 | 33.8 | 15.1 | 10.7 | 9.6 | 9.5 | 2.0 | 1.9 | |
| OpdFormer-C | 21.1 | 20.6 | 9.8 | 9.8 | 43.3 | 39.7 | 26.4 | 23.6 | 26.4 | 26.4 | 3.1 | 2.9 | |
| OpdFormer-P | 22.3 | 21.5 | 15.3 | 15.3 | 44.2 | 41.1 | 27.9 | 23.5 | 32.2 | 32.1 | 15.1 | 9.0 | |
B.1 Model size
B.2 Additional quantitative results
We present additional quantitative results comparing our proposed OpdFormer with OPDRCNN, including results on depth and RGBD inputs. We also present results on the test set. Results consistently show that OpdFormer-P outperforms other variants.
Results for depth and RGBD inputs. Tabs. 10 and 11 report the results using depth and RGBD as input with val set from three different datasets. We see that the OpdFormer variants perform better than OPDRCNN methods across input image formats. Compared with using RGB input (see main paper Tab. 3), for part motion prediction, using D input only gives slightly worse results while using RGBD input gives slightly better results.
Results on the test set. Tab. 12 evaluates the different methods on RGB images from the test set of the three datasets. The performance on the test set largely follows that of the validation sets, with OpdFormer variants outperforming OPDRCNN and per-part object pose (OpdFormer-P) providing the best performance.
| Part-averaged mAP | ||||||
| Model | Initialized with | PDet | +M | +MA | +MAO | |
| 1 | Mask2Former | full pretrained model on OPDReal | 32.80.73 | - | - | - |
| 2 | OpdFormer-P | pretrained detection model on COCO | 28.10.67 | 26.60.59 | 12.30.43 | 10.70.29 |
| 3 | OpdFormer-P | pretrained detection model on OPDMulti | 32.90.35 | 31.20.41 | 14.60.22 | 13.00.18 |
| 4 | OpdFormer-P | full pretrained model on OPDReal | 32.90.69 | 31.60.72 | 19.40.38 | 16.00.03 |
B.3 Additional analysis
What part types are more challenging? Tab. 13 analyzes performance on three part categories: drawer, door, lid. We find lid to be the most challenging to detect on all three datasets. On OPDMulti, all three part types are much more challenging with considerably lower PDet.
Comparison between Mask2Former and OpdFormer. We compare the performance of our OpdFormer with the original Mask2Former, without any additional motion losses, to check whether having extra losses would impact the detection performance. We report results on OPDMulti val set with RGB input in Tab. 14. We start with the Mask2Former weights pretrained on the COCO dataset [18] and then consider different training strategies. For all experiments except for (2), we pretrain on OPDReal before we train on OPDMulti. For Mask2Former, we initialize the model with weights pretrained on OPDReal. For training OpdFormer (row 1), we compare training from pretrained model just on COCO dataset (and not further pretrained on OPDReal, row 2), vs starting with the weights from the Mask2Former model pretrained on OPDMulti (row 3) vs training OpdFormer directly from a pretrained model on OPDReal (row 4). From Tab. 14, we see that OpdFormer performance without pretraining (row 2) on OPDReal is lower than models with pretraining (row 1,3,4). For models with pretraining, they have very similar part detection performance (PDet) but pretraining the motion parameters on OPDReal (row 4) results in better motion prediction, especially for motion axis and origin (+MA, +MAO).
B.4 Additional qualitative results
We provide additional qualitative results on both the OPDSynth and OPDReal datasets. Fig. 11 shows the qualitative results for selected models on the OPDSynth and OPDReal datasets. Overall, we again see that our proposed OpdFormer variants have better performance than OPDRCNN methods and can predict more consistent motion parameters.
We also present qualitative visualizations of how the different variants of OpdFormer performs on OPDMulti dataset (see Fig. 12). From the first two columns, we see that OpdFormer-P can perform better even when the detected mask is similar to other variants. Overall, OpdFormer-P has better prediction ability when there are multiple object present, illustrating the importance of predicting the object pose on a per-part basis.
B.5 Visualizing the transformer attention masks
We visualize the attention maps of the transformer architecture following the same layer selection for the masked attention as Mask2Former [3]. Figure 13 shows the visualizations. We choose the attention maps of the last three masked attention layers, which use image features with different resolutions. From the visualization, we see that the masked attention assigns high weight on the openable parts.
| OPDSynth | |||||
| GT | |||||
| OPDRCNN-P | |||||
| Axis (origin) error | 2.446 | 3.721 | 5.127 | 6.669 | 79.841 (0.464) |
| OpdFormer-P | |||||
| Axis (origin) error | 2.368 | 2.517 | 2.768 | 3.170 | 5.939 (0.179) |
| OPDReal | |||||
| GT | |||||
| OPDRCNN-P | |||||
| Axis (origin) error | 4.753 | 5.492 | 5.262 | 12.491 (0.093) | 1.085 (0.047) |
| OpdFormer-P | |||||
| Axis (origin) error | 2.409 | 2.712 | 2.690 | 2.965 (0.099) | 3.045 (0.113) |
| GT | ||||||
| OpdFormer-C | Miss | Miss | ||||
| Axis (origin) error | 5.326 (0.014) | 7.127 (0.179) | - | - | 9.593 (0.014) | 10.547 (0.016) |
| OpdFormer-O | Miss | Miss | Miss | |||
| Axis (origin) error | 12.476 (0.484) | 5.317 (0.317) | - | 3.948 (0.217) | - | - |
| OpdFormer-P | ||||||
| Axis (origin) error | 4.425 (0.061) | 2.756 (0.129) | 2.895 (0.089) | 4.229 (0.334) | 3.624 (0.025) | 4.827 (0.010) |
| GT | ||||||
B.6 Analysis of object part consistency
As noted in the main paper, the motion parameters are highly correlated within an object, as well as across objects. In a single object, parts with the same part category are likely to have similar motion types (e.g., all doors in one cabinet are either all rotating or sliding). Similarly, the motion axes tend to be consistent across the parts (e.g. all drawers for a cabinet will tend to translate in the same direction, while a cabinet with both drawers and door will tend to have rotation axis for the doors that are perpendicular to the drawers’ translation axes). Thus, the motion axes of different parts are likely parallel or perpendicular to each other. Rotational motion origins follow a similar layout for rotating parts (e.g., the edge of rotating parts is constrained by the part position).
We investigate the consistency of the ground truth (GT) motions in the datasets, as well as how consistent the predictions from our model variants are. We show that our OpdFormer-P provides the most consistent predictions.
| axis | type | ||||
| Dataset | Model | ||||
| OPDSynth | OPDRCNN-C [13] | 0.05 | 0.47 | 0.75 | 0.99 |
| OPDRCNN-P | 0.15 | 0.75 | 0.89 | 0.99 | |
| OpdFormer-C | 0.46 | 0.87 | 0.92 | 0.99 | |
| OpdFormer-P | 0.72 | 0.89 | 0.92 | 0.99 | |
| OPDReal | OPDRCNN-C | 0.02 | 0.20 | 0.43 | 0.95 |
| OPDRCNN-P | 0.03 | 0.38 | 0.68 | 0.93 | |
| OpdFormer-C | 0.15 | 0.78 | 0.89 | 0.99 | |
| OpdFormer-P | 0.35 | 0.82 | 0.89 | 0.98 | |
| OPDMulti | OPDRCNN-C | 0.02 | 0.29 | 0.57 | 0.97 |
| OPDRCNN-P | 0.02 | 0.28 | 0.56 | 0.96 | |
| OpdFormer-C | 0.18 | 0.79 | 0.88 | 0.98 | |
| OpdFormer-P | 0.33 | 0.84 | 0.90 | 0.98 | |
GT Motion Consistency. We check how consistent the motion types and motion axes are across the single object datasets, OPDSynth and OPDReal, by measuring the percentage of part pairs in the same object that: 1) have the same motion type given the same part category; and 2) are parallel or perpendicular to each other. For motion type, all part pairs in both datasets are consistent according to our observation. For the motion axes, we measure the axis consistency for three different angle thresholds (1∘, 5∘, and 10∘). OPDSynth matches our hypothesis for all objects across all thresholds, while in OPDReal all pairs matched at , 97% matched at , and 68% pairs at . Upon inspection, many non-consistent cases are due to small inaccuracies in the ground truth annotations for the motion axis in OPDReal. This inconsistency is likely due to noise in the annotation. Fig. 14 shows an example where there is a slight inconsistency. The motion axis should have the same direction between the two drawers, but the GT motion axis is slightly different with a 6.29-degree error.
Prediction Consistency. To evaluate motion consistency for predicted joints, we also measure pair-wise consistency of part motion predictions. Tab. 15 shows the results for OPDSynth, OPDReal and OPDMulti. We see that OpdFormer predictions are much more consistent than OPDRCNN. This is likely due to the overall better pose prediction and the self-attention mechanism in OpdFormer that allows it to better capture relationships with other parts. In addition, almost all predictions on OPDSynth are parallel or perpendicular within and , where OpdFormer-P has the best consistency. For OPDReal and OPDMulti, the consistency is low at but fairly good at and .