Correlation study of temporal and emission properties of quiescent magnetars
1 Introduction
Magnetars are neutron stars with an ultrastrong magnetic field (), greater than the quantum critical threshold of G. They have relatively long spin periods (– s) and large spin-down rates (– s ) compared to rotation-powered pulsars (RPPs). Thus magnetars have strong spin-inferred dipole magnetic-field strengths of typically G. Magnetars’ emission is mostly in the X-ray band and is thought to be produced primarily by the decay of internal (Thompson & Duncan, 1995, 1996; Thompson et al., 2002). Thus, is the key to understand observational properties of magnetars (e.g., as compared to RPPs). They are a source of fast radio bursts (FRBs) (e.g., CHIME/FRB Collaboration, 2020; Bochenek et al., 2020) and can be an important contributor to the gravitational wave (GW) background (e.g., Regimbau & de Freitas Pacheco, 2006; Ho, 2016). Hence it is very important to characterize and understand magnetars’ properties well, especially in the advent of sensitive instruments for GW (LIGO Scientific Collaboration, 2015) and FRB detection (CHIME/FRB Collaboration, 2018).
The most distinctive features of magnetars’ emission in comparison to RPPs’ are bursts and outbursts (e.g., Kaspi et al., 2003; Coti Zelati et al., 2018) which occur in magnetars much more frequently than in RPPs (e.g., Perna & Pons, 2011). The internal decay of can be generated via ambipolar diffusion and Hall drift (e.g., Goldreich & Reisenegger, 1992); these can apply stress to the stellar crust which may then be sheared. The crust displacement by the magnetic shear may twist external and induce various instabilities in the magnetosphere (e.g., Beloborodov, 2009). They generate diverse transient behaviors (e.g., Kaspi & Beloborodov, 2017), e.g., bursts and outbursts. Magnetar bursts on a timescale of seconds may be produced by rapid magnetospheric reconnection in the magnetosphere (e.g., Lyutikov, 2003), and outbursts are suggested to be caused by changes in the global structure (e.g., Beloborodov & Thompson, 2007). These transient phenomena have been used to test magnetar models and helped to refine them.
Quiescent emissions of magnetars reflect their persistent properties and can also provide important clues to magnetar physics (e.g., Kaspi & Boydstun, 2010). Quiescent X-ray spectra of magnetars are well characterized with thermal blackbody radiation from the surface and/or nonthermal radiation in the magnetosphere, and modulate on the spin periods. These observed emission properties are similar to those of other X-ray pulsars, but there are differences; (1) surface temperatures of magnetars are inferred to be higher than those of other X-ray pulsars, and (2) the spectral energy distributions of the nonthermal emissions from some magnetars show a dramatic turn-over at 10 keV (Kuiper et al., 2006). Both of them are thought to be caused by the strong of magnetars. (1) can be explained as due to the power supplied by the internal decay, and (2) may imply that the magnetospheric emission mechanism of magnetars is different from that of RPPs; magnetospheric emission of magnetars is thought to be produced by resonant cyclotron scattering (RCS) of the thermal photons by electrons in the twisted field (e.g., Thompson et al., 2002; Lyutikov & Gavriil, 2006; Pons et al., 2007; Beloborodov, 2013; Wadiasingh et al., 2018) not by their synchrotron radiation as has been suggested for RPPs (e.g., Wang et al., 2013; Torres et al., 2019).
Although is the key to understand the quiescent emission of magnetars, there may be other important factors. Spin-down power () may play a role for the emission, and spin-down torque () may be influenced by plasma surrounding the star. The emission strength and the physical parameters co-evolve on a timescale of Myr via a long-term decay of due to conduction and diffusion (e.g., Pons et al., 2007; Viganò et al., 2013), and so the age () may also be an important factor. Impacts of these physical properties (, etc.) on the emission would be manifested by correlation between the physical and radiative properties; such correlations have been seen in populations of X-ray pulsars (e.g., Li et al., 2008; Zhu et al., 2011)
Statistical studies of quiescent properties of magnetars have been performed previously. Marsden & White (2001) reported a correlation between spin frequency derivative (; spin-down torque) and soft X-ray (0.5–10 keV) photon index (). Kaspi & Boydstun (2010) used a larger sample and suggested that both soft-band ( keV) and hard-band ( keV) spectral indices are correlated with . Enoto et al. (2010) found that spectral hardness (1–60 keV flux ratio of a hard and a soft spectral component) is correlated with the characteristic age () and . These helped to develop the twisted- model (e.g., Thompson et al., 2002; Beloborodov, 2013). An et al. (2012) found a correlation between and 2–10 keV X-ray luminosity () using a sample of high- pulsars and magnetars, and suggested that they share similar physical processes which are controlled primarily by ; this is in accord with the discoveries of low- ( G) magnetars (Rea et al., 2013) and magnetar-like outbursts in typical RPPs (e.g., Gavriil et al., 2008; Archibald et al., 2018). Mong & Ng (2018) confirmed the - correlation. They further employed a two-blackbody (2BB) or two-blackbody plus power-law (2BB+PL) model for the spectra, and found that the cold BB temperature ( is correlated with , lending supports to the long-term magnetothermal evolution models (e.g., Pons et al., 2007; Perna & Pons, 2011; Viganò et al., 2013). Coti Zelati et al. (2018) compiled outburst and quiescent fluxes of magnetars, and performed a systematic study with emphasis on the outburst properties.
More magnetars have been discovered and their quiescent properties have been better measured since the previous correlation studies. Thus, it is timely to update the correlation results with a larger sample, refined measurements, and thorough analyses. In this paper, we carefully identified quiescent states of magnetars using information collected from literature, and selected 17 magnetars whose quiescent properties could be well characterized (Section 2). We measured their emission properties and investigated correlations between various radiative and temporal properties including pulsed fractions () (see Section 3.2 for the definition of which has not been investigated previously (Sections 3 and 4). We discussed the correlation results in Section 5, and summarized them in Section 6.
2 Target Selection and Data Reduction
We selected targets for our study based on the McGill online magnetar catalog111http://www.physics.mcgill.ca/pulsar/magnetar/main.html (Olausen & Kaspi, 2014) and the magnetar outburst online catalog (Coti Zelati et al., 2018).222http://magnetars.ice.csic.es/#/welcome The former lists basic temporal and spectral properties of quiescent magnetars, and the latter provides long-term light curves and helps to identify the epoch of the faintest state for some magnetars. We made a further literature search to choose adequate observational data collected in quiescence, and analyzed them to measure the quiescent properties. While the previous measurements were useful, we reanalyzed the quiescent data because some of quantities we intended to investigate (e.g., BB radius, and PL flux) could not be retrieved from the catalogs or literature. Note that the quiescent data used in this study were taken during one quiescent period, i.e., we did not combine data acquired before and after an outburst.
The targets and data used in this work are listed in Table 1. Note that the list is slightly different from that in the McGill or the outburst catalog because we omitted magnetars whose quiescent properties could not be measured. For most of the targets, the quiescent state was well identified by a period with stable and low flux. But low-cadence observations for some magnetars did not allow a firm identification of the ‘stable’ quiescent state, and for them we assumed that the lowest-flux data far away (a few years) from their outbursts represent well the quiescent states.
We downloaded archival Chandra and XMM-Newton (XMM hereafter) data from the HEASARC data archive and reduced them following the standard procedures. We reprocessed the Chandra data using the chandra_repro tool of CIAO 4.13 along with CALDB 4.9.4. The XMM-Newton data were reduced with the emproc and epproc tasks of XMM science analysis system (SAS) v2019, and we filtered out particle flares from the data following the flare-removal procedure.333https://www.cosmos.esa.int/web/xmm-newton/sas-thread-epic-filterbackground Note that there are Swift data available for some targets, but given the small effective area of the instrument and short exposures for the observations, the Swift data are less useful. Note also that Suzaku and NuSTAR observed a few targets, which can help our investigation. We discussed these measurements (Section 3.3) but did not use them in this study. We defer further Suzaku and NuSTAR investigations to future work.
| #a | Obs ID | Inst.b | Model | /dof | Net counts | ||||||||||||
|---|---|---|---|---|---|---|---|---|---|---|---|---|---|---|---|---|---|
| () | (keV) | (km) | (keV) | (km) | ( | (s) | () | (10 kpc) | |||||||||
| 1 | 0304250401 | X | BB+PL | 0.34(1) | 9.6(6) | 1.9(1) | 0.7(1) | 8.02 | 1.88 | 0.27(4) | 2 | 6.24 | 109/97 | 3227(58) | |||
| 2 | 0112781101 | X | 2BB+PL | 0.70(2) | 0.30(1) | 13.8(6) | 0.55(2) | 3.0(3) | 2.90(4) | 1.4(1) | 8.69 | 0.20 | 0.07(1) | 2 | 0.36 | 140/131 | 163440(405) |
| 3 | 0693100101 | X | BB | 0.115(6) | 0.36(2) | 0.06(1) | 9.08 | 0.0004 | 0.65(9) | 1 | 0.2 | 33/23 | 486(32) | ||||
| 4 | 14811,15564 | C | BB+PL | 0.74(4) | 0.10(2) | 3.9(1) | 0.058(2) | 5.76 | 0.59 | 0.46(2) | 3 | 0.2 | 261/280 | 8027(90) | |||
| 5 | 10806 | C | BB+PL | d | 0.45(3) | 7(1) | 2.4(1) | 5.6(4) | 8.05 | 3.8 | 5.36 | 123/140 | 4200(66) | ||||
| 6 | 6736e | C | BB+PL | 0.97(1) | 0.57(1) | 2.02(8) | 3.0(1) | 1.38(4) | 6.46 | 2.25 | 0.68(1) | 2 | 0.9 | 303/283 | 19768(141) | ||
| 7 | 0402910101 | X | BB+PL | 3.46(3) | 0.40(2) | 0.8(2) | 4.0(1) | 2.07 | 4.77 | 0.45 | 140/131 | 4632(70) | |||||
| 8 | 0742650101 | X | PL | 10(2) | 2.1(3) | 0.02(1) | 2.59 | 1.9 | 1.1 | 53/51 | 175(19) | ||||||
| 9 | 0404340101 | X | BB+PL | 2.39(5) | 0.56(5) | 0.17(3) | 3.8(2) | 10.61 | 0.02 | 0.80(3) | 1 | 0.39 | 129/136 | 2829(57) | |||
| 10 | 4605e | C | BB+PL | 1.36(4) | 0.455(4) | 3.3(1) | 2.50(2) | 1.42(3) | 11.01 | 1.95 | 0.324(5) | 3 | 0.38 | 479/440 | 120681(348) | ||
| 11 | 0790870201 | X | BB+PL | 3.6(2) | 0.61(1) | 1.56(5) | 0.9(4) | 3.83 | 6.4 | 0.29(3) | 1 | 1.32 | 234/203 | 8444(98) | |||
| 12 | 0654230401 | X | BB+PL | 9.7(1) | 0.59(3) | 1.2(1) | 1.4(1) | 0.8(1) | 7.55 | 49.5 | 0.06(2) | 1 | 0.87 | 241/212 | 14252(121) | ||
| 13 | 15870 | C | 2BB | 0.92(2) | 0.17(1) | 10(1) | 0.33(2) | 0.9(2) | 5.54 | 0.78 | 0.33(3) | 1 | 0.35 | 71/89 | 3095(56) | ||
| 14 | 15589–15593 | C | BB+PL | 0.453(8) | 0.12(1) | 4(1) | 4.5(4) | 8.44 | 0.002 | 0.38(3) | 1 | 0.16 | 128/114 | 2157(46) | |||
| 15 | 0013340201 | X | BB+PL | 2.26(5) | 0.41(1) | 6.1(4) | 2.25(6) | 3.3(2) | 11.79 | 4.09 | 0.15(2) | 2 | 0.85 | 299/321 | 26306(168) | ||
| 16 | 0790610101 | X | BB+PL | 1.9(1) | 0.52(1) | 2.6(1) | 1.3(2) | 0.38(4) | 5.20 | 9.20 | 0.20(2) | 2 | 1.25 | 278/237 | 12053(111) | ||
| 17 | 0057540101 | X | BB+PL | 1.10(2) | 0.48(2) | 1.5(1) | 4.03(5) | 2.4(1) | 6.98 | 0.05 | 0.18(1) | 2 | 0.32 | 452/447 | 19715(141) |
Note. Numbers in parentheses are a quadrature sum of the statistical and systematic (due to uncertainties) uncertainties at the 1 level.
a1. CXOU J010043.1721134, 2. 4U 0142+61, 3. SGR 0418+5729, 4. SGR 0501+4516, 5. SGR 052666, 6. 1E 1048.15937, 7. 1E 1547.05408, 8. SGR 162741, 9. CXOU J164710.2455216, 10. 1RXS J170849.0400910, 11. CXOU J171405.7381031, 12. SGR 180620, 13. XTE J1810197, 14. Swift J1822.31606, 15. 1E 1841045, 16. SGR 1900+14, 17. 1E 2259+586
b Instrument. X: XMM and C: Chandra.
c Values taken from the McGill online catalog.
d Absorption column densities in the Galaxy and large Magellanic cloud (Park et al., 2012).
e Continuous clocking mode observation.
3 Data analysis Result
We describe general analysis procedure first (Sections 3.1 and 3.2) and present the results for each target in Section 3.3.
3.1 Spectral analysis
Quiescent fluxes of magnetars substantially differ from source to source, and so we selected adequate source and background regions for each source for spectral analysis.

For the Chandra data, we used a – circular region centered at the source position to extract the source spectrum, and used a – circle in a nearby source-free region to extract the background spectrum.
Note that we used and rectangular regions
for the source and background extraction, respectively,
for the bright magnetars 1E 1048.15937 and 1RXS J170849.0400910 because the
observations were taken with the continuous clocking mode (Table 1).
For the XMM data analysis, we used a –
and a – circle for the source and background extraction, respectively.
The target 1E 2259+586 was observed far off-axis, and thus we used a 2040′′
elliptical region for the source spectrum.
We verified that the results did not
alter significantly depending on the source/background region selections.
Corresponding response files were generated with the standard CIAO and SAS tools
for the Chandra and XMM data, respectively. We fit the spectra employing the statistic after
grouping them to have a minimum of 20 events per spectral bin
except for SGR 162741. For it, we grouped the spectra to have
at least 5 events per bin due to a lack of photon statistics
and utilized the statistic444https://heasarc.gsfc.nasa.gov/xanadu/xspec/manual/XSappe
ndixStatistics.html
(Loredo, 1992) for the spectral fit.
Actual emission spectra of magnetars can be very complex to be fully described by simple phenomenological models because the thermal emission from the surface is modified in the atmosphere and magnetosphere (e.g., Ho, 2001; Potekhin & Yakovlev, 2001) and the nonthermal emission depends on the poorly known RCS geometry (e.g., Wadiasingh et al., 2018). In general, a BB, PL, or BB+PL model has been employed in literature because they can approximately represent the thermal and/or nonthermal emissions of magnetars. We adopted the BB+PL model as the default since it has been most commonly used in previous studies (Section 3.3). We checked to see if the model adequately describes our data, and made a literature search to see if a different model has been favored on statistical or physical grounds. The BB+PL model adequately described the spectra of most of the targets in the previous and our studies (Table 1). A different model, BB, PL, 2BB, or 2BB+PL, was favored for some targets (e.g., 4U 0142+61, SGR 0418+5729, SGR 162741, and XTE J1810197; Table 1) in previous studies, and our investigation of their spectra agreed with the previous results; for these targets we adopted the favored models. Note also that multiple spectral models (mostly BB+PL and 2BB) could not be discerned for some magnetars. In these cases, we took the BB+PL model as our baseline and investigated the other model as an alternative in the correlation study (see Section 4.2).
We fit the source spectra with the aforementioned models in XSPEC v12.11.1 (Arnaud, 1996) and show them in Figure 1. Because the absorption column densities () towards some targets were often not well constrained with the quiescent data alone due to the paucity of counts, we searched literature for values that were inferred from a multi-epoch spectral analysis conducted with the same spectral model as ours. If such a value was available, we used the same abundance and cross section as those in the literature and held fixed at the value (Section 3.3). If we could not find a reported value of , we optimized it in our spectral fit using the tbabs model with vern cross section (Verner et al., 1996) and angr abundance (Anders & Grevesse, 1989). The measured spectra and the best-fit parameters are presented in Figure 1 and Table 1, respectively. The models describe the data adequately (null hypothesis probabilities ) although some residuals are noticeable. They may indicate some other physical processes (e.g., cyclotron absorption; Tiengo et al., 2013) but an additional component was not required in the spectral fits. We describe the analysis results in more detail in Section 3.3.
3.2 Timing analysis
In our measurements of the temporal properties of the quiescent magnetars, we attempted to detect their pulsations and measure at the epoch. Even though they were already well measured (e.g., McGill magnetar catalog), our reanalyses were necessary because changes with time (e.g., slowly due to ) and would be different at the epoch of the observational data we analyzed. Small inaccuracies ( s) in are not a problem for our correlation study, but the measurements of may be substantially affected by the inaccuracies.
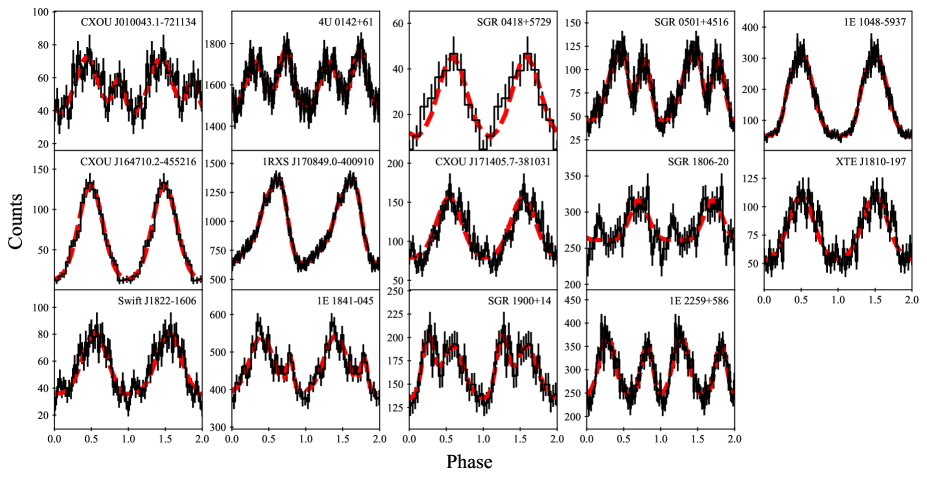
For a timing analysis, we barycenter-corrected the source and background event arrival times using the source positions reported in the McGill magnetar catalog and searched for pulsations of each target by employing an test (e.g., de Jager et al., 1989) to measure of the target at the epoch of the observation. The pulsations were well detected for most of the targets except for a few faint sources. The measured values are not very different () from those reported in the McGill catalog. We then constructed pulse profiles of the source and background emissions by folding 0.5–10 keV events on the best period. The background-subtracted pulse profiles are displayed in Figure 2.
While of a magnetar can be defined in various ways (e.g., Vogel et al., 2014; An et al., 2015), in this work we defined it to be the area fraction above the constant level in the pulse profiles which were modeled as a combination of Gaussian functions. We fit the profiles of the targets with a Gaussian plus constant function employing the statistic and successively added more Gaussians until an additional Gaussian was unnecessary. For each addition of a Gaussian, we performed an test. Note that the ideal distribution may be inadequate in the case that the parameter values of the additional component are near their boundaries. Hence we carried out simulations (e.g., Protassov et al., 2002); we generated 10,000 fake profiles based on the simpler model, fit them with the more complex model to compute the values, and derived an distribution appropriate for the model comparison. We required the value corresponding to the measured to be less than 0.01 for an addition of a new component. We verified that the optimized models achieved good fits to the pulse profiles with the probabilities . The numbers of Gaussians () needed to fit the profile and the estimated are presented in Table 1. We further verified the values using the unbinned likelihood fit and Akaike information criterion (AIC; Akaike, 1974). We found that the values inferred by this method generally agreed with the above results, but in a few cases the results of the AIC and test differed by 1. Note, however, that the change of by 1 did not have large influence on the estimation (e.g., % for ) as long as the model describes the profile adequately; we included this small variation as the systematic uncertainty.
The best-fit functions are displayed in Figure 2. Note that the estimated value varies depending weakly on the number of bins. To mitigate this variation, we changed the number of bins by %, regarded the standard deviation of as a systematic uncertainty and added it to the statistical one. These systematic uncertainties are comparable to the statistical ones.
Note that we could not determine for any of the targets with our timing analysis because the observational data we analyzed covered only a short time interval (e.g., tens of ks) and thus the effect of was indiscernible. For this reason, we use and values reported in the McGill magnetar catalog for the correlation study (see Section 4.1).
3.3 Results of the spectral and timing analyses
Here we briefly describe the spectral and temporal properties of the targets and present our measurements. Note that the errors on the parameters reported in this section are 1 uncertainties obtained from spectral fitting (with fixed unless noted otherwise).
CXOU J010043.1721134 in the small Magellanic cloud is a persistent magnetar whose emission has been stable for approximately three decades (McGarry et al., 2005; Chatterjee et al., 2021). A previous study (Tiengo et al., 2008) of the source performed with multi-epoch data suggested that its quiescent spectrum is best described by a 2BB model with , keV keV while other commonly used spectral models (e.g., BB+PL) were disfavored by the multi-epoch data. This magnetar’s was measured to be % in the 0.2–6 keV (Tiengo et al., 2008).
We used the longest XMM data acquired on 2005 November 27, measured the quiescent spectrum, and fit it with a BB+PL and a 2BB model. It is beneficial to use low-energy (e.g., 0.5 keV) data for this source with very low , and hence we fit the data in the 0.1–10 keV band as was done by Tiengo et al. (2008). We found that both spectral models adequately describe the spectrum, and the best-fit parameters are keV and (for ; Tiengo et al., 2008) for the BB+PL model, and keV and keV (for ) for the 2BB model. For this source, we use the BB+PL parameters as our baseline for the correlation study (Section 4.1), but we also consider the 2BB parameters (Section 4.2). Note that of the 2BB model is slightly different (but within the uncertainty) from the previously reported value; this seems to be caused by the covariance between the BB temperature and radius. Our fit favors a smaller and a larger . We verified that this difference did not have significant influence on the correlation results. We measured to be % in the 0.5–10 keV band.
4U 0142+61 is an old ( kyr), bright, and relatively stable magnetar (Rea et al., 2007; Tendulkar et al., 2015), albeit with small and infrequent activities (e.g., Göğüş et al., 2017; Archibald et al., 2017; Coti Zelati et al., 2018). Gonzalez et al. (2010) analyzed multiple observations spread over 2000 d and suggested that the source’s quiescent spectrum is mildly variable and is best described by 2BB+PL. The authors reported ranges of the spectral parameters: 0.27–0.31 keV, 0.50–0.60 keV, and 2.6–3.0 for .
We selected the observation made with XMM on 2003 January 24 when the source was faintest. Because the MOS data were taken with the timing mode, we used only the PN data. Our 2BB+PL fit of the spectrum resulted in keV, keV, and , which are consistent with the previous measurements. The simpler BB+PL and 2BB models could be rejected statistically. The magnetar’s is known to be small (Fig. 2), and we found % in the 0.5–10 keV band, which is consistent with a previous result of % in the 0.3–10 keV band (e.g., Göhler et al., 2005).
SGR 0418+5729 is a low- ( G) magnetar that was discovered due to its dramatic outburst on 2009 June 5 (Rea et al., 2013). The source flux had declined during the subsequent years and reached a quiescent level 2 yr after the onset of the outburst. Rea et al. (2013) analyzed long-term data spanning 3 yrs, fit the quiescent spectrum with a simple BB model having and keV, and measured to be 60–80% in the 0.5–10 keV band.
We analyzed the most sensitive XMM data taken on 2012 August 25. The source spectrum was well fit with a BB model having keV, and additional spectral components were statistically unnecessary. The source’s pulsations with % were well detected.
SGR 0501+4516 underwent an outburst in 2008 (MJD 54701; 2008 August 23) and its flux decayed to a flat level 1 yr after the outburst (Camero et al., 2014). To measure the quiescent emission properties, Rea et al. (2009) analyzed archival ROSAT data collected between 1992 September 21 and 24 (before the 2008 outburst), and measured the 0.1–2.4 keV spectrum to be a BB ( keV) or a PL () for with the 1–10 keV observed fluxes of and for the BB and PL model, respectively. On the other hand, Mong & Ng (2018) performed a spectral analysis with multi-epoch data spread over 5 yrs (‘post-burst’ Chandra and Suzaku data taken between 2008 and 2013) and found that a BB+PL model with keV, for , or a 2BB+PL model with keV, keV and for fits the data well; they favored the latter based on some high-energy residuals.
The source fluxes measured by Mong & Ng (2018) are higher by 50% than that measured with ROSAT, possibly indicating that the source had not returned to its quiescent state or that the source’s quiescent emission is variable. We, however, speculated that this discrepancy might be caused by ROSAT’s lack of 2 keV sensitivity. To confirm this, we used two Chandra observations taken on 2012 December 9 and 2013 April 3 when the source flux decreased by an order of magnitude compared to the maximum (see Camero et al., 2014). For a spectral analysis we restricted the energy band to ‘0.5–2.4 keV’ to compare with the ROSAT results and held fixed at which was used for the ROSAT analysis (see above). We found out that the ‘Chandra’ spectra are well modeled with a BB having keV with the 1–10 keV observed flux of . These results are in good agreement with the ROSAT measurements, meaning that the magnetar actually returned to the preburst state at the epoch of the Chandra observations.
Our analysis of the aforementioned Chandra data in the ‘0.5–10 keV’ band ruled out the simple BB model, and thus we used BB+PL, 2BB and 2BB+PL models (e.g., Mong & Ng, 2018) and found that the PL component of the 2BB+PL model is statistically unnecessary. The best-fit parameters for the BB+PL model are keV and , and those for the 2BB model are keV and keV. Our best-fit BB temperatures do not agree well with those of Mong & Ng (2018). This discrepancy is presumably induced by parameter covariance; holding and fixed at their values in our fits reproduces their results. Note also that they jointly analyzed the Chandra and Suzaku data (2013 August), whereas we used only the Chandra data. We verified that this difference in did not have a significant impact on the correlation results (Section 4). We use our best-fit BB+PL model for the correlation study, but also consider the 2BB and 2BB+PL models (Section 4.2). We measured % (0.5–10 keV), which is consistent with % in the 0.3–12 keV band measured when the source was slightly brighter (with 2009 XMM data; Camero et al., 2014).
SGR 052666 was discovered in the supernova remnant (SNR) N49 in the large Magellanic cloud (LMC). The source exhibited a giant flare in 1979 (Cline et al., 1982) but no strong activity has been seen since then. Güver et al. (2012) found that the source flux has decreased slowly by 20–30% over 15 yrs by comparing 1994 ROSAT (Rothschild et al., 1994), 2000/2001 and 2009 Chandra measurements; no significant change of the BB temperature was seen. Given the small flux decay rate, we assumed that the source has been in (near) a quiescent state over the 15-yr period. A previous spectral analysis of multi-epoch data found that a BB+PL or a 2BB model adequately explains the observed spectrum (Park et al., 2012). The best-fit parameters inferred from the analysis are (Galactic absorption), (LMC absorption), keV, and for the BB+PL model, and , , keV, and keV for the 2BB model. Note that the authors favored the 2BB model because the fit-inferred towards the magnetar agrees better with that inferred towards the surrounding SNR. Pulsations of this magnetar were only weakly detected, and the reported values are diverse; Tiengo et al. (2009) measured it to be % in the 0.65–12 keV band, whereas Güver et al. (2012) reported of 1.5–4.4% in the 0.5–6.5 keV band. The discrepancy might be caused by different definitions of and energy bands used for the measurements.
We used the Chandra data acquired on 2009 September 19 when the source flux was lowest (see Güver et al., 2012). For an analysis of the Chandra data, we adopted the BB+PL and 2BB models and found keV and (BB+PL), and keV and keV (2BB), using the corresponding absorption column densities reported by Park et al. (2012) for each of the spectral models. We use the BB+PL parameters for the correlation study, but also consider the 2BB ones (Section 4.2). The source pulsations were not well detected in the Chandra data and so we could not reliably measure for this source.
1E 1048.15937 is a bright magnetar that has exhibited frequent outbursts and bursts (e.g., Gavriil & Kaspi, 2004; An et al., 2014; Archibald et al., 2020). Its quiescent state was well identified by long-term monitoring (e.g., Tam et al., 2008; Archibald et al., 2020), and Tam et al. (2008) analyzed Chandra monitoring observations taken in a stable and quiescent state. They found that a BB+PL model with , – keV, and – describes the source spectra well, and that is 61–70% in the 2–10 keV band (see also Yang et al., 2016).
We analyzed the Chandra data taken on 2006 September 23, fit the spectrum with a BB+PL model, and found the best-fit parameters to be keV and . The source pulsations were well detected and was measured to be % in the 0.5–10 keV band.
1E 1547.05408 is a radio magnetar (i.e., radio pulsations; Gelfand & Gaensler, 2007; Camilo et al., 2007) that underwent an outburst in 2007 (e.g., Halpern et al., 2008). The source was in the lowest flux state in 2006 just before the outburst (Bernardini et al., 2011). The authors analyzed multi-epoch data taken in outburst (in 2009) and in quiescent (in 2006), fit the quiescent spectrum with a BB+PL model, and measured keV, , and . Note that the value was inferred from a joint fit of the multiple-epoch data. In the quiescent data, Bernardini et al. (2011) did not detect significant pulsations and hence reported an upper limit of 15% for .
We also analyzed the XMM data collected on 2006 August 21 and were able to rule out single component models (BB or PL). For the BB+PL model, we measured the best-fit parameters to be keV and . Our search for the 2-s pulsations resulted in an insignificant detection in agreement with Bernardini et al. (2011) (see also Gelfand & Gaensler, 2007).
SGR 162741 has shown outbursts in 1998 and 2008 (e.g., Kouveliotou et al., 1998, 2003; Esposito et al., 2008). Although a ‘stable’ flux state of the source could not be convincingly identified in a long-term light curve (An et al., 2018), the source flux reached a historical minimum in 2015, 2000 d after the latest outburst; we assumed that the magnetar was in quiescence at that time. The source spectrum measured with the 2015 XMM data was modeled by a PL (An et al., 2018) for (Esposito et al., 2008).
We analyzed the 2015 XMM data and found for . A BB model also achieves a good fit with and keV, but the temperature appears to be too high compared to those of other quiescent magnetars. So we do not consider the BB model in our correlation study. Its pulsations were detected only during an outburst (bright) state (Esposito et al., 2008), and the 2015 XMM data were not sufficient for a detection of the pulsations. Note that the correlation results did not change much whether or not we included this source.
CXOU J164710.2455216 is a low- magnetar possibly associated with the star cluster Westerlund 1 and has a characteristic age of Myr (Muno et al., 2006). It was in a stable low-flux (‘quiescent’) state with the 2–10 keV flux of (2–3) (An et al., 2013; Coti Zelati et al., 2018) before MJD 54000 when the source underwent an outburst. Muno et al. (2007) fit XMM data taken on 2006 September 16 (MJD 53995; a week before the outburst) with a BB model and inferred to be keV (for ), but a joint analysis of long-term data (including the XMM data of Muno et al., 2007) suggested that a BB+PL model with , keV and explains the spectrum better (An et al., 2013).
We analyzed the XMM data taken on MJD 53995 and found that a BB+PL model with keV and explains the data adequately. A simple BB model could be ruled out with an -test probability of . Although the pulsations of the source were well detected, of the source measured with the XMM data has not been reported previously. We detected its pulsations with high significance and measured the pulsed fraction to be %. Note that for this magnetar has been controversial (Rodríguez Castillo et al., 2014) but a recent study carried out with NICER data found (An & Archibald, 2019). We reported this value in Table 2.
1RXS J170849.0400910 is a very bright magnetar whose emission was detected 100 keV (Kuiper et al., 2006). This magnetar has not exhibited any outburst, and its flux seems mildly (50%) variable (Şaşmaz Muş & Göğüş, 2013; Rea et al., 2007). A previous analysis of 10 yr data found that the source’s quiescent spectrum is well described by a BB+PL model having =0.41–0.48 keV, =2.5–2.8, and , and that is % in the 0.3–8 keV band (Rea et al., 2007).
We used the Chandra observation taken on 2004 July 3 when the source had the lowest flux. We fit the source spectrum with a BB+PL model and measured the best-fit parameters to be keV and which are within the ranges of the previous estimations. The spectral fit was acceptable with the null hypothesis probability of 0.1, but some residual trends are noticeable at low energies (Fig. 1). Note that the observation was taken with the CC mode and thus an accurate estimation of the background was difficult, which might cause the residual. Its 11-s pulsations were significantly detected and was measured to be % in our analysis.
CXOU J171405.7381031 is a bright 3.8-s magnetar associated with the SNR CTB 37B (Halpern & Gotthelf, 2010). The source has been stable for 10 yrs without exhibiting any burst or outburst since the Chandra discovery in 2010. Gotthelf et al. (2019) jointly analyzed XMM /PN and NuSTAR data taken on 2016 September 22–23, fit the spectrum with a BB+PL model having , keV and (90% confidence interval). They measured to be % in the 1–5 keV band.
We analyzed the same XMM data (MOS+PN) and were able to reproduce the previous results: keV and . The pulsations of the source were detected with high significance, and we measured % in the 0.5–10 keV band. This is slightly lower than the previous measurement of %; the discrepancy may stem from the different energy bands as this magnetar shows a change of the pulse profile with energy (Gotthelf et al., 2019).
Note that we inferred from the XMM data varies substantially (by ; Table 1) when we varied within its 68% uncertainty. This uncertainty can be significantly reduced by jointly analyzing NuSTAR hard X-ray data as was done by Gotthelf et al. (2019). We therefore jointly analyzed the XMM (PN+MOS) and NuSTAR (Obs. ID 30201031002) observations, and were able to better constrain both and to within and 0.1, respectively. Nonetheless, we use the large uncertainty () for our simulations (i.e., for ; see Section 4) to be conservative. Note that the best-fit parameters do not change in our joint analysis of the XMM and NuSTAR data and hence the correlation results (i.e., ; see Section 4) do not alter.
SGR 180620 is one of the few magnetars that have exhibited a giant flare (2004 December 27.; Hurley et al., 2005; Mereghetti et al., 2005; Terasawa et al., 2005). The source flux has been low and stable since 2010, which establishes well the quiescent state of the source (Younes et al., 2017; Coti Zelati et al., 2018). Its quiescent emission (after 2010) was slightly lower than a preburst level (i.e., before 2004; Younes et al., 2015), and was well characterized by a BB+PL model with =0.59–0.67 keV, 1.27–1.38, and (2015–2016 NuSTAR data; Younes et al., 2017). These are consistent with results of the multi-epoch XMM data analysis (Younes et al., 2015) which constrained better (). The root-mean-square (RMS) of the source was measured to be 3–8% over the 8 yrs between 2003 and 2011 (Younes et al., 2015).
Because the BB emission can be more accurately measured with XMM than NuSTAR, we analyzed the 2011 XMM data to characterize the quiescent emission of the source. Note that we did not use the MOS2 data because they were taken with the timing mode. We fit the XMM spectrum with a BB+PL model and found and (for ; Younes et al., 2015). Although the source is bright at X-rays, the detection significance for its pulsations in the quiescent data was modest because of the low (e.g., Woods et al., 2007) which we measured to be %.
XTE J1810197 was serendipitously discovered on 2003 July 15 during its relaxation into a quiescent state after an undetected outburst between 2002 November 17 and 2003 January 23 (Ibrahim et al., 2004). The source flux in 2003 was higher by approximately two orders of magnitude compared to the historical minimum measured by ROSAT in 1991–1993 (Gotthelf et al., 2004). Analyses of the ROSAT survey data suggested that the preburst spectrum of the source is well described with a BB model having keV and the 0.5–10 keV absorbed flux of (5.5–8.3) for (Gotthelf et al., 2004), or a 2BB model having keV, km, keV and km for (Bernardini et al., 2009). The source flux seemed to have reached the stationary preburst level since 2007 (Alford & Halpern, 2016; Pintore et al., 2019). The lowest flux state after the outburst was observed by Chandra on 2014 March 1 (a decade after the outburst), and Vurgun et al. (2019) fit the source spectrum with a 2BB model, inferring , keV and keV.
We reanalyzed the 2014 Chandra data, measured the source spectrum, and fit it with a BB+PL or 2BB model. The best-fit BB+PL parameters are keV, for , and the 2BB parameters are keV and keV (for ; Vurgun et al., 2019). Note that we optimized for the BB+PL model because it has not been explored previously. The PL index inferred from the BB+PL model is uncomfortably large. Presumably, it is an artifact caused by forcing to fit high-temperature BB emission with the PL model. For this reason, the 2BB model has been favored over the BB+PL one for this source (e.g., Gotthelf et al., 2004; Alford & Halpern, 2016). We, therefore, use the 2BB parameters for the correlation study (Section 4.1). We estimated to be % in the 0.5–10 keV band, which is slightly lower than % measured in the 1.5–5 keV band (Alford & Halpern, 2016).
Note that the 0.5–10 keV absorbed flux of and inferred from the 2BB fit are slightly higher than but within the uncertainties of the ROSAT measurements. This may indicate some variability. Alternatively, it may mean that the Chandra data do not represent very well the quiescent state of the source. Hence we also investigate the correlations with the ROSAT-measured spectral parameters (Section 4.2) and verified that the results did not alter significantly.
Swift J1822.31606 is a faint low- magnetar (Scholz et al., 2014; Rodríguez Castillo et al., 2016) that was discovered in outburst on 2011 July 14 (Cummings et al., 2011; Livingstone et al., 2011). The source flux has decreased since then and seemed to have reached a stationary level 1000 d after the onset of the outburst (Coti Zelati et al., 2018). A ‘preburst’ spectrum of the source measured with archival ROSAT data collected in 1993 was fit with a BB model having keV and an absorbed 0.1–2.4 keV flux of for (Scholz et al., 2012). Note that this value was inferred from a joint fit of multi-epoch Swift and Chandra data with a BB+PL model. The ROSAT data were not sensitive enough to allow a detection of the pulsations. Scholz et al. (2012) therefore used Swift observations taken when the source was slightly brighter than at the ROSAT epoch and measured to be 45–50% in the 2–10 keV band.
To measure the ‘post-burst’ quiescent spectrum, Mong & Ng (2018) analyzed five Chandra observations taken between 2014 April 14 and 2014 October 11, and reported the best-fit parameters of a 2BB model of keV and keV for . We also analyzed the five Chandra observations and fit the source spectra with a BB+PL or 2BB model. These models explain the observed spectra equally well, and the best-fit parameters for the BB+PL model are keV and (for ; Scholz et al., 2014), and those for the 2BB model are keV and keV (for ; Mong & Ng, 2018).
To compare with the ROSAT results, We tried to fit the 0.1–2.4 keV Chandra spectrum with a simple BB model. The Chandra data required an additional model component, and the measured 0.1–2.4 keV absorbed flux of is 2 times higher than (but within the uncertainty of) the ROSAT measurement. This may indicate some variability of the quiescent flux or alternatively suggest that the source did not reach the quiescent state (e.g., ROSAT measured state) in 2014. Although the large uncertainties in the ROSAT measurements preclude a firm conclusion, the differences are not large, meaning that the source was in or ‘near’ quiescence. Thus, we use the Chandra BB+PL parameters as our baseline for the correlation study, but investigate the correlations with the ROSAT-measured properties as well (Section 4.2). The source’s pulsations were well detected in the Chandra data, and we measured to be %.
1E 1841045 is the power source of the SNR Kes 73 and is the first magnetar from which 100 keV emission was discovered (Molkov et al., 2004). It has not shown a dramatic outburst, but hard X-ray bursts have been detected (e.g., An et al., 2015). The source emission is very strong and stable in the X-ray band, and so its quiescent spectrum was relatively well measured; Morii et al. (2003) and An et al. (2013) fit the spectrum with a BB+PL model and found the best-fit parameters to be – keV and – for –.
We measured the source spectrum using the XMM data taken on 2002 October 7, fit the spectrum with a BB+PL model, and obtained the best-fit parameters of keV and (for ; An et al., 2013). The source’s pulsations were well detected, and the measured is %, which is consistent with % in the 0.6–7 keV band (Morii et al., 2003).
SGR 1900+14 is a magnetar that exhibited a giant flare (1998 August 27; Feroci et al., 1999). The source flux appears to have reached a quiescent level since 2006 (Mereghetti et al., 2006; Tamba et al., 2019). Tamba et al. (2019) fit quiescent spectra measured by XMM and NuSTAR with a BB+PL model having keV, , and , and measured to be 19–22% in the 1–10 keV band.
We analyzed the XMM data taken on 2016 October 20 (the XMM data analyzed by Tamba et al., 2019) when the source flux was lowest. The XMM spectra were well fit with a BB+PL model having keV and , and was measured to be % in the 0.5–10 keV band.
1E 2259+586 is a bright magnetar within the SNR CTB 109, and exhibited outbursts in 2002 (Kaspi et al., 2003) and 2014–2016. A long-term light curve (Zhu et al., 2008) showed that the source flux has declined relatively rapidly to a quiescence level on a timescale of a few years. Woods et al. (2004) measured a quiescent spectrum of the magnetar using the XMM observation taken on 2002 January 22, just before the 2002 outburst, and reported the best-fit BB+PL parameters of keV, and for .
We analyzed the same XMM data that Woods et al. (2004) used and fit the spectrum with a BB+PL model. Note that we used only the PN data because the MOS data are severely affected by the pile-up effect (Woods et al., 2004). The best-fit BB+PL parameters are keV and . The pulsations of the source were detected with high significance and was measured to be % which is consistent with a previous measurement of % in the 2–10 keV band (Woods et al., 2004; Zhu et al., 2008).
4 Correlation analysis
4.1 Correlation study with the baseline model parameters
We grouped the magnetars’ properties into timing and emission properties for a cross-correlation study. The six timing properties, and , , , , and are all derived from two measured parameters: and . The number of emission properties differs for each spectral model (Table 2), but we used the following 9 properties: , , (), , PL flux (), PL luminosity , total X-ray luminosity (=), a distance independent luminosity ratio , and . Note again that , , , and were measured in the 0.5–10 keV band.
We constructed 54 temporal-emission property pairs and 36 emission-emission property pairs. Since power-law relations between some properties have been predicted by magnetar models, we employed a log scale for the properties except for , , and (see also Kaspi & Boydstun, 2010; Enoto et al., 2010; An et al., 2012; Mong & Ng, 2018). Scatter plots of the property pairs are displayed in Figures 3 and 4. For each pair of the properties, we computed the Pearson’s correlation coefficient and used the Fisher transformation (Fisher, 1915) to estimate the correlation significance (). Property pairs with or (Section 4.2), and their correlation significances are presented in Table 2.

 |
| Properties | |||||||
|---|---|---|---|---|---|---|---|
| () | () | () | () | () | () | ||
| 3.3 | 3.2 | 0.3 | 3.3 | 3.3 | 0.3 | ||
| 3.4 | 3.4 | 0.4 | 2.5 | 2.6 | 0.3 | ||
| 3.3 | 3.0 | 0.3 | 3.2 | 2.9 | 0.3 | ||
| 3.6 | 3.5 | 0.3 | 3.6 | 3.7 | 0.4 | ||
| 3.6 | 3.5 | 0.5 | 2.7 | 2.7 | 0.4 | ||
| 3.7 | 3.4 | 0.3 | 3.6 | 3.3 | 0.3 | ||
| 3.0 | -2.9 | 0.3 | 3.0 | 3.0 | 0.3 | ||
| 3.1 | 3.1 | 0.4 | 2.2 | 2.3 | 0.2 | ||
| 4.2 | 4.2 | 0.3 | 4.1 | 4.0 | 0.3 | ||
| 3.0 | 2.9 | 0.3 | 2.9 | 2.8 | 0.3 | ||
| 3.4 | 2.8 | 0.5 | 1.8 | 1.4 | 0.5 | ||
| 3.9 | 4.0 | 0.4 | 2.5 | 2.7 | 0.5 | ||
| 6.5 | 6.3 | 0.4 | 6.5 | 6.3 | 0.4 | ||
| 2.1 | 2.2 | 0.3 | 3.9 | 3.6 | 0.9 | ||
| 1.8 | 1.9 | 0.3 | 3.1 | 3.0 | 0.7 | ||
| 7.4 | 7.7 | 0.6 | 5.5 | 6.0 | 0.6 | ||
a Correlation significance in units of . Negative values mean anti-correlation.
b Variation of the correlation significance due to uncertainties on the properties. See text for more details
Note that it is difficult to accurately measure and of magnetars because of large timing noise and glitches. Moreover, distances (’s) to magnetars are poorly constrained. Thus there are various suggestions for those values.555http://www.physics.mcgill.ca/pulsar/magnetar/TabO2.html In general, the suggested values of for a magnetar differ only little (), which is not a concern for the correlation study. However, those of (and ) are substantially different. To take this into account, we performed simulations. For each target, we randomly picked a and a (uniform priors) value among the suggested ones, and further varied the spectral parameters. Note that the spectral parameters are known to covary, and the covariance was taken into account in the simulations as follows. We varied using the value and uncertainty presented in Table 1. We held fixed at the varied value and refit the spectral data to derive the best-fit spectral parameters appropriate for the varied . We then used the covariance matrix provided by XSPEC to generate a simulated set of the spectral parameters for each target, and computed the correlation coefficients. We repeated this procedure 10,000 times and measured the mean () and standard deviation (); these are presented in Table 3 for reference.
The timing properties and are well correlated with the emission properties , and . also shows correlations with and . Some correlations between the emission properties were anticipated from the constructions of the quantities (e.g., ), but the -, and - correlations are intriguing. The - correlation is also intriguing, but it is induced by a few high- points with very large uncertainties (Fig. 4) and thus varies significantly (e.g., and in Table 2). Hence this correlation is rather uncertain.
4.2 Correlation study with alternative spectral models
In Section 4.1, we used the spectral parameters of the baseline models reported in Table 1 (mostly BB+PL). However, 2BB models have also been suggested and favored for some magnetars on statistical or physical grounds (see Section 3.3). These targets are listed in Table 3. We replaced the BB+PL spectral parameters with the 2BB ones for these targets and computed the correlation significances (; Table 2). We also performed 10,000 simulations as was done is Section 4.1, and measured average correlation significances () and standard deviations (). The results are reported in Table 2.
The significantly-correlated properties found using the baseline models mostly remain unchanged, but some of the PL-related correlations (-, -, and -) became less significant when the 2BB parameters were used perhaps because of the reduction in the number of PL samples. Notice that those PL-related correlations are still modest (e.g., 2.5 except for the - correlation). Correlations with the higher-temperature BB properties ( and ) could not be measured due to the lack of 2BB samples.
| Name | Model | ||||
|---|---|---|---|---|---|
| (keV) | (km) | (keV) | (km) | ||
| J0100 | 2BB | 0.29(2) | 12(1) | 0.57(7) | 2(1) |
| SGR0501 | 2BB | 0.27(1) | 1.5(1) | 0.72(2) | 0.15(1) |
| SGR0526 | 2BB | 0.40(2) | 11(1) | 1.0(1) | 1.2(4) |
| J1822 | 2BB | 0.11(1) | 6(1) | 0.27(2) | 0.3(1) |
5 Discussion
We presented a refined list of quiescent magnetars and investigated correlations between their spectral and temporal properties, including which has not been explored previously. We further considered uncertainties in the spectral and temporal parameters as well as the distances to the targets using simulations. Hence, our correlation study is more thorough than the previous ones. Here we discuss some intriguing correlations (e.g., ; Section 4.1) obtained using the baseline models (Table 1). Using 2BB models for some of the targets (Section 4.2) alters significances of PL-related correlations as noted above.
5.1 Significant correlations between temporal and emission properties
As noted in Section 4.1, the timing properties are derived from and measurements, and then the correlations of the emission properties with (Table 2) might have induced those with the other timing properties that are combinations of and (e.g., and ). The timing properties are thought to represent physical quantities approximately, and the results (Table 3) show that there are better (or worse) combinations of and that make the correlations more (less) significant. These can provide insights into magnetars’ evolution and emission mechanisms (e.g., Marsden & White, 2001; Kaspi & Boydstun, 2010; An et al., 2013; Mong & Ng, 2018).
The results presented in Table 2 confirm the previously suggested - (Kaspi & Boydstun, 2010) and - (An et al., 2012; Mong & Ng, 2018) correlations. The - (anti-)correlation has been explained as due to an increased optical depth to the RCS in high- sources (Thompson et al., 2002); photons make multiple scattering and the magnetospheric particles have larger velocity spread, rendering the soft nonthermal spectrum harder (e.g., Fernández & Thompson, 2007; Kaspi & Boydstun, 2010). For the - correlation, we further separately investigated the thermal () and nonthermal () luminosities, and found that is significantly correlated with and not with (). This indicates that the - correlation is mainly driven by the - one. We speculate that this may be because is directly affected by the decay, whereas is influenced by both (seeds for RCS) and magnetospheric current (scatterer for RCS). Hence the - correlation might have been blurred. The - correlation supports the idea that magnetars’ emission power is supplied primarily by the internal decay for which magnetar models predict (original magnetar model; Thompson & Duncan, 1996) or (twisted- model; Thompson et al., 2002). In our fit of the - trend (Fig. 3), we found (and ). While the spin-inferred ’s may not accurately represent true ’s of magnetars, if assuming so, the result seems to agree reasonably with the twisted- model.
We discovered intriguing correlations of with and . These correlations are expected as magnetars lose their internal energy via long-term cooling; drops and the nonthermal (RCS) emission softens with time. Theoretically, Thompson & Duncan (1996) predicted – and a recent magneto-thermal evolution model predicted diverse trends depending on the initial configuration of (e.g., Fig. 7 of Viganò et al., 2013). To compare with the model predictions, we fit the - trend with a power-law function and found . It appears to agree reasonably well with the theoretical predictions of Thompson & Duncan (1996) and Viganò et al. (2013).
Marsden & White (2001) suggested a possible correlation between the spin-down torque () and using a small sample (7 magnetars). Kaspi & Boydstun (2010) investigated this correlation using a larger sample (11 magnetars) and noted that the - correlation is significant only at 1.8 which increases to 2.7 when ignoring 1E 1547.05408 for which the measurement was very uncertain (i.e., ; Gelfand & Gaensler, 2007). Later Bernardini et al. (2011) refined the measurement () using multi-epoch data. Hence we did not exclude 1E 1547.05408 from our correlation study (15 magnetars) and found a modest correlation between and at 2.8. This correlation is certainly intriguing but is not yet definitive. Related to the - correlation, we found that the spin-down ‘rate’ () is better correlated with . This correlation is in accordance with the twisted- model of magnetars (Thompson et al., 2002) which predicted that the twist increases the current flowing across the light cylinder, thereby resulting in an increase of the spin-down rate and the optical depth; the latter makes the spectrum harder (i.e., smaller ).
1E 1547.05408 seems to be an outlier for the -related correlations (Fig. 3) as was noted by Kaspi & Boydstun (2010) for the - correlation. Ignoring it from the sample makes all the -related correlations stronger. We note that the property pairs of the source, except for the -related ones, lie close to the correlation trends (Fig. 3), meaning that the source has properties of typical magnetars but its nonthermal emission is very soft. It is intriguing to note that the other target XTE J1810197 also shows extremely soft PL () emission for its rotational properties, if we consider the BB+PL model for the source (Section 3.3). Magnetospheric X-ray emission of these targets seems to be highly suppressed despite their strong G field. This may be related to the fact that the two magnetars 1E 1547.05408 and XTE J1810197 are the few ‘radio magnetars’ in which pulsed radio signals have been detected (only two in our target list; see also Chu et al., 2021). This is only speculative, and further studies are needed to address this issue.
5.2 Correlation between and
As we showed above (Section 5.1), has significant influence on BB emissions of magnetars. Then, may also be correlated with . However, we did not find any significant correlation between them (). Note that Pons et al. (2007) discovered a - correlation in a sample of ‘isolated neutron stars’ with in the range of – G (i.e., including some thermally emitting X-ray pulsars and magnetars). They further measured the correlation trend to be and suggested that the correlation implies that the internal heat is generated by magnetic field decay: . However, it appears that the correlation in the magnetar group alone seemed insignificant in that work (Fig. 1 of Pons et al., 2007), and Zhu et al. (2011) noted that the - correlation is insignificant in a larger sample of neutron stars (normal pulsars, high- pulsars, and X-ray-isolated neutron stars) than was used by Pons et al. (2007). These mean that the - correlation suggested by Pons et al. (2007) might be caused by clustering of the pulsars (low and ) and the magnetars (high and ): i.e., a correlation between the pulsar and the magnetar populations not within the “isolated neutron star” population.
In the magnetar population, Rea et al. (2008), using a physically-motivated RCS model, found no significant correlation between the surface temperature () and . On the other hand, Mong & Ng (2018) used a 2BB or a 2BB+PL model for a sample of magnetars, and suggested that the model-inferred temperature for the cooler BB emission with a radius greater than 3 km is correlated with (). So the current situation for the - correlation in the magnetar population is unclear as the correlation significance alters substantially depending on the spectral model and targets used for the studies. Further theoretical and observational studies are warranted.
5.3 Correlations between emission properties
We found significant correlations in a number of emission property pairs (Table 2 and Fig. 4), which can provide hints to emission mechanisms of magnetars as compared to RPPs. As we noted above, both magnetars and RPPs emit nonthermal X-ray radiation in the magnetosphere, but suggested emission mechanisms are very different: RCS off of the thermal seed photons (i.e., ) for magnetars vs synchrotron radiation for RPPs. While the RCS scenario has been favored over the synchrotron scenario for magnetars based on theoretical arguments and observed spectral features (e.g., spectral turn-over at 10 keV in some magnetars), further observational supports would help to discern the scenarios more clearly. A difference between the RCS and synchrotron scenarios is that the nonthermal emission is strongly affected by the thermal one as the latter provides seeds for the former in the RCS scenario, whereas the thermal and nonthermal emissions are not strongly related to each other in the synchrotron scenario. Hence, the correlation we found between and supports the RCS scenario for magnetar’s nonthermal emission.
The - (and -) correlation is observationally obvious as . In this case, however, the lack of - correlation () is puzzling. This is probably because the simple BB+PL or 2BB model only approximately represents magnetars’ emission. For example, some low-energy contamination from multiple cold spots and/or magnetosphere might be ascribed to the BB model, which would increase the fit-inferred and but lower , thereby enhancing the - correlation and blurring the - one.
5.4 Comparisons with other neutron-star populations
Correlations of the emission and temporal properties in the populations of RPPs with nonthermal X-ray emission (Li et al., 2008) and thermally emitting pulsars (Zhu et al., 2011) have also been studied. Li et al. (2008) carried out a correlation study with temporal and ‘nonthermal’ emission properties of 27 RPPs. Although only some of the property pairs are correlated with high significance (e.g., chance probabilities of ), it appears that the RPPs’ nonthermal X-ray luminosity is well correlated with their temporal properties , , , and , and X-ray photon index is reasonably well correlated with and . Neither nor was found to be correlated with ; we confirmed this by reanalyzing the data presented in Li et al. (2008). Recalling that magnetars’ and are correlated with but not with (Table 2), the two populations, magnetars and RPPs, seem to be very different. This supports the idea that the primary energy sources of magnetars and RPPs are different; for the former and the rotational energy for the latter.
On the other hand, Zhu et al. (2011) investigated correlations of ‘thermal’ emission properties with temporal ones using a sample of thermally emitting pulsars (high- pulsars, normal pulsars and X-ray-isolated neutron stars; see Zhu et al., 2011, for more detail). Because the authors considered only - correlation, we reanalyzed the data (, , and ) presented in Zhu et al. (2011) after supplementing them with and taken from the ATNF catalog666https://www.atnf.csiro.au/research/pulsar/psrcat/, and found out that is correlated with at the 3 level. Again, neither nor is significantly correlated with or having significances . This may indicate that cooling of these thermally emitting pulsars occurs primarily by release of the residual heat in the core, not by the spin down or a decay. The cooling trend of the sources is measured to be . These pulsars seem to cool relatively slowly compared to magnetars (), meaning that magnetars’ energy loss (by and residual heat) is larger than the thermally emitting pulsars’.
In summary, these comparisons suggest that thermal and nonthermal emissions of the pulsars (i.e., RPPs and thermally emitting pulsars) arise from residual heat and spin-down energy, respectively, whereas magnetars’ emission is strongly affected by the decay of . While there are more to be studied by analyzing emission and temporal properties of the neutron-star populations (i.e., magnetars, RPPs, and the thermally emitting pulsars) simultaneously, we defer such a research to future work, since we need to scrutinize the measurements made for the pulsars (e.g., Li et al., 2008; Zhu et al., 2011) presumably by reanalyzing the data as we did here for magnetars.
6 Summary
-
•
We found that the emission properties, the thermal luminosity and the X-ray photon index , are correlated with the spin-down rate (), the surface dipole magnetic field strength () and characteristic age .
-
•
We found and trends which are similar to predictions of magnetar models.
-
•
We found that is correlated with . This correlation supports the RCS scenario for magnetars’ nonthermal emission.
-
•
The correlations in the magnetar population are different from those seen in other neutron-star populations (e.g., RPPs and thermally emitting pulsars), indicating that the energy sources for emissions of magnetars and the other neutron stars are different.
While the results obtained from our study suggest intriguing correlations that can help to delineate emission mechanisms in magnetars, there are things to be improved. While the spectral models we used in this work seem to represent the thermal and nonthermal properties of magnetars well, some residuals are noticeable (Fig. 1), possibly suggesting that the actual emission of magnetars may be different from these simple models. A well-justified physical model of magnetars’ emissions is lacking, but a correlation study with such a model in the future may reveal different correlations among the physical properties of the stars. The current identifications of the ‘quiescent’ state of the targets may not be very accurate. Besides, of some magnetars was measured during an outburst period, and in this case the measurement might be biased to a larger value by a putative glitch and its recovery (e.g., Woods et al., 2007). Better identification of the quiescent states and more accurate measurements of can be achieved with a deeper and high-cadence monitoring campaign for the magnetars over a long period. The current/future X-ray missions eROSITA (Predehl et al., 2021), Lynx Gaskin et al. (2019), AXIS Mushotzky et al. (2019) and Athena (Barcons et al., 2017) will certainly be very helpful.
Some magnetars exhibit a distinct hard X-ray (e.g., 10 keV) spectrum which we did not consider because they have been accurately measured only for a small number of magnetars (e.g., Kuiper et al., 2006). The hard-band properties may be correlated with the temporal and soft-band properties (e.g., Thompson & Beloborodov, 2005; Beloborodov, 2013; Wadiasingh et al., 2018), and can provide further insights into magnetar physics (e.g., Kaspi & Boydstun, 2010; Enoto et al., 2010; Yang et al., 2016). Deeper NuSTAR (Harrison et al., 2013) and future HEX-P (Madsen et al., 2018) observations of quiescent magnetars are warranted.
Acknowledgements.
This research was supported by the National Research Foundation of Korea (NRF) grant funded by the Korean Government (MSIT) (NRF-2022R1F1A1063468 and NRF-2023R1A2C1002718).References
- Akaike (1974) Akaike, H. 1974, A New Look at the Statistical Model Identification, IEEE Transactions on Automatic Control, 19, 716
- Alford & Halpern (2016) Alford, J. A. J. & Halpern, J. P. 2016, Evolution of the X-Ray Properties of the Transient Magnetar XTE J1810-197, ApJ, 818, 122
- An & Archibald (2019) An, H. & Archibald, R. 2019, X-Ray Timing Studies of the Low-field Magnetar CXOU J164710.2-455216, ApJ, 877, L10
- An et al. (2012) An, H. & Kaspi, V. & Tomsick, J. et al. 2012, Chandra Observations of SGR 1627-41 near Quiescence, ApJ, 757, 68
- An et al. (2013) An, H. & Kaspi, V. & Archibald, R. et al. 2013, Spectral and Timing Properties of the Magnetar CXOU J164710.2-455216, ApJ, 763, 82
- An et al. (2013) An, H. & Hascoët, R. & Kaspi, V. et al. 2013, NuSTAR Observations of Magnetar 1E 1841-045, ApJ, 779, 163
- An et al. (2014) An, H. & Kaspi, V. & Beloborodov, A. et al. 2014, NuSTAR Observations of X-Ray Bursts from the Magnetar 1E 1048.1-5937, ApJ, 790, 60
- An et al. (2015) An, H. & Archibald, R. & Hascoët, R. et al. 2015, Deep NuSTAR and Swift Monitoring Observations of the Magnetar 1E 1841-045, ApJ, 807, 93
- An et al. (2018) An, H. & Cumming, A. & Kaspi, V. 2018, Flux Relaxation after Two Outbursts of the Magnetar SGR 1627-41 and Possible Hard X-Ray Emission, ApJ, 859, 16
- Anders & Grevesse (1989) Anders, E. & Grevesse, N. 1989, Abundances of the elements: Meteoritic and solar, gca, 53, 19
- Archibald et al. (2017) Archibald, R. F. & Kaspi, V. M. & Scholz, P. et al. 2017, SWIFT Observations of Two Outbursts from the Magnetar 4U0142+61, ApJ, 834, 163
- Archibald et al. (2018) Archibald, R. F. & Kaspi, V. M. & Tendulkar, S. P. et al. 2018, The 2016 Outburst of PSR J1119-6127: Cooling and a Spin-down-dominated Glitch, ApJ, 869, 180
- Archibald et al. (2020) Archibald, R. F. & Scholz, P. & Kaspi, V. M. et al. 2020, Two New Outbursts and Transient Hard X-Rays from 1E 1048.1-5937, ApJ, 889, 160
- Arnaud (1996) Arnaud, K. A. 1996, XSPEC: The First Ten Years, Astronomical Society of the Pacific Conference Series, 101, 17
- Barcons et al. (2017) Barcons, X. & Barret, D. & Decourchelle, A. et al. 2017, Athena: ESA’s X-ray observatory for the late 2020s, Astronomische Nachrichten, 338, 15
- Beloborodov & Thompson (2007) Beloborodov, A. & Thompson, C. 2007, Corona of Magnetars, ApJ, 657, 96
- Beloborodov (2009) Beloborodov, A. 2009, Untwisting Magnetospheres of Neutron Stars, ApJ, 703, 104
- Beloborodov (2013) Beloborodov, A. 2013, On the Mechanism of Hard X-Ray Emission from Magnetars, ApJ, 762, 13
- Bernardini et al. (2009) Bernardini, F. & Israel, G. L. & Dall’Osso, S. et al. 2009, From outburst to quiescence: the decay of the transient AXP XTE J1810-197, A&A, 498, 19
- Bernardini et al. (2011) Bernardini, F. & Israel, G. L. & Stella, L. et al. 2011, Multi-instrument X-ray monitoring of the January 2009 outburst from the recurrent magnetar candidate 1E 1547.0-5408, A&A, 529, A19
- Bochenek et al. (2020) Bochenek, C. D. & Ravi, V. & Belov, K. V. et al. 2020, A fast radio burst associated with a Galactic magnetar, Nature, 587, 5
- Camero et al. (2014) Camero, A. & Papitto, A. & Rea, N. et al. 2014, Quiescent state and outburst evolution of SGR 0501+4516, MNRAS, 438, 329
- Camilo et al. (2007) Camilo, F. & Ransom, S. M. & Halpern, J. P. et al. 2007, 1E 1547.0-5408: A Radio-emitting Magnetar with a Rotation Period of 2 Seconds, ApJ, 666, L9
- Chatterjee et al. (2021) Chatterjee, R. & Agrawal, V. & Nandi, A. 2021, Long-term XMM-Newton view of magnetar CXOU J010043.1-721134: comprehensive spectral and temporal results, MNRAS, 505, 378
- CHIME/FRB Collaboration (2018) CHIME/FRB Collaboration & Amiri, M. & Bandura, K. et al. 2018, The CHIME Fast Radio Burst Project: System Overview, ApJ, 863, 48
- CHIME/FRB Collaboration (2020) CHIME/FRB Collaboration & Andersen, B. C. & Bandura, K. M. et al. 2020, A bright millisecond-duration radio burst from a Galactic magnetar, Nature, 587, 5
- Chu et al. (2021) Chu, C. & Ng, C. -Y. & Kong, A. et al. 2021, High-frequency radio observations of two magnetars, PSR J1622-4950 and 1E 1547.0-5408, MNRAS, 503, 121
- Cline et al. (1982) Cline, T. L. & Desai, U. D. & Teegarden, B. J. et al. 1982, Precise source location of the anomalous 1979 March 5 gamma-ray transient., ApJ, 255, L4
- Coti Zelati et al. (2018) Coti Zelati, F. & Rea, N. & Pons, J. et al. 2018, Systematic study of magnetar outbursts, MNRAS, 474, 96
- Cummings et al. (2011) Cummings, J. R. & Burrows, D. & Campana, S. et al. 2011, Swift J1822.3-1606: A Probable New SGR in Ground Analysis of BAT Data, The Astronomer’s Telegram, 3488, 1
- de Jager et al. (1989) de Jager, O. C. & Raubenheimer, B. C. & Swanepoel, J. W. H. 1989, A powerful test for weak periodic signals with unknown light curve shape in sparse data., A&A, 221, 18
- Enoto et al. (2010) Enoto, T. & Nakazawa, K. & Makishima, K. et al. 2010, Broadband Study with Suzaku of the Magnetar Class, ApJ, 722, L16
- Esposito et al. (2008) Esposito, P. & Israel, G. L. & Zane, S. et al. 2008, The 2008 May burst activation of SGR1627-41, MNRAS, 390, L3
- Fernández & Thompson (2007) Fernández, R. & Thompson, C. 2007, Resonant Cyclotron Scattering in Three Dimensions and the Quiescent Nonthermal X-ray Emission of Magnetars, ApJ, 660, 61
- Feroci et al. (1999) Feroci, M. & Frontera, F. & Costa, E. et al. 1999, A Giant Outburst from SGR 1900+14 Observed with the BeppoSAX Gamma-Ray Burst Monitor, ApJ, 515, L
- Fisher (1915) Fisher, R. A. 1915, Frequency Distribution of the Values of the Correlation Coefficient in Samples from an Indefinitely Large Population, Biometrika, 10, 50
- Gaskin et al. (2019) Gaskin, J. & Swartz, D. & Vikhlinin, A. et al. 2019, Lynx X-Ray Observatory: an overview, Journal of Astronomical Telescopes, Instruments, and Systems, 5, 021001
- Gavriil & Kaspi (2004) Gavriil, F. & Kaspi, V. 2004, Anomalous X-Ray Pulsar 1E 1048.1-5937: Pulsed Flux Flares and Large Torque Variations, ApJ, 609, L6
- Gavriil et al. (2008) Gavriil, F. P. & Gonzalez, M. E. & Gotthelf, E. V. et al. 2008, Magnetar-Like Emission from the Young Pulsar in Kes 75, Science, 319, 1802
- Gelfand & Gaensler (2007) Gelfand, J. & Gaensler, B. M. 2007, The Compact X-Ray Source 1E 1547.0-5408 and the Radio Shell G327.24-0.13: A New Proposed Association between a Candidate Magnetar and a Candidate Supernova Remnant, ApJ, 667, 111
- Goldreich & Reisenegger (1992) Goldreich, P. & Reisenegger, A. 1992, Magnetic Field Decay in Isolated Neutron Stars, ApJ, 395, 250
- Gonzalez et al. (2010) Gonzalez, M. E. & Dib, R. & Kaspi, V. M. et al. 2010, Long-term X-ray Changes in the Emission from the Anomalous X-ray Pulsar 4U 0142+61, ApJ, 716, 134
- Gotthelf et al. (2004) Gotthelf, E. V. & Halpern, J. P. & Buxton, M. et al. 2004, Imaging X-Ray, Optical, and Infrared Observations of the Transient Anomalous X-Ray Pulsar XTE J1810-197, ApJ, 605, 36
- Gotthelf et al. (2019) Gotthelf, E. V. & Halpern, J. P. & Mori, K. et al. 2019, X-Ray Monitoring of the Magnetar CXOU J171405.7-381031 in Supernova Remnant CTB 37B, ApJ, 882, 173
- Göhler et al. (2005) Göhler, E. & Wilms, J. & Staubert, R. 2005, XMM-Newton observation of the anomalous X-ray pulsar 4U 0142+61, A&A, 433, 107
- Göğüş et al. (2017) Göğüş, E. & Lin, L. & Roberts, O. et al. 2017, Burst and Outburst Characteristics of Magnetar 4U 0142+61, ApJ, 835, 68
- Güver et al. (2012) Güver, T. & Göǧüş, E. & Özel, F. 2012, On the cooling trend of SGR 0526-66, MNRAS, 424, 21
- Halpern & Gotthelf (2010) Halpern, J. P. & Gotthelf, E. V. 2010, Two Magnetar Candidates in HESS Supernova Remnants, ApJ, 710, 94
- Halpern et al. (2008) Halpern, J. P. & Gotthelf, E. V. & Reynolds, J. et al. 2008, Outburst of the 2 s Anomalous X-Ray Pulsar 1E 1547.0-5408, ApJ, 676, 117
- Harrison et al. (2013) Harrison, F. A. & Craig, W. W. & Christensen, F. 2013, The Nuclear Spectroscopic Telescope Array (NuSTAR) High-energy X-Ray Mission, ApJ, 770, 103
- Ho (2016) Ho, W. 2016, Gravitational waves within the magnetar model of superluminous supernovae and gamma-ray bursts, MNRAS, 463, 48
- Ho (2001) Ho, W. C. G. and Lai, D. 2001, Atmospheres and spectra of strongly magnetized neutron stars, MNRAS, 327, 1081
- Hurley et al. (2005) Hurley, K. & Boggs, S. E. & Smith, D. M. et al. 2005, An exceptionally bright flare from SGR 1806-20 and the origins of short-duration -ray bursts, Nature, 434, 109
- Ibrahim et al. (2004) Ibrahim, A. & Markwardt, C. & Swank, J. et al. 2004, Discovery of a Transient Magnetar: XTE J1810-197, ApJ, 609, L2
- Kaspi & Beloborodov (2017) Kaspi, V. & Beloborodov, A. 2017, Magnetars, ARA&A, 55, 26
- Kaspi & Boydstun (2010) Kaspi V. M. & Boydstun K. 2010, On the X-Ray Spectra of Anomalous X-Ray Pulsars and Soft Gamma Repeaters, ApJ, 710, L11
- Kaspi et al. (2003) Kaspi, V. M. & Gavriil, F. P. & Woods, P. M. et al. 2003, A Major Soft Gamma Repeater-like Outburst and Rotation Glitch in the No-longer-so-anomalous X-Ray Pulsar 1E 2259+586, ApJ, 588, L9
- Kouveliotou et al. (1998) Kouveliotou, C. & Kippen, M. & Woods, P. et al. 1998, SGR 1627-41, IAUC, 6944, 2
- Kouveliotou et al. (2003) Kouveliotou, C. & Eichler, D. & Woods, P. M. et al. 2003, Unraveling the Cooling Trend of the Soft Gamma Repeater SGR 1627-41, ApJ, 596, L7
- Kuiper et al. (2006) Kuiper, L. & Hermsen, W. & den Hartog, P. R. et al. 2006, Discovery of Luminous Pulsed Hard X-Ray Emission from Anomalous X-Ray Pulsars 1RXS J1708-4009, 4U 0142+61, and 1E 2259+586 by INTEGRAL and RXTE, ApJ, 645, 55
- Li et al. (2008) Li, X. & Lu, F. & Li, Z. 2008, Nonthermal X-Ray Properties of Rotation-powered Pulsars and Their Wind Nebulae, ApJ, 682, 116
- LIGO Scientific Collaboration (2015) LIGO Scientific Collaboration & Aasi, J. & Abbott, B. P. et al. 2015, Advanced LIGO, Classical and Quantum Gravity, 32, 074001
- Livingstone et al. (2011) Livingstone, M. A. & Scholz, P. & Kaspi, V. M. et al. 2011, The Spin-down of Swift J1822.3-1606: A New Galactic Magnetar, ApJ, 743, L38
- Loredo (1992) Loredo, T. J. 1992, Promise of Bayesian inference for astrophysics., Statistical Challenges in Modern Astronomy, 27
- Lyutikov & Gavriil (2006) Lyutikov, M. & Gavriil, F. 2006, Resonant cyclotron scattering and Comptonization in neutron star magnetospheres, MNRAS, 368, 69
- Lyutikov (2003) Lyutikov, M. 2003, Explosive reconnection in magnetars, MNRAS, 346, 54
- Madsen et al. (2018) Madsen, K. K. & Harrison, F. & Broadway, D. et al. 2018, Optical instrument design of the high-energy x-ray probe (HEX-P), proc. SPIE, 10699, 10699M
- Marsden & White (2001) Marsden, D. & White, N. E. 2001, Correlations between Spectral Properties and Spin-down Rate in Soft Gamma-Ray Repeaters and Anomalous X-Ray Pulsars, ApJ, 551, L15
- McGarry et al. (2005) McGarry, M. B. & Gaensler, B. M. & Ransom, S. M. et al. 2005, X-Ray Timing, Spectroscopy, and Photometry of the Anomalous X-Ray Pulsar Candidate CXOU J010043.1-721134, ApJ, 627, L13
- Mereghetti et al. (2005) Mereghetti, S. & Götz, D. & von Kienlin, A. et al. 2005, The First Giant Flare from SGR 1806-20: Observations Using the Anticoincidence Shield of the Spectrometer on INTEGRAL, ApJ, 624, L10
- Mereghetti et al. (2006) Mereghetti, S. & Esposito, P. & Tiengo, A. et al. 2006, The First XMM-Newton Observations of the Soft Gamma-Ray Repeater SGR 1900+14, ApJ, 653, 142
- Molkov et al. (2004) Molkov, S. V. & Cherepashchuk, A. M. & Lutovinov, A. A. et al. 2004, A Hard X-ray Survey of the Sagittarius Arm Tangent with the IBIS Telescope of the INTEGRAL Observatory: A Catalog of Sources, Astronomy Letters, 30, 53
- Mong & Ng (2018) Mong, Y. -L. & Ng, C. -Y. 2018, X-Ray Observations of Magnetar SGR 0501+4516 from Outburst to Quiescence, ApJ, 852, 86
- Morii et al. (2003) Morii, M. & Sato, R. & Kataoka, J. et al. 2003, Chandra Observation of the Anomalous X-Ray Pulsar 1E 1841-045, PASJ, 55, L4
- Muno et al. (2006) Muno, M. & Gaensler, B. & Clark, J. S. et al. 2006, XMM Observations of AXP CXO J167410.2-455216 Four Days Prior to Outburst, The Astronomer’s Telegram, 902, 1
- Muno et al. (2007) Muno, M. P. & Gaensler, B. M. & Clark, J. S. et al. 2007, Exciting the magnetosphere of the magnetar CXOU J164710.2-455216 in Westerlund 1, MNRAS, 378, L4
- Mushotzky et al. (2019) Mushotzky, R. & Aird, J. & Barger, A. et al. 2019, The Advanced X-ray Imaging Satellite, Bulletin of the American Astronomical Society, 51, 107
- Olausen & Kaspi (2014) Olausen, S. A. & Kaspi, V. M. 2014, The McGill Magnetar Catalog, ApJS, 212, 6
- Park et al. (2012) Park, S. & Hughes, J. & Slane, P. et al. 2012, An X-Ray Study of Supernova Remnant N49 and Soft Gamma-Ray Repeater 0526-66 in the Large Magellanic Cloud, ApJ, 748, 117
- Perna & Pons (2011) Perna, R. & Pons, J. 2011, A Unified Model of the Magnetar and Radio Pulsar Bursting Phenomenology, ApJ, 727, L51
- Pintore et al. (2019) Pintore, F. & Mereghetti, S. & Esposito P. et al. 2019, The 11 yr of low activity of the magnetar XTE J1810-197, MNRAS, 483, 383
- Pons et al. (2007) Pons, J. & Link, B. & Miralles, J. et al. 2007, Evidence for Heating of Neutron Stars by Magnetic-Field Decay, PRL, 98, 071101
- Protassov et al. (2002) Protassov, Rostislav and van Dyk, David A. and Connors, Alanna and Kashyap, Vinay L. and Siemiginowska, Aneta, 2002, Statistics, Handle with Care: Detecting Multiple Model Components with the Likelihood Ratio Test, ApJ, 571, 1
- Potekhin & Yakovlev (2001) Potekhin, A. Y. & Yakovlev, D. G. 2001, Thermal structure and cooling of neutron stars with magnetized envelopes, A&A, 374, 21
- Predehl et al. (2021) Predehl, P. & Andritschke, R. & Arefiev, V. et al. 2021, The eROSITA X-ray telescope on SRG, A&A, 647, A1
- Rea et al. (2007) Rea, N. & Nichelli, E. & Israel, G. L. et al. 2007, Very deep X-ray observations of the anomalous X-ray pulsar 4U0142+614, MNRAS, 381, 29
- Rea et al. (2007) Rea, N. & Israel, G. L. & Oosterbroek, T. et al. 2007, X-ray intensity-hardness correlation and deep IR observations of the anomalous X-ray pulsar 1RXS J170849-400910, Ap&SS, 308, 50
- Rea et al. (2008) Rea, N. & Zane, S. & Turolla, R. et al. 2008, Resonant Cyclotron Scattering in Magnetars’ Emission, ApJ, 686, 124
- Rea et al. (2009) Rea, N. & Israel, G. L. & Turolla, R. et al. 2009, The first outburst of the new magnetar candidate SGR0501+4516, MNRAS, 396, 241
- Rea et al. (2013) Rea, N. & Israel, G. L. & Pons, J. A. et al. 2013, The Outburst Decay of the Low Magnetic Field Magnetar SGR 0418+5729, ApJ, 770, 65
- Regimbau & de Freitas Pacheco (2006) Regimbau, T. & de Freitas Pacheco, J. A. 2006, Stochastic Background from Coalescences of Neutron Star-Neutron Star Binaries, ApJ, 642, 45
- Rodríguez Castillo et al. (2014) Rodríguez Castillo, G. & Israel, G. & Esposito, P. et al. 2014, Pulse phase-coherent timing and spectroscopy of CXOU J164710.2-45521 outbursts, MNRAS, 441, 130
- Rodríguez Castillo et al. (2016) Rodríguez Castillo, G. & Israel, G. & Tiengo, A. et al. 2016, The outburst decay of the low magnetic field magnetar SWIFT J1822.3-1606: phase-resolved analysis and evidence for a variable cyclotron feature, MNRAS, 456, 414
- Rothschild et al. (1994) Rothschild, R. E. & Kulkarni, S. R. & Lingenfelter, R. E. 1994, Discovery of an X-ray source coincident with the soft -ray repeater 0525 - 66, Nature, 368, 43
- Şaşmaz Muş & Göğüş (2013) Şaşmaz Muş, S. & Göğüş, E. 2013, Long-term Timing and Glitch Characteristics of Anomalous X-Ray Pulsar 1RXS J170849.0-400910, ApJ, 778, 156
- Scholz et al. (2012) Scholz, P. & Ng, C. -Y. & Livingstone, M. A. et al. 2012, Post-outburst X-Ray Flux and Timing Evolution of Swift J1822.3-1606, ApJ, 761, 66
- Scholz et al. (2014) Scholz, P. & Kaspi, V. M. & Cumming, A. 2014, The Long-term Post-outburst Spin Down and Flux Relaxation of Magnetar Swift J1822.3-1606, ApJ, 786, 62
- Tam et al. (2008) Tam, C. & Gavriil, F. & Dib, R. et al. 2008, X-Ray and Near-IR Variability of the Anomalous X-Ray Pulsar 1E 1048.1-5937: From Quiescence Back to Activity, ApJ, 677, 50
- Tamba et al. (2019) Tamba, T. & Bamba, A. & Odaka, H. et al. 2019, Temporal and spectral X-ray properties of magnetar SGR 1900+14 derived from observations with NuSTAR and XMM-Newton, PASJ, 71, 90
- Tendulkar et al. (2015) Tendulkar, S. & Hascöet, R. & Yang, C. et al. 2015, Phase-resolved NuSTAR and Swift-XRT Observations of Magnetar 4U 0142+61, ApJ, 808, 32
- Terasawa et al. (2005) Terasawa, T. & Tanaka, Y. & Takei, Y. et al. 2005, Repeated injections of energy in the first 600ms of the giant flare of SGR1806 - 20, Nature, 434, 111
- Thompson & Beloborodov (2005) Thompson, C. & Beloborodov, A. M. 2005, High-Energy Emission from Magnetars, ApJ, 634, 56
- Thompson & Duncan (1995) Thompson, C. & Duncan, R. 1995, The soft gamma repeaters as very strongly magnetized neutron stars - I. Radiative mechanism for outbursts, MNRAS, 275, 25
- Thompson & Duncan (1996) Thompson, C. & Duncan, R. 1996, The Soft Gamma Repeaters as Very Strongly Magnetized Neutron Stars. II. Quiescent Neutrino, X-Ray, and Alfven Wave Emission, ApJ, 473, 322
- Thompson et al. (2002) Thompson, C. & Lyutikov, M. & Kulkarni, S. R. 2002, Electrodynamics of Magnetars: Implications for the Persistent X-Ray Emission and Spin-down of the Soft Gamma Repeaters and Anomalous X-Ray Pulsars, ApJ, 574, 33
- Tiengo et al. (2008) Tiengo, A. & Esposito, P. & Mereghetti, S. 2008, XMM-Newton Observations of CXOU J010043.1-721134: The First Deep Look at the Soft X-Ray Emission of a Magnetar, ApJ, 680, L133
- Tiengo et al. (2009) Tiengo, A. & Esposito, P. & Mereghetti, S. et al. 2009, Quiet but still bright: XMM-Newton observations of the soft gamma-ray repeater SGR0526-66, MNRAS, 399, L7
- Tiengo et al. (2013) Tiengo, A. & Esposito, P. & Mereghetti, S. et al. 2013, A variable absorption feature in the X-ray spectrum of a magnetar, Nature, 500, 7462
- Torres et al. (2019) Torres, D. & Viganò, D. & Coti Zelati, F. et al. 2019, Synchrocurvature modelling of the multifrequency non-thermal emission of pulsars, MNRAS, 489, 549
- Verner et al. (1996) Verner, D. A. & Ferland, G. J. & Korista, K. 1996, Atomic Data for Astrophysics. II. New Analytic FITS for Photoionization Cross Sections of Atoms and Ions, ApJ, 465, 487
- Viganò et al. (2013) Viganò, D. & Rea, N. & Pons, J. A. et al. 2013, Unifying the observational diversity of isolated neutron stars via magneto-thermal evolution models, MNRAS, 434, 12
- Vogel et al. (2014) Vogel, J. & Hascoët, R. & Kaspi, V. et al. 2014, NuSTAR Observations of the Magnetar 1E 2259+586, ApJ, 789, 75
- Vurgun et al. (2019) Vurgun, E. & Chakraborty, M. & Güver, T. et al. 2019, Variable absorption line in XTE J1810-197, na, 67, 4
- Wadiasingh et al. (2018) Wadiasingh, Z. & Baring, M. & Gonthier, P. et al. 2018, Resonant Inverse Compton Scattering Spectra from Highly Magnetized Neutron Stars, ApJ, 854, 98
- Wang et al. (2013) Wang, Y. & Takata, J. & Cheng, K. S. 2013, Mechanism of the X-Ray and Soft Gamma-Ray Emissions from High Magnetic Field Pulsar: PSR B1509-58, ApJ, 764, 51
- Woods et al. (2004) Woods, P. M. & Kaspi, V. M. & Thompson, C. et al. 2004, Changes in the X-Ray Emission from the Magnetar Candidate 1E 2259+586 during Its 2002 Outburst, ApJ, 605, 37
- Woods et al. (2007) Woods, P. & Kouveliotou, C. & Finger, M. et al. 2007, The Prelude to and Aftermath of the Giant Flare of 2004 December 27: Persistent and Pulsed X-Ray Properties of SGR 1806-20 from 1993 to 2005, ApJ, 654, 47
- Yang et al. (2016) Yang, C. & Archibald, R. F. & Vogel, J. K. et al. 2016, NuSTAR Observations of Magnetar 1E 1048.1-5937, ApJ, 831, 80
- Younes et al. (2015) Younes, G. & Kouveliotou, C. & Kaspi, V. M. 2015, XMM-Newton Observations of SGR 1806-20 Over Seven Years Following the 2004 Giant Flare, ApJ, 809, 165
- Younes et al. (2017) Younes, G. & Baring, M. & Kouveliotou, C. et al. 2017, The Sleeping Monster: NuSTAR Observations of SGR 1806-20, 11 Years After the Giant Flare, ApJ, 851, 17
- Zhu et al. (2008) Zhu, W. & Kaspi, V. & Dib, R. et al. 2008, The Long-Term Radiative Evolution of Anomalous X-Ray Pulsar 1E 2259+586 After Its 2002 Outburst, ApJ, 686, 52
- Zhu et al. (2011) Zhu, W. W. & Kaspi, V. M. & McLaughlin, M. A. et al. 2011, Chandra Observations of the High-magnetic-field Radio Pulsar J1718-3718, ApJ, 734, 44