Extragalactic magnetism with SOFIA (SALSA Legacy Program) - V:
First results on the magnetic field orientation of galaxies111The SOFIA Legacy Program for Magnetic Fields in Galaxies provides a software repository at https://github.com/galmagfields/hawc, and publicly available data at http://galmagfields.com/
Abstract
We present the analysis of the magnetic field (-field) structure of galaxies measured with far-infrared (FIR) and radio (3 and 6 cm) polarimetric observations. We use the first data release of the Survey of extragALactic magnetiSm with SOFIA (SALSA) of 14 nearby ( Mpc) galaxies with resolved (; pc– kpc) imaging polarimetric observations using SOFIA/HAWC+ from to m. We compute the magnetic pitch angle () profiles as a function of the galactocentric radius. We introduce a new magnetic alignment parameter () to estimate the disordered-to-ordered ratio of spiral -fields. We find FIR and radio wavelengths to not generally trace the same -field morphology in galaxies. The profiles tend to be more ordered across all galactocentric radii in radio () than in FIR (). For spiral galaxies, FIR -fields are % more turbulent than the radio -fields. For starburst galaxies, we find that FIR polarization is a better tracer of the -fields along the galactic outflows than radio polarization. Our results suggest that the -fields associated with dense, dusty, turbulent star-forming regions, those traced at FIR, are less ordered than warmer, less-dense regions, those traced at radio, of the interstellar medium. The FIR -fields seem to be more sensitive to the activity of the star-forming regions and molecular clouds within a vertical height of few hundred pc in the disk of spiral galaxies than the radio -fields.
1 Introduction
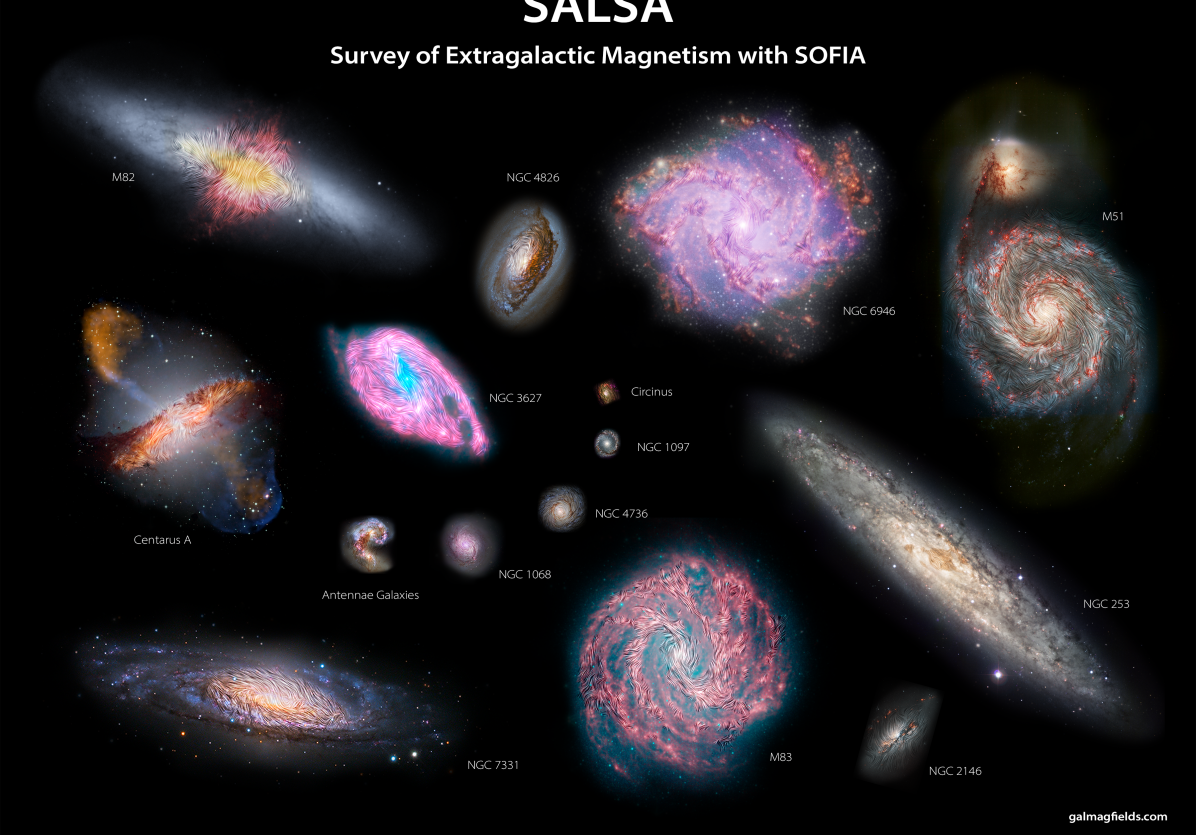
Polarimetric observations allow the tracing of magnetic fields (-field) in galaxies (e.g., Beck & Wielebinski, 2013). Synchrotron emission is expected to emerge largely from the warm and diffuse ISM, due to a combination of a large volume fraction for the ubiquitous cosmic ray electron population and thermal gas emission. While this emission is considerably sensitive to Faraday rotation, it should be relatively less affected by depolarization from disordered -field structures due to larger coherence scales for the field and a prevalence of the mean magnetic field (Evirgen et al., 2017). The FIR polarization arises from thermal emission of magnetically aligned dust grains tracing a weighted density medium along the line-of-sight (LOS). Based on SOFIA/HAWC+ observations of extra-galactic objects, we estimate that this polarized FIR emission is associated to a relatively dense () and cold ( K) component of the ISM (Lopez-Rodriguez et al., 2022a, SALSA IV). The addition of FIR polarimetric observations by the Survey of extragALactic magnetiSm with SOFIA (SALSA; PI: Lopez-Rodriguez, E. & Mao, S. A.) Legacy Program (Lopez-Rodriguez et al., 2022a, SALSA IV) enables for the first time to explore the differences with radio polarimetric observations allowing us to investigate extragalactic -fields in different ISM phases (Fig. 1).
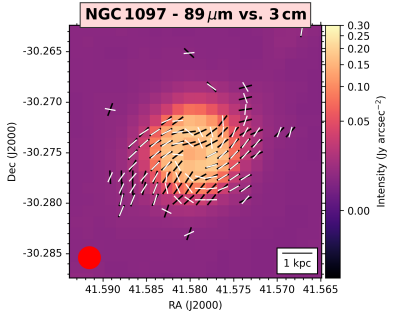
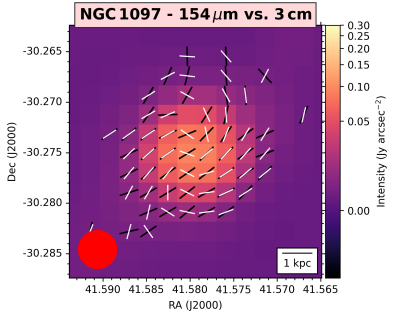
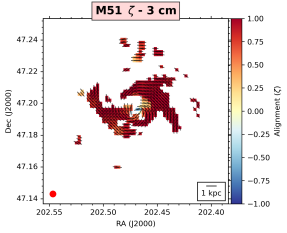
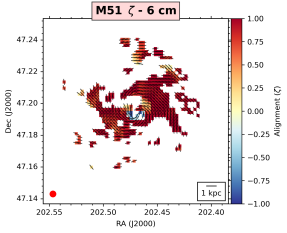
In fact, while the large-scale ordered structure of the -field 222Ordered fields are defined to be what polarized FIR emission or synchrotron emission at short radio wavelengths (where Faraday depolarization is small) measures within the telescope beam, projected to the plane perpendicular to the line of sight. Contributions for ordered fields come from anisotropic random fields, whose average over the beam vanishes, and regular fields, whose average over the beam is finite. To distinguish between these contributions, additional Faraday rotation data in the radio range are needed (Beck & Wielebinski, 2013). measured in radio and FIR are compatible in the less-dense interarm regions, significant divergence has been found in the spiral arms of M 51 (SALSA I: Borlaff et al., 2021; Surgent et al., 2023). This result may be due to the different thermodynamical properties between the warm diffuse ISM and the cold dust filaments associated with star-forming regions and molecular clouds. In the closest merger of two spiral galaxies (the Antennae galaxies), the FIR -field closely follows the relic spiral arm, while the radio -field is mostly radial (Lopez-Rodriguez et al., 2023, SALSA VI). This result suggests that the FIR -field may be cospatial with the molecular gas in the midplane of the relic spiral arm, while the radio -field seems to be more aligned with the dynamics of the HI gas on an extraplanar layer above the disk affected by the merger activity. In addition, the 1 kpc-scale starburst ring of NGC 1097 has a compressed and constant FIR -field at the intersection with the galactic bar, while the radio -field has a spiral morphology tightly cospatial with the diffuse neutral gas (Lopez-Rodriguez et al., 2021c, SALSA II). To observe the -field within the cold and dense ISM affected by the star formation activity and molecular clouds, FIR polarimetric observations are necessary.
In this paper, we explore the structure of the -field in a quantitative approach probed by the FIR and radio for a sample of 14 galaxies with diverse morphologies (grand-design spirals, post-merger, starbursts). In addition, we will compare the results with the -field structure measured using radio polarimetric observations for cases in which ancillary data are available (see Sec. 2.2). Sec. 3 is dedicated to the analysis of the -field orientation maps. In Sec. 4 we quantitatively analyze the structure of the -field pitch angle for spiral galaxies in the sample. Finally, Sec. 5 introduces the structural parameter, , dedicated to quantify the ordering ratio of the spiral -field. The discussion and conclusions are presented in Secs. 6 and 7 respectively.
2 Data
2.1 Far-infrared polarimetric observations
We analyze the -field orientations of the galaxies using the same FIR polarimetric observations as presented in SALSA III and IV (Lopez-Rodriguez et al., 2022a, b). The associated FIR polarimetry data are from the SALSA Legacy Program obtained with the High-Angular Wideband Camera Plus (HAWC+; Vaillancourt et al., 2007; Dowell et al., 2010; Harper et al., 2018) on board the 2.7-m Stratospheric Observatory For Infrared Astronomy (SOFIA). SOFIA/HAWC+ has an optimal combination of spatial resolution, field of view, and sensitivity for observational tests of the theoretical connections between -field, turbulence, and star formation. FIR polarimetric observations —practically impossible using ground-based observatories due to atmospheric absorption— allow us to efficiently detect the thermal polarized emission of magnetically aligned dust grains.
In summary, the FIR polarimetric observations were performed using four bands, , , , and m, with SOFIA/HAWC+. Table 1 shows the HAWC+ configuration for every band. The observations were performed using the on-the-fly-mapping (OTFMAP) polarimetric mode described in SALSA III (Lopez-Rodriguez et al., 2022b). The exception is M 51: this galaxy was observed using the chopping and nodding technique and reduced as described by Borlaff et al. (2021). Table 2 shows the galaxy sample and the associated bands. The pixel scale of the final data product is equal to the detector pixel scale (i.e. Nyquist sampling) in any given band (Table 1). For a detailed description of the analysis of the polarization fraction see SALSA IV (Lopez-Rodriguez et al., 2022a). Table 3 shows the properties of the galaxy sample.
| Band | Pixel scale | Beam size | Polarimetry FOV | ||
|---|---|---|---|---|---|
| (m) | (m) | (″) | (″) | (′) | |
| (a) | (b) | (c) | (d) | (e) | (f) |
| A | |||||
| C | |||||
| D | |||||
| E |
2.2 Radio polarimetric observations
Ancillary radio polarimetric observations at and cm are used for the analysis. Table 2 shows the radio polarimetric data that were publicly available and kindly shared by the authors of the associated manuscripts. These datasets were obtained using observations of the Effelsberg 100-m single-dish radio-telescope, in combination with datasets from the Karl G. Jansky Very Large Array (VLA) when available. The beam sizes for the radio polarization vary from target to target between 6″ to 15″. The physical beam sizes (in pc) of the original available datasets are described in Table 2. We refer to the original manuscripts shown in Table 2 for a complete description of the observations and analysis of the datasets used in our work. Longer wavelength (, cm) observations can be strongly affected by Faraday rotation (Beck et al., 2019), and are thus not considered in this work.
For each galaxy and radio wavelength, the Stokes were convolved with a Gaussian kernel to match the beam size (full-width-half-maximum; FWHM) of HAWC+ at the bands shown in Table 2. Then, we reprojected each dataset to the largest beam size per galaxy and per band, matching the same pixel scale and field-of-view (FOV). Finally, the fractional degree () and angle of polarization (), and polarized flux () were computed, accounting for the level of polarization bias. To avoid biased results due to the number of measurements across the galaxy, we only use radio polarization measurements that are spatially coincident with the HAWC+ observations. The radio polarization maps are used to spatially correlate the polarization arising from synchrotron emission with that arising from thermal emission by means of magnetically aligned dust grains observed with HAWC+. Throughout this manuscript, the results at and cm are very similar, within their uncertainties.
| Galaxy | FIR | Radio | References | ||
|---|---|---|---|---|---|
| (m) | (pc) | (cm) | (pc) | ||
| (a) | (b) | (c) | (d) | (e) | (f) |
| Centaurus A | 89 | 128 | - | - | - |
| Circinus | 53, 89, 214 | 98, 157, 367 | - | - | - |
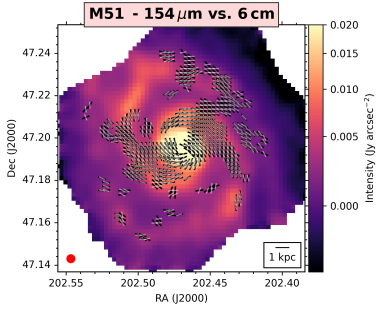
| M 51 | 154 | 566 | 3, 6 | 333 | Fletcher et al. (2011) |
| M 82 | 53, 89, 154, 214 | 91, 146, 254, 340 | 3 + 6 | 112 | Adebahr et al. (2013, 2017) |
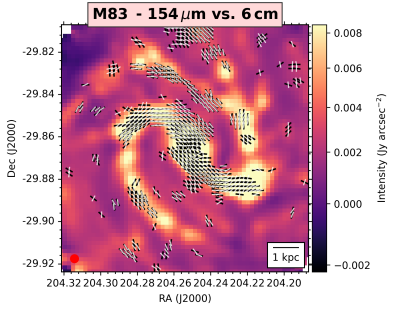
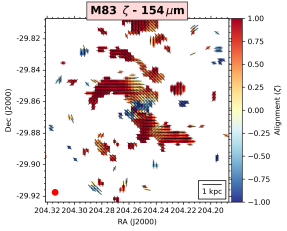
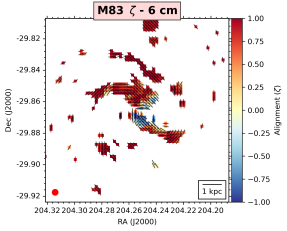
| M 83 | 154 | 307 | 6 | 226 | Frick et al. (2016a) |
| NGC 253 | 89, 154 | 132, 231 | 3, 6 | 119 | Heesen et al. (2011) |
| NGC 1068 | 53, 89 | 335, 539 | - | - | - |
| NGC 1097 | 89, 154 | 722, 1259 | 3, 6 | 556 | Beck et al. (2005) |
| NGC 2146 | 53, 89, 154, 214 | 400, 644, 1123, 1504 | - | - | - |
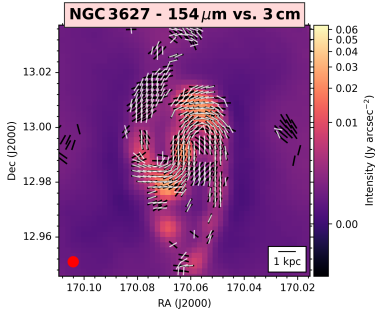
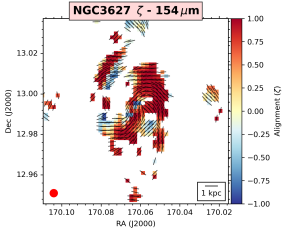
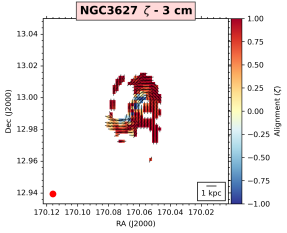
| NGC 3627 | 154 | 587 | 3, 6 | 561 | Soida et al. (2001) |
| NGC 4736 | 154 | 349 | 3, 6 | 206, 385 | Chyży & Buta (2008) |
| NGC 4826 | 89 | 210 | - | - | - |
| NGC 6946 | 154 | 448 | 6 | 495 | Beck (1991, 2007) |
| NGC 7331 | 154 | 1025 | - | - | - |
| Galaxy | Distance1 | Scale | Type⋆ | Inclination (i)2 | Tilt ()2 | References |
|---|---|---|---|---|---|---|
| (Mpc) | (pc/″) | (∘) | (∘) | (∘) | ||
| (a) | (b) | (c) | (d) | (e) | (f) | (g) |
| Centaurus A | S0pec/Sy2/RG | 1Ferrarese et al. (2007); 2Quillen et al. (2010) | ||||
| Circinus | SA(s)b/Sy2 | 1Tully et al. (2009); 2Jones et al. (1999) | ||||
| M 51 | Sa | 1McQuinn et al. (2017); 2Colombo et al. (2014) | ||||
| M 82 | I0/Sbrst | 1Vacca et al. (2015); 2Mayya et al. (2005) | ||||
| M 83 | SAB(s)c | 1Tully et al. (2013); 2Crosthwaite et al. (2002) | ||||
| NGC 253 | SAB(s)c/Sbrst | 1Radburn-Smith et al. (2011); 2Lucero et al. (2015) | ||||
| NGC 1068 | (R)SA(rs)b/Sy2 | 1Bland-Hawthorn et al. (1997); bBrinks et al. (1997) | ||||
| NGC 1097 | SB(s)b/Sy1 | 1Willick et al. (1997); 2Hsieh et al. (2011) | ||||
| NGC 2146 | SB(s)ab/Sbrst | 1Tully (1988); 2Tarchi et al. (2004) | ||||
| NGC 3627 | SAB(s)b | 1Kennicutt et al. (2003); 2Kuno et al. (2007) | ||||
| NGC 4736 | SA(r)ab | 1Kennicutt et al. (2003); 2Dicaire et al. (2008) | ||||
| NGC 4826 | (R)SA(rs)ab | 1Kennicutt et al. (2003); 2Braun et al. (1994) | ||||
| NGC 6946 | Sc | 1Karachentsev et al. (2000); 2Daigle et al. (2006) | ||||
| NGC 7331 | SA(s)b | 1Kennicutt et al. (2003); 2Daigle et al. (2006) |
3 Magnetic field orientation maps
3.1 Methodology
Figures 2 – 7 show the -field orientation maps of the galaxies associated with the first data release of SALSA (SALSA IV, Lopez-Rodriguez et al., 2022a) at FIR wavelengths and radio wavelengths (when available, see Table 2). The FIR polarization measurements with at least and % were selected for all galaxies, with customized to avoid contamination from the background, as shown in the Appendix (Table 5), where and are the uncertainties per pixel of the polarized flux density and Stokes , respectively.The polarization fraction limit of is given by the maximum polarization fraction () of interstellar dust measured by Planck observations (Planck Collaboration et al., 2015). Note that more stringent quality cuts were applied to some specific galaxies, to avoid systematic effects. We refer to Lopez-Rodriguez et al. (2021a) for specific information about the quality cuts chosen for each galaxy and its relation to the SOFIA/HAWC+ OTFMAP polarimetric observation mode. We have rotated the measured polarization angles by to show the inferred -field orientations in the plane of the sky. For radio polarization measurements, all pixels with and were excluded, as well as those pixels that contain no significative FIR polarization emission. For visualization purposes, all figures in this manuscript have a constant polarization length to show the -field orientation.


Measuring the average -field orientation allows us to quantify the effects of the different spatial resolutions in the observations. We provide two different estimations of the average -field position angle: and . is defined as the average of the -field position angles of the individual polarization measurements after quality cuts. is estimated using the circular mean as
| (1) |
where is the -field orientations of individual polarization measurements.
is the integrated -field orientation of the galaxy disk, estimated as
| (2) |
where and are the average of the Stokes for pixels with in the FIR observations.
The difference between and is that the latter is the average orientation of the field in the case of unresolved observations (assigning higher weights to pixels with larger ). The uncertainty is a measurement of the accuracy of the polarization angle of an unresolved galaxy. In contrast, is an estimation of the circular mean field orientation on all the analyzed independent beams across the galaxy disk, not weighted by , allowing to contrast with how the average position angle of the polarization maps is modified with sufficient spatial resolution. The uncertainty is a measurement of the angular dispersion of the distribution of -field orientations within the galaxy disk. The uncertainties of and are measured using the definition of circular standard deviation from (Mardia, 1972), implemented in SciPy333scipy.stats.circstd: https://docs.scipy.org/doc/scipy/reference/generated/scipy.stats.circstd.html.
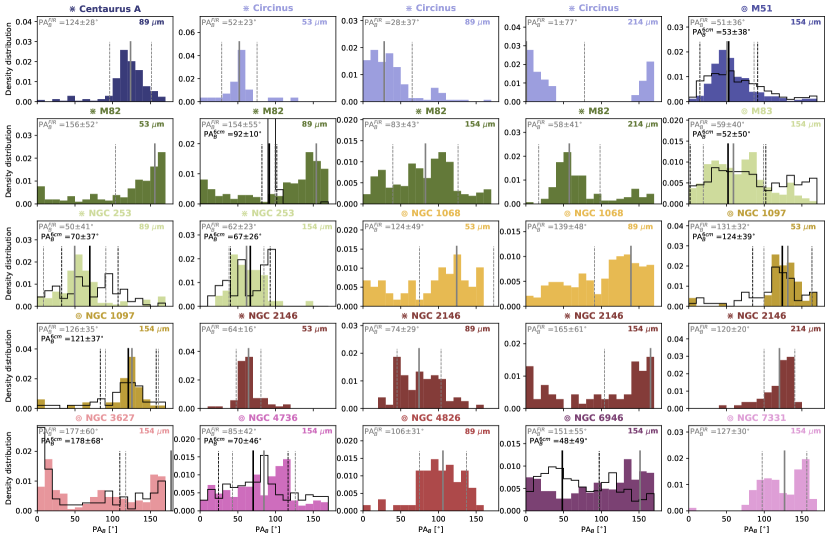
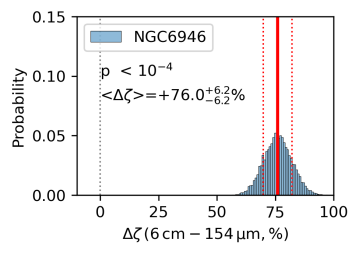
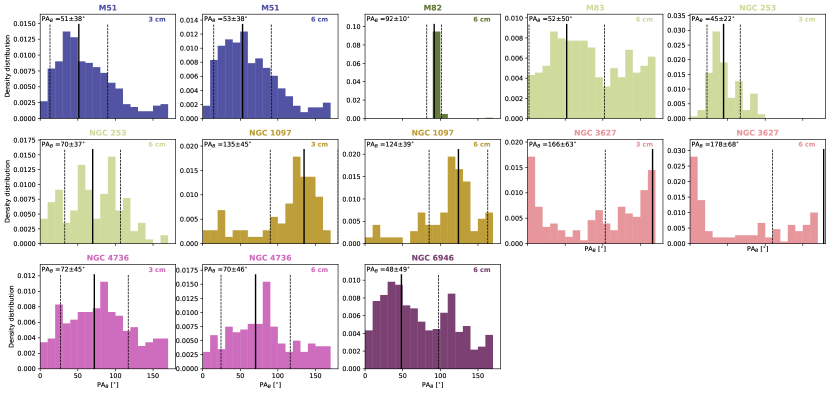
Figure 8 shows the histograms of the -field orientations in bins of for all the individual polarization measurements per galaxy and per band at FIR (filled histograms) and cm (black solid lines) wavelengths. We show the estimations of per galaxy and per band. The uncertainty is estimated as the standard deviation of the histogram. As mentioned in Sec. 2.2, we only use radio polarization measurements that are spatially coincident with the HAWC+ observations. The comparison between and for the FIR and radio observations are shown in Fig. 9. The tabulated data can be found in Appendix A (Table 5).
3.2 Results
We present the results from the analysis of the morphology of the -field estimated using FIR and radio observations. We divide our sample (Table 3) into starburst and/or high inclination galaxies (; without a clear spiral pattern, Sec. 3.2.1) and low inclination spiral galaxies (; with a spiral -field pattern, Sec. 3.2.2). In general, some spiral galaxies with lower inclination tend to present well-defined spiral magnetic arms. We use these to measure their magnetic pitch angles. Starburst and edge-on galaxies show multiple B-field components associated with the galactic outflows, if present, and the B-fields parallel to the disk. We note that this classification addresses strictly the projected B-field structure of the objects, which can be different from their respective morphological classification.
3.2.1 Starbursts and/or high inclination galaxies
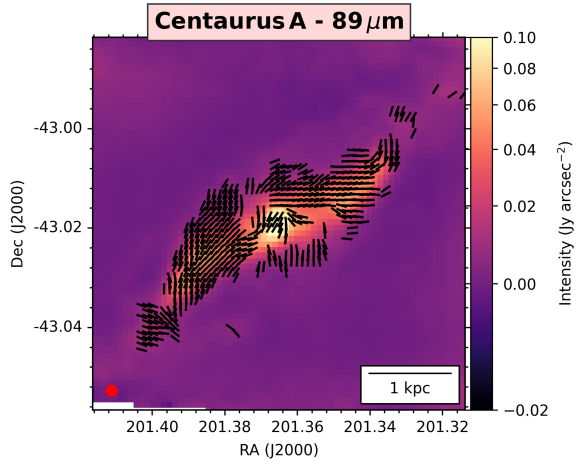
Centaurus A (Fig. 2) shows a -field orientation tightly following the kpc warped molecular disk as previously reported by Lopez-Rodriguez (2021a). The and are measured to be and , respectively. The large angular dispersion of is attributed to turbulence at spatial scales smaller than the beam of the observations driven by the merger activity and star-forming regions across the warped molecular disk.
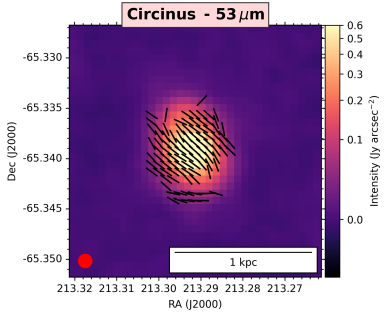
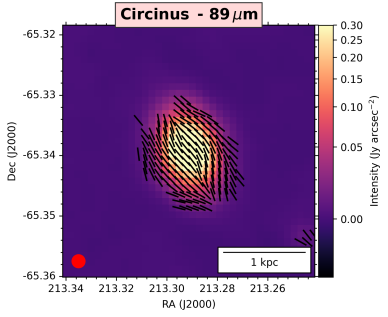
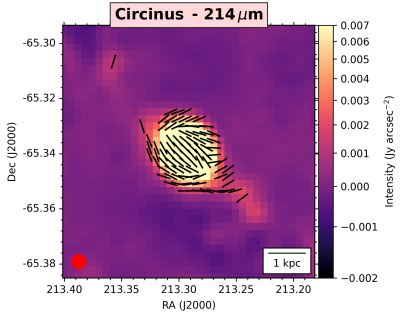
We measure an almost constant -field orientation within the central kpc of the Circinus galaxy (Fig. 3). Note that the -field orientation bends around the core at all wavelengths, which may indicate that the measured -field is arising from the central starburst ring (Elmouttie et al., 1998b; Zschaechner et al., 2016). The changes from at m to at m, with a similar, within the uncertainties, . At m, the is dominated by the highly polarized regions in the bar of the galaxy with a large-scale -field at . The -field orientation in the central kpc at m is consistent with the -field at and m. Radio polarimetric observations at cm with a beam size of show two radio lobes cospatial with the ionization cones and a spiral -field at scales of north and south of the unpolarized core (Elmouttie et al., 1998a).
We present a new analysis of the m -field orientation measurements of NGC 1097. The galaxy shows a constant FIR -field orientation at m within the central kpc starburst ring in agreement with the previously B-field orientations reported at m by Lopez-Rodriguez et al. (2021c, SALSA II).The and are measured to be and , respectively (Table 5). The m -field is parallel to the galaxy’s bar (which goes from South-East to North-West in the image). The radio polarimetric observations show a spiral -field pattern within the central 1 kpc of the starburst ring of NGC 1097 (Beck et al., 2005). The differences in the FIR and radio B-fields were suggested to arise from a) the diffuse gas dragging matter towards the core at radio, and b) the dense gas located in the galactic shocks at the intersections of the bar and starburst ring (Lopez-Rodriguez et al., 2021c). The former generates a spiral B-field and the latter generates a constant B-field in the shocks.
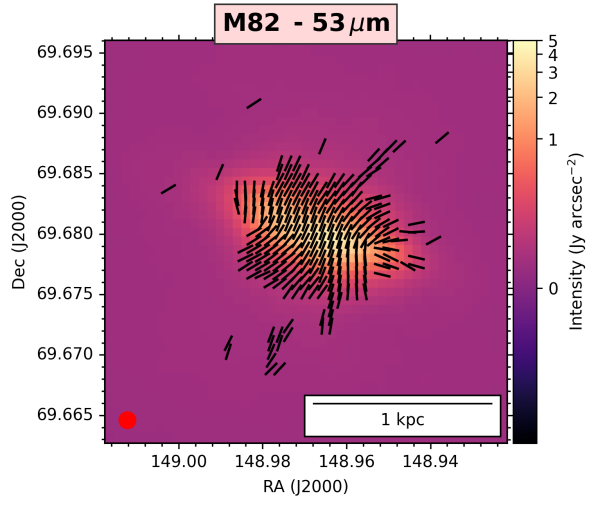
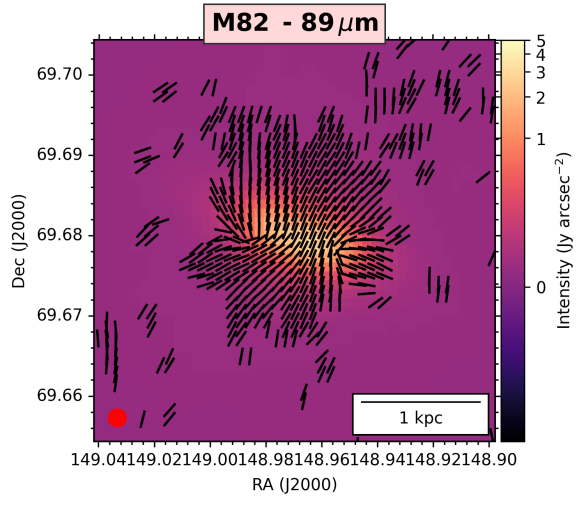
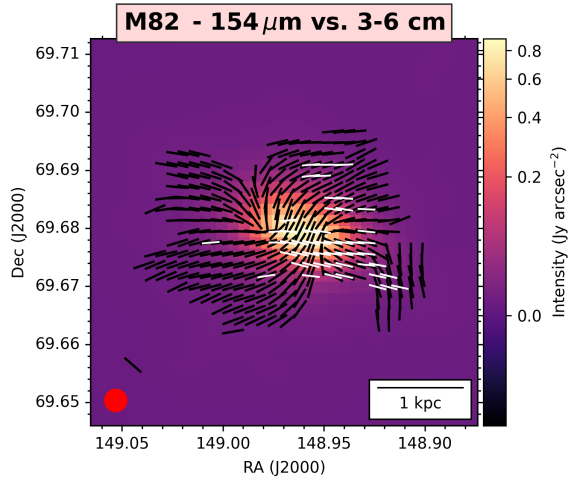
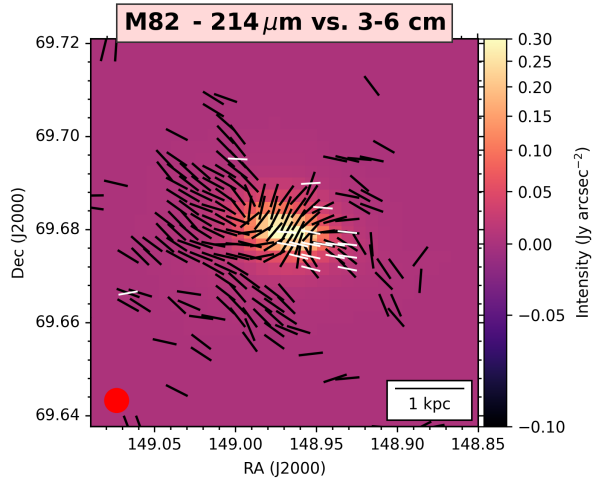
M 82’s -field orientation at FIR and radio polarization maps show large morphological differences (Fig. 4). The m show a -field orientation perpendicular to the galaxy’s disk indicating the presence of a galactic outflow with a diameter of kpc at the center of the galaxy extending kpc above and below the galaxy’s disk. The -field orientation is parallel to the disk of the galaxy from a radius of to kpc. The M 82 results are compatible with the previous and m observations reported by Jones et al. (2019) and Lopez-Rodriguez et al. (2021b). Here, we present deeper observations covering a wider wavelength range, i.e. m, and larger extension ( kpc). At and cm, the -field orientation in M 82 is mainly parallel to the galactic disk (Adebahr et al., 2017). Depolarization due to Faraday rotation or the lifetime of cosmic ray electrons along the galactic outflows may cause unpolarized regions (Sec. 6.3). Interestingly, the radio -field to the north and south of the galaxy disk is coincident with the -field orientation at m (Fig. 4).
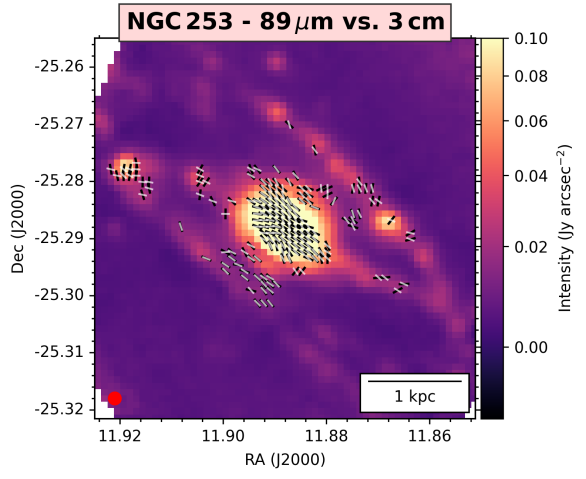
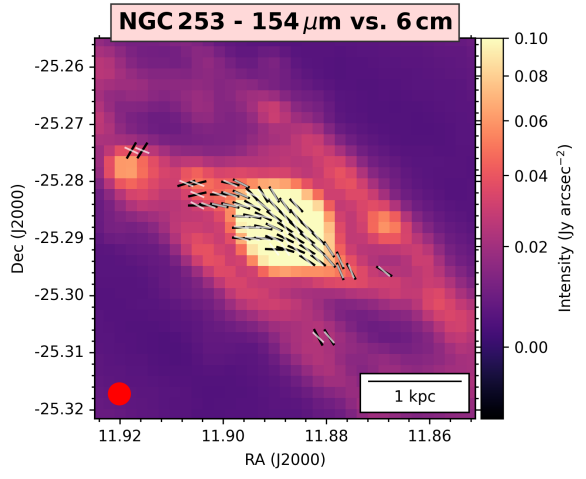
For NGC 253 (Fig. 5), the -field orientation is predominately parallel to the disk of the galaxy at both and m. A -field parallel to the disk of the galaxy at m was also measured using HAWC+ by Jones et al. (2019). At m, both and are in agreement, within the uncertainties, with a -field parallel to the disk. However, a change of is detected at m. Our hypothesis is that this angular change is mainly due to the highly polarized, %, regions with a -field twisting within the central 1 kpc of the galaxy with an hourglass shape. This twisted shape may be the signature of the galactic outflow associated with its central starburst having hotter dust temperatures than the dust located in the disk. This -field structure has also been observed at radio wavelengths (Heesen et al., 2011). Deeper and higher angular resolution observations are required to statistically detect this trend at FIR wavelengths. Note that our released and m observations only account for the % and % of the total requested time (SALSA III and IV), but these data are deeper and complementary observations to those presented by Jones et al. (2019).
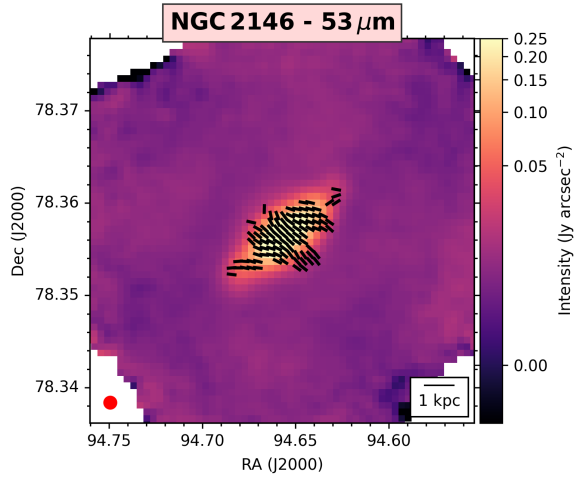
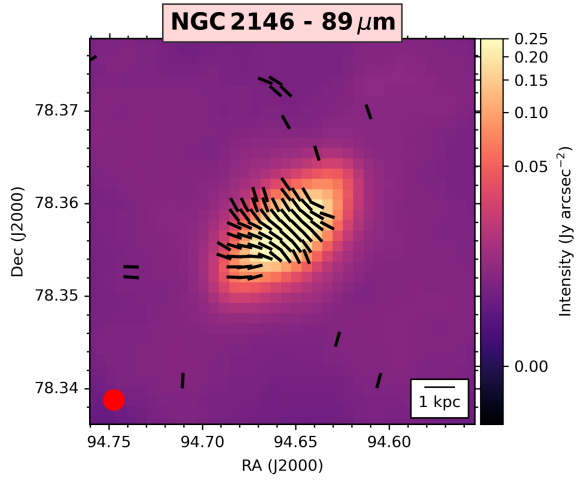
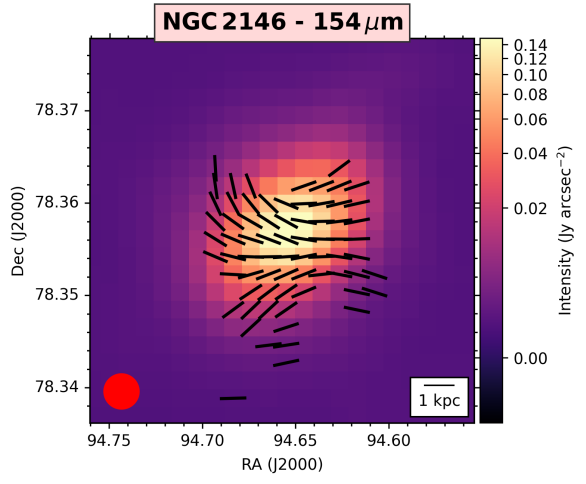
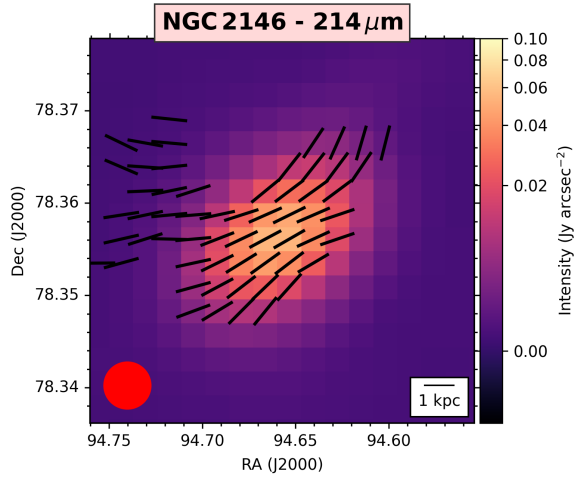
For the starburst galaxy NGC 2146 (Fig. 6), the -field orientation is parallel to the galactic outflow within the m wavelength range. At and m, the -field orientation is aligned with the galactic outflow with a diameter of kpc at the center of the galaxy. At m, the -field orientation is dominated by a component parallel to the disk of the galaxy. The -field orientation at m is more complex showing the transition between a -field dominated by the galactic outflow at m to a -field dominated by the galactic disk at m.
For both M 82 and NGC 2146, the histograms show a change in and from to m (Fig. 9 and Table 5). Specifically, and changes from and (parallel to the outflows) to and (parallel to the disk) in M 82 and NGC 2146, respectively. These results show that the resolved and unresolved FIR polarimetric observations are sensitive to the -fields in the warm, K at m, dust of galactic outflows and cold, K at m, dust in the galactic disk.
In summary:
-
•
The edge-on galaxy Centaurus A has a highly inclined -field mostly parallel to the kpc warped disk of the galaxy. The large-scale -field shows large angular dispersion across the galactic disk driven by the merger and star-forming activity (Lopez-Rodriguez et al., 2021b).
-
•
The -field orientation in Circinus is mostly constant and parallel to the inner-bar and the starburst ring in the central 1 kpc.
-
•
The starburst galaxies M 82, NGC 253, and NGC 2146 show signatures of a -field orientation potentially associated and parallel to galactic outflows up to kpc scales above and below the disk. For M 82, the -field is parallel to the galactic outflow at all wavelengths (Jones et al., 2019; Lopez-Rodriguez, 2021a). The median orientation of the FIR -field of NGC 2146 changes with wavelength from parallel (53 - 89 m) to perpendicular (154 - 214 m) with respect to the galactic outflow driven by the central starburst. For NGC 253, the -field is mostly parallel to the galaxy disk with a signature of an hour-glass shape driven by the starburst activity in the central 1 kpc.
-
•
For M 82, the radio -field orientation is parallel to the galaxy disk, although some hint of the galactic outflow is also measured and coincident with the m -field.
3.2.2 Spiral galaxies
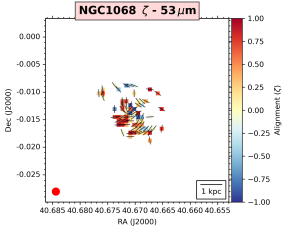
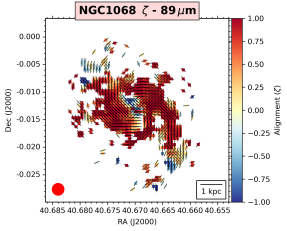
The FIR -field orientation maps of the spiral galaxies are shown in Fig. 7 (including NGC 1097). The histograms of -field orientations for the polarization measurements are presented in Fig. 8. In general, we find that low inclination objects (i.e., NGC 1068, NGC 4736, NGC 6946) present relatively flatter PAB distributions at FIR and radio wavelengths than galaxies with higher inclinations (i.e., M 82, NGC 253, NGC 2146). This result is because the spiral B-field is more centrosymetric at lower inclinations, while the spiral B-field is more asymmetric due to the cancelation of B-field along the LOS as inclination increases (see section 5.3 by Lopez-Rodriguez et al., 2022a).
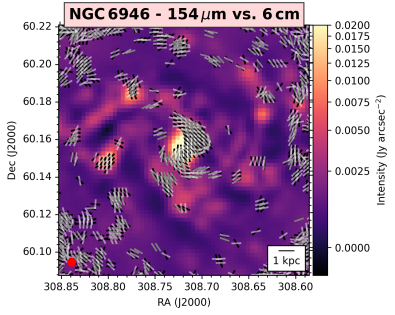
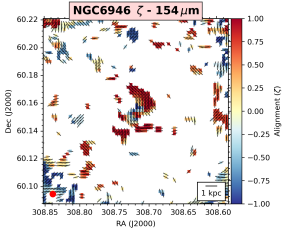
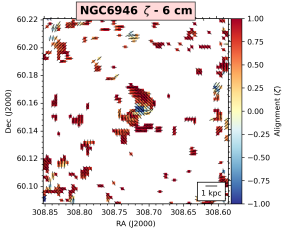
All galaxies show a large-scale spiral -field, except for NGC 6946, which shows a highly disordered FIR -field spatially located with the star-forming regions in the spiral arms. Fig. 7 shows the NGC 6946 -field pattern traced by both FIR and radio polarimetric observations, revealing clear large structural differences. At radio wavelengths, a large-scale well-ordered spiral -field has been measured (Beck, 1991, 2007) mostly aligned with the interarm regions (‘magnetic arms’), instead of the morphological spiral arms. However, we detect signs of a spiral pattern in radio and FIR also in the morphological spiral arms (see Sec. 4). At FIR wavelengths, we detect a spiral -field in the central kpc diameter. At larger galactocentric radius ( kpc), the -field orientation is highly disordered in the spiral arms. The histogram of -field orientations (Fig. 8) shows an almost flat distribution with a PA at m and PA at cm.
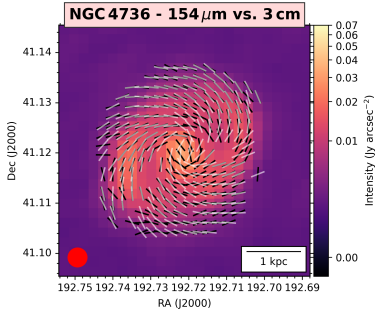
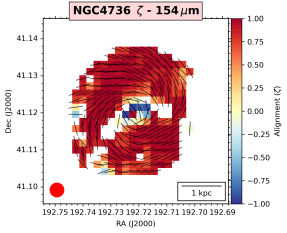
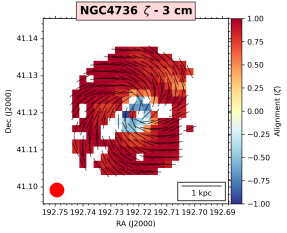
Another remarkable result is the well-ordered kpc-scale spiral -field over the starburst ring of NGC 4736 at both FIR and radio wavelengths (Fig. 7). For both tracers, the measured spiral -field seems to be uncorrelated with the underlying morphological structure. We measure a similar of and at m and cm, respectively. We note that the southern region of the galaxy has slightly different -field orientations at radio and FIR wavelengths, while in the northern region both FIR and radio wavelengths have similar -field orientations. Secs. 4 and 5 present a quantification of these differences.
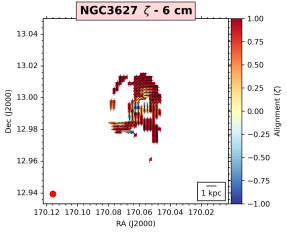
NGC 3627 presents a well-ordered spiral -field that follows the inner morphological spiral pattern at 154 m, 3 cm, and 6 cm. Interestingly, beyond from the galactic center, the FIR magnetic orientation deviates from the morphological arms (see North-East region), as opposed to the observed structure in 3 and 6 cm. In Sec. 4 we will analyze in detail how this change in orientation translates into a break in the magnetic pitch angle profile very similar to the results obtained in M 51 (Borlaff et al., 2021).
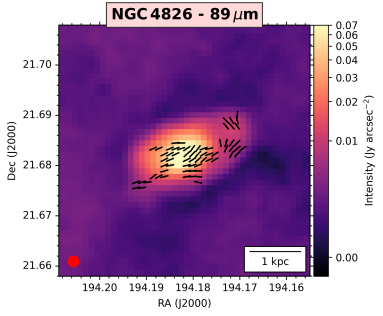
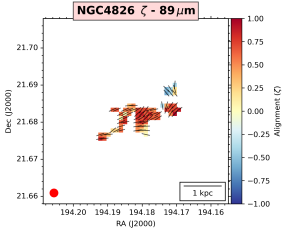
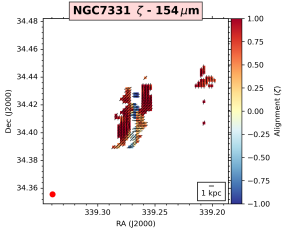
We detect a spiral -field morphology in both NGC 4826 and NGC 7331. For each galaxy, the and are in agreement, within their uncertainties (Table 5), which indicates that the -field is aligned with the major axis of the galaxy. This result is due to the high inclination of these galaxies. NGC 4826 presents a non-regular spiral -field, with the majority of the polarization measurements located in the southern half of the galaxy. Interestingly, only the southern section was found to be polarized also in 18 and 22 cm by Heald et al. (2009), a potential consequence of Faraday depolarization. Sec. 4 shows the associated radial profiles of the magnetic pitch angles of these galaxies. Radio polarimetric observations covering the several kpc-scale of the host galaxy of NGC 7331 are unavailable.
For M 51 and M 83, the overall spiral -field morphology is the same in both FIR and radio polarimetric observations, with some significative differences at large radii. The -field orientation map of M 51 is the same as presented by Borlaff et al. (2021), where the pitch angles of the spiral arms at the outskirts of M 51 are different at FIR and radio wavelengths. Sec. 4 shows the associated radial profiles of the magnetic pitch angles of these galaxies. A similar result is observed in the outskirts of M 83 when comparing the radio polarization and FIR magnetic pitch angle profiles (Fig. 7).
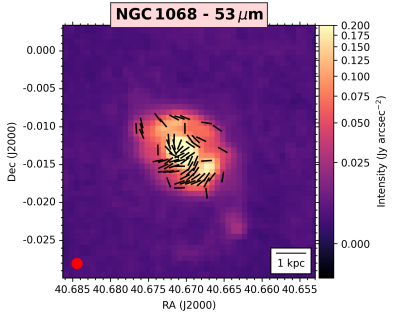
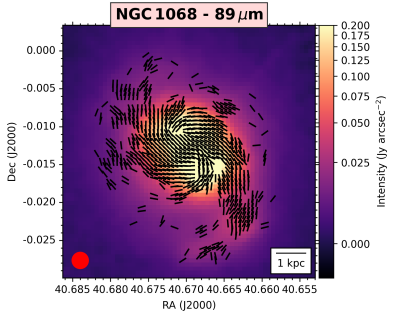
The -field orientation in NGC 1068 is compatible with the previous m observations reported by Lopez-Rodriguez et al. (2020a). Here, we present deeper m polarimetric observations and new m polarimetric observations. We detect a kpc-scale spiral -field at m, in comparison with the kpc scale detected by Lopez-Rodriguez et al. (2020a). The new m polarimetric observations show a change of at the core of NGC 1068 with respect to the m. This angular offset may be due to a transition from dichroic absorption to dichroic emission or that the m is resolving the beginning of the spiral arm within the central kpc.
In summary:
-
•
The spiral galaxies M 51, M 83, NGC 1068, NGC 3627, and NGC 4736 have kpc-scale spiral ordered -fields.
-
•
NGC 4736 has a FIR and radio spiral -field without clear spatial correspondence with the underlying morphology in total emission. The total emision is cospatial with the starburst ring at kpc around the core.
-
•
NGC 6946 has a highly disordered FIR -field, in comparison with the well-ordered large-scale spiral -field at radio wavelengths. The disordered FIR -field seems to be potentially connected to star formation activity in the spiral arms.
-
•
Significant large-scale differences between FIR and radio polarization observations are found in several regions of M 51, NGC 1097, and NGC 3627.
-
•
For all these galaxies, deviations from the large-scale spiral -fields are found in star-forming regions and at the edges of the nuclear bar.
4 Magnetic pitch angles
The morphology of the large-scale B-field in the disk of spiral galaxies is typically defined using the pitch angle , where is the radial B-field component, and is the azimuthal B-field component (e.g., Krasheninnikova et al., 1989). Note that the B-field is three dimensional, so from an observational point of view these two quantities are the B-fields components projected on the plane of the sky. Observationally, is defined as the angle between the line tangent to a circle in the galaxy plane and the direction of the -field at a specified radius. Positive values of represent a clockwise sense of the spiral structure, while negative values represent a counter-clockwise direction. Values of close to zero represent a circular B-field (tightly-wounded), while higher absolute values of represent a more open (less-wounded) spiral structure. The methodology to estimate the magnetic pitch angle maps for FIR and radio polarization observations (Mohawc) is described in Appendix B and previously presented by Borlaff et al. (2021). This method was implemented in python and is available on the project website444Mohawc: https://github.com/Borlaff/MOHAWC.
We compute the magnetic pitch angles of 8 spiral galaxies M 51, M 83, NGC 1068, NGC 3627, NGC 4736, NGC 4826, NGC 6946, and NGC 7331. The other galaxies have a) vertical -fields along the galactic outflows (i.e. M 82, NGC 253, and NGC 2146); b) parallel -fields along the galactic disk in edge-on galaxies (i.e. Centaurus A); or c) constant -fields in the central 1 kpc (i.e. Circinus, NGC 1097). For these galaxies, we do not perform any analysis based on the magnetic pitch angles with exception of the global -field orientation histograms and integrated -field orientation in the full disk of galaxies as described in Sec. 3.
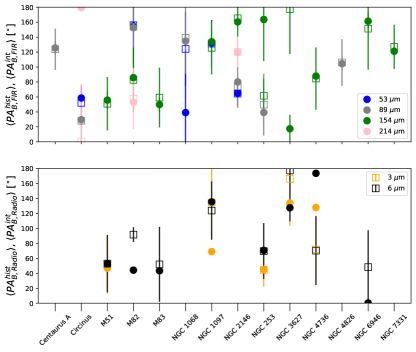
Figure 10 shows the magnetic pitch angles as a function of the galactocentric radius at FIR, , of the sample of spiral galaxies. Our FIR observations trace the -fields from kpc to kpc in radius for most galaxies, and up to kpc in NGC 7331. We also compute the magnetic pitch angles at 3 and 6 cm, , whenever available, using the same LOS measurements as those at FIR wavelengths. Table 4 shows the median magnetic pitch angles across the full galaxy disk.
| Galaxy | Band | Band | |||||
|---|---|---|---|---|---|---|---|
| (m) | (∘) | (%) | (cm) | (∘) | (%) | (%) | |
| (a) | (b) | (c) | (d) | (e) | (f) | (g) | (h) |
| M 51 | 154 | 3 cm | |||||
| 6 cm | |||||||
| M 83 | 154 | 6 cm | |||||
| NGC 1068 | 89 | - | - | - | - | ||
| NGC 3627 | 154 | 6 cm | |||||
| NGC 4736 | 154 | 3 cm | |||||
| NGC 4826 | 89 | - | - | - | - | ||
| NGC 6946 | 154 | 6 cm | |||||
| NGC 7331 | 154 | - | - | - | - |
The main result is that FIR and radio wavelengths do not generally trace the same -field morphology in spiral galaxies. This result has also been recently measured by independent analyses, using alternative pitch angle estimation methods (Surgent et al., 2023). As reported in Borlaff et al. (2021), M 51’s spiral magnetic field presents a similar structure in both radio and FIR within the central 5 kpc, showing a significant difference in the outskirts of the disk. At radii kpc, a tightening of the FIR spiral magnetic field is observed ( in FIR changes from approximately to and negative values). This reduction of the FIR pitch angle is not observed in radio, which displays a pitch angle that opens up with galactocentric radius. Similar discrepancies between FIR and radio -field structure are observed in the outskirts of M 83. M 83’s FIR polarization structure is more loosely wounded than at radio wavelengths (average at 154 m and at 6 cm), and there is a trend towards more negative values in FIR not detected in radio. This behavior is opposite to what it is observed in NGC 3627 ( at 154 m and at 6 cm), and in the outskirts of M 51 ( kpc).
NGC 4736 has a similar spiral -field orientation in both FIR and radio wavelengths ( at 154 m and at 3 cm) within the central 2 kpc. As shown in Fig. 7, the northern spiral arm of NGC 4736 has similar pitch angles in both FIR and radio wavelengths. However, the southern arm has a more tightly wounded magnetic pitch angle at FIR than at radio wavelengths.
The lack of a well-ordered spiral magnetic structure in NGC 6946 at FIR wavelengths is clear in the magnetic pitch angle profile. NGC 6946 has a regular -field at radio wavelengths () and mostly random at FIR wavelengths, although signs of a certain spiral structure can be detected with high variability (). The -field morphology at FIR wavelengths is very patchy and mostly coincident with compact regions of high FIR emission, potentially associated with star-forming regions across the disk (SALSA IV, Lopez-Rodriguez et al., 2022a). This result is in contrast to the regular spiral -field (‘magnetic arms’) observed at radio wavelengths (Beck, 1991, 2007). The difference between the radio polarization pattern and the FIR observations is clearly visible in Fig. 7.
For those galaxies without radio polarimetric observations, we found that a) the highly inclined galaxies NGC 4826 ( at 89 m) and NGC 7331 ( at 154 m) have an ordered spiral -field morphology at FIR wavelengths, and b) the spiral galaxy NGC 1068 ( at 89 m) has a magnetic pitch angle that is more tightly wounded with increasing galactocentric radius (, , Spearman correlation test).
In summary:
-
•
FIR and radio wavelengths do not generally trace the same -field morphology in spiral galaxies.
-
•
Magnetic pitch angle profiles traced with radio polarization observations present a more constant distribution across the disk than those obtained with FIR (e.g., the outskirts of M 51, M 83, or the entire disk of NGC 6946).
-
•
NGC 6946 has a large-scale well-ordered spiral -field at radio wavelengths, while the -field is highly disordered at FIR wavelengths. The FIR polarization is mainly cospatial with the star-forming regions, while the radio polarization is cospatial with the morphological interarm regions.
5 Angular dispersion
5.1 Methodology
Another interesting quantity is the dispersion of the local -field orientation and the average magnetic pitch angle at each galactrocentric radius. In addition to the magnetic pitch angle, Mohawc calculates the residuals between the magnetic pitch angle model and the measured -field orientation maps on a pixel-by-pixel basis. These residuals can be used to provide a quantitative measurement of the goodness-of-fit for the axisymmetric spiral -field model, and by extension, to compare how ‘ordered’ are the magnetic fields as a function of the tracer. By doing so, we can determine which regions are dominated by large-scale ordered spiral magnetic fields (low residuals) or by ‘disordered’ -fields (high residuals)555Note that we use the term ‘disordered’ rather than turbulent -fields, because ‘turbulent’ is typically defined as the coherence length of the -field in the ISM of pc (Ruzmaikin et al., 1988; Brandenburg & Subramanian, 2005; Haverkorn et al., 2008a). These scales are well-below the physical resolution, pc (Table 3), of the FIR and radio observations of spiral galaxies, and hence cannot contribute to polarized emission.. We define the magnetic alignment parameter, , as:
| (3) |
where is defined in Eq. 15 from Clark & Hensley (2019) as the angle difference from two angular measurements, and ,
| (4) |
can range from 1 (perfect alignment) to -1 (perpendicular fields)666Note that this definition is different to the histogram of relative orientations (HRO) used to quantify the relative orientation between the morphological structure of molecular clouds and the B-field orientation (e.g., Planck Collaboration et al., 2016; Jow et al., 2018).. thus represents a perfect alignment of the median axisymmetric spiral -field with the local field (large scale -field dominates). A random polarization field (disordered dominated) will yield an average value of . Since the axisymmetric model is measured from the polarization maps, values are not expected unless extreme small-scale local changes in the -field direction are present.
The radial profiles can be constructed using the same method as the magnetic pitch angle profiles (see Appendix B). We use the pitch angle probability distribution of each pixel to calculate as a function of the galactocentric radius and the associated uncertainties (68%, 95%, equivalent to the 1, 2). For all the analyses, we consider a critical level of at least p = 0.05 (95%) to declare statistical significance. This method is implemented in python and is available on the project website. Most of the large regions are usually at the cores as expected given the limited statistics within the central 2-3 beams. Low alignment for the inner beams can be caused both by statistical limitations (low number of valid pixels at the core), observational limitations (beam depolarization), and intrinsic physical properties of the core (higher turbulence). Due to this, we remove the central 2-3 beams for the analysis.
5.2 Results
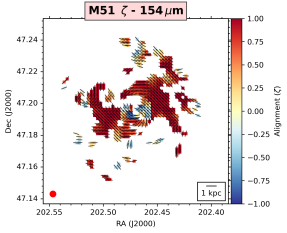
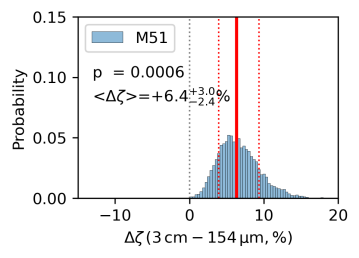
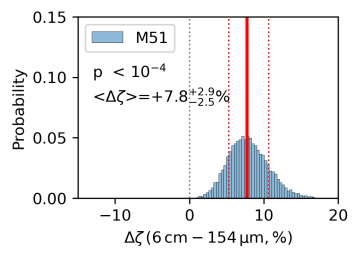
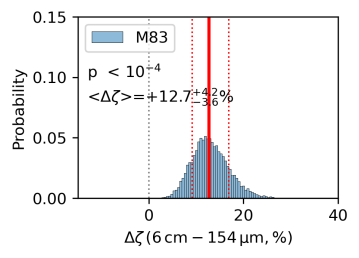
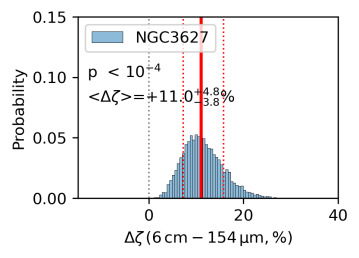
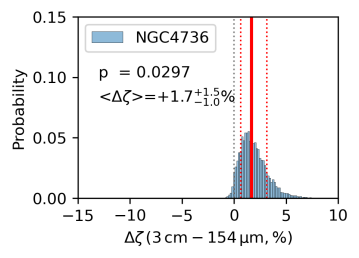
Figure 11 shows the maps of spiral galaxies on a pixel-by-pixel basis at FIR and radio wavelengths. Fig. 12 presents the profiles of magnetic alignment as a function of galactocentric radius for all spiral galaxies in FIR and radio when available. To compare the magnetic alignment profiles as a function of wavelength (Fig. 13), we show the histograms of the difference between radio and FIR, calculated as the difference between the maps from Fig. 11. The median and uncertainty of the histogram are shown in each plot and Table 4.
We measure in the majority of the disks of the spiral galaxies of our sample beyond a certain galactocentric radius in both FIR and radio wavelengths (Fig. 12), with exception of NGC 6946 and NGC 3627. This result indicates that a large-scale axisymmetric ordered -field is the dominant -field structure in the disk of galaxies at both FIR and radio wavelengths. Note that the individual measurements per LOS at the two wavelength regimes may differ.
The profiles in Fig. 12 show that in the analyzed spiral galaxies with radio and FIR data, the magnetic alignment at FIR wavelengths tends to be systematically lower than at radio wavelengths at the same radii, with some exceptions in the inner regions of NGC 3627 and NGC 4736. We quantify this result by analyzing the difference between radio and FIR alignment maps ( is the % increase of over ) in Fig. 13. The average values of are always statistically larger in radio polarization observations than FIR when compared in the same beams. The histograms show that M 51, M 83, NGC 3627, NGC 4736, and NGC 6946 have a better alignment with the large-scale ordered -field in radio than in FIR (, radio - FIR). We show the average differences for each galaxy in Table 4, and we confirm that all of them are statistically significant (). This suggests that the disordered component of the -field within the beam (i.e, small-scale -fields) of observations at FIR wavelengths may have a larger contribution than at radio wavelengths.
In summary:
-
•
Spiral galaxies have a dominant, , large-scale axisymmetric spiral -field in both radio and FIR wavelengths.
-
•
Radio polarization show larger (more ordered -fields) than those from FIR polarization measurements (more disordered -fields). Specifically, the FIR -fields have % more disordered -fields than those measured at radio wavelengths.
6 Discussion
One of the most striking results from this work is the differences on the patterns and angular dispersions between the FIR and radio -fields shown in spiral and starburst galaxies. We will discuss these differences in terms of the intrinsic nature of the tracer and the -field components, and separating the large- and small-scale -fields.
Magnetic fields extending over kpc-scales have been detected in many spiral galaxies using IR and radio polarimetric observations (Beck & Gaensler, 2004; Beck, 2015a; Lopez-Rodriguez et al., 2022a). These -fields are a fundamental part of galaxy evolution, driving gas mass inflows into the galactic core (Kim & Stone, 2012), regulating the star formation rate through the removal of angular momentum in contracting proto-stellar gas clouds (Mouschovias & Ciolek, 1999; Allen et al., 2003; Dapp & Basu, 2010; Pattle et al., 2022), affecting the formation of molecular clouds (Tahani et al., 2022a, b; Abe et al., 2021), and even potentially affecting the global morphology and gas kinematics in disk galaxies (Battaner & Florido, 2007; Ruiz-Granados et al., 2010; Martin-Alvarez et al., 2020; van de Voort et al., 2021). In spite of the substantial research efforts, the formation and structure of kpc-scale -fields in galaxies, as well as their possible role in the evolution of their hosts, are still outstanding questions in modern astrophysics.
The magnetic fields in spiral galaxies are observed to generally follow spiral patterns resembling the morphological spiral arms (Beck et al., 2019; Lopez-Rodriguez et al., 2020b). This spatial correlation is in agreement with the current paradigm in which weak seed magnetic fields (Rees, 1987; Subramanian, 2016) are amplified by dynamo mechanisms such as small-scale (– pc) turbulence (Beck, 1996; Brandenburg & Ntormousi, 2022; Haverkorn et al., 2008b; Bhat et al., 2016; Martin-Alvarez et al., 2022), and then reorganize them through differential galactic disk rotation and helical turbulence (large-scale dynamos, Gressel et al., 2008a, b; Gent, 2012; Bendre et al., 2015; Ntormousi et al., 2020).
While turbulent dynamos efficiently convert turbulent kinetic energy into magnetic energy (Widrow, 2002; Kulsrud & Zweibel, 2008; Federrath, 2016; Rincon, 2019), amplification takes place at the smallest scales and the resulting magnetic field follow the isotropic character of the driving turbulent field. The observations of kpc-scale magnetic field structures in spiral galaxies (Beck et al., 2019; Lopez-Rodriguez et al., 2020b; Borlaff et al., 2021) thus suggest that small-scale dynamos do not operate alone. Theoretical and modeling studies suggest that the efficient small-scale dynamos provide strong seed -fields for other less-efficient large-scale ordering mechanisms (i.e. differential rotation), which would subsequently align the field (Lou & Fan, 1998; Arshakian et al., 2009; Bhat et al., 2016). In addition to differential rotation, the interaction between small-scale dynamos and spiral density waves has been proposed as a mechanism for ordering the magnetic field in spiral galaxies (Beck & Wielebinski, 2013). Spiral density waves (Lin & Shu, 1964; Bertin & Lin, 1996; Sellwood, 2011; Dobbs & Baba, 2014; Font et al., 2019) periodically compress and shear the interstellar medium (ISM), triggering star formation in their wake. Spiral density waves can also modulate parameters of the large scale dynamo and lead to enhanced non-axisymmteric fields (anti-) correlated with the spiral (Mestel & Subramanian, 1991; Shukurov, 1998; Chamandy et al., 2013). As density waves travel through the ISM, magnetic field lines are sheared along the direction of the spiral arm, aligning the field with the morphological arms.
The mechanism described above to form kpc-scale ordered galactic magnetic fields scenario would work efficiently in grand-design spiral galaxies like M 51 (Patrikeev et al., 2006) or M 83 (Frick et al., 2016b), where star formation takes place preferentially on the spiral arms. Flocculent spirals (i.e., NGC 253, NGC 6946) would be less affected by the spiral density arm shear compression and as a consequence, they might present less ordered spiral magnetic fields, or lower alignment with their morphological counterparts (see NGC 6946). Similar results should apply to starburst galaxies (e.g., M 82), while AGN-dominated (e.g., Circinus), interacting, or recent merger galaxies (like the Antennae galaxies or Centarus A, Chyży & Beck, 2004; Lopez-Rodriguez, 2021b; Lopez-Rodriguez et al., 2023) may, in addition, present shock or AGN-induced aligned magnetic fields (Lopez-Rodriguez et al., 2021a).
6.1 FIR vs. Radio magnetic pitch angles in spiral galaxies
We found that the orientation of the large-scale spiral -fields traced through FIR polarimetric observations is statistically different from those measured through radio-synchrotron polarization observations. Note that radio observations were convolved and rebinned to the angular resolution (136) of the HAWC+ observations. These results confirm the conclusions from Borlaff et al. (2021, SALSA I) in M 51 and extends the result to a larger and more diverse sample of galaxies. A recent independent study on the same datasets used a linear decomposition of the polarization fields that also resulted in the same conclusions (Surgent et al., 2023). We showed that a large-scale ordered spiral -field is the dominant -field pattern for both radio and FIR wavelengths (with the exception of NGC 6946). However, the magnetic pitch angle profiles traced with radio polarization observations present a more ordered distribution across the entire disk than those obtained with FIR (i.e., the outskirts of M 51, M 83, or the entire disk of NGC 6946). Specifically, the radio and FIR magnetic pitch angles show median angular dispersion of and , respectively across the disk of spiral galaxies. In addition, the radio magnetic pitch angle is more open (i.e. larger pitch angles) with increasing galactrocentric radius, while the FIR pitch angle tends to be wrapped tighter (i.e. smaller pitch angles) in the outskirts of spiral galaxies (with exception of M 83).
Among the potential causes for these -field morphological differences we consider the intrinsic nature of the -field tracer. FIR polarization observations trace the -fields in the cold, K, and dense, , ISM (SALSA IV, Lopez-Rodriguez et al., 2022a). The measured FIR polarization is weighted by a combination of density, temperature, and grain alignment efficiency along the LOS and within the beam. Furthermore, the total FIR emission of galaxies has a typical vertical height of kpc (Verstappen et al., 2013). Thus, the FIR -fields are sensitive to the morphology and physical conditions of the dense ISM in the central few hundred pc of the galactic disk.
Radio synchrotron polarization traces the -field in a volume-filling medium of the warm and diffuse ISM (Beck et al., 2019). In spiral galaxies, the radio -field morphology is observed to have a component parallel to the midplane of the disk and another component with an X-shaped structure extending several kpc above and below the disk (Hummel et al., 1988; Krause et al., 2020). Larger radio halos containing -fields and cosmic rays are found in galaxies with higher star formation rate surface densities (Wiegert et al., 2015). In addition, radio polarimetric observations suffer from Faraday rotation along the LOS. Radio -fields are sensitive to the gradient of Faraday rotation (Sokoloff et al., 1998) and the physical conditions of both the halo and the galactic disk, but at 3 and 6 cm this effect is expected to be very small (less than rotation at 3 cm and less than at 6 cm) (see Beck & Wielebinski, 2013, Sec. 2.4). Beyond that limit, Faraday rotation systematic effects would greatly dominate the individual uncertainties of each beam, adding little information to our study. The main objective of the present work is to test observationally the structure of the magnetic field measured by different tracers (FIR vs. synchrotron). We attempt to do this by comparing datasets in the most compatible conditions (i.e., convolving the datasets of each galaxy to the largest beam size, applying quality cuts to both datasets, etc). While it is certainly interesting to explore a wider range in the polarization spectra at optical and near-IR wavelengths, these wavelengths are strongly affected by dust/electron scattering and have been shown to tell little about the B-fields in external galaxies (e.g., Elvius, 1972, 1978; Scarrott et al., 1991, 1993; Jones, 2000; Pavel & Clemens, 2012)
The large-scale dynamo (incorporating differential rotation) in galaxies can generate spiral -fields over kpc-scales (Beck, 1996; Gressel et al., 2008a, b). This mechanism generates B-fields with similar pitch angles to those of the morphological spiral arms (Beck & Wielebinski, 2013), although an offset between the -fields and the spirals has been measured depending on the tracer (e.g., Beck et al., 2019). The large-scale dynamo could operate most efficiently in interarm regions because it may be suppressed or disturbed in the spiral arms (Beck, 2015b). The -field associated with the dense (e.g., molecular) gas may respond in relatively short time-scales to gravitational and kinematic effects like minor mergers, accretion of intergalactic material, and resonances. Diffuse atomic gas also responds collisionally, but its scale-height is significantly higher, and its structure is more affected by supernova explosions and galaxy-scale processes, such as tidal interactions, bar, or spiral formation. Observational effects compatible with these hypotheses have been measured in several galaxies: in the outskirts of M 51 (SALSA I, Borlaff et al., 2021) due to the interaction with M 51b. Also in the central starburst of NGC 1097 (SALSA II, Lopez-Rodriguez et al., 2021c), where the radio -field has a spiral shape following the diffuse gas and the FIR -field is cospatial with a galactic shock at the boundaries of the bar and the starburst ring. Finally, in the relic spiral arm of the Antennae galaxies (SALSA VI, Lopez-Rodriguez et al., 2023), where the radio -field is radial and cospatial with the HI gas dynamics, and the FIR -field is spiral and cospatial with the dense and molecular ISM.
We suggest that the differences of the radial magnetic pitch angles at radio and FIR wavelengths may be caused by the ‘averaging’ of the several components of the -fields along the LOS due to the different nature of the two tracers. Due to the relatively narrow extension of the molecular disk at above and below the galactic plane compared to more diffuse components of the ISM, the FIR magnetic pitch angle efficiently traces the -field in the midplane of the galaxy (Fig. 10). Angular variations of the FIR magnetic pitch angle are driven by the dense ISM and star-forming regions (Sec. 6.2). However, the radio magnetic pitch angle may be more sensitive to the extraplanar -field as the distance from the core increases. This may occur by the combination of a) an increase of the vertical height of the X-shaped -field above and below the disk as galactocentric distance increases, b) an increase of the polarized flux from the X-shaped structure than from the disk, and/or c) depolarization in the arms due to an increase of random turbulent -fields.
We conclude that the FIR and radio magnetic pitch angles may trace similar -fields in the midplane of the disk within the central few kpc of spiral galaxies. However, the radio pitch angle may be arising from different vertical heights as galactocentric radius increases. Specifically, the radio -field may be extra-planar above the disk along the LOS, while the FIR is co-located with the midplane of the disk at large galactocentric radii.
6.2 Disordered-to-ordered -fields at FIR and radio
We have introduced the magnetic alignment parameter as a proxy of the disordered-to-ordered -field ratio on a pixel-to-pixel basis (see Sec. 5.1). The analysis of the alignment maps allowed us to compare the disordered-to-ordered -field ratio difference between FIR and radio polarimetric observations. Our results indicate that spiral galaxies have a dominant large-scale -field with a across their disk. We found that the FIR -field is % more disordered than the radio -field across the galaxy disk.
Individual measurements with indicates that angular dispersion may be due to a) -field variations below the physical scale of the beam of the observations, and/or b) -field variations from some physical mechanisms larger than the physical scale of the beam of the observations. For the latter, systematic angular dispersion across several beams are expected, while random angular dispersion between beams can indicate the signature of small-scale -fields. The azimuthally-averaged radial profiles, (), allow us to identify the variation of the disordered-to-ordered magnetic field in the spiral galaxies of our sample. Variations of indicate deviations from the axisymmetric large-scale ordered -field at scales larger than the beam of the observations. Angular variations larger than the beams of our observations can be driven by tangled random -fields, -field instabilities (Parker loops), and/or gas dynamics due to winds, outflows, supernovae, galaxy dynamics, or galaxy interactions. Angular variations smaller than the beam of our observations can also be driven by tangled random -fields due to star-formation, supernovae, or the increase of gas turbulence due to galaxy interaction or gas dynamics.
Lopez-Rodriguez et al. (2022a, SALSA IV) analyzed the trends of the FIR polarization fraction with the column density as a proxy to estimate the random -fields in the ISM. SALSA IV showed that the spiral galaxies have a relative increase of isotropic random FIR -fields driven by star-forming regions in the spiral arms. Sec. 6.1 have shown that the FIR and radio polarized emission trace different components of the -field in the disk of galaxies. In addition, showed that the FIR -field has is % more disordered than the radio -field as measured by the independent measurements of . These results suggest that the -field observations associated to dense, dusty, star-forming regions are less ordered than warmer, less-dense regions of the ISM.
FIR observations of molecular clouds in the Milky Way showed that the -field orientation can be drastically different as a function of the density of the ISM (Pillai et al., 2020). It is possible then that observationally, the properties of both the small- and large-scale magnetic fields differ as a function of the tracer and the phases of the ISM. This has been suggested by Seta & Federrath (2022) using MHD turbulent boxes with a multi-phase ISM. These authors measured that the ‘cold’ (T K) phase is more tangled that the ‘warm’ (T K) phase.
Our results indicate that the FIR polarimetric observations can be used as an indicator of the small-scale -fields associated to the activity of the star-forming regions and the morphology of the molecular clouds within a vertical height of few hundred pc in the disk of spiral galaxies. In addition, () also shows that the FIR -fields have larger fluctuation across the disk than radio -fields. This result may indicate that FIR polarization is more sensitive to large-scale mechanisms (i.e. outflows, Parker loops, galaxy interaction) affecting the galaxy.
6.3 Starburst galaxies
The differences between the magnetic field traced by FIR and radio polarimetric observations are even more striking in our sub-sample of starburst galaxies (M 82, NGC 253, and NGC 2146). We found that FIR polarimetric observations are able to trace the -field by means of magnetically aligned dust grains along the galactic outflows within the m wavelength range.
For M 82, we estimate a large change of the average magnetic field position angle ( and ) with wavelength in both FIR (from in 53 m to in 214 m), and radio ( in 6 cm, see Fig. 8 and Table 5). The radio polarimetric observations trace the -field by means of synchrotron emission in a magnetized bar mostly coincident with the galactic disk (Adebahr et al., 2013, 2017). A similar conclusion can be obtained from the observations of NGC 253 (Heesen et al., 2011). While the inner regions show -field orientations parallel to the disk of the galaxy in all wavelengths, strong discrepancies are observed in the outskirts, which might be a signature of galactic outflows. Although some Faraday depolarization may be affecting the radio polarimetric observations, we suggest that the discrepancy may be produced by the limited lifetime of the cosmic rays (CR) along the galactic outflows. This may be explained by the weak total synchrotron emission in the outflow (Adebahr et al., 2013, Fig. 6). In addition, the steep spectral indexes may be an indication of rapid aging of the CR electrons. FIR total intensity observations with Herschel have shown kpc scale extensions of dust above and below the disk (Roussel et al., 2010). The galactic outflow may have expelled % of the total dust mass of the galaxy (Roussel et al., 2010), making the cold phase of the ISM to be the bulk of the mass along the galactic outflow. Thus, the -field along the galactic outflows of starburst galaxies are better traced by using FIR polarimetric observations.
Radio polarimetric observations have measured an X-shaped structure extending several kpc above the disks of edge-on spiral galaxies (Krause et al., 2020). This vertical -field is different to that observed here in starburst galaxies. Our FIR polarimetric observations in edge-on galaxies do not show signs of a X-shaped -field structure. This is expected as the vertical height of dust emission is kpc (Verstappen et al., 2013), while the X-shaped -field observed in radio corresponds to synchrotron polarized emission from warm gas in the halo at several kpc scales.
FIR polarimetric observations also reveal large structural differences of the -field with wavelength in the 53 – 214 m range, as observed in Circinus (Fig. 3) and NGC 2146 (Fig. 6). For Circinus, the m and m -fields may be dominated by the starburst ring and the inner-bar, while the m -field may be tracing the -field in the outer bar and spiral arms of the host galaxy (Maiolino et al., 2000; Izumi et al., 2018). Further modeling is required to quantify these results.
The most extreme case is NGC 2146. This galaxy shows a -field with an orientation perpendicular to the galactic disk in the 53 – 89 m wavelength range associated with the galactic outflow. The 214 m observations reveal a parallel -field to the galactic disk associated to the galactic -field. Lopez-Rodriguez et al. (2022a, SALSA IV) computed the polarized spectral energy distribution (SED) of starburst galaxies showing a minimum within the m wavelength range. The falling m polarized spectrum was suggested to be produced by a decrease in the dust grain alignment efficiency due to a gradient of dust temperatures along the LOS. The rise spectrum at m was suggested to be produced by the dust becoming more optically thin at larger wavelengths. Thus, the measured m -field orientation is expected to be the transition between the two regimes (see Sec. 3.2.1). In addition, the extremely complex morphological structure of NGC 2146 suggests that it is the remnant of a recent interaction that triggered star-formation bursts (Martini et al., 2003; Tarchi et al., 2004; Erwin, 2005). While it is beyond the scope of this paper to explore this, the -field orientation differences detected within the different SOFIA HAWC+ bands suggest that FIR polarized emission could be dominated by different populations of dust grains as a function of wavelength, revealing different physical regimes in terms of density, radiation, or turbulence.
7 Conclusions
The HAWC+/FIR polarimetric observations of the SALSA Legacy Program of 14 nearby ( Mpc) galaxies analyzed in this paper, and presented in the previous publications from the project (SALSA I – IV, VI) provide a previously unexplored view of a fundamental factor in galaxy evolution: the -fields in the dense and cold ISM of galaxies. While extragalactic -fields have been observed for decades in radio polarization observations (e.g., Beck et al., 2019), high-spatial resolution FIR polarimetric maps from molecular clouds in the Milky Way (e.g., Pillai et al., 2020) have demonstrated that the structure of magnetic fields is a strong function of the density of the ISM at scales of hundreds of pc.
Here, we provide quantitative evidence that the kpc-scale of galactic magnetic fields depends strongly of the tracer: radio polarization observations of the synchrotron emission at 3 and 6 cm, and FIR polarization observations of the thermal polarized emission from magnetically aligned dust grains. In addition, we introduce the alignment parameter (Sec. 5), as a quantitative measurement of the dispersion between the measured B-field orientation and a large-scale axisymetric spiral magnetic field. allows us to estimate how well-ordered a spiral magnetic field is, and to compare it as a function of different observational tracers.
Our results suggest that radio and FIR polarization observations do not necessarily trace the same magnetic field structures. For most of our galaxies, significant differences are found in terms of local and global orientation of the magnetic field (Sec. 3.2), the pitch angle of spiral galaxies (Sec. 4), and the dispersion of the magnetic spiral structure (Sec. 5.2). We find evidence that even FIR polarization observations can trace different structures of the magnetic field as a function of wavelength as observed in NGC 2146 (53 m – 214 m, see Fig. 6). The differences in the magnetic pitch angle profiles (Fig. 10), and the alignment profiles (Fig. 12) indicate that radio polarization observations tend to trace a more regular and stable structure of the magnetic field, with less variation of the magnetic pitch angle, and a higher level of alignment . The five spiral galaxies studied with available FIR and radio polarization observations presented a statistically higher magnetic field dispersion in FIR than in radio (see Fig. 13).
While our observations are limited by spatial resolution and thus not able to resolve individual molecular clouds, all results point towards the conclusion that FIR polarization observations trace a less-ordered structure of the magnetic field than radio polarization observations. We suggest that FIR polarization observations are dominated by the emission from magnetically aligned dust grains cospatial with the cold, dense ISM, while radio polarization observations trace more diffuse regions of the ISM, less dominated by kinematic turbulence. Each beam from both radio and FIR polarization maps would be tracing an average of the magnetic field inside them, but dominated by the the dense, dusty molecular clouds in FIR. Star-formation, outflows, and accretion, and the morphological complexity of the galactic filaments of dust would increase the dispersion of the magnetic field from the average kpc-scale magnetic field orientation, with a lower effect on less-dense phases of the ISM.
High-resolution, FIR polarization observations of galaxies such as those provided by SOFIA/HAWC+ until its last flight in September 2022 are vital to understand the role of magnetic fields in the evolution of the Universe. While facilities like ALMA, South Pole Telescope, or James Clerk Maxwell Telescope provide polarimetric observations in sub-millimetric and/or FIR wavelength ranges, they lack the sensitivity and/or spatial resolution in the required wavelengths to achieve the same scientific requirements in nearby galaxies. In the absence of facilities such as SOFIA, unique in their ability to investigate the dusty component of galaxies as well as their magnetic fields, the astronomical community has no current alternatives to explore the magnetic fields inside the dust component of nearby galaxies through FIR polarimetry. Only the support of the astronomical community through proposed missions like PRIMA (Bradford et al., 2022, potential launch no earlier than 2030) for the upcoming NASA far-infrared (FIR) Probe missions or future FIR polarimetric missions will ensure a continuation of this field in the next decades.
Appendix A Measurements of the polarization angles at FIR and radio wavelengths
This section shows the histograms of the -field orientations at 3 and 6 cm, which are shown in Fig. 14. Table 5 show the circular average and integrated polarization fraction and -field orientation of the galaxies included in the SALSA sample. Table 6 shows the noise levels obtained and the quality cuts applied to each dataset.
| Galaxy | Band | Band | ||||
|---|---|---|---|---|---|---|
| (m) | (∘) | (∘) | (cm) | (∘) | (∘) | |
| (a) | (b) | (c) | (d) | (e) | (f) | (g) |
| Centaurus A | 89 | - | - | - | ||
| Circinus | 53 | - | - | - | ||
| 89 | - | - | - | |||
| 214 | - | - | - | |||
| M 51 | 154 | 3 | ||||
| 6 | ||||||
| M 82 | 53 | 6 | -⋆ | |||
| 89 | - | - | - | |||
| 154 | - | - | - | |||
| 214 | - | - | - | |||
| M 83 | 154 | 6 | ||||
| NGC 253 | 89 | 3 | ||||
| 154 | 6 | |||||
| NGC 1068 | 53 | - | - | - | ||
| 89 | - | - | - | |||
| NGC 1097 | 89 | 3 | ||||
| 154 | 6 | |||||
| NGC 2146 | 53 | - | - | - | ||
| 89 | - | - | - | |||
| 154 | - | - | - | |||
| 214 | - | - | - | |||
| NGC 3627 | 154 | 3 | ||||
| 6 | ||||||
| NGC 4736 | 154 | 3 | ||||
| 6 | ||||||
| NGC 4826 | 89 | - | - | - | ||
| NGC 6946 | 154 | 6 | ||||
| NGC 7331 | 154 | - | - | - |
| Galaxy | Band | Band | SNRFIR,PI | SNRFIR,I | |||||
|---|---|---|---|---|---|---|---|---|---|
| (m) | (Jy arcsec-2) | (Jy arcsec-2) | (cm) | (Jy arcsec-2) | (Jy arcsec-2) | (%) | |||
| (a) | (b) | (c) | (d) | (e) | (f) | (g) | (h) | (i) | (j) |
| Centaurus A | 89 | - | - | - | 2.5 | 20 | 10 | ||
| Circinus | 53 | - | - | - | 2.3 | 20 | 10 | ||
| 89 | - | - | - | 3.0 | 20 | 10 | |||
| 214 | - | - | - | 2.5 | 20 | 10 | |||
| M 51 | 154 | 3 | 3.0 | 20 | 10 | ||||
| 6 | |||||||||
| M 82 | 53 | 6 | * | * | 3.0 | 20 | 80 | ||
| 89 | - | - | - | 3.0 | 20 | 80 | |||
| 154 | - | - | - | 3.0 | 20 | 20 | |||
| 214 | - | - | - | 3.0 | 20 | 20 | |||
| M 83 | 154 | 6 | 2.5 | 20 | 10 | ||||
| NGC 253 | 89 | 3 | 2.5 | 10 | 20 | ||||
| 154 | 6 | 2.0 | 10 | 20 | |||||
| NGC 1068 | 53 | - | - | - | 2.0 | 10 | 10 | ||
| 89 | - | - | - | 2.0 | 10 | 10 | |||
| NGC 1097 | 89 | 3 | 3.0 | 10 | 10 | ||||
| 154 | 6 | 2.0 | 10 | 10 | |||||
| NGC 2146 | 53 | - | - | - | 3.0 | 20 | 30 | ||
| 89 | - | - | - | 3.0 | 20 | 20 | |||
| 154 | - | - | - | 3.0 | 20 | 20 | |||
| 214 | - | - | - | 3.0 | 20 | 20 | |||
| NGC 3627 | 154 | 3 | 2.0 | 20 | 40 | ||||
| 6 | |||||||||
| NGC 4736 | 154 | 3 | 2.0 | 20 | 68 | ||||
| 6 | |||||||||
| NGC 4826 | 89 | - | - | - | 2.3 | 20 | 20 | ||
| NGC 6946 | 154 | 6 | 2.3 | 20 | 20 | ||||
| NGC 7331 | 154 | - | - | - | 2.8 | 20 | 45 |
Appendix B Measuring the pitch angle of the FIR and radio polarization fields
We analyze the magnetic pitch angles of the -field maps following the methodology (Mohawc) presented by Borlaff et al. (2021) on M 51. Here, we summarize the steps to estimate the magnetic pitch angle, , as a function of the galactrocentric radius of spiral galaxies. Mohawc uses the Stokes maps to derive the profiles on a pixel-per-pixel basis, assuming that all the -field orientations are on the galactic plane viewed at a certain inclination, , with respect to the observer, and position angle, , on the plane of the sky. The uncertainties of the Stokes , position angle, and inclination are taken into account through Monte Carlo simulations. Our magnetic pitch angle estimation method entails processing the data on a pixel-by-pixel basis, allowing the user to separate different regions of the galaxy by using masks (if desired). The steps followed by Mohawc can be summarized as follows:
-
1.
The debiased polarization degree and its associated uncertainty are computed using the Stokes parameters and their uncertainties :
(B1) following Serkowski (1974), where:
(B2) and:
(B3) -
2.
The -field orientations are then re-projected to a new reference frame where the galaxy is observed face-on, using coordinates of the galactic center (, ), the galactic disk inclination, , and tilt angle, . The morphological parameters for each galaxy are summarized in Table 3.
-
3.
An azimuthal angular mask is created. The azimuthal mask is generated such that the deprojected -field orientation at each pixel location is perpendicular to the radial direction. We will refer to this idealized field as the zero pitch angle field or .
-
4.
The magnetic pitch angle at each pixel, , is calculated as the difference between the measured PAs of the -field orientation and the vector field.
-
5.
The magnetic pitch angle profile is then averaged at each radius from the core. The radial bins are linearly spaced, and their number is optimized as a compromise between SNR and spatial resolution. The angular average as a function of the galactrocentric radius, , is performed as follows:
(B4) where the operator indicates a robust median value (based on randomized Monte Carlo simulations) and (R) is the averaged magnetic pitch angle value for a certain radial bin.
For each galaxy, the process detailed above is repeated 10,000 times, using Monte Carlo simulations to include the uncertainties of the tilt angle, inclination, and the Stokes parameters. We assume that each parameter follows a Gaussian probability distribution, with a standard deviation equal to their uncertainties. We use the probability distribution for the pitch angle of each pixel to calculate the median magnetic pitch angle, radial profiles, and their uncertainties (68%, 95%, equivalent to the 1, 2). For all the analyses, we consider a critical level of at least (95%) to declare statistical significance.
Note that one of the limitations of Mohawc resides in the estimation of the pitch angle within the central 2-3 beams at the core of the galaxies. This limitation is due to the small number of measurements per annulus to obtain statistically significant measurements of the pitch angles (see Fig. 22 by Borlaff et al., 2021). Our analysis only takes into account the polarization measurements in the galaxy disks after beams ( pixels diameter) from the core. Systematic errors are expected due to the lack of statistics in regions too close to the center, or affected by internal core phenomena, like rings, bars, or AGNs. NGC 1068, M 83, or M 51 are examples of extreme values on their innermost bins, due to statistics, presenting more acceptable values in the second bin.
Appendix C Line Integral Convolution (LIC) RGB background components
In this appendix we summarize the components used as the RGB backgrounds in Fig. 1. Note that this figure is only for illustrative purposes, and no analysis were derived from these datasets:
-
1.
M51: Hubble/ACS, F658N (H) and F814W (red), F555W (green), and F435W (blue) - NASA/ESA S. Beckwith (STScI) and the Hubble Heritage Team (STScI/AURA).
-
2.
M82: The image combines visible starlight (gray) and H-alpha emission (red) from the Kitt Peak 2.1 m (Spitzer Infrared Nearby Galaxy Survey Legacy project), and near-infrared and mid-infrared starlight plus dust from Spitzer IRAC and SOFIA (3.6 and 53 m; yellow, credit: J. Moustakas et al.).
-
3.
M83: Spitzer/IRAC 3.6 m (blue), 4.5 m (green), 8 m (red) microns (NASA/JPL-Caltech).
-
4.
NGC 253: MPG/ESO 2.2-metre telescope Wide Field Imager (WFI, , , H and O III composition) - La Silla Observatory (Credit: ESO).
-
5.
NGC 1068: SDSS RGB image, combined with hard X-ray (magenta, NASA/NuSTAR). Credit: NASA/JPL-Caltech/Roma Tre Univ.
-
6.
NGC 1097: VLT/NACO (blue), (green), and -band (red). Credit: ESO/Prieto et al.
-
7.
NGC 2146: Hubble/ACS: F814W (blue), F658N (red), F814W + F658N (green). Credit: ESA/Hubble & NASA.
-
8.
NGC 3627: Spitzer/IRAC 3.6 m (blue), 4.5 m (green), 8 m (red) microns. Credit: NASA/JPL-Caltech/R. Kennicutt (University of Arizona) and the SINGS Team.
-
9.
NGC 4736: Hubble/WFPC2: F450W (blue), F555W (green), F814W (orange), F336W (red). Credit: ESA/Hubble & NASA.
-
10.
NGC 4826: Hubble/WFC3: F336W (purple), F438W (blue), F555W (green), F814W (orange), F275W (red). Credit: ESA/Hubble & NASA, J. Lee and the PHANGS-HST Team. Acknowledgement: Judy Schmidt.
NGC 6946: Spitzer/IRAC 3.6 m (blue), 4.5 m (green), 8 m (red) microns (NASA/JPL-Caltech). Credit: NASA/JPL-Caltech L.Proudfit.
NGC 7331: LRGB color composite CCD image taken with the 32-inch Schulman Telescope at Mt. Lemmon. Credit: Adam Block/Mount Lemmon SkyCenter/University of Arizona.
Antennae: Hubble/ACS and WFC3: F336W (blue), F435W (blue), F550W (cyan), F555W (cyan), F625W (green), F814W (orange), F658N (red). Credit: ESA/Hubble & NASA.
Centaurus A: MPG/ESO 2.2-metre telescope WFI ( - blue, - green), Atacama Pathfinder Experiment LABOCA (870 m - orange), Chandra X-ray Observatory (blue). Credit: ESO/WFI (Optical); MPIfR/ESO/APEX/A.Weiss et al. (Submillimetre); NASA/CXC/CfA/R.Kraft et al. (X-ray).
References
- Abe et al. (2021) Abe, D., Inoue, T., Inutsuka, S.-i., & Matsumoto, T. 2021, ApJ, 916, 83, doi: 10.3847/1538-4357/ac07a1
- Adebahr et al. (2017) Adebahr, B., Krause, M., Klein, U., Heald, G., & Dettmar, R. J. 2017, A&A, 608, A29, doi: 10.1051/0004-6361/201629616
- Adebahr et al. (2013) Adebahr, B., Krause, M., Klein, U., et al. 2013, A&A, 555, A23, doi: 10.1051/0004-6361/201220226
- Allen et al. (2003) Allen, A., Li, Z.-Y., & Shu, F. H. 2003, ApJ, 599, 363, doi: 10.1086/379243
- Arshakian et al. (2009) Arshakian, T. G., Beck, R., Krause, M., & Sokoloff, D. 2009, A&A, 494, 21, doi: 10.1051/0004-6361:200810964
- Astropy Collaboration et al. (2013) Astropy Collaboration, Robitaille, T. P., Tollerud, E. J., et al. 2013, A&A, 558, A33, doi: 10.1051/0004-6361/201322068
- Battaner & Florido (2007) Battaner, E., & Florido, E. 2007, Frontiers in Astronomy and Space Sciences, 328, 92, doi: 10.1002/asna.200610658
- Beck (1991) Beck, R. 1991, A&A, 251, 15
- Beck (1996) —. 1996, Nachr. Akad. Wiss. Göttingen II, 1996, 262
- Beck (2007) —. 2007, A&A, 470, 539, doi: 10.1051/0004-6361:20066988
- Beck (2015a) —. 2015a, A&A, 24, 4, doi: 10.1007/s00159-015-0084-4
- Beck (2015b) —. 2015b, A&A Rev., 24, 4, doi: 10.1007/s00159-015-0084-4
- Beck et al. (2019) Beck, R., Chamandy, L., Elson, E., & Blackman, E. G. 2019, Galaxies, 8, 4, doi: 10.3390/galaxies8010004
- Beck et al. (2005) Beck, R., Fletcher, A., Shukurov, A., et al. 2005, A&A, 444, 739, doi: 10.1051/0004-6361:20053556
- Beck & Gaensler (2004) Beck, R., & Gaensler, B. M. 2004, New A, 48, 1289, doi: 10.1016/j.newar.2004.09.013
- Beck & Wielebinski (2013) Beck, R., & Wielebinski, R. 2013, Magnetic Fields in Galaxies, ed. T. D. Oswalt & G. Gilmore, Vol. 5, 641, doi: 10.1007/978-94-007-5612-0_13
- Bendre et al. (2015) Bendre, A., Gressel, O., & Elstner, D. 2015, Frontiers in Astronomy and Space Sciences, 336, 991, doi: 10.1002/asna.201512211
- Bertin & Lin (1996) Bertin, G., & Lin, C. C. 1996, Spiral structure in galaxies a density wave theory
- Bhat et al. (2016) Bhat, P., Subramanian, K., & Brandenburg, A. 2016, MNRAS, 461, 240, doi: 10.1093/mnras/stw1257
- Bland-Hawthorn et al. (1997) Bland-Hawthorn, J., Gallimore, J. F., Tacconi, L. J., et al. 1997, Ap&SS, 248, 9, doi: 10.1023/A:1000567831370
- Borlaff et al. (2021) Borlaff, A. S., Lopez-Rodriguez, E., Beck, R., et al. 2021, ApJ, 921, 128, doi: 10.3847/1538-4357/ac16d7
- Bradford et al. (2022) Bradford, C., Glenn, J., Armus, L., et al. 2022, in American Astronomical Society Meeting Abstracts, Vol. 54, American Astronomical Society Meeting Abstracts, 304.07
- Brandenburg & Ntormousi (2022) Brandenburg, A., & Ntormousi, E. 2022, arXiv e-prints, arXiv:2211.03476. https://arxiv.org/abs/2211.03476
- Brandenburg & Subramanian (2005) Brandenburg, A., & Subramanian, K. 2005, Phys. Rep., 417, 1, doi: 10.1016/j.physrep.2005.06.005
- Braun et al. (1994) Braun, R., Walterbos, R. A. M., Kennicutt, Robert C., J., & Tacconi, L. J. 1994, ApJ, 420, 558, doi: 10.1086/173586
- Brinks et al. (1997) Brinks, E., Skillman, E. D., Terlevich, R. J., & Terlevich, E. 1997, Ap&SS, 248, 23, doi: 10.1023/A:1000519932279
- Cabral & Leedom (1993) Cabral, B., & Leedom, L. C. 1993, in Proceedings of the 20th Annual Conference on Computer Graphics and Interactive Techniques, SIGGRAPH ’93 (New York, NY, USA: Association for Computing Machinery), 263–270, doi: 10.1145/166117.166151
- Chamandy et al. (2013) Chamandy, L., Subramanian, K., & Shukurov, A. 2013, MNRAS, 428, 3569, doi: 10.1093/mnras/sts297
- Chyży & Beck (2004) Chyży, K. T., & Beck, R. 2004, A&A, 417, 541, doi: 10.1051/0004-6361:20031778
- Chyży & Buta (2008) Chyży, K. T., & Buta, R. J. 2008, ApJ, 677, L17, doi: 10.1086/587958
- Clark & Hensley (2019) Clark, S. E., & Hensley, B. S. 2019, ApJ, 887, 136, doi: 10.3847/1538-4357/ab5803
- Colombo et al. (2014) Colombo, D., Meidt, S. E., Schinnerer, E., et al. 2014, ApJ, 784, 4, doi: 10.1088/0004-637X/784/1/4
- Crosthwaite et al. (2002) Crosthwaite, L. P., Turner, J. L., Buchholz, L., Ho, P. T. P., & Martin, R. N. 2002, AJ, 123, 1892, doi: 10.1086/339479
- Daigle et al. (2006) Daigle, O., Carignan, C., Amram, P., et al. 2006, MNRAS, 367, 469, doi: 10.1111/j.1365-2966.2006.10002.x
- Dapp & Basu (2010) Dapp, W. B., & Basu, S. 2010, A&A, 521, L56, doi: 10.1051/0004-6361/201015700
- Dicaire et al. (2008) Dicaire, I., Carignan, C., Amram, P., et al. 2008, MNRAS, 385, 553, doi: 10.1111/j.1365-2966.2008.12868.x
- Dobbs & Baba (2014) Dobbs, C., & Baba, J. 2014, PASA, 31, e035, doi: 10.1017/pasa.2014.31
- Dowell et al. (2010) Dowell, C. D., Cook, B. T., Harper, D. A., et al. 2010, in Society of Photo-Optical Instrumentation Engineers (SPIE) Conference Series, Vol. 7735, Proc. SPIE, 77356H, doi: 10.1117/12.857842
- Elmouttie et al. (1998a) Elmouttie, M., Haynes, R. F., Jones, K. L., Sadler, E. M., & Ehle, M. 1998a, MNRAS, 297, 1202, doi: 10.1046/j.1365-8711.1998.01592.x
- Elmouttie et al. (1998b) Elmouttie, M., Krause, M., Haynes, R. F., & Jones, K. L. 1998b, MNRAS, 300, 1119, doi: 10.1046/j.1365-8711.1998.02002.x
- Elvius (1972) Elvius, A. 1972, A&A, 19, 193
- Elvius (1978) —. 1978, A&A, 65, 233
- Erwin (2005) Erwin, P. 2005, MNRAS, 364, 283, doi: 10.1111/j.1365-2966.2005.09560.x
- Evirgen et al. (2017) Evirgen, C. C., Gent, F. A., Shukurov, A., Fletcher, A., & Bushby, P. 2017, MNRAS, 464, L105, doi: 10.1093/mnrasl/slw196
- Federrath (2016) Federrath, C. 2016, New A, 82, 535820601, doi: 10.1017/S0022377816001069
- Ferrarese et al. (2007) Ferrarese, L., Mould, J. R., Stetson, P. B., et al. 2007, ApJ, 654, 186, doi: 10.1086/506612
- Fletcher et al. (2011) Fletcher, A., Beck, R., Shukurov, A., Berkhuijsen, E. M., & Horellou, C. 2011, MNRAS, 412, 2396, doi: 10.1111/j.1365-2966.2010.18065.x
- Font et al. (2019) Font, J., Beckman, J. E., James, P. A., & Patsis, P. A. 2019, MNRAS, 482, 5362, doi: 10.1093/mnras/sty2983
- Frick et al. (2016a) Frick, P., Stepanov, R., Beck, R., et al. 2016a, A&A, 585, A21, doi: 10.1051/0004-6361/201526796
- Frick et al. (2016b) —. 2016b, A&A, 585, A21, doi: 10.1051/0004-6361/201526796
- Gent (2012) Gent, F. A. 2012, PhD thesis, Newcastle University
- Gressel et al. (2008a) Gressel, O., Elstner, D., Ziegler, U., & Rüdiger, G. 2008a, A&A, 486, L35, doi: 10.1051/0004-6361:200810195
- Gressel et al. (2008b) Gressel, O., Ziegler, U., Elstner, D., & Rüdiger, G. 2008b, Frontiers in Astronomy and Space Sciences, 329, 619, doi: 10.1002/asna.200811005
- Harper et al. (2018) Harper, D. A., Runyan, M. C., Dowell, C. D., et al. 2018, Journal of Astronomical Instrumentation, 7, 1840008, doi: 10.1142/S2251171718400081
- Haverkorn et al. (2008a) Haverkorn, M., Brown, J. C., Gaensler, B. M., & McClure-Griffiths, N. M. 2008a, ApJ, 680, 362, doi: 10.1086/587165
- Haverkorn et al. (2008b) —. 2008b, ApJ, 680, 362, doi: 10.1086/587165
- Heald et al. (2009) Heald, G., Braun, R., & Edmonds, R. 2009, A&A, 503, 409, doi: 10.1051/0004-6361/200912240
- Heesen et al. (2011) Heesen, V., Beck, R., Krause, M., & Dettmar, R. J. 2011, A&A, 535, A79, doi: 10.1051/0004-6361/201117618
- Hsieh et al. (2011) Hsieh, P.-Y., Matsushita, S., Liu, G., et al. 2011, ApJ, 736, 129, doi: 10.1088/0004-637X/736/2/129
- Hummel et al. (1988) Hummel, E., Lesch, H., Wielebinski, R., & Schlickeiser, R. 1988, A&A, 197, L29
- Hunter (2007) Hunter, J. D. 2007, Computing in Science & Engineering, 9, 3
- Izumi et al. (2018) Izumi, T., Wada, K., Fukushige, R., Hamamura, S., & Kohno, K. 2018, ApJ, 867, 48, doi: 10.3847/1538-4357/aae20b
- Jones et al. (1999) Jones, K. L., Koribalski, B. S., Elmouttie, M., & Haynes, R. F. 1999, MNRAS, 302, 649, doi: 10.1046/j.1365-8711.1999.02057.x
- Jones (2000) Jones, T. J. 2000, AJ, 120, 2920, doi: 10.1086/316880
- Jones et al. (2019) Jones, T. J., Dowell, C. D., Lopez Rodriguez, E., et al. 2019, ApJ, 870, L9, doi: 10.3847/2041-8213/aaf8b9
- Jow et al. (2018) Jow, D. L., Hill, R., Scott, D., et al. 2018, MNRAS, 474, 1018, doi: 10.1093/mnras/stx2736
- Karachentsev et al. (2000) Karachentsev, I. D., Sharina, M. E., & Huchtmeier, W. K. 2000, A&A, 362, 544. https://arxiv.org/abs/astro-ph/0010148
- Kennicutt et al. (2003) Kennicutt, Robert C., J., Armus, L., Bendo, G., et al. 2003, PASP, 115, 928, doi: 10.1086/376941
- Kim & Stone (2012) Kim, W.-T., & Stone, J. M. 2012, ApJ, 751, 124, doi: 10.1088/0004-637X/751/2/124
- Krasheninnikova et al. (1989) Krasheninnikova, I., Shukurov, A., Ruzmaikin, A., & Sokolov, D. 1989, A&A, 213, 19
- Krause et al. (2020) Krause, M., Irwin, J., Schmidt, P., et al. 2020, A&A, 639, A112, doi: 10.1051/0004-6361/202037780
- Kulsrud & Zweibel (2008) Kulsrud, R. M., & Zweibel, E. G. 2008, Reports on Progress in Physics, 71, 046901, doi: 10.1088/0034-4885/71/4/046901
- Kuno et al. (2007) Kuno, N., Sato, N., Nakanishi, H., et al. 2007, PASJ, 59, 117, doi: 10.1093/pasj/59.1.117
- Lin & Shu (1964) Lin, C. C., & Shu, F. H. 1964, ApJ, 140, 646, doi: 10.1086/147955
- Lopez-Rodriguez (2021a) Lopez-Rodriguez, E. 2021a, Nature Astronomy, doi: 10.1038/s41550-021-01329-9
- Lopez-Rodriguez (2021b) —. 2021b, Nature Astronomy, 5, 604, doi: 10.1038/s41550-021-01329-9
- Lopez-Rodriguez et al. (2021a) Lopez-Rodriguez, E., Guerra, J. A., Asgari-Targhi, M., & Schmelz, J. T. 2021a, ApJ, 914, 24, doi: 10.3847/1538-4357/abf934
- Lopez-Rodriguez et al. (2021b) —. 2021b, ApJ, 914, 24, doi: 10.3847/1538-4357/abf934
- Lopez-Rodriguez et al. (2020a) Lopez-Rodriguez, E., Dowell, C. D., Jones, T. J., et al. 2020a, ApJ, 888, 66, doi: 10.3847/1538-4357/ab5849
- Lopez-Rodriguez et al. (2020b) —. 2020b, ApJ, 888, 66, doi: 10.3847/1538-4357/ab5849
- Lopez-Rodriguez et al. (2021c) Lopez-Rodriguez, E., Beck, R., Clark, S. E., et al. 2021c, ApJ, 923, 150, doi: 10.3847/1538-4357/ac2e01
- Lopez-Rodriguez et al. (2022a) Lopez-Rodriguez, E., Mao, S. A., Beck, R., et al. 2022a, ApJ, 936, 92, doi: 10.3847/1538-4357/ac7f9d
- Lopez-Rodriguez et al. (2022b) Lopez-Rodriguez, E., Clarke, M., Shenoy, S., et al. 2022b, ApJ, 936, 65, doi: 10.3847/1538-4357/ac83ac
- Lopez-Rodriguez et al. (2023) Lopez-Rodriguez, E., Borlaff, A. S., Beck, R., et al. 2023, ApJ, 942, L13, doi: 10.3847/2041-8213/acaaa2
- Lou & Fan (1998) Lou, Y.-Q., & Fan, Z. 1998, ApJ, 493, 102, doi: 10.1086/305114
- Lucero et al. (2015) Lucero, D. M., Carignan, C., Elson, E. C., et al. 2015, MNRAS, 450, 3935, doi: 10.1093/mnras/stv856
- Maiolino et al. (2000) Maiolino, R., Alonso-Herrero, A., Anders, S., et al. 2000, ApJ, 531, 219, doi: 10.1086/308444
- Mardia (1972) Mardia, K. V. 1972, in Statistics of Directional Data, ed. K. V. Mardia, Probability and Mathematical Statistics: A Series of Monographs and Textbooks (Academic Press), ibc1–ibc2, doi: https://doi.org/10.1016/B978-0-12-471150-1.50022-4
- Martin-Alvarez et al. (2022) Martin-Alvarez, S., Devriendt, J., Slyz, A., et al. 2022, MNRAS, 513, 3326, doi: 10.1093/mnras/stac1099
- Martin-Alvarez et al. (2020) Martin-Alvarez, S., Slyz, A., Devriendt, J., & Gómez-Guijarro, C. 2020, MNRAS, 495, 4475, doi: 10.1093/mnras/staa1438
- Martini et al. (2003) Martini, P., Regan, M. W., Mulchaey, J. S., & Pogge, R. W. 2003, ApJS, 146, 353, doi: 10.1086/367817
- Mayya et al. (2005) Mayya, Y. D., Carrasco, L., & Luna, A. 2005, ApJ, 628, L33, doi: 10.1086/432644
- McQuinn et al. (2017) McQuinn, K. B. W., Skillman, E. D., Dolphin, A. E., Berg, D., & Kennicutt, R. 2017, AJ, 154, 51, doi: 10.3847/1538-3881/aa7aad
- Mestel & Subramanian (1991) Mestel, L., & Subramanian, K. 1991, MNRAS, 248, 677, doi: 10.1093/mnras/248.4.677
- Mouschovias & Ciolek (1999) Mouschovias, T. C., & Ciolek, G. E. 1999, in NATO Advanced Study Institute (ASI) Series C, Vol. 540, The Origin of Stars and Planetary Systems, ed. C. J. Lada & N. D. Kylafis, 305
- Ntormousi et al. (2020) Ntormousi, E., Tassis, K., Del Sordo, F., Fragkoudi, F., & Pakmor, R. 2020, A&A, 641, A165, doi: 10.1051/0004-6361/202037835
- Patrikeev et al. (2006) Patrikeev, I., Fletcher, A., Stepanov, R., et al. 2006, A&A, 458, 441, doi: 10.1051/0004-6361:20065225
- Pattle et al. (2022) Pattle, K., Fissel, L., Tahani, M., Liu, T., & Ntormousi, E. 2022, arXiv e-prints, arXiv:2203.11179. https://arxiv.org/abs/2203.11179
- Pavel & Clemens (2012) Pavel, M. D., & Clemens, D. P. 2012, ApJ, 761, L28, doi: 10.1088/2041-8205/761/2/L28
- Pillai et al. (2020) Pillai, T. G. S., Clemens, D. P., Reissl, S., et al. 2020, Nature Astronomy, 4, 1195, doi: 10.1038/s41550-020-1172-6
- Planck Collaboration et al. (2015) Planck Collaboration, Ade, P. A. R., Aghanim, N., et al. 2015, A&A, 576, A104, doi: 10.1051/0004-6361/201424082
- Planck Collaboration et al. (2016) Planck Collaboration, Adam, R., Ade, P. A. R., et al. 2016, A&A, 586, A135, doi: 10.1051/0004-6361/201425044
- Quillen et al. (2010) Quillen, A. C., Neumayer, N., Oosterloo, T., & Espada, D. 2010, PASA, 27, 396, doi: 10.1071/AS09069
- Radburn-Smith et al. (2011) Radburn-Smith, D. J., de Jong, R. S., Seth, A. C., et al. 2011, ApJS, 195, 18, doi: 10.1088/0067-0049/195/2/18
- Rees (1987) Rees, M. J. 1987, QJRAS, 28, 197
- Rincon (2019) Rincon, F. 2019, New A, 85, 205850401, doi: 10.1017/S0022377819000539
- Robitaille & Bressert (2012) Robitaille, T., & Bressert, E. 2012, APLpy: Astronomical Plotting Library in Python. http://ascl.net/1208.017
- Roussel et al. (2010) Roussel, H., Wilson, C. D., Vigroux, L., et al. 2010, A&A, 518, L66, doi: 10.1051/0004-6361/201014567
- Ruiz-Granados et al. (2010) Ruiz-Granados, B., Rubiño-Martín, J. A., Florido, E., & Battaner, E. 2010, ApJ, 723, L44, doi: 10.1088/2041-8205/723/1/L44
- Ruzmaikin et al. (1988) Ruzmaikin, A., Sokolov, D., & Shukurov, A. 1988, Nature, 336, 341, doi: 10.1038/336341a0
- Scarrott et al. (1993) Scarrott, S. M., Draper, P. W., Stockdale, D. P., & Wolstencroft, R. D. 1993, MNRAS, 264, L7, doi: 10.1093/mnras/264.1.L7
- Scarrott et al. (1991) Scarrott, S. M., Rolph, C. D., Wolstencroft, R. W., & Tadhunter, C. N. 1991, MNRAS, 249, 16P, doi: 10.1093/mnras/249.1.16P
- Sellwood (2011) Sellwood, J. A. 2011, MNRAS, 410, 1637, doi: 10.1111/j.1365-2966.2010.17545.x
- Serkowski (1974) Serkowski, K. 1974, Methods of Experimental Physics, 12, 361, doi: 10.1016/S0076-695X(08)60500-1
- Seta & Federrath (2022) Seta, A., & Federrath, C. 2022, MNRAS, 514, 957, doi: 10.1093/mnras/stac1400
- Shukurov (1998) Shukurov, A. 1998, MNRAS, 299, L21, doi: 10.1046/j.1365-8711.1998.01958.x
- Soida et al. (2001) Soida, M., Urbanik, M., Beck, R., Wielebinski, R., & Balkowski, C. 2001, A&A, 378, 40, doi: 10.1051/0004-6361:20011185
- Sokoloff et al. (1998) Sokoloff, D. D., Bykov, A. A., Shukurov, A., et al. 1998, MNRAS, 299, 189, doi: 10.1046/j.1365-8711.1998.01782.x
- Subramanian (2016) Subramanian, K. 2016, Reports on Progress in Physics, 79, 076901, doi: 10.1088/0034-4885/79/7/076901
- Surgent et al. (2023) Surgent, W. J., Lopez-Rodriguez, E., & Clark, S. E. 2023, arXiv e-prints, arXiv:2302.07278, doi: 10.48550/arXiv.2302.07278
- Tahani et al. (2022a) Tahani, M., Glover, J., Lupypciw, W., et al. 2022a, A&A, 660, L7, doi: 10.1051/0004-6361/202243322
- Tahani et al. (2022b) Tahani, M., Lupypciw, W., Glover, J., et al. 2022b, A&A, 660, A97, doi: 10.1051/0004-6361/202141170
- Tarchi et al. (2004) Tarchi, A., Greve, A., Peck, A. B., et al. 2004, MNRAS, 351, 339, doi: 10.1111/j.1365-2966.2004.07792.x
- Tully (1988) Tully, R. B. 1988, Nearby galaxies catalog
- Tully et al. (2009) Tully, R. B., Rizzi, L., Shaya, E. J., et al. 2009, AJ, 138, 323, doi: 10.1088/0004-6256/138/2/323
- Tully et al. (2013) Tully, R. B., Courtois, H. M., Dolphin, A. E., et al. 2013, AJ, 146, 86, doi: 10.1088/0004-6256/146/4/86
- Vacca et al. (2015) Vacca, W. D., Hamilton, R. T., Savage, M., et al. 2015, ApJ, 804, 66, doi: 10.1088/0004-637X/804/1/66
- Vaillancourt et al. (2007) Vaillancourt, J. E., Chuss, D. T., Crutcher, R. M., et al. 2007, in Society of Photo-Optical Instrumentation Engineers (SPIE) Conference Series, Vol. 6678, Proc. SPIE, 66780D, doi: 10.1117/12.730922
- van de Voort et al. (2021) van de Voort, F., Bieri, R., Pakmor, R., et al. 2021, MNRAS, 501, 4888, doi: 10.1093/mnras/staa3938
- Verstappen et al. (2013) Verstappen, J., Fritz, J., Baes, M., et al. 2013, A&A, 556, A54, doi: 10.1051/0004-6361/201220733
- Widrow (2002) Widrow, L. M. 2002, \rmp, 74, 775, doi: 10.1103/RevModPhys.74.775
- Wiegert et al. (2015) Wiegert, T., Irwin, J., Miskolczi, A., et al. 2015, AJ, 150, 81, doi: 10.1088/0004-6256/150/3/81
- Willick et al. (1997) Willick, J. A., Courteau, S., Faber, S. M., et al. 1997, ApJS, 109, 333, doi: 10.1086/312983
- Zschaechner et al. (2016) Zschaechner, L. K., Walter, F., Bolatto, A., et al. 2016, ApJ, 832, 142, doi: 10.3847/0004-637X/832/2/142