Quiescent low-mass galaxies observed by JWST in the Epoch of Reionization
Abstract
The surprising JWST discovery of a quiescent, low-mass () galaxy at redshift (JADES-GS-z7-01-QU) represents a unique opportunity to study the imprint of feedback processes on early galaxy evolution. We build a sample of 130 low-mass () galaxies from the serra cosmological zoom-in simulations, which show a feedback-regulated, bursty star formation history (SFH). The fraction of time spent in an active phase increases with the stellar mass from at to at , and it is in agreement with the value estimated for JADES-GS-z7-01-QU. On average, 30% of the galaxies are quiescent in the range ; they become the dominant population at . However, none of these quiescent systems matches the Spectral Energy Distribution of JADES-GS-z7-01-QU, unless their SFH is artificially truncated a few Myr after the main star formation peak. As supernova feedback can only act on a longer timescale ( Myr), this implies that the observed abrupt quenching must be caused by a faster physical mechanism, such as radiation-driven winds.
1 Introduction
The growth of galaxies is regulated by the conversion of cold gas into stars and is affected by different feedback processes (Ciardi & Ferrara, 2005), which can lead to the temporary or definitive quenching of the star formation activity. Internal feedback mechanisms include radiative feedback, which can destroy H2 molecules preventing gas cooling (e.g. Johnson et al., 2007; Krumholz et al., 2009), and mechanical feedback from massive stars/supernovae (SN) or active galactic nuclei (AGN), which can partially or completely remove the gas reservoir (e.g. Mac Low & Ferrara, 1999; Croton et al., 2016; Carnall et al., 2023).
The evolution of low-mass galaxies, which we define here as those with stellar mass , is dramatically affected, regulated, and – in some cases – even halted by these physical mechanisms because of their shallow potential well (e.g. Ferrara & Tolstoy, 2000; Salvadori et al., 2008; Wise et al., 2012; Collins & Read, 2022). Furthermore, these systems can also be impacted by more global feedback mechanisms, such as reionization, preventing the accretion of fresh gas into the less massive systems (e.g. Gnedin, 2000; Dijkstra et al., 2004; Sobacchi & Mesinger, 2013; Pereira-Wilson et al., 2023), and environmental effects, such as ram-pressure stripping, which can remove the interstellar medium from satellite galaxies (e.g. Mayer et al., 2006; Emerick et al., 2016; Boselli et al., 2022). Thus, low-mass galaxies are the ideal laboratory to investigate feedback processes.

In the early Universe, low-mass galaxies are very common. Thanks to JWST we can now study them and investigate the role of the various feedback processes in their evolution. Looser et al. (2023) recently reported the discovery of a quiescent low-mass galaxy at redshift (see also Strait et al. 2023 for another very low-mass quiescent system at ) from the JADES program, JADES-GS-z7-01-QU. Following this work, we define as quiescent those galaxies with no (or negligible) star formation activity at the epoch of observation111Note that in the literature quiescent galaxies are sometimes differently defined as those below the main sequence (Houston et al., 2023), or quenched for Myr (Pérez-González et al., 2022).. According to Looser et al. (2023), the spectral energy distribution (SED) of JADES-GS-z7-01-QU is consistent with a metal-poor stellar population formed in a short and intense burst of star formation followed by rapid quenching (star formation rate ), about 10–20 Myr before the epoch of observation. Given the rapidity of the transition from a star-forming to a quiescent state for JADES-GS-z7-01-QU, its quenching is expected to have been driven by a fast process. A reasonable explanation may therefore be associated with the injection of mechanical energy through outflows by either star formation or AGN.
In this Letter, we aim at interpreting these new findings and address the following questions: what is the duty cycle of high-redshift low-mass galaxies? When and why low-mass galaxies become quiescent? What are the key physical mechanisms causing their quenching?
2 Simulated low-mass galaxies
To answer the above questions, we use the serra (Pallottini et al., 2022) suite of high-resolution cosmological zoom-in simulations that follow the evolution of typical Lyman break galaxies during the Epoch of Reionization. The simulations evolve from , where initial conditions are generated with music (Hahn & Abel, 2011), in a cosmological volume of by assuming a Planck Collaboration et al. (2014) cosmology222Throughout the paper we assume a CDM model with vacuum, matter, and baryon densities in units of the critical density , , , Hubble constant , spectral index , and .. A customised version of the Adaptive Mesh Refinement code ramses (Teyssier, 2002) is used for the evolution of dark matter (DM), stars and gas, reaching a baryon mass resolution of and spatial resolution of in the zoom-in regions, i.e. about the mass and size of molecular clouds.
On-the-fly radiative transfer is included through ramses-rt (Rosdahl et al., 2013), and a non-equilibrium chemical network generated with krome (Grassi et al., 2014) is used for regulating the interaction of the gas with photons (Pallottini et al., 2017a). Stars form according to a Schmidt–Kennicutt relation (Kennicutt, 1998) depending on the molecular-hydrogen gas density, and assuming a Kroupa (2001) initial mass function for the stellar particles. Stellar feedback modelling includes SNe explosions, winds and radiation pressure (Pallottini et al., 2017b). The energy inputs and chemical yields, depending on the stellar age and metallicity, are computed through starburst99 (Leitherer et al., 1999) using padova stellar tracks (Bertelli et al., 1994), covering a metallicity range of . Since the resolution does not allow to follow the evolution of the first stars and mini-haloes, their effect on the ISM is reproduced by setting the initial gas metallicity to a floor value of (Wise et al., 2012; Pallottini et al., 2014).
The emission of the galaxies is modelled using starburst99 for the stellar and nebular continuum (see also Gelli et al., 2021). We use cloudy (Ferland et al., 2017) to compute nebular line emission (considering the main ones typically contributing to the rest-frame UV-optical spectrum, i.e. , , , [OII]3726,3729, [OIII]4959,5007 and CIII]1909), accounting for the ISM density, metallicity, internal structure, and radiation field (e.g. Vallini et al., 2018; Pallottini et al., 2019; Kohandel et al., 2019). Finally, we take into account the presence of dust which attenuates the intrinsic galaxy spectrum (i.e. Gelli et al., 2021), adopting a dust-to-metal ratio and assuming a MW-like dust composition and grain size distribution333This choice is driven by ALMA measurements of high- galaxies (Bouwens et al., 2022), that support a MW-like dust (Ferrara et al., 2022b) and low dust-to-metal ratios (Behrens et al., 2018; Laporte et al., 2017). However, the use use different extinction curves (e.g. SMC, LMC) does not lead to significant changes in the emission of low-mass galaxies. (Weingartner & Draine, 2001).
We analyse multiple snapshots of different serra runs in the range . We follow the stellar-density method implemented in Gelli et al. (2020) to select low-mass galaxies with . The final sample has 130 galaxies.
As an example, in Fig. 1 we show stellar and gas density maps from one of the simulations at . The displayed volume () contains 6 galaxies. In the two insets we zoom on typical low-mass systems: an actively star-forming (), and a quiescent system with no ongoing star formation (). The former shows an extended ( in radius) stellar distribution, and a gas proto-disk structure, typical of more massive galaxies. The quiescent galaxy is instead smaller, both in terms of stellar mass and size, with all of its stars concentrated in the inner , and almost completely devoid of gas.
3 Nature of quiescent systems
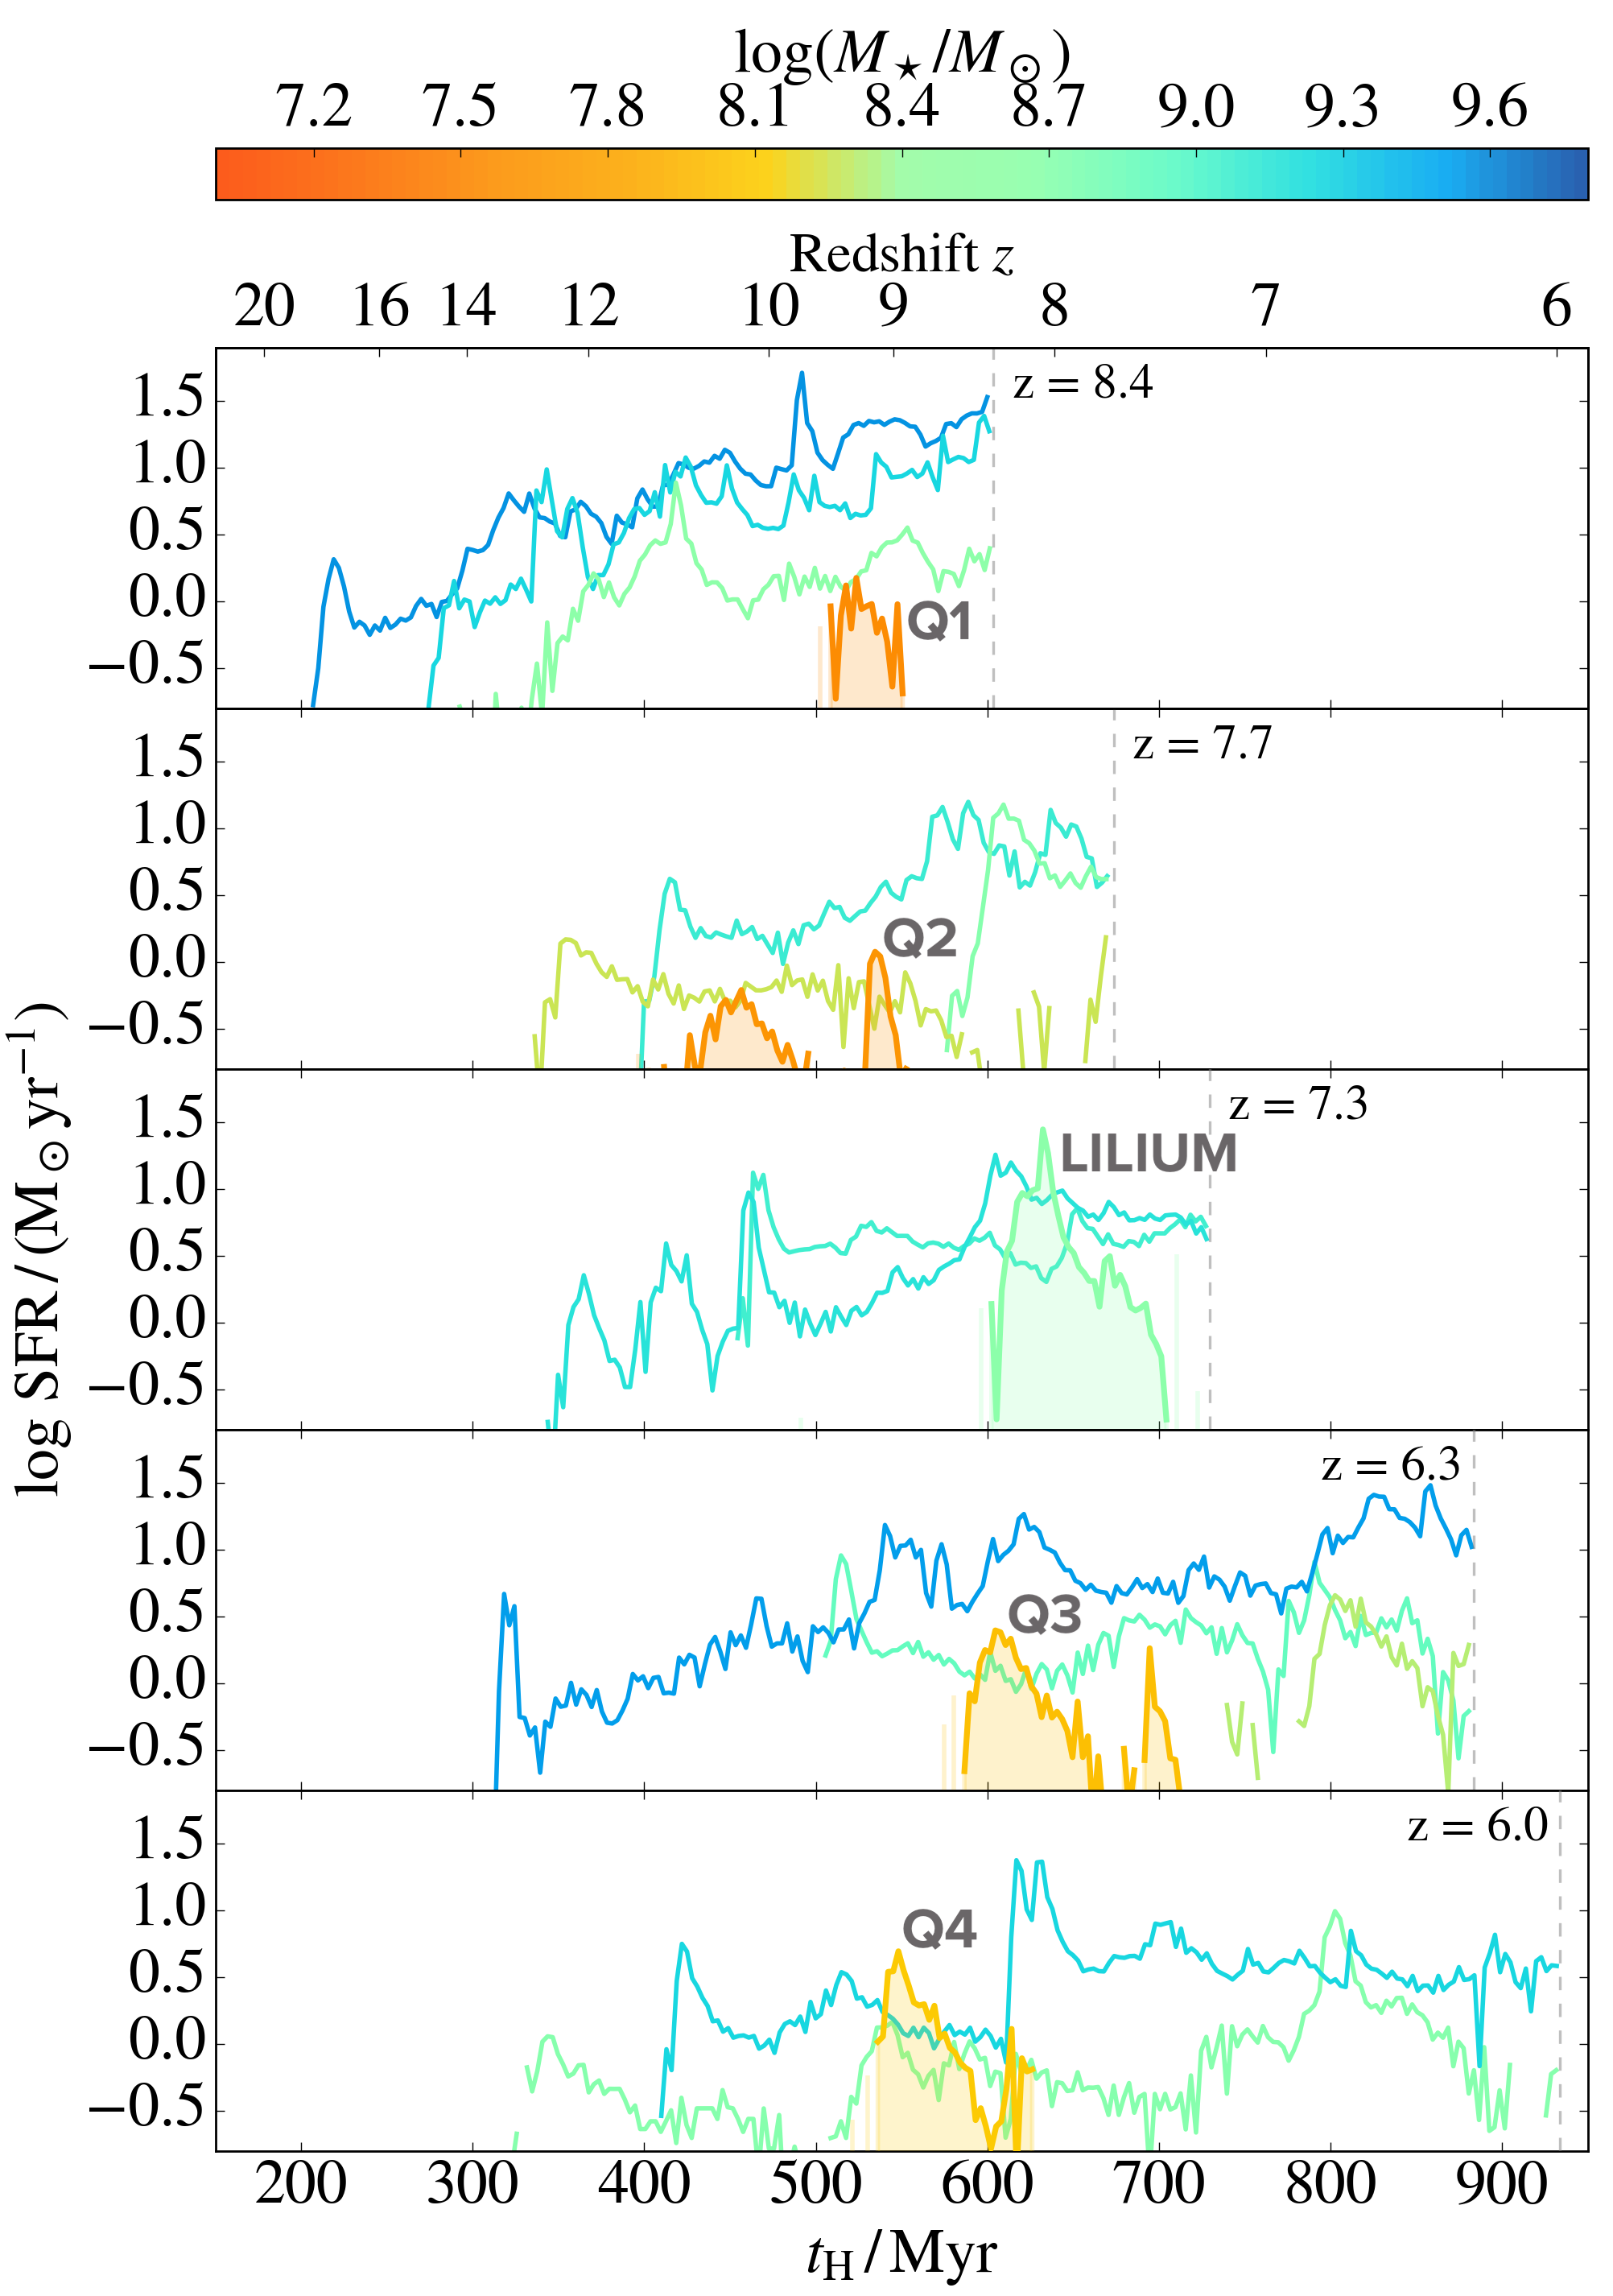
In Fig. 2 we show the star formation histories (SFHs) in terms of age of the Universe for some serra low-mass galaxies up to different observation redshifts. The SFHs have an intermittent nature made of bursts followed by star formation drops or even halts. Such behaviour results from stellar feedback, efficiently decreasing or even suppressing star formation in low-mass galaxies. Note that all galaxies with final mass have experienced quiescent SF phases, or are still quenched at the final snapshot, which is identified as the redshift of observation. On average, these quenched galaxies represent the 30% of the population.
Interestingly, after the SF peak, these low-mass galaxies feature a smooth SFR decrease lasting some tens of Myr until the final quenching. This trend is typical of stellar feedback powered by SNe, as explosions occur with a delay time that increases with a decreasing SN progenitor mass (see Gelli et al., 2020). This behaviour is encountered in all low-mass systems, i.e. in both field and satellite galaxies, implying that environmental processes do not drive their evolution.
In the middle panel of Fig. 2 we pinpoint the galaxy Lilium, which is quiescent at and has the same stellar mass of JADES-GS-z7-01-QU ().
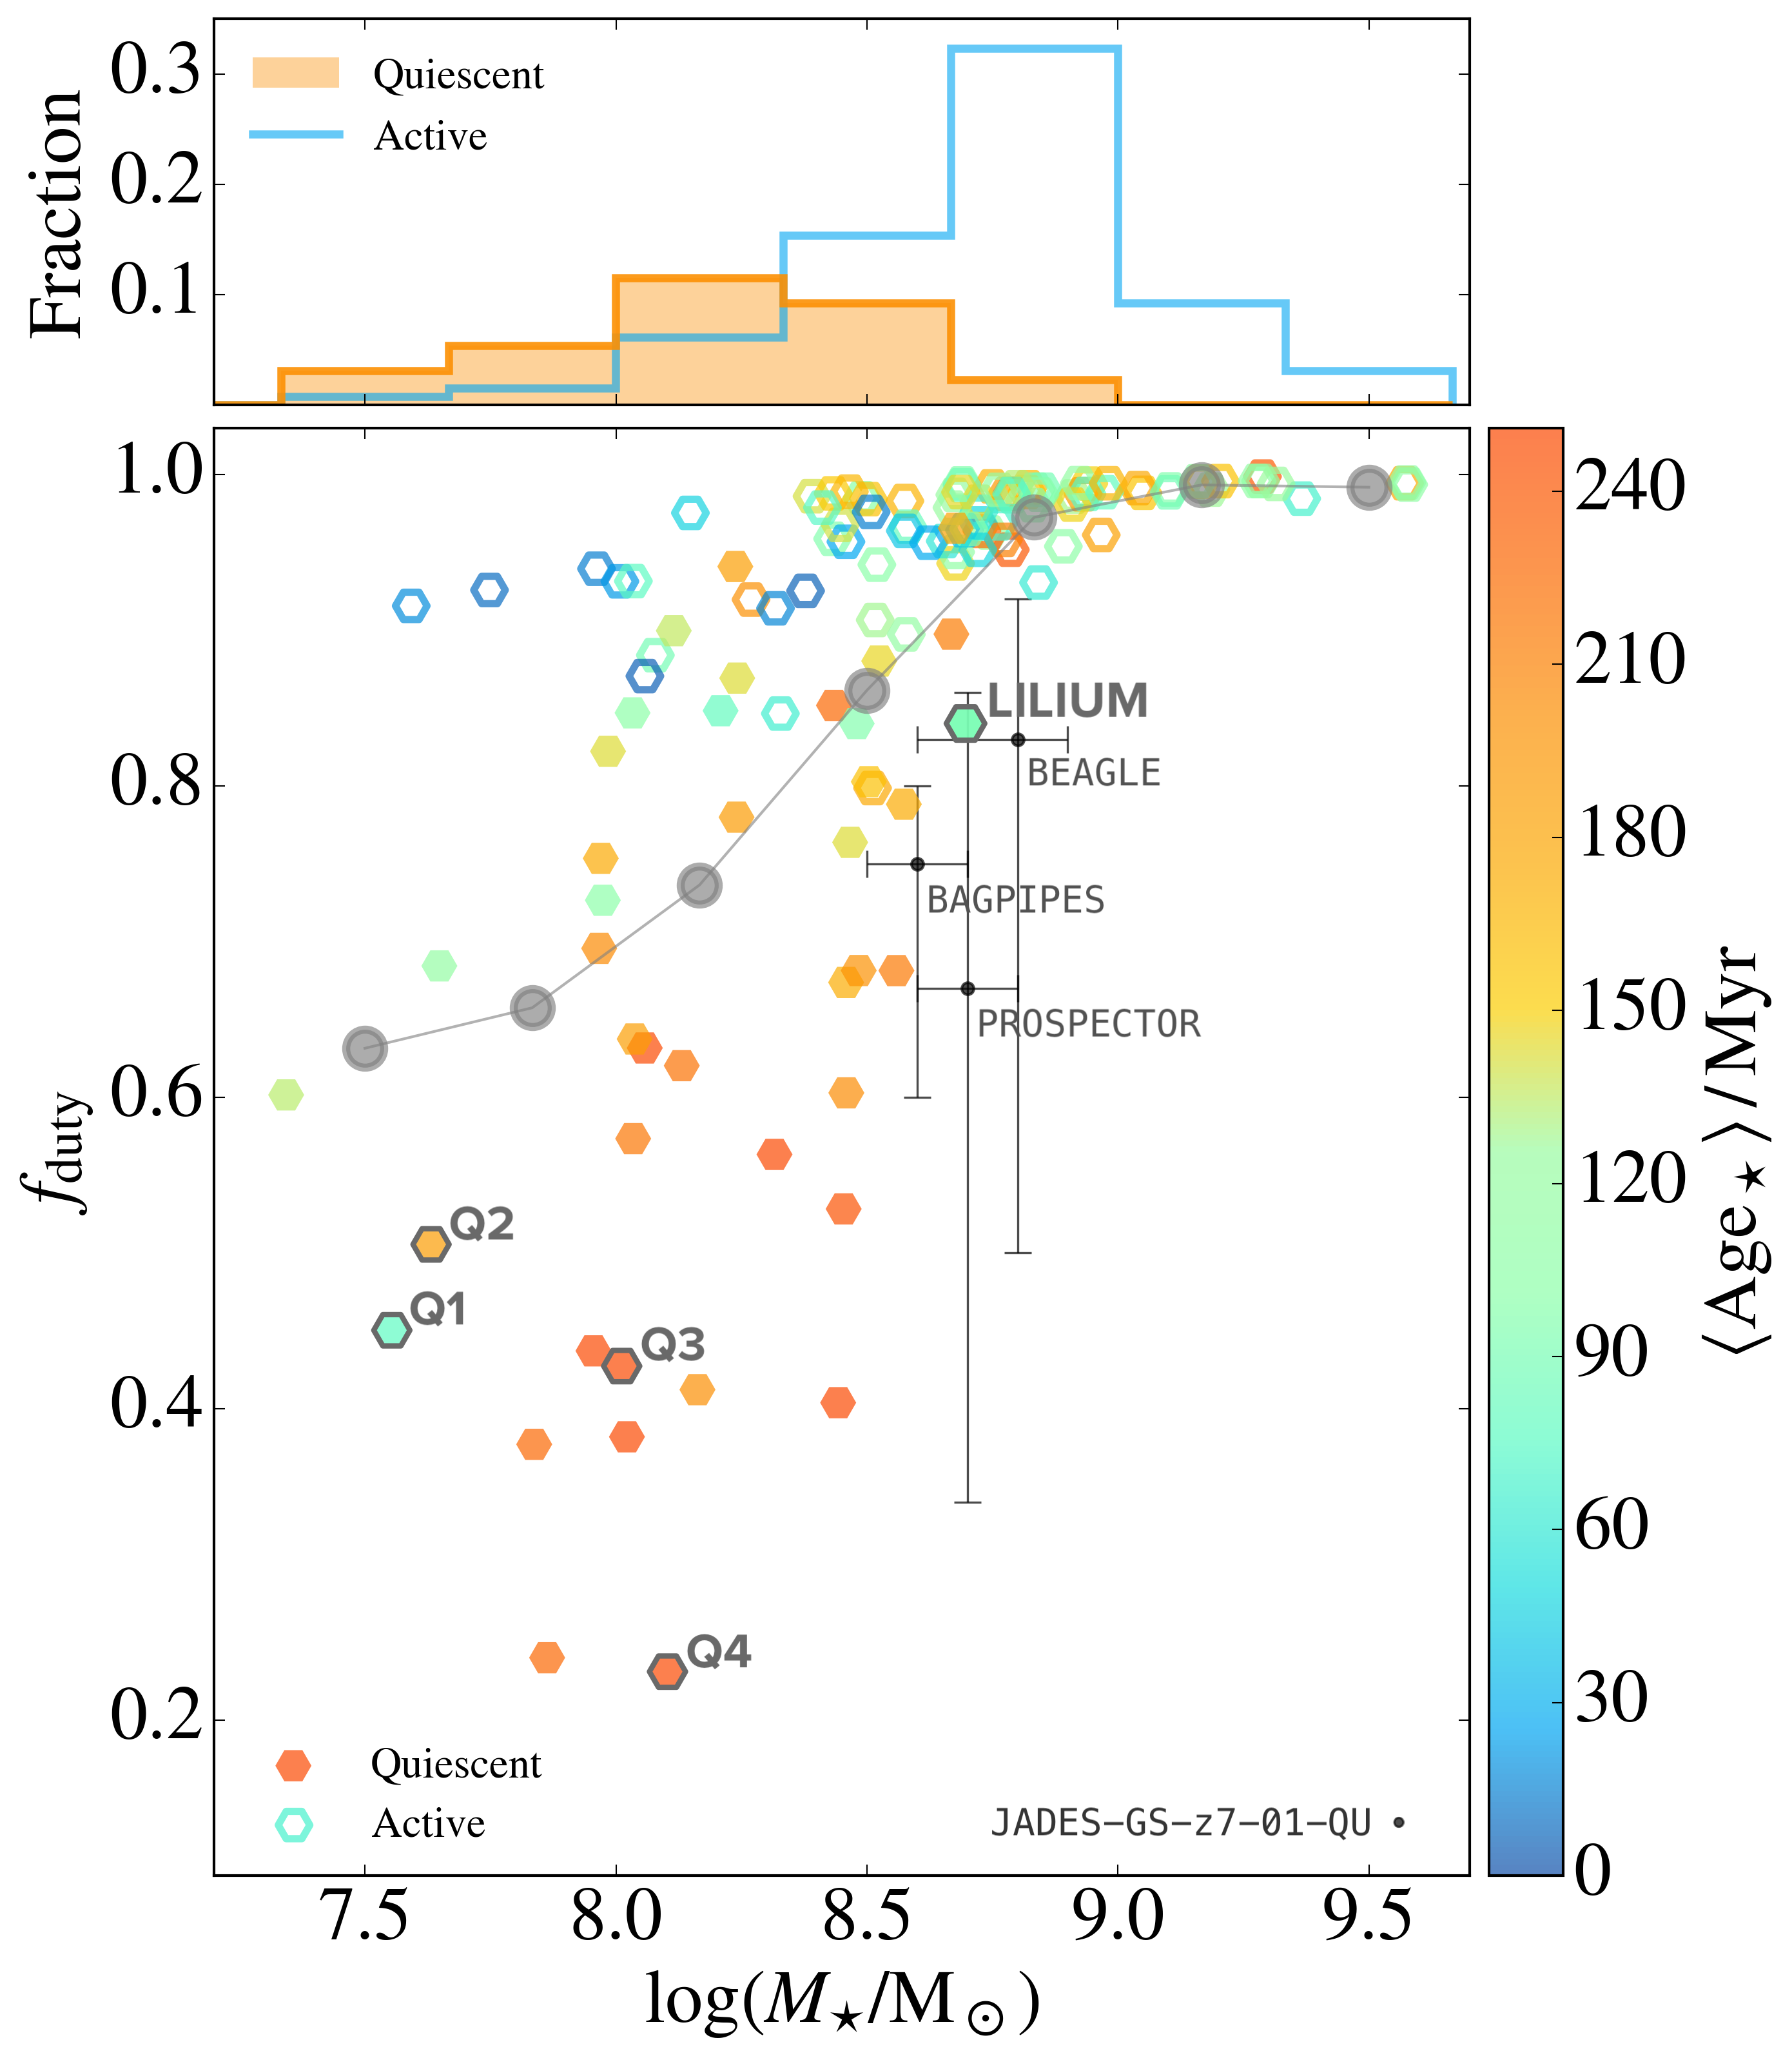
Fig. 3 shows the galaxy SFR duty cycle, i.e. the ratio between the actively star forming (SFR) time interval, , and the time elapsed between the first star formation event, , and the observation redshift at :
| (1) |
Galaxies are color-coded with the mass-averaged age of their stellar populations; quiescent systems (Q1-Q4) identified in Fig. 2 are specifically indicated.
Galaxies with can be either quiescent or active, and the fraction of quiescent systems increases with decreasing stellar mass, becoming the dominating population for (see histograms in the upper panel of Fig. 3). In this mass range quiescent galaxies (a) are older (average ages Myr), (b) have lower and more scattered duty cycles () than active galaxies (). For , instead, all galaxies are active, and they have been forming stars for of their lifetime.
The average duty cycle of quiescent and active galaxies clearly reflects these trends with stellar mass, slowly increasing from for to for . Noticeably, the quiescent galaxy Lilium () has a duty cycle that is consistent with the values obtained for JADES-GS-z7-01-QU using different stellar population synthesis tools by Looser et al. 2023. For instance, when considering the values derived with bagpipes in Table 1 therein444Note that in Looser et al. (2023) is defined as lookback time from the observation, while in this paper it is defined in terms of age of the Universe., the time from the first star formation event is Myr, and the time of active star formation is Myr. This implies a duty cycle (see Equation 1) for JADES-GS-z7-01-QU of .
4 Comparison with JWST observations
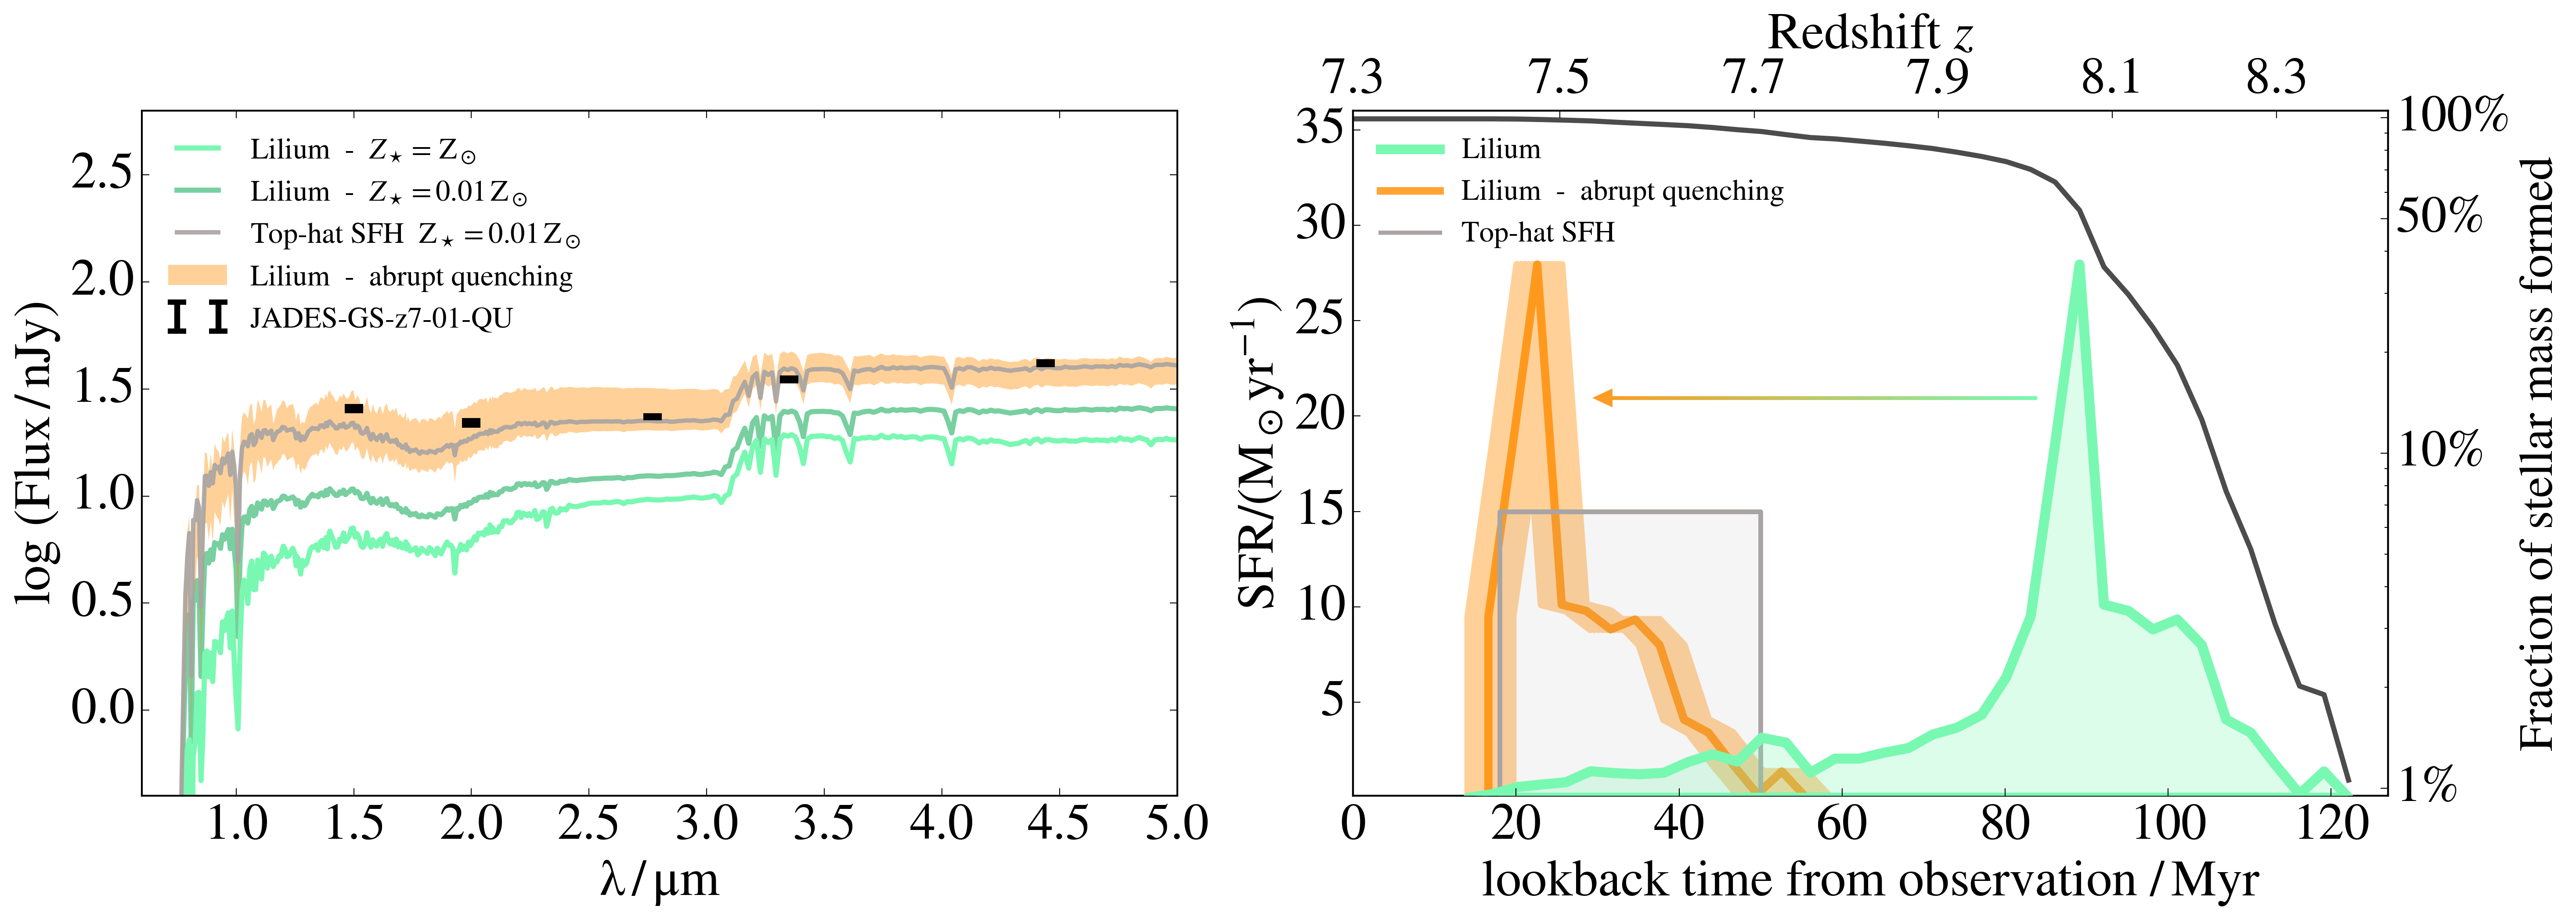
Lilium was selected among serra quiescent galaxies due to its similarity with JADES-GS-z7-01-QU in terms of stellar mass, duty cyle (Fig. 3), and the time elapsed between SF quenching and observation redshift ( Myr for Lilium vs. Myr for JADES-GS-z7-01-QU). However, the stellar populations of Lilium are more metal-rich () than deduced by Looser et al. (2023) for JADES-GS-z7-01-QU, . In spite of these similarities, the SED we predict for Lilium (Fig. 4, left panel) is too faint to match the one observed in JADES-GS-z7-01-QU. What is the origin of such discrepancy?
We first check the role of stellar metallicity by imposing that all the stars in Lilium have . However, the resulting SED only increases by dex (see Fig. 4, left panel). The right panel of Fig. 4 displays the SFH of Lilium. At , i.e. around 120 Myr before observations, Lilium started to form stars at a progressively increasing rate. After Myr it experienced a short and intense burst of star formation (), after which 80% of the final stellar mass was already in place. Then, the SFR was gradually suppressed by SNe, which are the dominating feedback mechanism in our simulations. Indeed, the galaxy continued to form stars at a much lower rate, , for Myr, i.e. up to when it was completely quenched. Therefore, at the redshift of observation, , the average stellar age of Lilium is Myr old (see colorbar in Fig. 3).
In the same panel, we plot a SFH similar to the one derived by Looser et al. (2023) using bagpipes, essentially a top-hat with a but with the same and as Lilium. With this SFR, the observed is produced in only Myr, resulting in a much younger ( Myr) stellar population. The other SED-fitting codes555The code beagle (Chevallard & Charlot, 2016) is also used in Looser et al. (2023). However, since it does not provide a reconstruction of the SFH or the average stellar age, a direct comparison with this model is not possible. used by Looser et al. (2023), prospector (Johnson et al., 2021) and pxff (Cappellari, 2017), also draw similar conclusions, resulting in average stellar ages always lower than Myr. As a consequence, the corresponding experimentally-derived SED reaches fluxes about 10 higher than Lilium (Fig. 4, left) and matches JADES-GS-z7-01-QU photometry if a metallicity of is further assumed.
This result shows that the discrepancy between the SEDs of Lilium and JADES-GS-z7-01-QU is largely due to differences in their SFHs, and to a lesser extent, metallicity. The key difference is the fact the SFR decrease in Lilium after the SF peak is too prolonged, resulting in a high fraction of old stars at the time of the observation. This suggests the need for an abrupt quenching right after the SF peak.
To test this hypothesis, we artificially impose that SF in Lilium was abruptly halted Myr after the peak, and we renormalize it to get the same value. We then assume to observe the galaxy after Myr from the halt, and thus shift the SFHs to match the redshift of the observations, i.e. . As a consequence of the overall galaxy lifetime time being shorter, the duty cycle of Lilium lowers to . We find that such modefied Lilium SED now perfectly matches the observed one even by assuming the simulated stellar metallicity, .
5 Discussion
In spite of the fact that Lilium is very similar to JADES-GS-z7-01-QU, the simulated SED does not match the observed one. We have shown that this is due to the fact that star formation in JADES-GS-z7-01-QU is quenched on a much shorter time scale than in Lilium.
If the quenching has to be produced by SNe, there is an intrinsic timescale on which such feedback acts, which is given by the time over which SNe associated with a given burst explode. This value is Myr for a Kroupa IMF (see, e.g. Fig. 2 in Pallottini et al. 2017a). The quenching cannot therefore be significantly shorter than this minimum value, and this is exactly what we see in the SFH of Lilium and the other quenched low-mass galaxies (Q1, Q2, Q3, Q4). Basically, the SFR decline under the action of SN feedback is very gradual, resulting in a too large a number of stars that are old by the time when the galaxy is observed. This is a general problem of SF quenching in low-mass galaxies, which inherently depends on the delay of SN explosions associated to the deaths of progenitors of different mass (e.g. Rosdahl et al., 2017).
We speculate that the decline could be more abrupt if the mechanical energy is instead provided by a hidden AGN and/or radiation pressure from young massive stars (e.g. Carniani et al., 2016; Ferrara et al., 2022a; Ziparo et al., 2023). Indeed we may in general estimate the quenching timescale as , where is the delay time associated with the onset of the physical process causing the quenching and is the ejection time required for the outflow to drive the gas out of the galaxy. While for SNe we have , for radiation-driven feedback there is no such delay and we can evaluate the overall quenching timescale simply as . Assuming a typical outflow velocity of and requiring to expel the gas at a distance of to quench star formation (given that the effective radius of the galaxy is ), we obtain: . The gas in the galaxy is expected to be set in motion and removed in such a short time as soon as the galaxy exceeds the Eddington limit. Specifically this can happen through: i) stellar radiation, when the specific SFR exceeds a threshold value (, see Fiore et al. 2023) ii) AGN feedback from massive black holes that may be a viable solution for high-z galaxies according to recent results (e.g. Maiolino et al., 2023). We therefore conclude that the SFR decline might be a powerful diagnostic of different feedback types.
Another puzzle posed by the JADES-GS-z7-01-QU observation is its long latency before the first episode of star formation. This source is observed at and, according to the SED interpretation, has formed all its stars in a short () burst. This sets the start of its star formation activity at . From the observed stellar mass , and conservatively assuming that all its baryons were turned into stars, we can set a lower limit to the host halo, . Assuming a standard growth history, this halo should have crossed the critical mass , marking the separation between minihalos, in which the SF is easily suppressed, and the star-forming Ly-cooling halos at . Thus, in the redshift interval (280 Myr), although conditions were in principle favourable to star formation in terms of gas cooling, the galaxy did not form a significant amount of stars. A possibility might be the following: if a galaxy spawns a massive stellar cluster () as its first star formation event, its radiation can photo-dissociate molecular hydrogen and prevent further star formation for up to Myr (see Alyssum, Pallottini et al., 2022).
As JWST will build a sizeable sample of quiescent high- galaxies, we will be able to solve these puzzles and understand the nature of the feedback-regulated evolution of low-mass systems.
References
- Behrens et al. (2018) Behrens, C., Pallottini, A., Ferrara, A., Gallerani, S., & Vallini, L. 2018, MNRAS, 477, 552, doi: 10.1093/mnras/sty552
- Bertelli et al. (1994) Bertelli, G., Bressan, A., Chiosi, C., Fagotto, F., & Nasi, E. 1994, A&A Supp., 106, 275
- Boselli et al. (2022) Boselli, A., Fossati, M., & Sun, M. 2022, A&A Rev., 30, 3, doi: 10.1007/s00159-022-00140-3
- Bouwens et al. (2022) Bouwens, R. J., Smit, R., Schouws, S., et al. 2022, ApJ, 931, 160, doi: 10.3847/1538-4357/ac5a4a
- Cappellari (2017) Cappellari, M. 2017, MNRAS, 466, 798, doi: 10.1093/mnras/stw3020
- Carnall et al. (2018) Carnall, A. C., McLure, R. J., Dunlop, J. S., & Davé, R. 2018, MNRAS, 480, 4379, doi: 10.1093/mnras/sty2169
- Carnall et al. (2023) Carnall, A. C., McLeod, D. J., McLure, R. J., et al. 2023, MNRAS, doi: 10.1093/mnras/stad369
- Carniani et al. (2016) Carniani, S., Marconi, A., Maiolino, R., et al. 2016, A&A, 591, A28, doi: 10.1051/0004-6361/201528037
- Chevallard & Charlot (2016) Chevallard, J., & Charlot, S. 2016, MNRAS, 462, 1415, doi: 10.1093/mnras/stw1756
- Ciardi & Ferrara (2005) Ciardi, B., & Ferrara, A. 2005, Space Science Reviews, 116, 625, doi: 10.1007/s11214-005-3592-0
- Collins & Read (2022) Collins, M. L. M., & Read, J. I. 2022, Nature Astronomy, 6, 647, doi: 10.1038/s41550-022-01657-4
- Croton et al. (2016) Croton, D. J., Stevens, A. R. H., Tonini, C., et al. 2016, ApJS, 222, 22, doi: 10.3847/0067-0049/222/2/22
- Dijkstra et al. (2004) Dijkstra, M., Haiman, Z., Rees, M. J., & Weinberg, D. H. 2004, ApJ, 601, 666, doi: 10.1086/380603
- Emerick et al. (2016) Emerick, A., Mac Low, M.-M., Grcevich, J., & Gatto, A. 2016, ApJ, 826, 148, doi: 10.3847/0004-637X/826/2/148
- Ferland et al. (2017) Ferland, G. J., Chatzikos, M., Guzmán, F., et al. 2017, Rev. Mexicana Astron. Astrofis., 53, 385, doi: 10.48550/arXiv.1705.10877
- Ferrara et al. (2022a) Ferrara, A., Pallottini, A., & Dayal, P. 2022a, arXiv e-prints, arXiv:2208.00720, doi: 10.48550/arXiv.2208.00720
- Ferrara & Tolstoy (2000) Ferrara, A., & Tolstoy, E. 2000, MNRAS, 313, 291, doi: 10.1046/j.1365-8711.2000.03209.x
- Ferrara et al. (2022b) Ferrara, A., Sommovigo, L., Dayal, P., et al. 2022b, MNRAS, 512, 58, doi: 10.1093/mnras/stac460
- Fiore et al. (2023) Fiore, F., Ferrara, A., Bischetti, M., Feruglio, C., & Travascio, A. 2023, ApJL, 943, L27, doi: 10.3847/2041-8213/acb5f2
- Gelli et al. (2021) Gelli, V., Salvadori, S., Ferrara, A., Pallottini, A., & Carniani, S. 2021, ApJL, 913, L25, doi: 10.3847/2041-8213/abfe6c
- Gelli et al. (2020) Gelli, V., Salvadori, S., Pallottini, A., & Ferrara, A. 2020, MNRAS, 498, 4134, doi: 10.1093/mnras/staa2410
- Gnedin (2000) Gnedin, N. Y. 2000, ApJ, 542, 535, doi: 10.1086/317042
- Grassi et al. (2014) Grassi, T., Bovino, S., Schleicher, D. R. G., et al. 2014, MNRAS, 439, 2386, doi: 10.1093/mnras/stu114
- Hahn & Abel (2011) Hahn, O., & Abel, T. 2011, MNRAS, 415, 2101, doi: 10.1111/j.1365-2966.2011.18820.x
- Houston et al. (2023) Houston, T., Croton, D. J., & Sinha, M. 2023, MNRAS, doi: 10.1093/mnrasl/slad031
- Johnson et al. (2021) Johnson, B. D., Leja, J., Conroy, C., & Speagle, J. S. 2021, ApJS, 254, 22, doi: 10.3847/1538-4365/abef67
- Johnson et al. (2007) Johnson, J. L., Greif, T. H., & Bromm, V. 2007, ApJ, 665, 85, doi: 10.1086/519212
- Kennicutt (1998) Kennicutt, Robert C., J. 1998, ApJ, 498, 541, doi: 10.1086/305588
- Kohandel et al. (2019) Kohandel, M., Pallottini, A., Ferrara, A., et al. 2019, MNRAS, 487, 3007, doi: 10.1093/mnras/stz1486
- Kroupa (2001) Kroupa, P. 2001, MNRAS, 322, 231, doi: 10.1046/j.1365-8711.2001.04022.x
- Krumholz et al. (2009) Krumholz, M. R., McKee, C. F., & Tumlinson, J. 2009, ApJ, 693, 216, doi: 10.1088/0004-637X/693/1/216
- Laporte et al. (2017) Laporte, N., Ellis, R. S., Boone, F., et al. 2017, ApJL, 837, L21, doi: 10.3847/2041-8213/aa62aa
- Leitherer et al. (1999) Leitherer, C., Schaerer, D., Goldader, J. D., et al. 1999, ApJS, 123, 3, doi: 10.1086/313233
- Looser et al. (2023) Looser, T. J., D’Eugenio, F., Maiolino, R., et al. 2023, arXiv e-prints, arXiv:2302.14155. https://arxiv.org/abs/2302.14155
- Mac Low & Ferrara (1999) Mac Low, M.-M., & Ferrara, A. 1999, ApJ, 513, 142, doi: 10.1086/306832
- Maiolino et al. (2023) Maiolino, R., Scholtz, J., Witstok, J., et al. 2023, arXiv e-prints, arXiv:2305.12492, doi: 10.48550/arXiv.2305.12492
- Mayer et al. (2006) Mayer, L., Mastropietro, C., Wadsley, J., Stadel, J., & Moore, B. 2006, MNRAS, 369, 1021, doi: 10.1111/j.1365-2966.2006.10403.x
- Pallottini et al. (2017a) Pallottini, A., Ferrara, A., Bovino, S., et al. 2017a, MNRAS, 471, 4128, doi: 10.1093/mnras/stx1792
- Pallottini et al. (2014) Pallottini, A., Ferrara, A., Gallerani, S., Salvadori, S., & D’Odorico, V. 2014, MNRAS, 440, 2498, doi: 10.1093/mnras/stu451
- Pallottini et al. (2017b) Pallottini, A., Ferrara, A., Gallerani, S., et al. 2017b, MNRAS, 465, 2540, doi: 10.1093/mnras/stw2847
- Pallottini et al. (2019) Pallottini, A., Ferrara, A., Decataldo, D., et al. 2019, MNRAS, 487, 1689, doi: 10.1093/mnras/stz1383
- Pallottini et al. (2022) Pallottini, A., Ferrara, A., Gallerani, S., et al. 2022, MNRAS, 513, 5621, doi: 10.1093/mnras/stac1281
- Pereira-Wilson et al. (2023) Pereira-Wilson, M., Navarro, J. F., Benítez-Llambay, A., & Santos-Santos, I. 2023, MNRAS, 519, 1425, doi: 10.1093/mnras/stac3633
- Pérez-González et al. (2022) Pérez-González, P. G., Barro, G., Annunziatella, M., et al. 2022, arXiv e-prints, arXiv:2211.00045, doi: 10.48550/arXiv.2211.00045
- Planck Collaboration et al. (2014) Planck Collaboration, Ade, P. A. R., Aghanim, N., et al. 2014, A&A, 571, A16, doi: 10.1051/0004-6361/201321591
- Rosdahl et al. (2013) Rosdahl, J., Blaizot, J., Aubert, D., Stranex, T., & Teyssier, R. 2013, MNRAS, 436, 2188, doi: 10.1093/mnras/stt1722
- Rosdahl et al. (2017) Rosdahl, J., Schaye, J., Dubois, Y., Kimm, T., & Teyssier, R. 2017, MNRAS, 466, 11, doi: 10.1093/mnras/stw3034
- Salvadori et al. (2008) Salvadori, S., Ferrara, A., & Schneider, R. 2008, MNRAS, 386, 348, doi: 10.1111/j.1365-2966.2008.13035.x
- Sobacchi & Mesinger (2013) Sobacchi, E., & Mesinger, A. 2013, MNRAS, 432, 3340, doi: 10.1093/mnras/stt693
- Strait et al. (2023) Strait, V., Brammer, G., Muzzin, A., et al. 2023, arXiv e-prints, arXiv:2303.11349. https://arxiv.org/abs/2303.11349
- Teyssier (2002) Teyssier, R. 2002, A&A, 385, 337, doi: 10.1051/0004-6361:20011817
- Vallini et al. (2018) Vallini, L., Pallottini, A., Ferrara, A., et al. 2018, MNRAS, 473, 271, doi: 10.1093/mnras/stx2376
- Weingartner & Draine (2001) Weingartner, J. C., & Draine, B. T. 2001, ApJ, 548, 296, doi: 10.1086/318651
- Wise et al. (2012) Wise, J. H., Abel, T., Turk, M. J., Norman, M. L., & Smith, B. D. 2012, MNRAS, 427, 311, doi: 10.1111/j.1365-2966.2012.21809.x
- Ziparo et al. (2023) Ziparo, F., Ferrara, A., Sommovigo, L., & Kohandel, M. 2023, MNRAS, 520, 2445, doi: 10.1093/mnras/stad125