Dataset for predicting cybersickness from a virtual navigation task
Abstract
This work presents a dataset collected to predict cybersickness in virtual reality environments. The data was collected from navigation tasks in a virtual environment designed to induce cybersickness. The dataset consists of many data points collected from diverse participants, including physiological responses (EDA and Heart Rate) and self-reported cybersickness symptoms. The paper will provide a detailed description of the dataset, including the arranged navigation task, the data collection procedures, and the data format. The dataset will serve as a valuable resource for researchers to develop and evaluate predictive models for cybersickness and will facilitate more research in cybersickness mitigation.
I Introduction
Cybersickness, also known as virtual reality sickness or simulator sickness, is a phenomenon where a person experiences symptoms similar to motion sickness after being exposed to virtual reality environments. The symptoms can include dizziness, headache, nausea, sweating, etc.. Cybersickness occurs when the visual and vestibular systems in the brain receive conflicting information about self-motion, leading to a sensory conflict [1]. This sensory conflict can cause discomfort and lead to the symptoms associated with cybersickness.
In recent years, there has been a growing interest in predicting cybersickness in virtual reality applications based on data mining technologies. Using datasets in this context allows researchers to analyze large amounts of data to identify patterns and correlations that may not be immediately apparent. This information can then advise the design of virtual reality environments that are less likely to induce cybersickness.
One area of research that has made effective use of datasets for predicting cybersickness is the use of artificial intelligence (AI) methods. AI algorithms can process and analyze large amounts of data to identify patterns and correlations that may not be immediately apparent. For example, in the context of cybersickness, AI methods can be used to analyze physiological responses, such as heart rate and skin conductance, to identify correlations with the presence and severity of cybersickness. one study that used AI methods for predicting cybersickness was conducted by Kim et al. (2019) [2]. In this study, the authors used a deep learning algorithm to analyze data from the Simulator Sickness Questionnaire (SSQ) [3] and identify correlations between user behavior and the presence and severity of cybersickness. The results suggested that the deep learning algorithm could accurately predict the presence of cybersickness, with an accuracy rate of over 85%.
The use of datasets for predicting cybersickness is necessary because it allows researchers to analyze and identify factors that contribute to the development of cybersickness. By collecting data on user behavior and physiological responses, researchers can determine the occurrence of cybersickness and the severity of its symptoms. This information can then guide the design of virtual reality environments and interaction techniques that can mitigate cybersickness. Additionally, data analysis can help researchers understand the underlying mechanisms of cybersickness, which can help develop more effective treatments and preventions.
II Dataset collection
Fifty-three participants from the local city were recruited for a navigation task in a virtual reality environment. The participants had an average age of 26.3 years (SD = 3.3) with 26 of them being female. In order to gather more data, each participant was asked to participate three times over three separate days, resulting in a total of 159 samples. After completing the task, the participants were given various gifts as a token of appreciation. Before the experiment, they were required to fill out a pre-exposure questionnaire to assess their health status and experience with playing games and using VR devices. No health issues that could affect the experiment outcomes were reported through this questionnaire. All participants also signed a consent form prior to participating in the experiment.
-
1.
Prior to the test, the participants were given a brief explanation on how to manipulate navigation using the hand controllers of the HTC Vive Pro. In the event of cybersickness, they had the option to discontinue the experiment if they experienced discomfort or nausea.
-
2.
The experimenter equipped the participants with an HTC Vive Pro headset and an Empatica E4 wristband for one participant. The Empatica E4 was capable of collecting Electrodermal Activity (EDA) data at a rate of Hz, which was transmitted wirelessly to a computer for processing via Bluetooth.
-
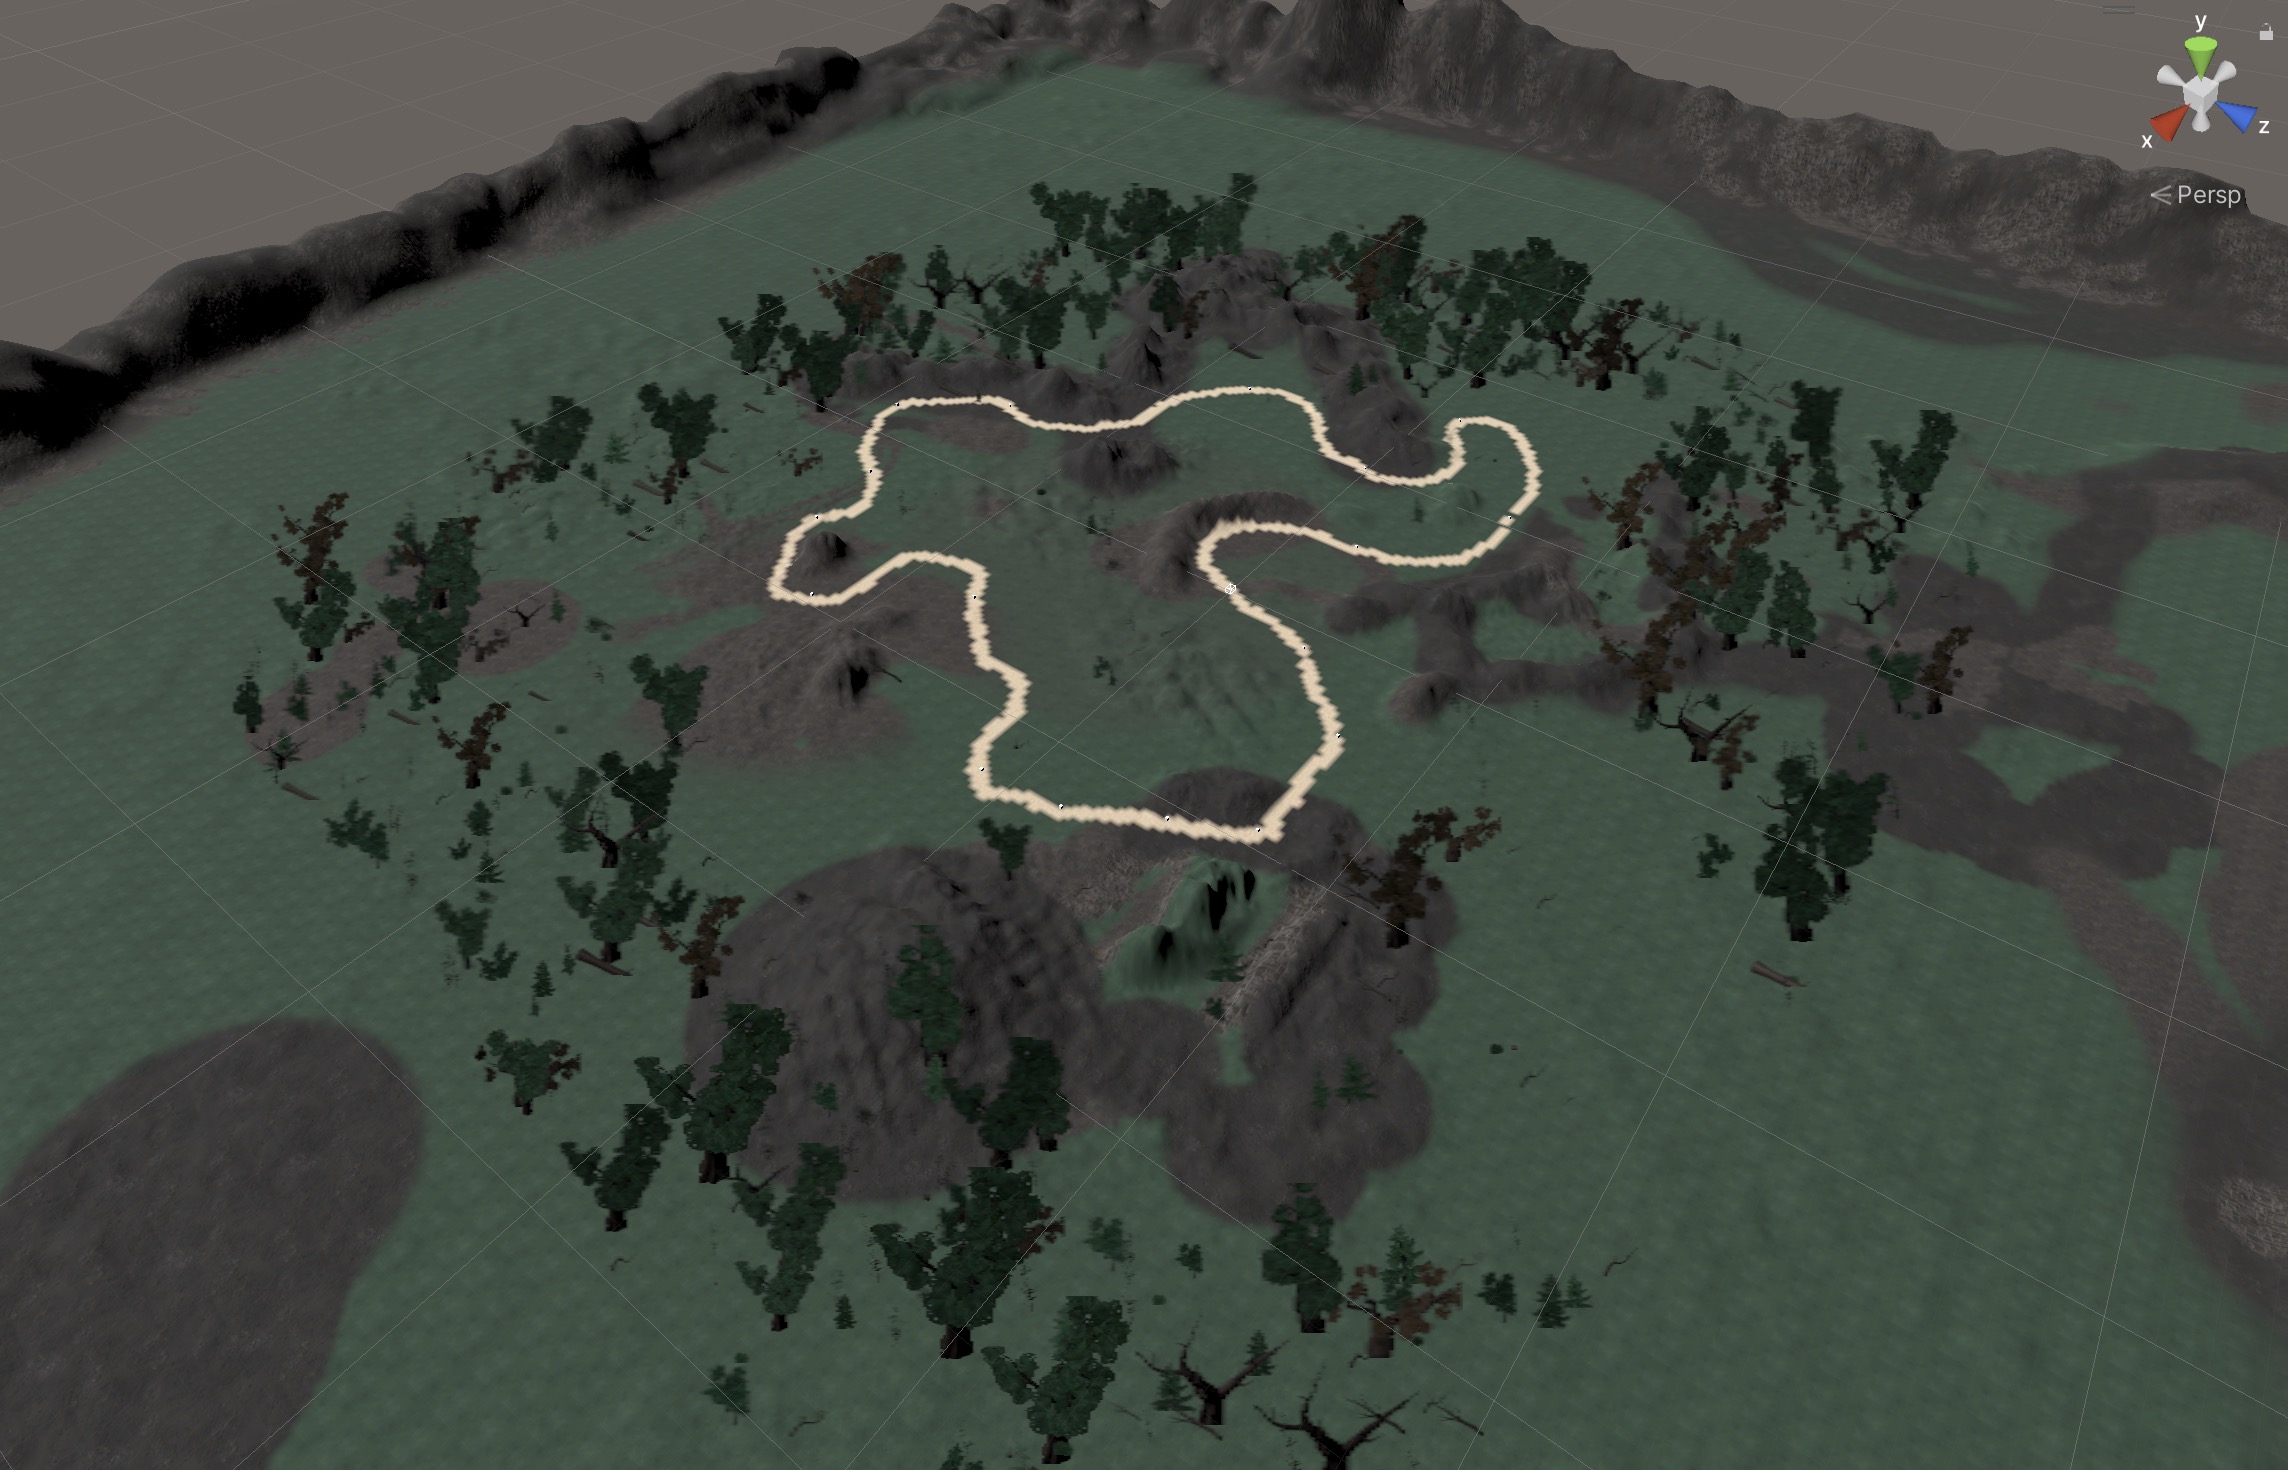
3.
The participants were then immersed in the virtual environment shown in Figure 3 and began navigating along the trajectory indicated in brown. Navigation could be controlled in different directions through the touchpad on the HTC Vive Pro hand controller. Both the EDA signal and the longitudinal and rotational acceleration data were recorded simultaneously during navigation.
-
4.
The navigation task lasted for four minutes and upon completion, the participants were removed from the head-mounted display.
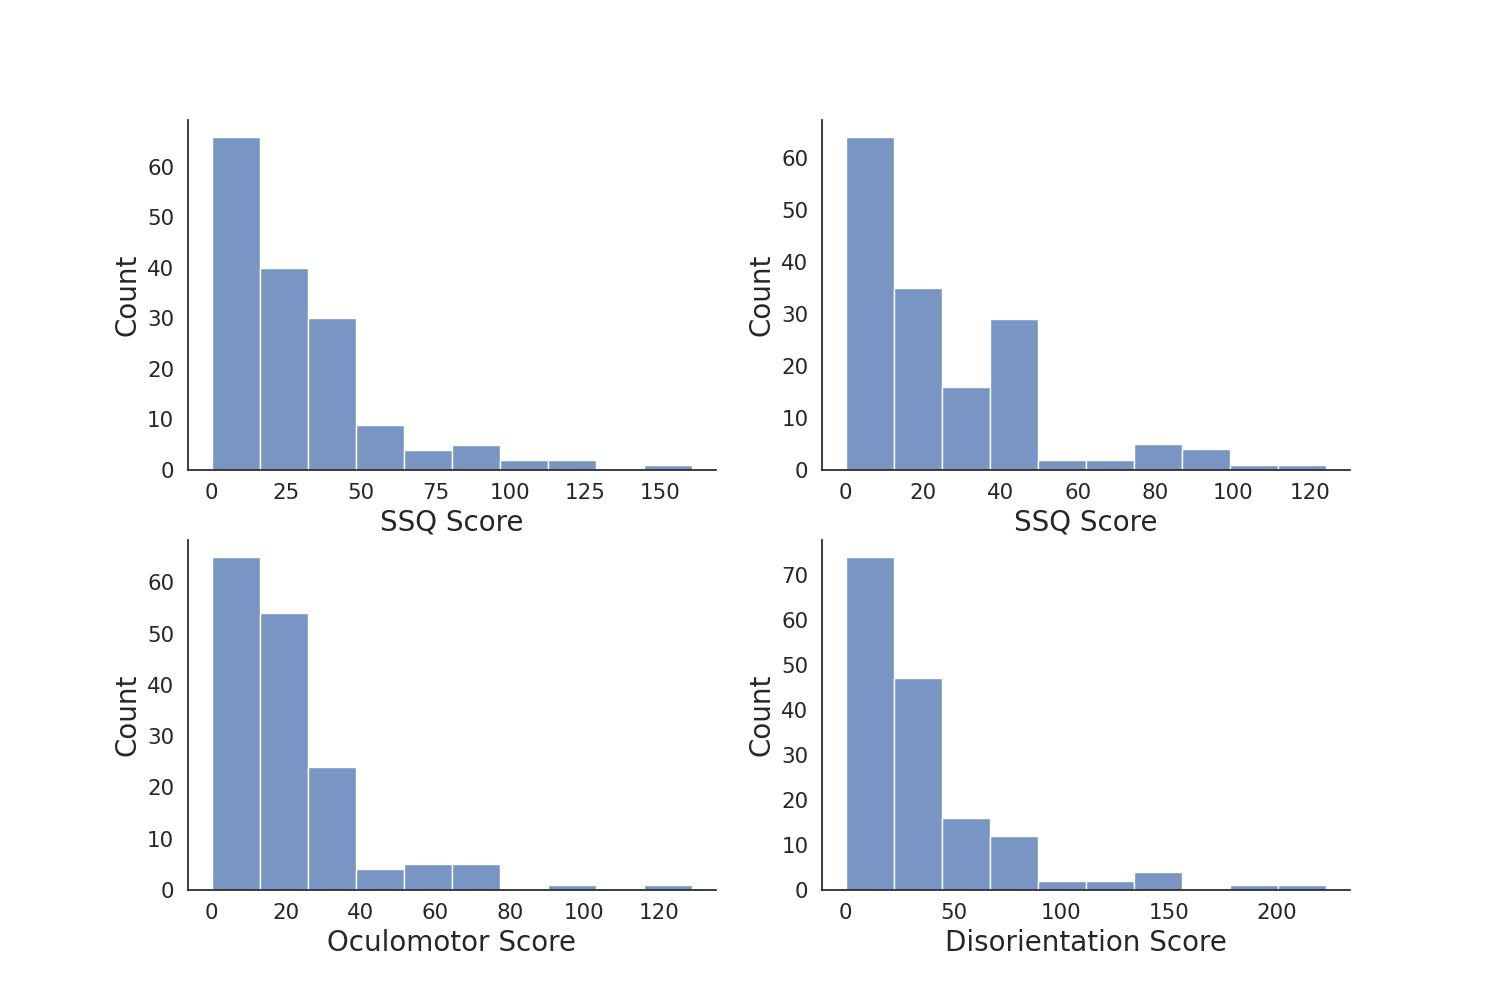
Additionally, the Simulator Sickness Questionnaire (SSQ) was used to evaluate the participants’ symptoms of cybersickness by measuring three categories (nausea, oculomotor, and disorientation) through 16 questions. Participants filled out the SSQ both before and after the VR task to assess its psychological impact on them. The change in the score from the pre-exposure to the post-exposure was recorded and included in the data collection as the SSQ score:
| (1) |
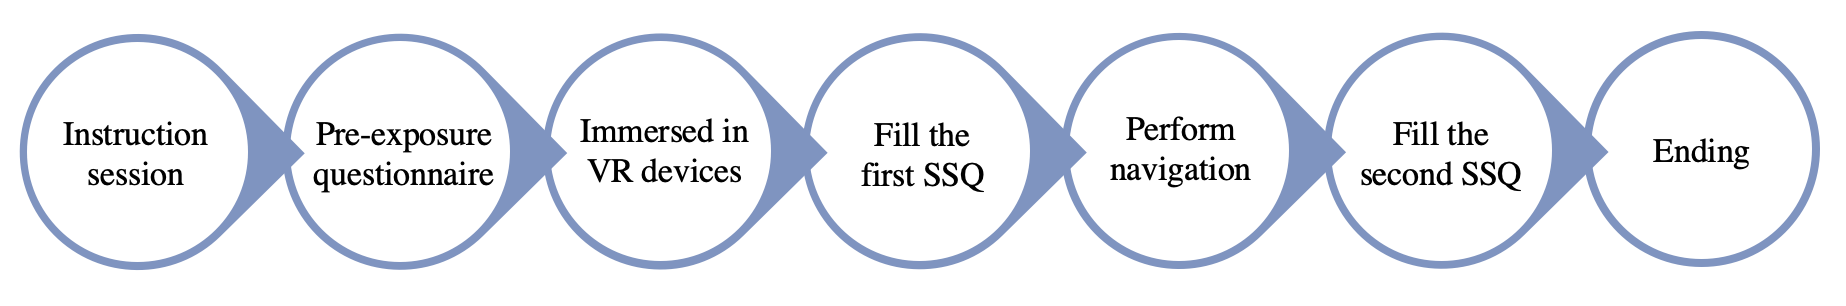
Figure 2 illustrates the general experimental process.
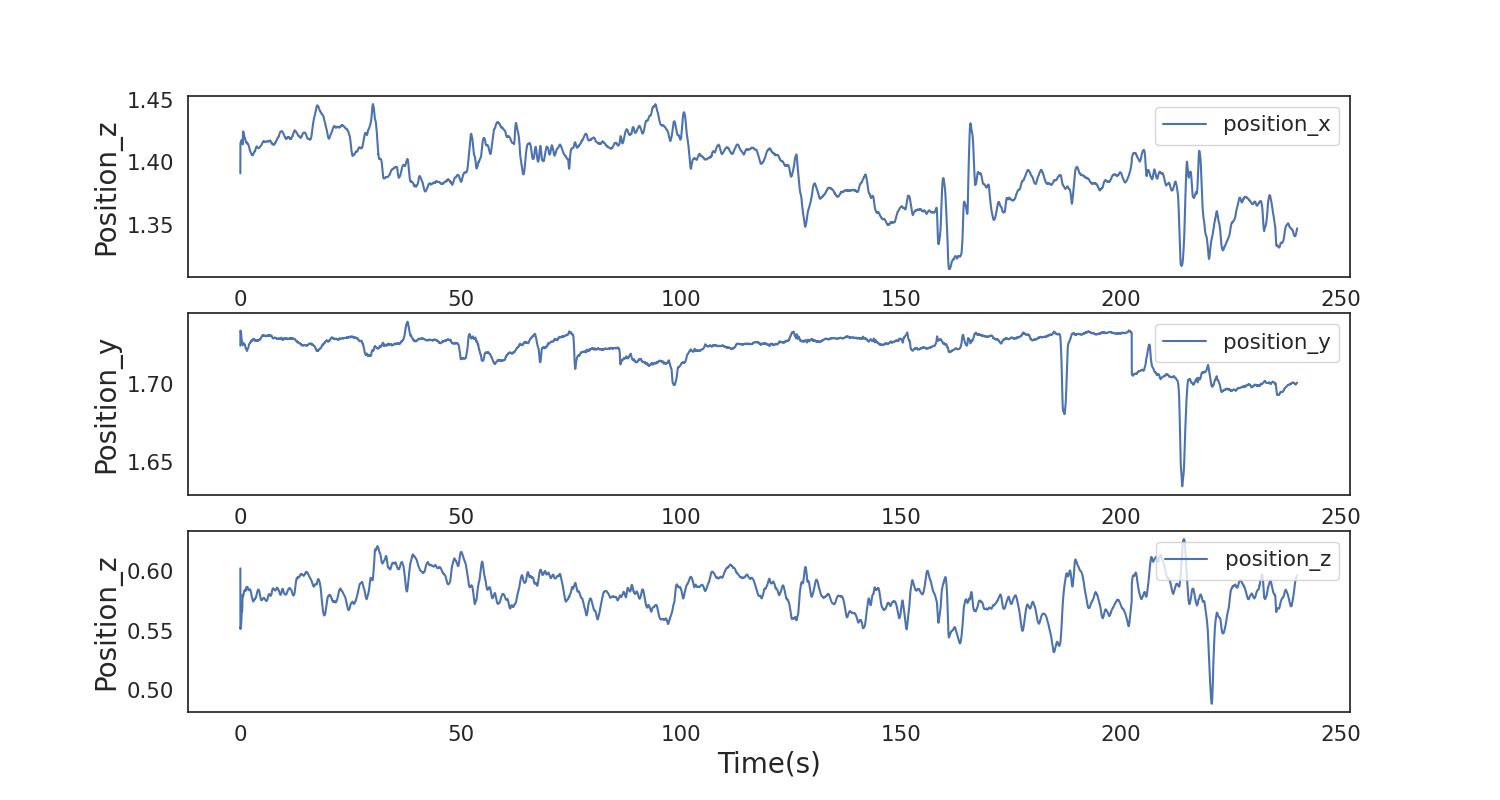
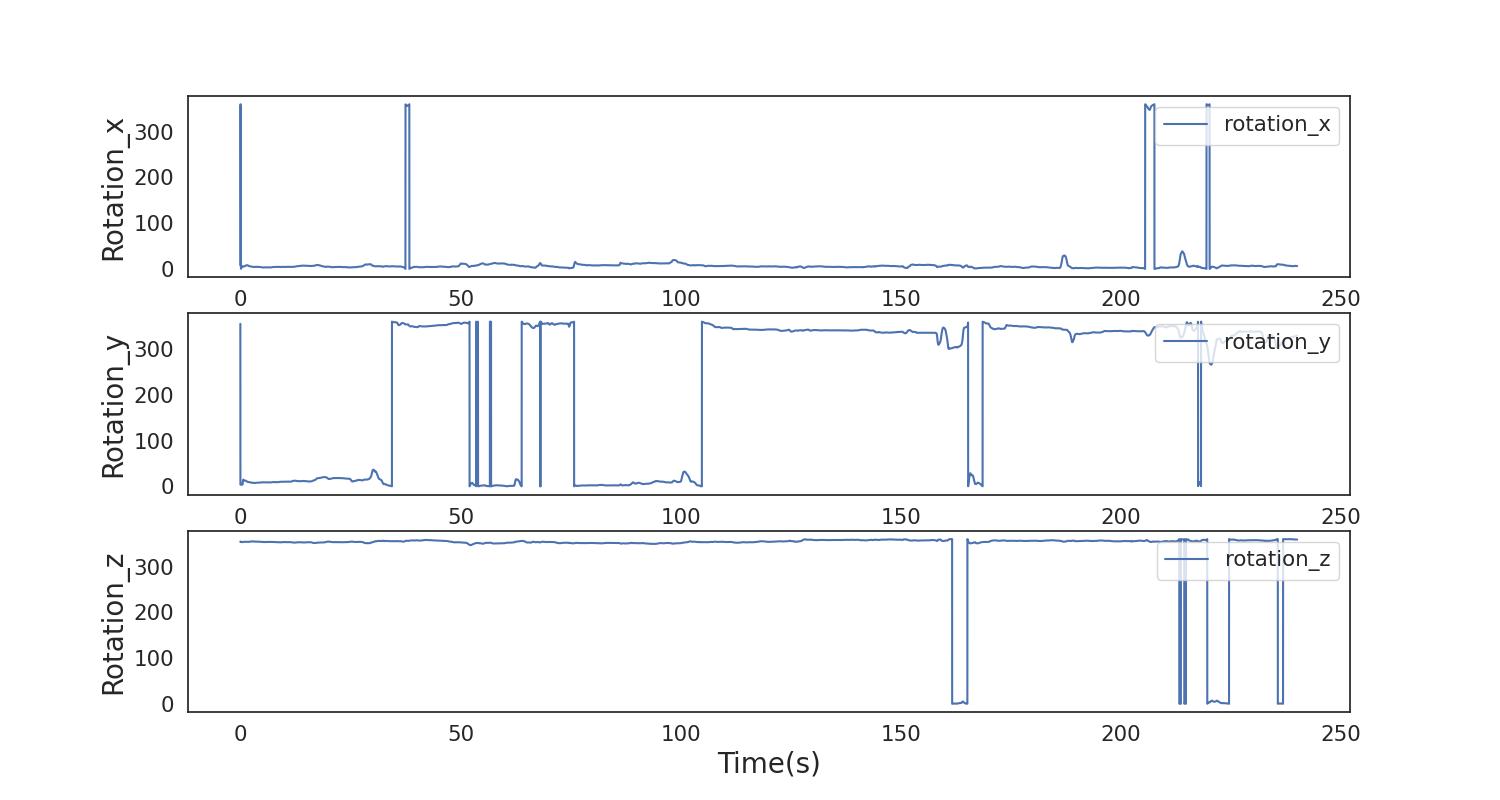
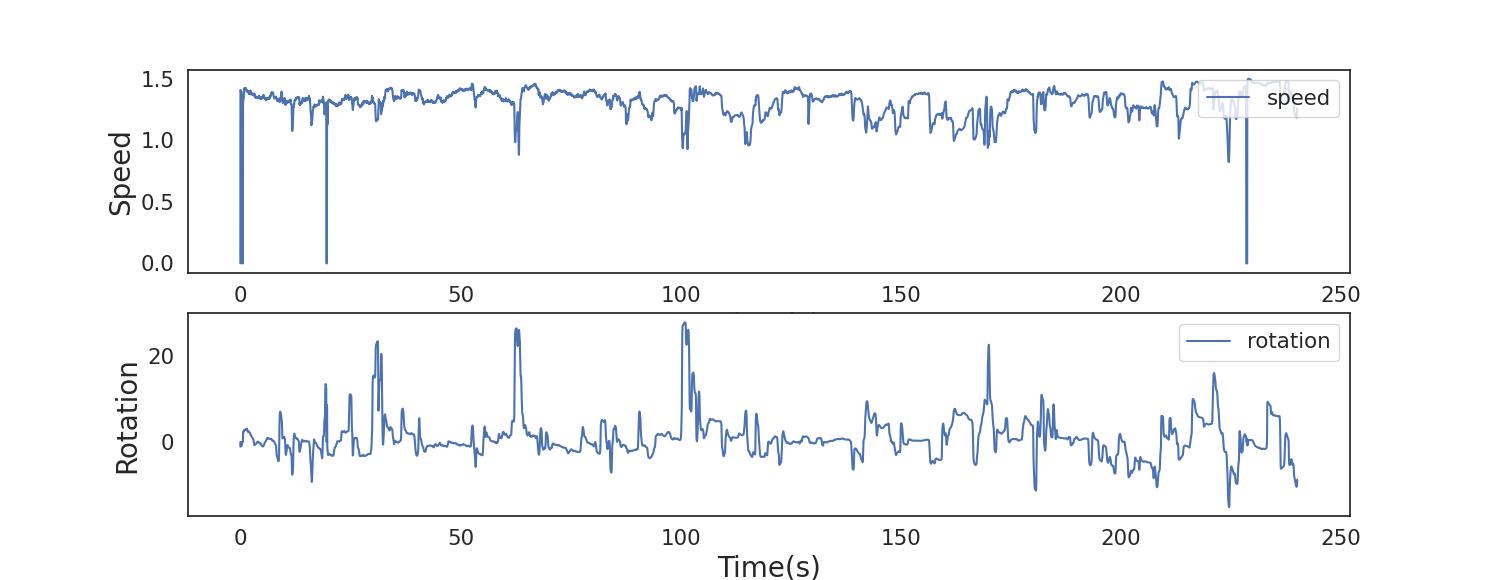
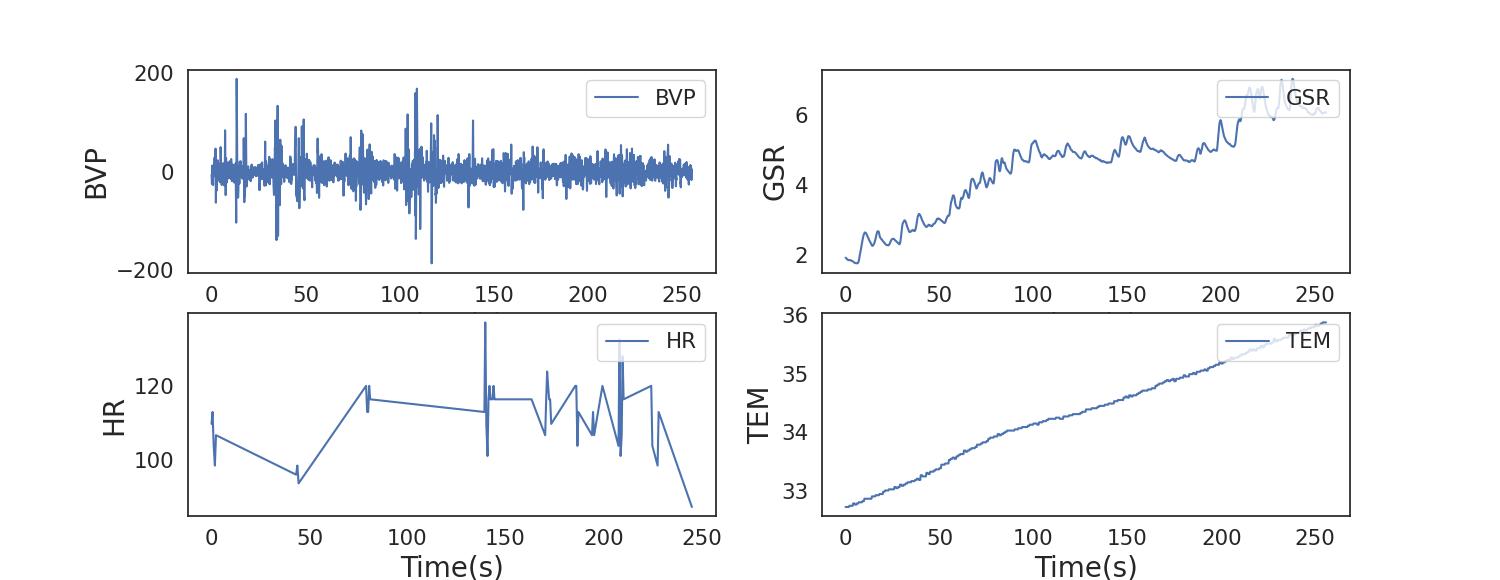
Table I presents the list of data collected from one experiment. The data collected can be categorized into four different types: Head-Tracking, Locomation, Biosignal, and Cybersickness. Head-Tracking includes raw and resampled head position, head rotation, and raw and resampled speed. Locomation consists of raw speed, resampled speed, raw rotation, and resampled rotation. Biosignal includes Galvanic Skin Response at a frequency of Hz, Blood Volume Pulse at Hz, Temperature at Hz, and Heart Rate. Cybersickness includes the Simulator Sickness Questionnaire Score, Nausea Score, Oculomotor Score, and Disorientation Score. These data will provide valuable information to study the impact of immersive environments on physiological and psychological responses. Figure 1 depicts the SSQ distribution and the sequential data collected from one experiment. The full dataset is published a github repository111https://github.com/coreturn/CybersicknessDataset, which has been used in two publications for predicting cybersickness with different inputs [4, 5].
| Data Type | Data | ||||
|---|---|---|---|---|---|
| Head-Tracking Data |
|
||||
| Motion Data |
|
||||
| Biosignal Data |
|
||||
| Cybersickness Data |
|
III Dataset Summary and usage
The use of datasets for predicting cybersickness has been a valuable tool for researchers in the virtual reality community. By analyzing large amounts of data, researchers have identified correlations between physiological responses and the presence and severity of cybersickness. This work presents preliminary results from the dataset analysis, which suggest that the dataset is a rich and valuable resource for predicting cybersickness.
References
- [1] J. T. Reason and J. J. Brand, Motion sickness. Academic press, 1975.
- [2] J. Kim, W. Kim, H. Oh, S. Lee, and S. Lee, “A Deep Cybersickness Predictor Based on Brain Signal Analysis for Virtual Reality Contents,” in 2019 IEEE/CVF International Conference on Computer Vision (ICCV). Seoul, Korea (South): IEEE, Oct. 2019, pp. 10 579–10 588.
- [3] R. S. Kennedy, N. E. Lane, K. S. Berbaum, and M. G. Lilienthal, “Simulator sickness questionnaire: An enhanced method for quantifying simulator sickness,” The international journal of aviation psychology, vol. 3, no. 3, pp. 203–220, 1993.
- [4] Y. Wang, J.-R. Chardonnet, F. Merienne, and J. Ovtcharova, “Using Fuzzy Logic to Involve Individual Differences for Predicting Cybersickness during VR Navigation,” in 2021 IEEE Virtual Reality and 3D User Interfaces (VR). Lisboa, Portugal: IEEE, Mar. 2021, pp. 373–381. [Online]. Available: https://ieeexplore.ieee.org/document/9417785/
- [5] A. Hadadi, C. Guillet, J.-R. Chardonnet, M. Langovoy, Y. Wang, and J. Ovtcharova, “Prediction of cybersickness in virtual environments using topological data analysis and machine learning,” Frontiers in Virtual Reality, vol. 3, p. 973236, Oct. 2022. [Online]. Available: https://www.frontiersin.org/articles/10.3389/frvir.2022.973236/full