Human Behavior in the Time of COVID-19: Learning from Big Data
Abstract
Since the World Health Organization (WHO) characterized COVID-19 as a pandemic in March 2020, there have been over 600 million confirmed cases of COVID-19 and more than six million deaths as of October 2022. The relationship between the COVID-19 pandemic and human behavior is complicated. On one hand, human behavior is found to shape the spread of the disease. On the other hand, the pandemic has impacted and even changed human behavior in almost every aspect. To provide a holistic understanding of the complex interplay between human behavior and the COVID-19 pandemic, researchers have been employing big data techniques such as natural language processing, computer vision, audio signal processing, frequent pattern mining, and machine learning. In this study, we present an overview of the existing studies on using big data techniques to study human behavior in the time of the COVID-19 pandemic. In particular, we categorize these studies into three groups - using big data to measure, model, and leverage human behavior, respectively. The related tasks, data, and methods are summarized accordingly. To provide more insights into how to fight the COVID-19 pandemic and future global catastrophes, we further discuss challenges and potential opportunities.
As of October 2022, the COVID-19 pandemic has caused more than 600 million confirmed cases and more than six million deaths all over the world,111https://covid19.who.int/ bringing unprecedented damage and changes to the human society (Singh and Singh 2020; Verma and Prakash 2020; Maital and Barzani 2020). Meanwhile, human behavior such as mobility, and non-pharmaceutical interventions (NPI) also affect the development of the pandemic (Chang et al. 2021; Hirata et al. 2022). Therefore, to fight against the COVID-19 pandemic, not only knowing the virus itself is important, it is also critical to better understand the interplay between human behavior and COVID-19.
Despite the damage and negative impact, the COVID-19 pandemic also indirectly accelerates the adoption of digital tools across various fields globally such as medicine, clinical research, epidemiology, education, and management science (Gabryelczyk 2020; Xu et al. 2021), which provides a distinctive opportunity to study human behavior through the lens of big data techniques.
Several prior surveys have been conducted on the topic of using big data applications to combat the COVID-19 pandemic. Bragazzi et al. (2020) discussed the potential applications of artificial intelligence and big data techniques of different time scales from short-term such as outbreak identification to long-term such as smart city design to manage the pandemic. Haleem et al. (2020) summarized eight applications of big data in the COVID-19 pandemic. Alsunaidi et al. (2021) highlighted several domains that manage and control the pandemic on the basis of big data analysis. However, they did not delve into the discussion about using big data techniques to learn human behavior in the context of COVID-19.
There have been some surveys that investigate both big data and human behavior. They mostly focus on specific topics such as social media and misinformation (Greenspan and Loftus 2021; Huang et al. 2022), technologies and their effects on humans (Vargo et al. 2021; Agbehadji et al. 2020; Haafza et al. 2021), social and behavioral science (Xu et al. 2021; Sheng et al. 2021). These surveys have presented an important overview of each independent research topic within the human behavior domain. However, it is also critical to understand big data and human behavior holistically. Therefore, we aim to present a review of how big data technologies can be used to learn human behavior in the context of the COVID-19 pandemic in a larger scope compared to previous surveys.
We use Google Scholar, PubMed, and Scopus to search for related papers that were published between 2020 and 2022. Keywords include “COVID-19”, “human behavior”, “big data”, “deep learning”, “machine learning”, and “artificial intelligence”. Surveys, comments, and studies that do not use any specific big data techniques are excluded. After reviewing the related tasks, data, and methods of these papers, we categorize them into three groups based on how these big data techniques are used to study human behavior. Specifically, we include studies that use big data techniques to measure, model, and leverage human behavior.
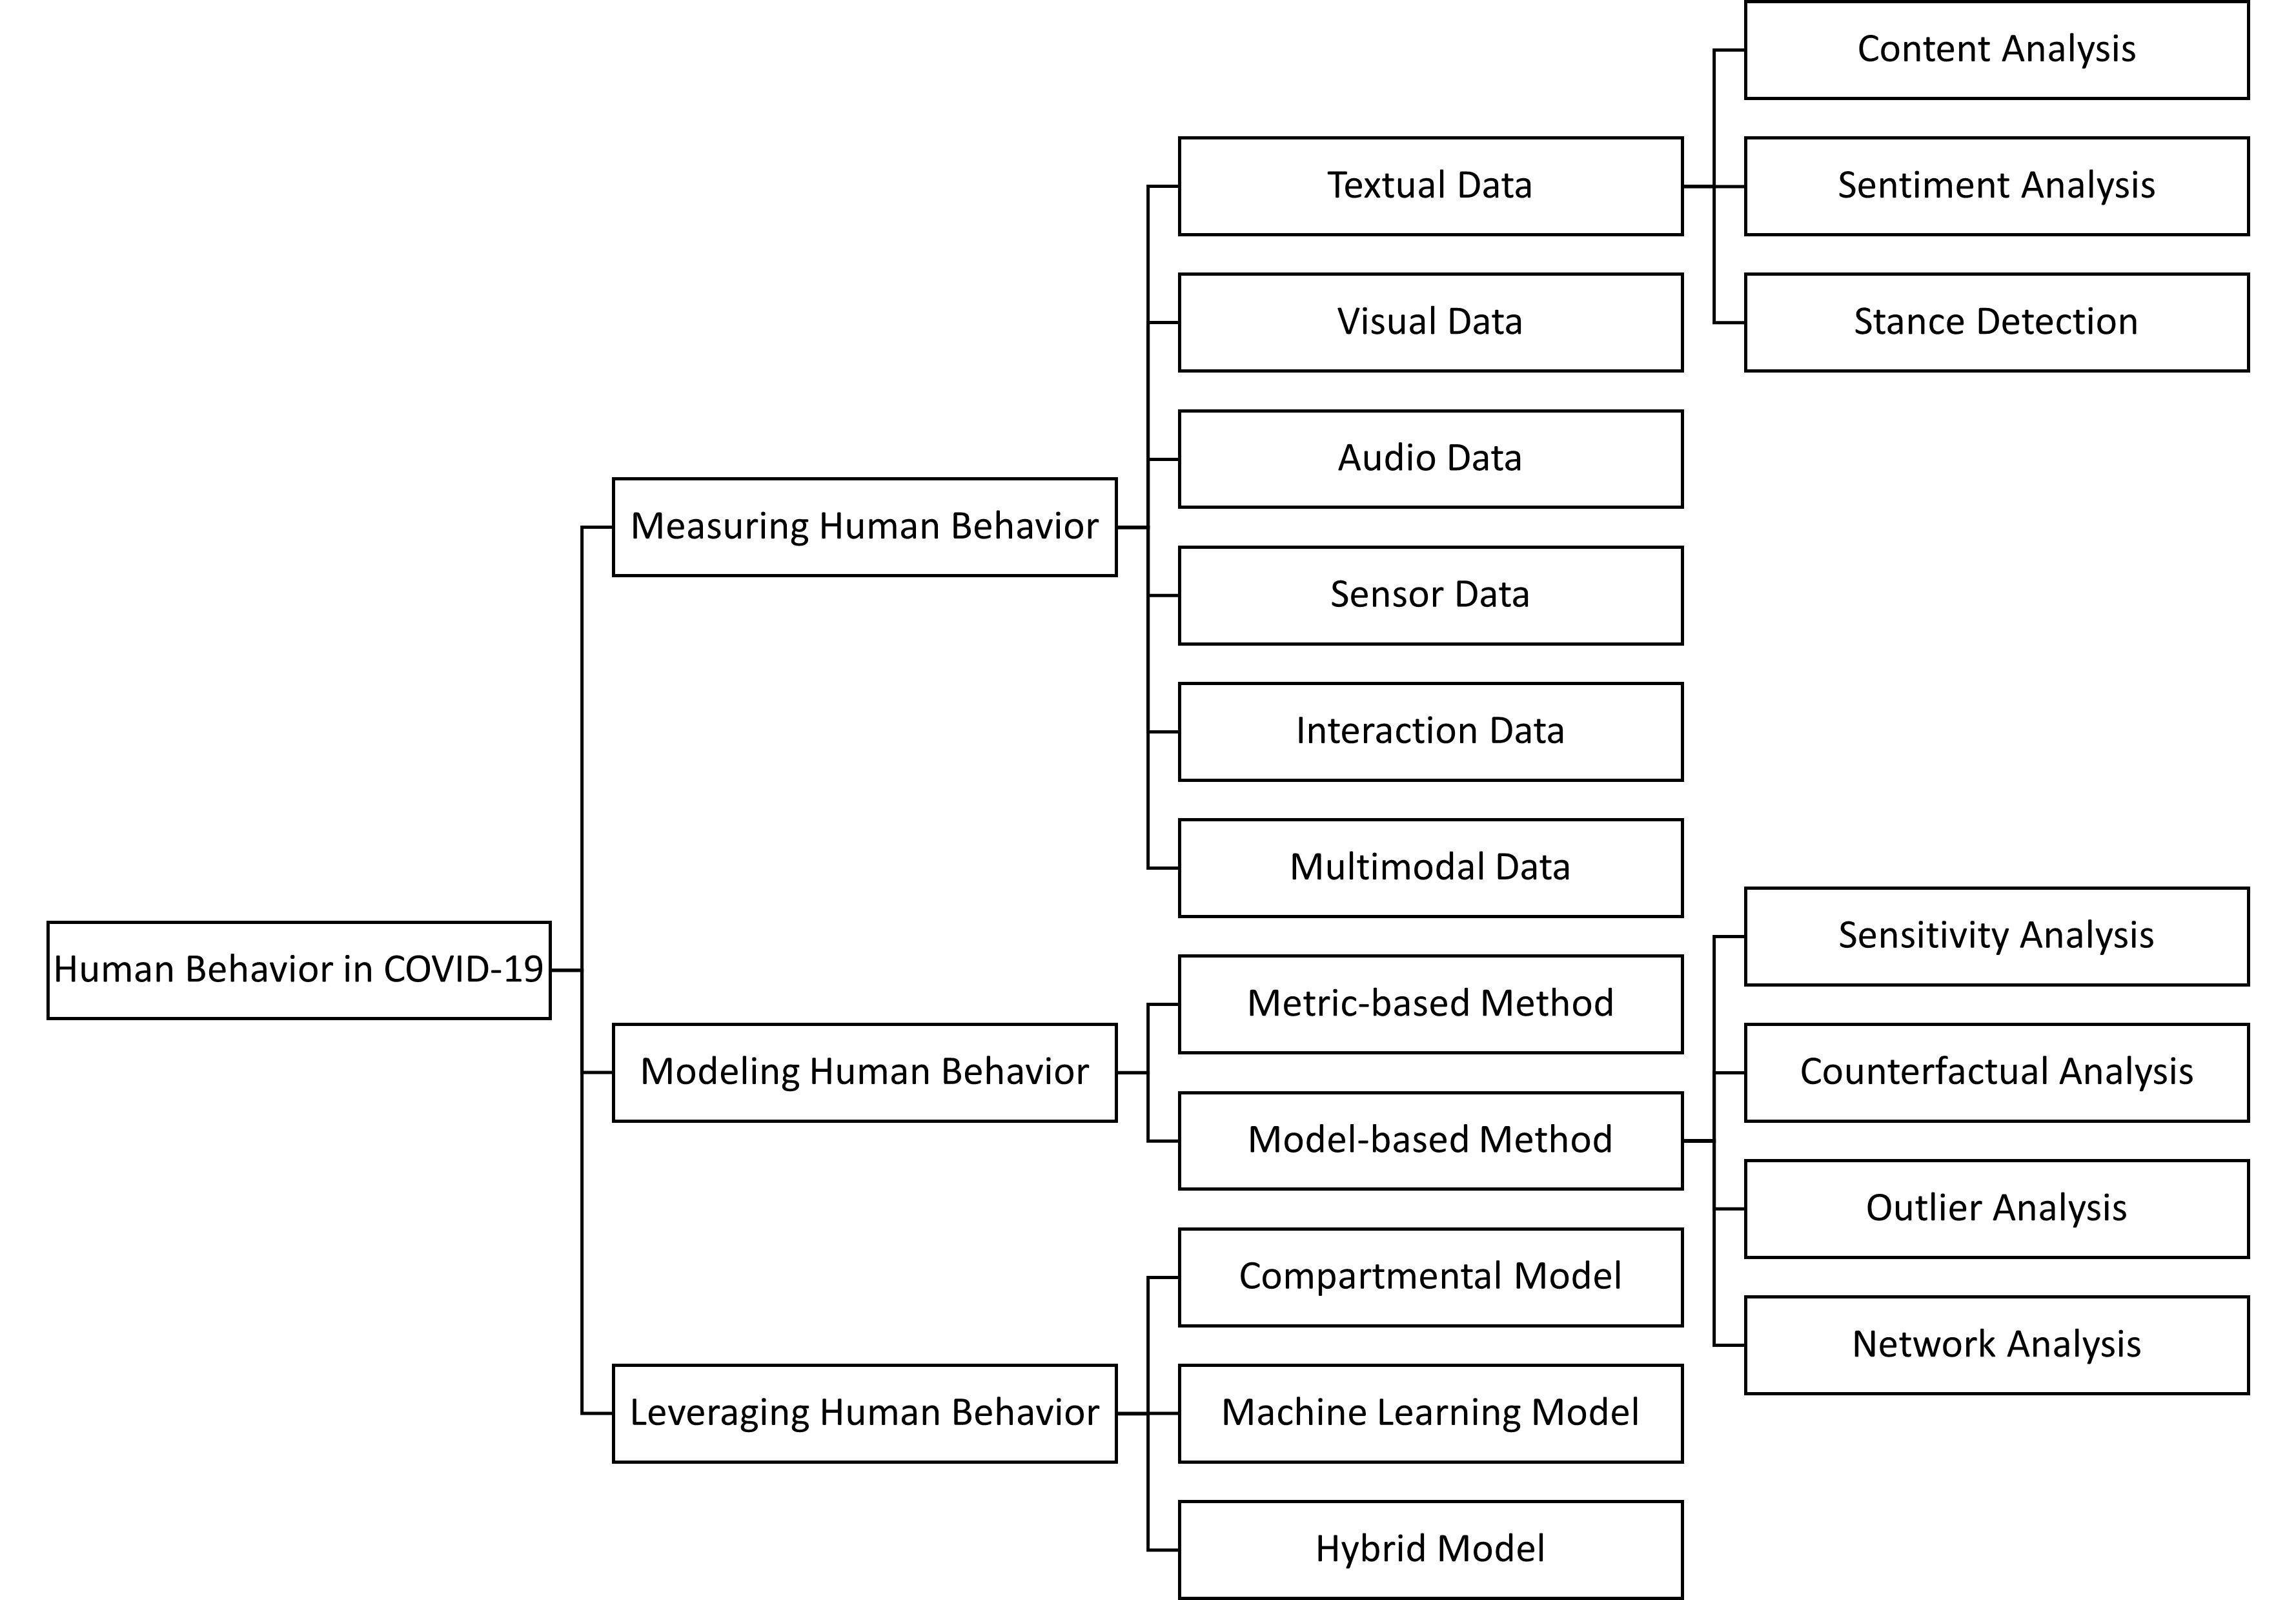
The remainder of the survey is organized as follows: In Section 2, we discuss how big data techniques can be used to measure human behavior with respect to various data types (e.g., textual, visual, audio). In Section 3, we illustrate two types of methods including the metric-based and the model-based that can be used to model human behavior. In Section 4, we introduce three lines of models including compartmental models, machine learning models, and hybrid models that have been heavily used to leverage human behavior in the context of COVID-19. For each category (i.e., measure/model/leverage), we summarize the related tasks, data, and methods accordingly (Figure 1), and provide detailed discussions about related challenges and potential opportunities. Finally, we discuss other challenges and open questions in Section 5, and conclude our study in Section 6.
Using Big Data to Measure Human Behavior in COVID-19
Unlike conventional methods that measure human behavior via questionnaires, with the increasing usage of digital technologies, measuring human behavior from raw data such as video and text has been widely used during the COVID-19 pandemic. Using big data to measure human behavior intends to mine interesting patterns from raw data that records human behavior with big data techniques. The goal is to map the raw data which is often unstructured to measurements that quantitatively describe human behavior. We primarily, but not exclusively, discuss six groups of studies based on the data types including textual, visual, audio, sensor, interaction, and multimodal.
Textual Data
For textual data, researchers focus on the content that is generated when people use the Internet to measure human behavior. It can be the queries people use to search for health-related information, and the posts people write on social platforms. During the pandemic, people have been found to increase their social media use for multiple reasons such as seeking social support (Rosen et al. 2022), expressing opinions (Lyu et al. 2022; Tahir et al. 2022; Wu, Lyu, and Luo 2021), and obtaining health information (Tsao et al. 2021; Rabiolo et al. 2021). The main format of social media posts is textual data. The growing amount of online textual data presents a channel to passively observe human behavior more efficiently at a large scale. In this section, we discuss three analysis frameworks that can be used to measure human behavior from textual data including content analysis, sentiment analysis, and stance detection. Note that although we focus on the studies that use these three frameworks on textual data since textual data is predominant, these frameworks can also be applied to other data types such as visual data.
Content Analysis
Content analysis includes “any technique for making inferences by objectively and systematically identifying specified characteristics of message” (Holsti 1969). During the pandemic, it is primarily applied to online discourse to capture topics and measure people’s opinions toward the disease, public policies, and societal changes.
For instance, Evers, Greenfield, and Evers (2021) extracted and compared the word frequencies in four Internet forums 70 days before and 70 days after the date Former US President Trump declared a national emergency. Word frequencies were used to measure search interest. Words that are relevant to the Theory of Social Change, Cultural Evolution, and Human Development, and have a relatively narrow range of meanings were included. Across four forums, they found that words or phrases that are related to subjective mortality salience (e.g., “cemetery”, “survive”, “death”), engagement in subsistence activities (e.g., “farm”, “garden”, “cook”), and collectivism showed increases (e.g., “sacrifice”, “share”, “help”), suggesting that human may shift their behavior according to the level of death and availability of resources. Cao et al. (2021) leveraged Latent Dirichlet Allocation (LDA) (Blei, Ng, and Jordan 2003) to mine the various topics in the Sina Weibo posts that show attitudes toward the lockdown policy in Wuhan. LDA is a generative probabilistic model of a corpus. Cao et al. (2021) first used a Chinese word segmentation tool to segment sentences and removed stopwords. Next, they calculated the Term Frequency-Inverse Document Frequency (TF-IDF). Finally, an LDA model was applied and trained. The optimal number of topics was decided based on the perplexity of each topic. Eight topics were identified including (1) daily life under lockdown, (2) medical assistance, (3) traffic and travel restrictions, (4) epidemic prevention, (5) material supply security, (6) praying for safety, (7) unblock of Wuhan, and (8) quarantine and treatment. They found that people’s emotions changed due to different topics. They argued that with the development of the pandemic, emotions involving more uncertainty such as hope declined while emotions involving more certainty such as admiration and joy increased.
Sentiment Analysis
Sentiment analysis is to detect sentiment expressed in the content toward an entity (Medhat, Hassan, and Korashy 2014). Textual sentiment analysis is a well-studied classification task that intends to estimate whether the sentiment expressed in text is positive or negative. It has been leveraged in multiple applications including measuring the polarity of people’s opinion (Liu, Xia, and Lang 2021; Sanders et al. 2021; Yeung, Lai, and Luo 2020; Chen et al. 2021) and quantifying mental well-being (Zhang et al. 2021b; Aslam et al. 2020). There are two major ways to estimate the sentiment from text. One is lexicon-based, and the other is machine learning-based. Lexicon-based methods require a pre-labeled dictionary that maps each word to a polarity score indicating positive or negative, or other emotions. Barnes (2021) used LIWC (Linguistic Inquiry and Word Count) (Pennebaker, Francis, and Booth 2001) which captures the psychological states and sentiment from the text to detect terror states. In particular, they focused on anxiety, death, religion, reward, affiliation, and social processes. They compared the number of new cases and the number of tweets in which anxiety and death-related words were detected. They found that they evolved consistently. The other is machine learning-based methods which intend to learn a function to predict the sentiment of a piece of text. One important difference is that machine learning-based methods are more robust to estimate sentiment in different contexts (Jaidka et al. 2020). Choudrie et al. (2021) fine-tuned a pre-trained language model and applied it to over two million tweets from February to June 2020 in the context of COVID-19 to assess public sentiment toward various government management policies. They complemented the existing emotions that were archived by the research conducted before the pandemic (Jain, Kumar, and Fernandes 2017) with the emotions that are more pandemic-specific including anger, depression, enthusiasm, hate, relief, sadness, surprise, and worry. The accuracy and average Matthew correlation coefficient (MCC) (Chicco and Jurman 2020) of the sentiment classification are 0.80 and 0.78, respectively.
Stance Detection
Although sentiment analysis measures the sentiment toward an entity, it does not necessarily capture whether a person supports or disagrees with any opinions. A piece of text containing multiple positive sentiment-related words might be classified as positive by sentiment analysis tools. However, the person who posts it can still be opposed to the text’s view. Thus, stance analysis or stance detection is more suitable to tackle this problem. Stance detection is to classify the stance of the author (Küçük and Can 2020). One of the many applications of stance detection for COVID-19 is detecting public response to policies (e.g., NPIs) or major events. For instance, Tahir et al. (2022) combined online (i.e., tweets and user profile descriptions) and offline data (i.e., user demographics) to measure people’s vaccine stance. They designed a multi-layer perceptron with six layers that incorporates both the semantic features from tweets and user profile descriptions and one-hot representations of user demographics including state, race, and gender. The model was trained and evaluated using a dataset of 630,009 tweets with 69,028 anti-vaccine and 560,981 pro-vaccine. The opinion (i.e., pro-vaccine or anti-vaccine) was determined by hashtags including #NoVaccine, #VaccinesKill, #GetVaccinated, and #VaccinesWork. Lyu et al. (2022) adopted a human-guided machine learning framework to classify tweets into pro-vaccine, anti-vaccine, and vaccine-hesitant in an active learning manner. Out of the 2,000 initially labeled tweets, only 16 percent are relevant to opinions. To accelerate the annotation and model construction process, they then labeled tweets iteratively. In each iteration, the model was trained with all labeled data. Next, it ranked the rest of the unlabeled data and output tweets that were most likely relevant to opinions. Human annotators manually labeled these tweets and merged this newly labeled batch to the labeled corpus. In this way, the model and human worked together to actively search for relevant tweets, increasing the efficiency of the modeling process. They applied the trained model to the tweets of 10,945 unique Twitter users and found that opinion on the COVID-19 vaccine varies across people of different characteristics. More importantly, a more polarized opinion is observed among the socioeconomically disadvantaged group.
Stance detection is complex because it often requires extracting language patterns that are informative in terms of specific topics. However, labeling a brand new dataset from scratch is still time-consuming and expensive even with active learning. Miao, Last, and Litvak (2020) showed that a small amount of data for the task of interest can significantly improve the performance of models that are trained with existing datasets for stance detection. Therefore, to facilitate stance detection in the context of COVID-19, Glandt et al. (2021) annotated a COVID-19 stance detection dataset - COVID-19-Stance, that is composed of 6,133 tweets expressing people’s stance toward “Anthony S. Fauci, M.D.”. “Keeping Schools Closed”, “Stay at Home Orders”, and “Wearing a Face Mask”.
Visual Data
While computer vision techniques have been primarily adapted in healthcare, methods, especially object detection, have been applied to measuring human behavior (Ulhaq et al. 2020; Shorten, Khoshgoftaar, and Furht 2021). We discuss several object detection applications in the context of COVID-19 based on the scales of the objects.
We first discuss the applications of computer vision that consider faces from a near distance. To help conduct prevention advised by the health institutions during the COVID-19 pandemic, computer vision systems are designed to detect whether people properly wear masks, avoid touching their faces, and keep away from crowds. The goal of a face mask detection system is two-fold - detecting whether the person is wearing a face mask or not, and detecting if they are wearing the mask properly. Eyiokur, Ekenel, and Waibel (2022) collected and annotated a face dataset from the web, namely Interactive Systems Labs Unconstrained Face Mask Dataset (ISL-UFMD). ISL-UFMD contains 21,816 images with a great number of variations. Compared to previously proposed mask detection datasets (Cabani et al. 2021; Yang et al. 2021), there is a larger variety of subjects’ ethnicity, and image conditions such as environment, resolution, and head pose in ISL-UFMD. Eyiokur, Ekenel, and Waibel (2022) achieved an accuracy of 98.20% with Inception-v3 (Szegedy et al. 2016). They also implemented an Efficient-Net (Tan and Le 2019) model to detect face-hand interaction on the Interactive Systems Labs Unconstrained Face Hand Interaction Dataset (ISL-UFHD) and achieved an accuracy of 93.35%. Unlike the existing face-hand interaction dataset (Beyan et al. 2020) which is limited with respect to the number of subjects and the controlled data collection conditions, ISL-UFHD was collected from unconstrained real world scenes.
COVID-19 has also impacted the education system as in-person learning was transited into online learning to slow down the spread of the pandemic (Basilaia and Kvavadze 2020). Bower (2019) stated that there might be negative learning outcomes if students do not feel a sense of cognitive engagement through online learning. To tackle this problem, Bhardwaj et al. (2021) proposed a deep learning framework that measures students’ emotions in real-time such as anger, disgust, fear, happiness, sadness, and surprise. The “FER-2013” facial image dataset (Goodfellow et al. 2013) (consisting of 35,887 gray scaled images) and the Mean Engagement Score (MES) dataset were used. The MES dataset was collected and curated through a survey of 1,000 students over one week. A combination of the Haar-Cascade Classifier (Viola and Jones 2001) and a CNN classifier was used for engagement detection. The proposed method achieved an accuracy of 93.6% on engagement detection. Combined with emotion recognition, this system helps teachers assess students’ level of engagement during online classes.
Secondly, visual data has been recorded in urban settings - office spaces, campuses, busy streets, and so on to study the movement of people and whether they adhere to COVID-19 guidelines. Saponara, Elhanashi, and Gagliardi (2021) presented a real-time deep learning system that measures distances between people using state-of-the-art YOLO (Redmon et al. 2016) object detection model. The system is mainly composed of three steps. First, an object detector is applied to thermal images or video streams for people detection. The number of people is counted. Second, they compute the distance between the centroid of the bounding boxes containing people. Finally, adherence to social distancing guidelines is assessed based on the number of detected people and the distances. The model attained an accuracy of 95.6% on a dataset that consists of 775 thermal images of humans in various scenarios, and 94.5% on Teledyne FLIR dataset222https://www.flir.com/oem/adas/adas-dataset-form/ that consists of 800 IR images. More importantly, experimental results further showed that their proposed system handled more frames per second than R-CNN (Girshick et al. 2014) and Fast R-CNN (Ren et al. 2015), suggesting its applicability in real-time detection. Shorfuzzaman, Hossain, and Alhamid (2021) approached the problem with the vision of it being adaptable to surveillance cameras set up in smart cities. Their proposed methodology involves a perspective transformation of the image to a bird’s eye view prior to feeding it to the neural network. They adopted and evaluated object detection models - Faster R-CNN (Ren et al. 2015), YOLO (Redmon et al. 2016), and SSD (Liu et al. 2016) on the publicly available Oxford Town Center dataset (Benfold and Reid 2011) which contains videos of urban street setting with a resolution of sampled at 25 FPS. YOLO performs the best amongst the three models with an mAP and IoU of 0.847 and 0.906, respectively. The current implementation detects pedestrians in a region of interest using a fixed monocular camera and estimates the distance in real-time without recording data.
Last but not the least, satellite imagery has applications of providing overarching perspectives of activities from a larger scale. Minetto et al. (2021) proposed a methodology to study human and economic activity and support decision-making during the pandemic by extracting temporal information from satellite imagery using a lightweight ensemble of CNNs. The system trained on the xView (Lam et al. 2018) and fMoW (Christie et al. 2018) datasets achieved an mAP of 0.94 on identifying aeroplanes and 0.66 on identifying smaller vehicles. A sequence of images allows the model to keep track of these vehicles and extract temporal information about the location. The study provides observation of human activity during the stay-at-home order and economic activity carried out in North Korea, Russia, Germany, etc. Minetto et al. (2021) also compared images before and after the pandemic. For instance, their system automatically detected a decrease in the number of planes in activity at the Salt Lake City International Airport before and after the outbreak. The images captured in other places of interest such as supermarkets and toll booths indicated compliance with the stay-at-home orders.
Audio Data
The research community has been using speech and audio data to combat the COVID-19 pandemic through automatic recognition of COVID-19 and its symptoms such as breathing, coughing, and sneezing (Schuller et al. 2021). In our survey, we focus on the existing studies that use audio data to measure human behavior instead of diagnosis.
Videos and speeches are explored and analyzed to understand the sentiment and mental conditions during the pandemic. Social vloggers posted videos on social platforms to share their opinions and experiences during the quarantine. Feng et al. (2020) collected 4,265 YouTube videos to track vloggers’ emotions and their association with pandemic-related events. There are two major issues regarding the collected audio data. First, they may contain multiple speakers. Second, the non-speech segments are mostly noise and music background. To address these two issues, they manually labeled a 5-second reference audio of the target speaker of each video. Speaker diarization was then conducted by calculating the similarity between the reference audio and each target analysis window. The similarity metric was computed by a speaker verification model (Wan et al. 2018). The threshold for the similarity score was set to 0.65 and the window size was set to 125 milliseconds. Linear regression was leveraged to interpret emotions based on four prosodic features including loudness, zero-crossing rate, jitter, and shimmer. Stress levels and emotions were also measured via regression analysis based on speech samples collected over phone call conversations (König et al. 2021). Participants were asked to describe something emotionally neutral, negative, and positive. Each description should last about one minute. Complicated machine learning tools were used as well. Han et al. (2020) applied support vector machines (SVMs) to the acoustic features extracted from the speech recordings of 52 COVID-19-diagnosed patients from two hospitals in Wuhan, China to measure the anxiety level. Elsayed et al. (2022) proposed a hybrid model of the gated recurrent neural networks (GRU) to evaluate emotional speech sets with an accuracy of 94.29%.
Apart from sentiment analysis and stress level assessment, audio data are also applied in the measures of mechanics of phonation and speech intelligibility. Deng et al. (2022) investigated the effects of mask-wearing and social distancing on phonation and vocal health. While simulations were performed for vowel phonemes with different masks or multiple mask layers worn, a three-mass body-cover model of the vocal folds (VFs) coupled with the subglottal and supraglottal acoustic tracts was modified to incorporate mask and distance-dependent acoustic pressure models. The acoustic wave propagation was modeled with the wave reflection analog (WRA) method. Wearing masks might reduce intelligibility. However, their study provides several practical insights into how this effect can be mitigated while allowing masks to keep their role in preventing airborne disease transmission. They found that light masks are preferable to heavy masks for the same particle filtration properties and the negative effects of wearing masks on intelligibility can be greatly reduced in a low-noise environment.
Similarly, Knowles and Badh (2022) measured speech intensity, spectral moments, and spectral tilt and energy of sentences read by 17 healthy talkers with three types of mask-wearing by linear mixed effects regression. With statistical analysis on speech-related and phonation-related variables, Pörschmann, Lübeck, and Arend (2020) analyzed the impact of face masks on voice radiation with audio data generated by a mouth simulator covered with six masks. Bandaru et al. (2020) assessed the speech perception based on the results of 20 participants’ speech audiometry testing.
There are other aspects of human behaviors being investigated with the audio data as well. For instance, Mohamed et al. (2022) examined whether voice biometrics can be leveraged in mask detection, that is, classifying whether or not a speaker is wearing a mask given a piece of audio data. They reviewed the face mask detection approaches via voice in the Mask Sub-Challenge (MSC) of the INTERSPEECH 2020 COMputational PARalinguistics challengE (ComParE). There are mainly two groups of methods:(1) models using phonetic-based audio features, and (2) frameworks that combine spectrogram representations of audio and CNNs. They also found that fusing the approaches can improve classification performance. Finally, they implemented an Android-based smartphone app based on the proposed model for mask detection in real time.
Sensor Data
With the development of the Wireless Sensor Network, sensing devices that measure physical indicators have been applied to multiple areas such as ambient intelligence (Haque, Milstein, and Fei-Fei 2020) and environmental modeling (Wong and Kerkez 2016). Because of the reliability, accuracy, flexibility, cost-effectiveness, and ease of deployment of sensor networks (Tilak, Abu-Ghazaleh, and Heinzelman 2002), researchers mine sensor data to measure human behavior in the context of COVID-19. Body temperature monitoring has been implemented as one of the prevention strategies during the pandemic. However, the accuracy of temperature measurement is not consistent in some cases. For instance, the surrounding environment such as ambient temperature and humidity may easily impact the data. Moreover, body motion influences temperature (Zhang et al. 2021a). To alleviate these issues, Zhang et al. (2021a) recruited 10 participants to wear a wearable sensor that contains a three-axis accelerometer, a three-axis gyroscope, and a temperature sensor. The three-axis acceleration, three-axis angular velocity, and body surface temperature were recorded at 50 Hz while these participants were sitting, walking, walking upstairs, and walking downstairs. Using the seven-dimensional sensor data (i.e., acceleration, velocity, and temperature) as input, Zhang et al. (2021a) intended to employ conventional machine learning, deep learning algorithms, and ensemble methods to predict human activities. In particular, they applied conventional machine learning algorithms such as support vector machine, logistic regression, and so on. Stacked denoising autoencoder (Vincent et al. 2010) was leveraged. Ensemble methods that were used include random forest (Breiman 2001), extra trees (Geurts, Ernst, and Wehenkel 2006), and deep forest (Zhou and Feng 2017). Only KNN and the ensemble methods performed better in the human activity recognition task. The experimental results indicated that body temperature is lower when a human is involved in dynamic activities (e.g., walking) compared with static activities (e.g., sitting), which may potentially cause misses in fever screening for COVID-19 prevention. Sardar et al. (2022) extended human activity recognition to handwashing, standing, hand sanitizing, nose-eyes touching, handshake, and drinking.
Except for wearable devices, researchers have also used mobile phone sensing to measure human behavior. In Nepal et al. (2022), 220 college students were recruited and asked to keep a continuous mobile sensing app installed and running. Nepal et al. (2022) tried to understand the objective behavioral changes of students under the influence of the COVID-19 pandemic. The app records features including phone usage, mobility, physical activity, sleep, semantic locations, audio plays, and regularity. Students were found to travel significantly less during the first COVID-19 year but use their phones more. Fully Convolutional Neural Networks (Wang, Yan, and Oates 2017) was applied to predict students’ COVID-19 concerns solely based on the sensor data. The model achieved an AUROC of 0.70 and an F1 score of 0.71. The number of unique locations visited, duration spent at home, running duration, audio play duration, and sleep duration were the most important features when predicting students’ concerns regarding COVID-19.
Despite the merits discussed before, issues such as missing data, outliers, bias, and drift can occur in sensor data collection (Teh, Kempa-Liehr, and Wang 2020). The errors at the individual level may be small, however, when aggregated, they can be enlarged and reduce the performance of large-scale predictive models (Ienca and Vayena 2020). In addition to enhancing the data collection process, error detection and correction pipelines (Teh, Kempa-Liehr, and Wang 2020) can be applied before using the sensor data to measure human behavior.
Interaction Data
Interaction data such as the number of logins, the number of posts, etc. records how people use and interact with the digital systems. Researchers apply data mining techniques to this type of data to recognize interesting patterns and measure human behavior. One of the major applications during the COVID-19 pandemic is evaluating the quality of online learning (Dascalu et al. 2021; Dias et al. 2020). Video conferencing platforms such as Zoom and MS Teams are heavily used for online learning. The quality of engagement is important to the quality of online learning (Herrington, Reeves, and Oliver 2007). To provide instructors and learners with supportive tools that can improve the quality of engagement, Dias et al. (2020) applied a deep learning framework that leverages users’ history interaction data in a learning management system to provide real-time feedback. The learning management system records 110 types of interaction data which are processed by a fuzzy logic-based model (Dias and Diniz 2013) to measure the quality of interaction (QoI) at each timestamp. Next, an LSTM model is trained with this time series data. The difference between the predicted QoI at timestamp and the real QoI at timestamp is used as the metacognitive stimulus to improve the quality of learning. A positive difference is considered rewarding feedback while a negative difference warning feedback. They applied the proposed method to one database before and two databases during the COVID-19 pandemic. The average correlation coefficient between ground truth and predicted QoI values is no less than 0.97 ().
Multimodal Data
Multimodal human behavior learning uses at least two types of aforementioned data. The motivation is straightforward, that is, to exploit complementary information of multiple modalities to improve robustness and completeness (Baltrušaitis, Ahuja, and Morency 2018). Social platforms have abundant multimodal data. The publicly available profile image uploaded by a user may contain the demographic information of this user (Xiong et al. 2021; Zhang, Lyu, and Luo 2021; Lyu et al. 2020). This side information can potentially improve the performance of measuring human behavior. For instance, Zhang et al. (2021b) fine-tuned an XLNet model (Yang et al. 2019) and applied it to social media posts to predict whether or not the author of the posts has depression. To improve the detection performance, they obtained user demographics by leveraging a multimodal analysis model - M3 inference model (Wang et al. 2019) which predicts the age and gender of the user based on the user’s profile image, username, and description. The fusion model that uses all features including the depression score estimated by the XLNet model and the demographic inferred by the M3 inference model outperforms other baselines and achieves an accuracy of 0.789 on the depression detection task. They further demonstrated the ability of their model in monitoring both group- and population-level depression trends during the COVID-19 pandemic. All tweets posted from January 1 to May 22, 2020 of 500 users were used to measure users’ depression levels. They found that the depression levels of the users in the depression groups were substantially higher than that in the non-depression group. The depression levels of both groups roughly corresponded to three major events in the real world including (1) the first case of COVID-19 confirmed in the US (January 21), (2) the US National Emergency announcement (March 13), and (3) the last stay-at-home order issued (South Carolina, April 7).
Challenges and Opportunities
Although big data techniques have shown promising performance in measuring human behavior in the applications during the COVID-19 pandemic, there are still several challenges and room for improvement in terms of the three characteristics of the spread of COVID-19 including (1) its unprecedented global influence, (2) disparate impacts over people across various race, gender, disability, and socioeconomic status (Van Dorn, Cooney, and Sabin 2020), and (3) rapidly evolving situations.
-
•
COVID-19 has impacted the society and economy worldwide. The scale and scope of the impact of COVID-19 have led to an unprecedented increase in the amount of online health discourse (Wu, Lyu, and Luo 2021; Evers, Greenfield, and Evers 2021). The data distributions may be entirely different for research questions on a similar topic before and during the pandemic, thus requiring certain adaptations. For instance, both regarding using Twitter data to understand vaccine hesitancy, the majority of the collected tweets in Tomeny, Vargo, and El-Toukhy (2017) are relevant to vaccine opinions while the majority of the collected tweets in Lyu et al. (2022) are irrelevant. To infer opinions from tweets, they both labeled a small batch of data first, then trained a machine learning model. Given the low percentage of relevant data in Lyu et al. (2022), it would have been inefficient and led to poor performance of opinion inference if the same data process pipeline was applied.
Distribution shift may also compromise the robustness of off-the-shelf methods in measuring human behavior in the era of COVID-19. Specifically, many studies use off-the-shelf sentiment analysis tools such as VADER (Valence Aware Dictionary and sEntiment Reasoner) (Hutto and Gilbert 2014) and LIWC (Pennebaker, Francis, and Booth 2001) to estimate human sentiment and emotion based on lexicon scores that were labeled well before the pandemic. These methods may not yield robust sentiment estimates in the context of COVID-19 which has greatly impacted human society, as evidence has shown that the robustness of lexicon-based sentiment analysis tools can be worsened compared to machine learning-based methods because of regional cultural and socioeconomic differences in language use (Jaidka et al. 2020).
The change in how data is generated in the COVID-19 context also calls for model adaptation. For instance, De la Torre and Cohn (2011) found that facial expressions are important in distinguishing different types of sentences in signed languages. The performance of models in sign language recognition may be undermined because of the mask order where the movement of jaws and cheeks are covered. Future work may need to adapt the models to maintain the performance.
-
•
The uneven influences of the COVID-19 pandemic over people across various characteristics (Van Dorn, Cooney, and Sabin 2020) strongly suggests that understanding and investigating the disparities among different populations (Lyu et al. 2022) is essential. This phenomenon also contributes to algorithmic bias (Walsh et al. 2020). For instance, Aguirre, Harrigian, and Dredze (2021) analyzed the fairness of depression classifiers trained on Twitter data in terms of different gender and racial demographic groups. They found that models perform worse for underrepresented groups. How to pursue fairness in measuring human behavior with respect to different populations in the context of COVID-19 remains an open question.
-
•
For visual data, systems that leverage state-of-the-art YOLO algorithms (Redmon et al. 2016) perform poorly on small targets, thus limiting the application to a particular scale of human faces in images (Xing, Liang, and Yang 2020). Furthermore, Chavda et al. (2021) stated that the time performance of CNN models decreases with an increase in model parameters without GPU support. There is a trade-off between time performance and accuracy, which is critical to the deployment of such applications in real-time systems. Another reason that real-time systems are important is data privacy issues. For instance, individuals may not accept being monitored by surveillance systems. To avoid violating privacy when applying models to the video surveillance data, the system should be fast in inference in order not to record or store data (Shorfuzzaman, Hossain, and Alhamid 2021). Moreover, designing models using techniques such as knowledge distillation (Gou et al. 2021) may be helpful for developing real-time systems. Knowledge distillation compresses information from a large teacher model and learns a small student model. The teacher model is often trained with data at a large scale and is hard to deploy. In contrast, the student model is learned via knowledge distillation and is lightweight.
Additionally, there exists another avenue for future research regarding real-time systems in the context of COVID-19. Based on the characteristics of different types of data and the cost of implementation, we should be more flexible in choosing the optimal data to address problems in fighting against the COVID-19 pandemic. As has been shown, computer vision techniques can be used for monitoring social distancing. However, it is often expensive to train these deep learning algorithms. Li et al. (2021) proposed an alternative way to count people within a given place by using a lightweight supervised learning algorithm to exploit WiFi signals, which is low-cost and non-intrusive.
Using Big Data to Model Human Behavior in COVID-19
After obtaining human behavior measurements either from questionnaires, raw data, or both, big data techniques are employed to model and analyze human behavior. The goal of modeling human behavior is to characterize human behavior and understand the relevance between human behavior and other variables. In this section, we discuss existing studies in analyzing human behavior based on the method types including metric-based and model-based.
Metric-based Method
This line of methods focuses on using metrics to characterize human behavior and describe its relevance to other variables. The metrics can be calculated directly based on the data distributions, which does not require model construction.
Well-studied statistical methods such as correlation analysis (Ezekiel 1930), Chi-square test (McHugh 2013), Student’s t test (Kim 2015), and ANOVA (Analysis of Variance) (St, Wold et al. 1989) have been widely applied to behavioral science in terms of COVID-19. The measure of the mutual dependence between two random variables is defined as mutual information (Shannon 1948). It has been used to analyze the relationship between the growth of COVID-19 cases and human behavior such as isolation, wearing masks outside home, and contact with symptomatic persons. Tripathy and Camorlinga (2021) calculated the mutual information regression score to assess the feature importance and found high relevance between case increase and behavioral features including avoiding gatherings, avoiding guests at home, wearing masks at public transport, and willingness to isolate.
The counts of different frequent patterns have been used to characterize human behavior. Moreover, the confidence, support, and lift of association rules that are generated from the frequent patterns are used to indicate the relevance between human behavior and other variables. Urbanin et al. (2022) applied the Apriori algorithm (Agrawal, Srikant et al. 1994) to the survey responses of 10,162 participants to generate association rules with respect to people’s social and economic conditions and the reports of protective behaviors including the use of protective masks, distancing by at least one meter when out of the house, and handwashing or use of alcohol. Increased use of video conferencing platforms and the possibility to work from home are both associated with better self-care behavior. Fear of economic struggle is associated with preventive behavior. The generated association rules provide insights into how different stages of the pandemic shape human behavior.
Model-based Method
These approaches emphasize on building models to analyze human behavior and explain the relationship between it and other variables. We discuss four analysis frameworks including sensitivity analysis, counterfactual analysis, outlier analysis, and network analysis. Note that although we focus on the studies that use these four frameworks on model-based methods, some of these frameworks can also be applied to metric-based methods.
Sensitivity Analysis
Sensitivity analysis investigates the relationship between the variation in input values and the variation in output values (Saltelli 2002). Christopher Frey and Patil (2002) have systematically reviewed several sensitivity analysis methods. In our study, we focus on discussing its applications in analyzing human behavior in the context of COVID-19.
Ramchandani, Fan, and Mostafavi (2020) performed sensitivity analysis (Samek, Wiegand, and Müller 2018) to explain the feature importance. The assumption is that the model is most sensitive to the value variation of the most important features. More specifically, they first evaluate the accuracy of the model on a small subset of the training data. Next, for each feature, they randomized its value and evaluated the accuracy of the model on the same subset again. The importance of the feature is assigned based on how much the accuracy decreases due to the randomization. The lower the accuracy is, the more important the feature is. They found that incoming county-level visits are one of the most important features in predicting the growth of COVID-19 cases.
Rodríguez et al. (2021) proposed a variation of the sensitivity analysis where they removed the features instead of randomizing their values. Moreover, they conducted a two-sample t-test with the null hypothesis that the performance does not significantly change after they drop the features. Instead of simply using accuracy as the indicator, Bhouri et al. (2021) employed a revised sensitivity measure (Campolongo, Cariboni, and Saltelli 2007) which was originally proposed by Morris (1991) to quantify the feature importance. This measure is calculated based on the distribution of the elementary effect of input features.
Other statistical models such as multinomial logistic regression (Kwak and Clayton-Matthews 2002), structural equation modeling (SEM) (Hox and Bechger 1998), and negative binomial regression (Hilbe 2011) are also applied to analyze the relationship between human behavior and other variables.
Yang et al. (2020) applied SEM to the survey responses of 512 participants to explore the relationship between COVID-19 involvement and consumer preference for utilitarian versus hedonic products. They found that COVID-19 involvement is positively related to consumer preference for utilitarian products and attribute it to the mediated effects of awe, problem-focused coping, and social norm compliance. Lyu, Zheng, and Luo (2022) conducted the Fama-MacBeth regression with the Newey-West adjustment on nearly four million geotagged English tweets and the COVID-19 data (e.g., vaccination, confirmed cases, deaths) to analyze how people react to misinformation and fact-based news on social platforms regarding the COVID-19 vaccine uptake, and discovered that the negative association between fact-based news and vaccination intent might be due to a combination of a larger user-level influence and the negative impact of online endorsement.
Counterfactual Analysis
Counterfactual analysis focuses on simulating the target variable with hypothetical input data. It intends to investigate the effects of changes in certain variables on the output variable, which is similar to sensitivity analysis. However, sensitivity analysis pays more attention to the input side while counterfactual analysis focuses on the output side. Given this characteristic, counterfactual analysis has been widely applied to policy design as it simulates the effect of policy interventions (Lyu et al. 2022; Chang et al. 2021; Rashed and Hirata 2021; Hirata et al. 2022). For instance, Hirata et al. (2022) conducted the counterfactual analysis to investigate the effects of people’s activity during holidays and vaccination on the COVID-19 spread. In particular, they compared three time series. The first time series is the estimated new daily positive cases after July 23, 2021, assuming vaccination was not conducted. The second time series is the estimated new daily positive cases after July 23, 2021, assuming the mobility was identical to the mobility before the pandemic. The third time series is the observed new daily positive cases after July 23, 2021. By comparing them, they found that both human mobility and vaccination have an impact on the spread of COVID-19. The effect of vaccination is larger than the effect of human mobility.
Outlier Analysis
The data objects that do not comply with general behavior are considered as outliers or anomalies. Detecting irregular behavior patterns is sometimes more interesting in some applications (Han, Pei, and Tong 2022). Karadayi, Aydin, and Öǧrenci (2020) conducted anomaly detection in the spatial-temporal COVID-19 data based on the reconstruction error using an autoencoder framework. They first constructed a multivariate spatial temporal data matrix with 20 features including region code, region name, and behavioral attributes such as tests performed, and hospitalized with symptoms. Next, they use a 3D convolutional neural network (Ji et al. 2012) to encode the spatial temporal matrix to preserve both the spatial and temporal dependencies. They then used a convolutional LSTM network (Shi et al. 2015) to decode the previous latent representation. This framework was trained to minimize the reconstruction error where the mean absolute error loss function was employed. After training the network, they calculated the reconstruction error on the test set. A bigger error indicates an anomaly. Experimental results show that the proposed autoencoder framework outperforms other state-of-the-art algorithms in anomaly detection.
Network Analysis
Network analysis has shown wide applicability in multiple areas such as biology, social science, and computer networks in analyzing data structures that emphasize complex relations among different entities (Newman 2018). It has also been used to analyze human behavior in the context of COVID-19. Shang et al. (2021) leveraged a complex network (Barrat et al. 2004) which models edges of a network with proportional weights in terms of the intensity or capacity among different elements to investigate bike-sharing behavior under the influence of the pandemic. The data consist of 17,761,557 valid orders and associated travel data of three major dockless bike-sharing operators in Beijing. The study areas were divided into small lattices with the size of . These lattices are the nodes. If there are bike-sharing trips between two nodes, an edge is drawn. The edge weight is assigned based on the number of bike-sharing trips. They found that the trip distributions in the complex networks are significantly different at various pandemic stages. People are less likely to visit places that were previously popular.
Challenges and Opportunities
Even though most methods we discuss in this section are well-studied, there are several challenges and opportunities when they are applied in COVID-19 studies:
-
•
As we have shown in this section, the size of study samples can be up to millions (Shang et al. 2021). Both metric-based (e.g., mutual information, ANOVA) and model-based (e.g., sensitivity analysis) methods may suffer from computational complexity (Christopher Frey and Patil 2002; Merz, Small, and Fischbeck 1992). For instance, many sensitivity analysis frameworks need to iteratively change the input values and re-evaluate the model performance, which is both time-consuming and computationally expensive. One of the important directions for future work can be designing scalable and robust analysis methods.
-
•
Most studies that analyze human behavior use a cross-sectional design that can only examine association but cannot infer causation (Yang et al. 2020; Ranjit et al. 2021; Vázquez-Martínez, Morales-Mediano, and Leal-Rodríguez 2021; Lyu et al. 2022). Causal inference models (Pearl 2010) that discover the causal effects among variables can be applied more to provide insights into policy design for pandemic control and prevention.
Using Big Data to Leverage Human Behavior in COVID-19
The section intends to answer the research question that whether or not human behavior can be leveraged to improve studies that address COVID-19 related problems. In particular, we focus on one fundamental area - epidemiology which investigates “the distribution and determinants of disease frequency” (MacMahon, Pugh et al. 1970). Evidence has shown that NPIs and the development of the pandemic can lead to human behavioral changes (Yan et al. 2021; Bayham et al. 2015), suggesting the desire for mathematical models that can integrate human behavioral factors to better characterize the causes and patterns of the spread of the disease. We primarily discuss three types of models including compartmental models, machine learning models, and hybrid models.
Compartmental Model
Compartmental models divide the population into compartments and express the transition rates between different compartments as derivatives with respect to the time of compartment sizes. SIR is a compartmental model where the population is divided into susceptible class, infective class, and removed class (Brauer 2008). There have been many efforts of integrating human behavior and other socio-economic factors into the compartmental models to forecast the growth of COVID-19 cases (Chen et al. 2020; Iwata and Miyakoshi 2020; Goel and Sharma 2020; Silva et al. 2022; Usherwood, LaJoie, and Srivastava 2021). Chen et al. (2020) focused on analyzing the infection data of Wuhan, China. The parameters of the compartment model they chose are from Tang et al. (2020). To evaluate the performance of their model, they used real data from Wuhan for simulation. Instead of using parameters of other studies, Iwata and Miyakoshi (2020) designed and enumerated 45 scenarios in terms of the different combinations of their hypothesized parameters, and simulated each.
Motivated by the characteristic that COVID-19 can be spread by both symptomatic and asymptomatic individuals, Chen et al. (2020) adopted the SEIR (Susceptible–Exposed–Infectious–Recovered) model by incorporating the migration of the asymptomatic infected population. The proposed SEIAR (Susceptible–Exposed–Infectious–Asymptomatic–Recovered) model was used to analyze and compare the effects of different prevention policies. They found that lowering the migration-in rate can decrease the total number of infected people.
Machine Learning Model
Machine learning models including conventional models such as decision tree, support vector machine, and deep learning models such as long short-term memory network (LSTM) (Hochreiter and Schmidhuber 1997) intend to learn a function that can recognize patterns or make predictions from data automatically (Han, Pei, and Tong 2022). Researchers have been employing machine learning models to integrate human behavior to forecast confirmed cases due to its ease of inputting multiple features (Rabiolo et al. 2021; Tripathy and Camorlinga 2021; Ramchandani, Fan, and Mostafavi 2020; Rashed and Hirata 2021). Rabiolo et al. (2021) developed a feed-forward neural network autoregression that integrates Google Trends of searches of symptoms and conventional COVID-19 metrics to forecast the development of the COVID-19 pandemic. The COVID-19 data from the COVID-19 Data Repository (Dong, Du, and Gardner 2020) are composed of daily new confirmed cases, the cumulative number of cases, and the number of deaths per million for all available countries. The Google Trends API was used to crawl the search keywords for the most common COVID-19 signs and symptoms. Twenty topics were detected based on the most frequent signs and symptoms of COVID-19. The model that integrates the search data outperforms the model that does not include Google searches. Rashed and Hirata (2021) designed a multi-path LSTM network that takes mobility, maximum temperature, average humidity, and the number of recorded COVID-19 cases as the input to predict the growth of COVID-19 cases.
Hybrid Model
To enhance the performance of the predictive model, researchers have been proposing to design hybrid models to exploit the compartmental model’s ability to model the epidemiological characteristics and the machine learning model’s ability to handle various behavioral features (Alanazi et al. 2020; Bhouri et al. 2021; Aragão et al. 2021). Bhouri et al. (2021) used a deep learning model to obtain a more accurate estimation of the parameters of the compartmental model (i.e., SEIR). The susceptible to infectious transition rate was modeled by an LSTM network as a function of Google’s mobility data (Google 2020) and Unacast’s social behavior data (Unacast 2020) for all 203 U.S. counties. To infer the learnable parameters of the LSTM model, they formulated a multi-step loss function which is expressed as the difference between the variable estimated only from available data and the variable estimated from the learnable parameters. The enhanced SEIR model achieved accurate forecasts of case growth within a period of 15 days. In contrast to Bhouri et al. (2021) that used deep learning models to improve compartmental models, Aragão et al. (2021) employed compartmental models to aid deep learning models. More specifically, Aragão et al. (2021) used the SEIRD (Susceptible-Exposed-Infected-Recovered-Dead) model to calculate the reproduction rate which was further fed into an LSTM model along with other behavioral indicators to predict COVID-19 deaths. The model using the number of cases and the reproduction number estimated by the compartmental model outperforms the model using only the number of cases by a margin of 18.99% in average RMSE (Root Mean Squared Error), suggesting the effectiveness of the aid of the compartmental models.
Challenges and Opportunities
After reviewing the big data methods that leverage human behavior for epidemiology, we summarize several challenges and potential opportunities:
-
•
Conventional compartmental models have merits, however, their feasibility is limited due to the strict assumptions for the models. This issue is more critical for the robustness of their applications during the early periods of the COVID-19 pandemic since many parameters regarding the models were unknown. Moreover, real-world situations might be more complicated. For instance, many of these models assumed there would be no nosocomial outbreak of COVID-19 assuming adequate control methods have been conducted. However, nosocomial outbreaks can even happen in developed nations (Varia et al. 2003; Parra, Salmerón, and Velasco 2014). The dependence of the conventional compartmental models on strict assumptions may reduce their adaptability to new scenarios (e.g., new variants).
-
•
More efforts in considering the mutations of COVID-19 are required because of the high transmissibility (Starr et al. 2021). More importantly, different levels of the perceived risks with respect to various mutations may lead to behavioral changes.
-
•
Different from the conventional compartmental models, machine learning models are data-driven. In other words, the performance and robustness are highly dependent on the amount of available data. For instance, Bhouri et al. (2021) showed that the models trained for the counties with more COVID-19 cases perform relatively better in estimating the reproduction number. Although it is more desirable since the spread of the disease in regions with more cases may evolve more rapidly, it is also critical to ensure the model performance in regions with fewer reported cases which might be a result of asymptomatic carriers of the COVID-19 virus (Gaskin, Zare, and Delarmente 2021). There are multiple strategies that can be applied to alleviate the small data issue such as few-shot learning (Wang et al. 2020). Few-shot learning aims to generalize the model with prior knowledge to new tasks containing only a small amount of data (Wang et al. 2020). This technique has wide applicability in the COVID-19 context. For instance, when a new variant surfaces in a region, models trained with a large amount of data in other regions can be adopted and generalized to this new scenario which provides the opportunity to model the development of the spread in a more timely manner.
-
•
The integration of compartmental models and machine learning models is rather shallow, which is also observed by Xu et al. (2021). Either the compartmental models use the parameters estimated by machine learning models, or the machine learning models take the values predicted by the compartmental models as input data. More sophisticated integration should be investigated. Ensemble methods can be employed to enhance the model performance. Moreover, deep learning models that mimic compartmental models are worth investigating.
Discussions
There are several challenges and open questions that are important to all three mechanisms we have discussed. Understanding and addressing these problems can improve the big data methods for learning human behavior during the time of COVID-19.
Data Bias
Data bias in big data studies on learning human behavior mainly comes from two sources: (1) the selection of the study group, and (2) the method of data collection. For instance, questionnaire-based studies often use convenience sampling to recruit participants where the majority might share some common characteristics (e.g., occupation, geographic location). Social media-based studies can reach more study samples. However, there are demographic differences in the users of different social platforms. For instance, Twitter is found to have fewer older adults.333https://www.statista.com/statistics/283119/age-distribution-of-global-twitter-users/ In terms of data collection, questionnaires that collect people’s response actively may introduce social desirability bias (Krumpal 2013).
Data Privacy
Big data has been crucial in building applications to fight the pandemic, yet at the expense of privacy (Bentotahewa, Hewage, and Williams 2021). With the huge inflow of data via contact tracing, social media, surveillance applications, and so on; there is an increased privacy concern. Aygün, Kaya, and Kaya (2021) trained a BERT (Bidirectional Encoder Representations from Transformers) based model to identify vaccine sentiment on a public dataset released by Banda et al. (2021). The methodology can be reproduced and used to influence people who are potentially vaccine-hesitant. Boutet et al. (2020) stated that Contact Tracing Applications (CTAs) are vulnerable to cyber-attacks and discussed how they could be used for the identification of infected individuals. Authorities that have access might take advantage of this situation and retain data to use in other scenarios that deem fit. This poses a threat to confidentiality and increases the risk of data misuse (Klar and Lanzerath 2020).
The approach toward data privacy varies across domains and applications. Fahey and Hino (2020) discussed two approaches specific to CTAs - data-first that provides autonomy to the authorities to identify individuals in a given jurisdiction, and privacy-first that provides users control of their data and the freedom to share it redacting personally identifiable information. The approaches described here are not binary, and different countries adopt variations of these approaches.
For social media data, even with the absence of user information associated with their posts, the content acts as a digital fingerprint that can be traced back to the user. Feyisetan et al. (2020) provided a methodology to thwart the textual content, preserving its original meaning based on differential privacy (DP) in order to tackle this scenario.
Interactive Effect
Most existing studies on learning human behavior focus on the relationship between human behavior and other variables. Future work can pay more attention to the relationship and interactive effects of different individuals. Answering research questions such as whether or not different individuals change behavior due to each other’s behavior, and how great the interactive effect is can potentially drive the development of human behavior studies.
Conclusion
In this paper, we present a systematic overview of the existing studies that investigate and address human behavior within the context of the COVID-19 pandemic. Depending on the mechanism, we categorize them into three groups including using big data techniques to measure, model, and leverage human behavior. We show the wide applicability of big data techniques to studying human behavior during the COVID-19 pandemic. We start with discussions about the studies that measure human behavior in the context of COVID-19. In particular, we observe six major types of data including textual, visual, audio, sensor, interaction, and multimodal. There are several challenges in measuring human behavior because of the three characteristics of the spread of COVID-19 (i.e., global influence, disparate impacts, and rapid evolution). We highlight the influences of these characteristics on the shift in data distribution, model adaptation, fairness, and the feasibility of real-time deployment via techniques such as knowledge distillation. Next, we elaborate on the studies that use big data techniques to model and analyze human behavior. Metric-based (e.g., mutual information score) and model-based methods (e.g., sensitivity analysis) are discussed. We argue that due to the high computational cost of model-based methods, especially when there are hundreds of features, scalable and robust analysis methods are needed. Moreover, we underline the importance of causality analysis in modeling human behavior. We then discuss how big data techniques can be used to leverage human behavior in epidemiology. The models are categorized into compartmental, machine learning, and hybrid. Challenges observed in the studies of these three lines of approaches (e.g., strict assumption, small data) are thoroughly discussed. Finally, we emphasize several challenges and open questions (e.g., data bias, data privacy) that are critical to all three mechanisms we have discussed. Although there are still challenges, we believe that big data approaches are powerful while at the same time, there is room for improvement. The methods and applications surveyed in this study can provide insights into combating the current pandemic and future catastrophes.
References
- Agbehadji et al. (2020) Agbehadji, I. E.; Awuzie, B. O.; Ngowi, A. B.; and Millham, R. C. 2020. Review of big data analytics, artificial intelligence and nature-inspired computing models towards accurate detection of COVID-19 pandemic cases and contact tracing. International journal of environmental research and public health 17(15): 5330.
- Agrawal, Srikant et al. (1994) Agrawal, R.; Srikant, R.; et al. 1994. Fast algorithms for mining association rules. In Proc. 20th int. conf. very large data bases, VLDB, volume 1215, 487–499. Santiago, Chile.
- Aguirre, Harrigian, and Dredze (2021) Aguirre, C.; Harrigian, K.; and Dredze, M. 2021. Gender and Racial Fairness in Depression Research using Social Media. In Proceedings of the 16th Conference of the European Chapter of the Association for Computational Linguistics: Main Volume, 2932–2949. Online: Association for Computational Linguistics. doi:10.18653/v1/2021.eacl-main.256. URL https://aclanthology.org/2021.eacl-main.256.
- Alanazi et al. (2020) Alanazi, S. A.; Kamruzzaman, M.; Alruwaili, M.; Alshammari, N.; Alqahtani, S. A.; and Karime, A. 2020. Measuring and preventing COVID-19 using the SIR model and machine learning in smart health care. Journal of healthcare engineering 2020.
- Alsunaidi et al. (2021) Alsunaidi, S. J.; Almuhaideb, A. M.; Ibrahim, N. M.; Shaikh, F. S.; Alqudaihi, K. S.; Alhaidari, F. A.; Khan, I. U.; Aslam, N.; and Alshahrani, M. S. 2021. Applications of big data analytics to control COVID-19 pandemic. Sensors 21(7): 2282.
- Aragão et al. (2021) Aragão, D. P.; Dos Santos, D. H.; Mondini, A.; and Gonçalves, L. M. G. 2021. National holidays and social mobility behaviors: alternatives for forecasting COVID-19 deaths in Brazil. International Journal of Environmental Research and Public Health 18(21): 11595.
- Aslam et al. (2020) Aslam, F.; Awan, T. M.; Syed, J. H.; Kashif, A.; and Parveen, M. 2020. Sentiments and emotions evoked by news headlines of coronavirus disease (COVID-19) outbreak. Humanities and Social Sciences Communications 7(1).
- Aygün, Kaya, and Kaya (2021) Aygün, İ.; Kaya, B.; and Kaya, M. 2021. Aspect based twitter sentiment analysis on vaccination and vaccine types in covid-19 pandemic with deep learning. IEEE Journal of Biomedical and Health Informatics 26(5): 2360–2369.
- Baltrušaitis, Ahuja, and Morency (2018) Baltrušaitis, T.; Ahuja, C.; and Morency, L.-P. 2018. Multimodal machine learning: A survey and taxonomy. IEEE transactions on pattern analysis and machine intelligence 41(2): 423–443.
- Banda et al. (2021) Banda, J. M.; Tekumalla, R.; Wang, G.; Yu, J.; Liu, T.; Ding, Y.; Artemova, E.; Tutubalina, E.; and Chowell, G. 2021. A Large-Scale COVID-19 Twitter Chatter Dataset for Open Scientific Research—An International Collaboration. Epidemiologia 2(3): 315–324. ISSN 2673-3986. doi:10.3390/epidemiologia2030024. URL https://www.mdpi.com/2673-3986/2/3/24.
- Bandaru et al. (2020) Bandaru, S.; Augustine, A.; Lepcha, A.; Sebastian, S.; Gowri, M.; Philip, A.; and Mammen, M. 2020. The effects of N95 mask and face shield on speech perception among healthcare workers in the coronavirus disease 2019 pandemic scenario. The Journal of Laryngology & Otology 134(10): 895–898.
- Barnes (2021) Barnes, S. J. 2021. Understanding terror states of online users in the context of COVID-19: An application of Terror Management Theory. Computers in human behavior 125: 106967.
- Barrat et al. (2004) Barrat, A.; Barthelemy, M.; Pastor-Satorras, R.; and Vespignani, A. 2004. The architecture of complex weighted networks. Proceedings of the national academy of sciences 101(11): 3747–3752.
- Basilaia and Kvavadze (2020) Basilaia, G.; and Kvavadze, D. 2020. Transition to online education in schools during a SARS-CoV-2 coronavirus (COVID-19) pandemic in Georgia. Pedagogical Research 5(4).
- Bayham et al. (2015) Bayham, J.; Kuminoff, N. V.; Gunn, Q.; and Fenichel, E. P. 2015. Measured voluntary avoidance behaviour during the 2009 A/H1N1 epidemic. Proceedings of the Royal Society B: Biological Sciences 282(1818): 20150814.
- Benfold and Reid (2011) Benfold, B.; and Reid, I. 2011. Stable multi-target tracking in real-time surveillance video. In CVPR 2011, 3457–3464. IEEE.
- Bentotahewa, Hewage, and Williams (2021) Bentotahewa, V.; Hewage, C.; and Williams, J. 2021. Solutions to Big Data Privacy and Security Challenges Associated With COVID-19 Surveillance Systems. Frontiers in Big Data 4: 645204. ISSN 2624-909X. doi:10.3389/fdata.2021.645204. URL https://www.frontiersin.org/articles/10.3389/fdata.2021.645204/full.
- Beyan et al. (2020) Beyan, C.; Bustreo, M.; Shahid, M.; Bailo, G. L.; Carissimi, N.; and Del Bue, A. 2020. Analysis of face-touching behavior in large scale social interaction dataset. In Proceedings of the 2020 International Conference on Multimodal Interaction, 24–32.
- Bhardwaj et al. (2021) Bhardwaj, P.; Gupta, P.; Panwar, H.; Siddiqui, M. K.; Morales-Menendez, R.; and Bhaik, A. 2021. Application of Deep Learning on Student Engagement in e-learning environments. Computers & Electrical Engineering 93: 107277.
- Bhouri et al. (2021) Bhouri, M. A.; Costabal, F. S.; Wang, H.; Linka, K.; Peirlinck, M.; Kuhl, E.; and Perdikaris, P. 2021. COVID-19 dynamics across the US: A deep learning study of human mobility and social behavior. Computer Methods in Applied Mechanics and Engineering 382: 113891.
- Blei, Ng, and Jordan (2003) Blei, D. M.; Ng, A. Y.; and Jordan, M. I. 2003. Latent dirichlet allocation. Journal of machine Learning research 3(Jan): 993–1022.
- Boutet et al. (2020) Boutet, A.; Bielova, N.; Castelluccia, C.; Cunche, M.; Lauradoux, C.; Le Métayer, D.; and Roca, V. 2020. Proximity Tracing Approaches - Comparative Impact Analysis. Research report, INRIA Grenoble - Rhone-Alpes. URL https://hal.inria.fr/hal-02570676.
- Bower (2019) Bower, M. 2019. Technology-mediated learning theory. British Journal of Educational Technology 50(3): 1035–1048.
- Bragazzi et al. (2020) Bragazzi, N. L.; Dai, H.; Damiani, G.; Behzadifar, M.; Martini, M.; and Wu, J. 2020. How big data and artificial intelligence can help better manage the COVID-19 pandemic. International journal of environmental research and public health 17(9): 3176.
- Brauer (2008) Brauer, F. 2008. Compartmental models in epidemiology. In Mathematical epidemiology, 19–79. Springer.
- Breiman (2001) Breiman, L. 2001. Random forests. Machine learning 45: 5–32.
- Cabani et al. (2021) Cabani, A.; Hammoudi, K.; Benhabiles, H.; and Melkemi, M. 2021. MaskedFace-Net–A dataset of correctly/incorrectly masked face images in the context of COVID-19. Smart Health 19: 100144.
- Campolongo, Cariboni, and Saltelli (2007) Campolongo, F.; Cariboni, J.; and Saltelli, A. 2007. An effective screening design for sensitivity analysis of large models. Environmental modelling & software 22(10): 1509–1518.
- Cao et al. (2021) Cao, G.; Shen, L.; Evans, R.; Zhang, Z.; Bi, Q.; Huang, W.; Yao, R.; and Zhang, W. 2021. Analysis of social media data for public emotion on the Wuhan lockdown event during the COVID-19 pandemic. Computer Methods and Programs in Biomedicine 212: 106468.
- Chang et al. (2021) Chang, S.; Pierson, E.; Koh, P. W.; Gerardin, J.; Redbird, B.; Grusky, D.; and Leskovec, J. 2021. Mobility network models of COVID-19 explain inequities and inform reopening. Nature 589(7840): 82–87.
- Chavda et al. (2021) Chavda, A.; Dsouza, J.; Badgujar, S.; and Damani, A. 2021. Multi-Stage CNN Architecture for Face Mask Detection. In 2021 6th International Conference for Convergence in Technology (I2CT), 1–8. doi:10.1109/I2CT51068.2021.9418207.
- Chen et al. (2021) Chen, L.; Lyu, H.; Yang, T.; Wang, Y.; and Luo, J. 2021. Fine-grained analysis of the use of neutral and controversial terms for COVID-19 on social media. In Social, Cultural, and Behavioral Modeling: 14th International Conference, SBP-BRiMS 2021, Virtual Event, July 6–9, 2021, Proceedings 14, 57–67. Springer.
- Chen et al. (2020) Chen, M.; Li, M.; Hao, Y.; Liu, Z.; Hu, L.; and Wang, L. 2020. The introduction of population migration to SEIAR for COVID-19 epidemic modeling with an efficient intervention strategy. Information Fusion 64: 252–258.
- Chicco and Jurman (2020) Chicco, D.; and Jurman, G. 2020. The advantages of the Matthews correlation coefficient (MCC) over F1 score and accuracy in binary classification evaluation. BMC genomics 21(1): 1–13.
- Choudrie et al. (2021) Choudrie, J.; Patil, S.; Kotecha, K.; Matta, N.; and Pappas, I. 2021. Applying and understanding an advanced, novel deep learning approach: A Covid 19, text based, emotions analysis study. Information Systems Frontiers 23(6): 1431–1465.
- Christie et al. (2018) Christie, G.; Fendley, N.; Wilson, J.; and Mukherjee, R. 2018. Functional Map of the World. In Proceedings of the IEEE Conference on Computer Vision and Pattern Recognition (CVPR).
- Christopher Frey and Patil (2002) Christopher Frey, H.; and Patil, S. R. 2002. Identification and review of sensitivity analysis methods. Risk analysis 22(3): 553–578.
- Dascalu et al. (2021) Dascalu, M.-D.; Ruseti, S.; Dascalu, M.; McNamara, D. S.; Carabas, M.; Rebedea, T.; and Trausan-Matu, S. 2021. Before and during COVID-19: A Cohesion Network Analysis of students’ online participation in moodle courses. Computers in Human Behavior 121: 106780.
- De la Torre and Cohn (2011) De la Torre, F.; and Cohn, J. F. 2011. Facial expression analysis. Visual analysis of humans: Looking at people 377–409.
- Deng et al. (2022) Deng, J. J.; Serry, M. A.; Zañartu, M.; Erath, B. D.; and Peterson, S. D. 2022. Modeling the influence of COVID-19 protective measures on the mechanics of phonation. The Journal of the Acoustical Society of America 151(5): 2987–2998.
- Dias and Diniz (2013) Dias, S. B.; and Diniz, J. A. 2013. FuzzyQoI model: A fuzzy logic-based modelling of users’ quality of interaction with a learning management system under blended learning. Computers & Education 69: 38–59.
- Dias et al. (2020) Dias, S. B.; Hadjileontiadou, S. J.; Diniz, J.; and Hadjileontiadis, L. J. 2020. DeepLMS: a deep learning predictive model for supporting online learning in the Covid-19 era. Scientific reports 10(1): 1–17.
- Dong, Du, and Gardner (2020) Dong, E.; Du, H.; and Gardner, L. 2020. An interactive web-based dashboard to track COVID-19 in real time. The Lancet infectious diseases 20(5): 533–534.
- Elsayed et al. (2022) Elsayed, N.; ElSayed, Z.; Asadizanjani, N.; Ozer, M.; Abdelgawad, A.; and Bayoumi, M. 2022. Speech Emotion Recognition using Supervised Deep Recurrent System for Mental Health Monitoring. arXiv preprint arXiv:2208.12812 .
- Evers, Greenfield, and Evers (2021) Evers, N. F.; Greenfield, P. M.; and Evers, G. W. 2021. COVID-19 shifts mortality salience, activities, and values in the United States: Big data analysis of online adaptation. Human Behavior and Emerging Technologies 3(1): 107–126.
- Eyiokur, Ekenel, and Waibel (2022) Eyiokur, F. I.; Ekenel, H. K.; and Waibel, A. 2022. Unconstrained face mask and face-hand interaction datasets: building a computer vision system to help prevent the transmission of COVID-19. Signal, Image and Video Processing 1–8.
- Ezekiel (1930) Ezekiel, M. 1930. Methods of correlation analysis. .
- Fahey and Hino (2020) Fahey, R. A.; and Hino, A. 2020. COVID-19, digital privacy, and the social limits on data-focused public health responses. International Journal of Information Management 55: 102181. ISSN 0268-4012. doi:https://doi.org/10.1016/j.ijinfomgt.2020.102181. URL https://www.sciencedirect.com/science/article/pii/S0268401220310239. Impact of COVID-19 Pandemic on Information Management Research and Practice: Editorial Perspectives.
- Feng et al. (2020) Feng, K.; Zanwar, P.; Behzadan, A. H.; and Chaspari, T. 2020. Exploring speech cues in web-mined COVID-19 Conversational Vlogs. In Joint Workshop on Aesthetic and Technical Quality Assessment of Multimedia and Media Analytics for Societal Trends, 27–31.
- Feyisetan et al. (2020) Feyisetan, O.; Balle, B.; Drake, T.; and Diethe, T. 2020. Privacy- and utility-preserving textual analysis via calibrated multivariate perturbations. In WSDM 2020. URL https://www.amazon.science/publications/privacy-and-utility-preserving-textual-analysis-via-calibrated-multivariate-perturbations.
- Gabryelczyk (2020) Gabryelczyk, R. 2020. Has COVID-19 accelerated digital transformation? Initial lessons learned for public administrations. Information Systems Management 37(4): 303–309.
- Gaskin, Zare, and Delarmente (2021) Gaskin, D. J.; Zare, H.; and Delarmente, B. A. 2021. Geographic disparities in COVID-19 infections and deaths: The role of transportation. Transport policy 102: 35–46.
- Geurts, Ernst, and Wehenkel (2006) Geurts, P.; Ernst, D.; and Wehenkel, L. 2006. Extremely randomized trees. Machine learning 63: 3–42.
- Girshick et al. (2014) Girshick, R.; Donahue, J.; Darrell, T.; and Malik, J. 2014. Rich feature hierarchies for accurate object detection and semantic segmentation. In Proceedings of the IEEE conference on computer vision and pattern recognition, 580–587.
- Glandt et al. (2021) Glandt, K.; Khanal, S.; Li, Y.; Caragea, D.; and Caragea, C. 2021. Stance detection in COVID-19 tweets. In Proceedings of the 59th Annual Meeting of the Association for Computational Linguistics and the 11th International Joint Conference on Natural Language Processing (Volume 1: Long Papers), 1596–1611.
- Goel and Sharma (2020) Goel, R.; and Sharma, R. 2020. Mobility based sir model for pandemics-with case study of covid-19. In 2020 IEEE/ACM International Conference on Advances in Social Networks Analysis and Mining (ASONAM), 110–117. IEEE.
- Goodfellow et al. (2013) Goodfellow, I. J.; Erhan, D.; Carrier, P. L.; Courville, A.; Mirza, M.; Hamner, B.; Cukierski, W.; Tang, Y.; Thaler, D.; Lee, D.-H.; et al. 2013. Challenges in representation learning: A report on three machine learning contests. In International conference on neural information processing, 117–124. Springer.
- Google (2020) Google. 2020. COVID-19 community mobility reports. Ireland .
- Gou et al. (2021) Gou, J.; Yu, B.; Maybank, S. J.; and Tao, D. 2021. Knowledge distillation: A survey. International Journal of Computer Vision 129: 1789–1819.
- Greenspan and Loftus (2021) Greenspan, R. L.; and Loftus, E. F. 2021. Pandemics and infodemics: Research on the effects of misinformation on memory. Human Behavior and Emerging Technologies 3(1): 8–12.
- Haafza et al. (2021) Haafza, L. A.; Awan, M. J.; Abid, A.; Yasin, A.; Nobanee, H.; and Farooq, M. S. 2021. Big data COVID-19 systematic literature review: pandemic crisis. Electronics 10(24): 3125.
- Haleem et al. (2020) Haleem, A.; Javaid, M.; Khan, I. H.; and Vaishya, R. 2020. Significant applications of big data in COVID-19 pandemic. Indian journal of orthopaedics 54(4): 526–528.
- Han, Pei, and Tong (2022) Han, J.; Pei, J.; and Tong, H. 2022. Data mining: concepts and techniques. Morgan kaufmann.
- Han et al. (2020) Han, J.; Qian, K.; Song, M.; Yang, Z.; Ren, Z.; Liu, S.; Liu, J.; Zheng, H.; Ji, W.; Koike, T.; et al. 2020. An early study on intelligent analysis of speech under COVID-19: Severity, sleep quality, fatigue, and anxiety. In Proc. Annu. Conf. Int. Speech. Commun. Assoc., INTERSPEECH, 4946–4950.
- Haque, Milstein, and Fei-Fei (2020) Haque, A.; Milstein, A.; and Fei-Fei, L. 2020. Illuminating the dark spaces of healthcare with ambient intelligence. Nature 585(7824): 193–202.
- Herrington, Reeves, and Oliver (2007) Herrington, J.; Reeves, T. C.; and Oliver, R. 2007. Immersive learning technologies: Realism and online authentic learning. Journal of computing in Higher Education 19(1): 80–99.
- Hilbe (2011) Hilbe, J. M. 2011. Negative binomial regression. Cambridge University Press.
- Hirata et al. (2022) Hirata, A.; Kodera, S.; Diao, Y.; and Rashed, E. A. 2022. Did the Tokyo Olympic Games enhance the transmission of COVID-19? An interpretation with machine learning. Computers in biology and medicine 146: 105548.
- Hochreiter and Schmidhuber (1997) Hochreiter, S.; and Schmidhuber, J. 1997. Long short-term memory. Neural computation 9(8): 1735–1780.
- Holsti (1969) Holsti, O. R. 1969. Content analysis for the social sciences and humanities. Reading. MA: Addison-Wesley (content analysis) .
- Hox and Bechger (1998) Hox, J. J.; and Bechger, T. M. 1998. An introduction to structural equation modeling .
- Huang et al. (2022) Huang, X.; Wang, S.; Zhang, M.; Hu, T.; Hohl, A.; She, B.; Gong, X.; Li, J.; Liu, X.; Gruebner, O.; et al. 2022. Social media mining under the COVID-19 context: Progress, challenges, and opportunities. International Journal of Applied Earth Observation and Geoinformation 113: 102967.
- Hutto and Gilbert (2014) Hutto, C.; and Gilbert, E. 2014. Vader: A parsimonious rule-based model for sentiment analysis of social media text. In Proceedings of the international AAAI conference on web and social media, volume 8, 216–225.
- Ienca and Vayena (2020) Ienca, M.; and Vayena, E. 2020. On the responsible use of digital data to tackle the COVID-19 pandemic. Nature medicine 26(4): 463–464.
- Iwata and Miyakoshi (2020) Iwata, K.; and Miyakoshi, C. 2020. A simulation on potential secondary spread of novel coronavirus in an exported country using a stochastic epidemic SEIR model. Journal of clinical medicine 9(4): 944.
- Jaidka et al. (2020) Jaidka, K.; Giorgi, S.; Schwartz, H. A.; Kern, M. L.; Ungar, L. H.; and Eichstaedt, J. C. 2020. Estimating geographic subjective well-being from Twitter: A comparison of dictionary and data-driven language methods. Proceedings of the National Academy of Sciences 117(19): 10165–10171.
- Jain, Kumar, and Fernandes (2017) Jain, V. K.; Kumar, S.; and Fernandes, S. L. 2017. Extraction of emotions from multilingual text using intelligent text processing and computational linguistics. Journal of computational science 21: 316–326.
- Ji et al. (2012) Ji, S.; Xu, W.; Yang, M.; and Yu, K. 2012. 3D convolutional neural networks for human action recognition. IEEE transactions on pattern analysis and machine intelligence 35(1): 221–231.
- Karadayi, Aydin, and Öǧrenci (2020) Karadayi, Y.; Aydin, M. N.; and Öǧrenci, A. S. 2020. Unsupervised anomaly detection in multivariate spatio-temporal data using deep learning: early detection of COVID-19 outbreak in Italy. Ieee Access 8: 164155–164177.
- Kim (2015) Kim, T. K. 2015. T test as a parametric statistic. Korean journal of anesthesiology 68(6): 540–546.
- Klar and Lanzerath (2020) Klar, R.; and Lanzerath, D. 2020. The ethics of COVID-19 tracking apps – challenges and voluntariness. Research Ethics 16(3-4): 1–9. doi:10.1177/1747016120943622. URL https://doi.org/10.1177/1747016120943622.
- Knowles and Badh (2022) Knowles, T.; and Badh, G. 2022. The impact of face masks on spectral acoustics of speech: Effect of clear and loud speech styles. The Journal of the Acoustical Society of America 151(5): 3359–3368.
- König et al. (2021) König, A.; Riviere, K.; Linz, N.; Lindsay, H.; Elbaum, J.; Fabre, R.; Derreumaux, A.; Robert, P.; et al. 2021. Measuring stress in health professionals over the phone using automatic speech analysis during the COVID-19 pandemic: observational pilot study. Journal of Medical Internet Research 23(4): e24191.
- Krumpal (2013) Krumpal, I. 2013. Determinants of social desirability bias in sensitive surveys: a literature review. Quality & quantity 47(4): 2025–2047.
- Küçük and Can (2020) Küçük, D.; and Can, F. 2020. Stance detection: A survey. ACM Computing Surveys (CSUR) 53(1): 1–37.
- Kwak and Clayton-Matthews (2002) Kwak, C.; and Clayton-Matthews, A. 2002. Multinomial logistic regression. Nursing research 51(6): 404–410.
- Lam et al. (2018) Lam, D.; Kuzma, R.; McGee, K.; Dooley, S.; Laielli, M.; Klaric, M.; Bulatov, Y.; and McCord, B. 2018. xView: Objects in Context in Overhead Imagery. CoRR abs/1802.07856. URL http://arxiv.org/abs/1802.07856.
- Li et al. (2021) Li, J.; Sharma, A.; Mishra, D.; Batista, G.; and Seneviratne, A. 2021. COVID-safe spatial occupancy monitoring using OFDM-based features and passive WiFi samples. ACM Transactions on Management Information Systems (TMIS) 12(4): 1–24.
- Liu, Xia, and Lang (2021) Liu, C.; Xia, S.; and Lang, C. 2021. Clothing consumption during the COVID-19 pandemic: evidence from mining tweets. Clothing and Textiles Research Journal 39(4): 314–330.
- Liu et al. (2016) Liu, W.; Anguelov, D.; Erhan, D.; Szegedy, C.; Reed, S.; Fu, C.-Y.; and Berg, A. C. 2016. Ssd: Single shot multibox detector. In European conference on computer vision, 21–37. Springer.
- Lyu et al. (2020) Lyu, H.; Chen, L.; Wang, Y.; and Luo, J. 2020. Sense and sensibility: Characterizing social media users regarding the use of controversial terms for covid-19. IEEE Transactions on Big Data 7(6): 952–960.
- Lyu et al. (2022) Lyu, H.; Wang, J.; Wu, W.; Duong, V.; Zhang, X.; Dye, T. D.; and Luo, J. 2022. Social media study of public opinions on potential COVID-19 vaccines: informing dissent, disparities, and dissemination. Intelligent medicine 2(01): 1–12.
- Lyu, Zheng, and Luo (2022) Lyu, H.; Zheng, Z.; and Luo, J. 2022. Misinformation versus Facts: Understanding the Influence of News regarding COVID-19 Vaccines on Vaccine Uptake. Health Data Science 2022.
- MacMahon, Pugh et al. (1970) MacMahon, B.; Pugh, T. F.; et al. 1970. Epidemiology: principles and methods. Epidemiology: principles and methods. .
- Maital and Barzani (2020) Maital, S.; and Barzani, E. 2020. The global economic impact of COVID-19: A summary of research. Samuel Neaman Institute for National Policy Research 2020: 1–12.
- McHugh (2013) McHugh, M. L. 2013. The chi-square test of independence. Biochemia medica 23(2): 143–149.
- Medhat, Hassan, and Korashy (2014) Medhat, W.; Hassan, A.; and Korashy, H. 2014. Sentiment analysis algorithms and applications: A survey. Ain Shams engineering journal 5(4): 1093–1113.
- Merz, Small, and Fischbeck (1992) Merz, J. F.; Small, M. J.; and Fischbeck, P. S. 1992. Measuring decision sensitivity: a combined Monte Carlo-logistic regression approach. Medical Decision Making 12(3): 189–196.
- Miao, Last, and Litvak (2020) Miao, L.; Last, M.; and Litvak, M. 2020. Twitter data augmentation for monitoring public opinion on COVID-19 intervention measures. In Proceedings of the 1st Workshop on NLP for COVID-19 (Part 2) at EMNLP 2020.
- Minetto et al. (2021) Minetto, R.; Segundo, M. P.; Rotich, G.; and Sarkar, S. 2021. Measuring Human and Economic Activity From Satellite Imagery to Support City-Scale Decision-Making During COVID-19 Pandemic. IEEE Transactions on Big Data 7(1): 56–68. doi:10.1109/TBDATA.2020.3032839.
- Mohamed et al. (2022) Mohamed, M. M.; Nessiem, M. A.; Batliner, A.; Bergler, C.; Hantke, S.; Schmitt, M.; Baird, A.; Mallol-Ragolta, A.; Karas, V.; Amiriparian, S.; and Schuller, B. W. 2022. Face mask recognition from audio: The MASC database and an overview on the mask challenge. Pattern Recognition 122: 108361. ISSN 0031-3203. doi:https://doi.org/10.1016/j.patcog.2021.108361. URL https://www.sciencedirect.com/science/article/pii/S0031320321005410.
- Morris (1991) Morris, M. D. 1991. Factorial sampling plans for preliminary computational experiments. Technometrics 33(2): 161–174.
- Nepal et al. (2022) Nepal, S.; Wang, W.; Vojdanovski, V.; Huckins, J. F.; daSilva, A.; Meyer, M.; and Campbell, A. 2022. COVID Student Study: A Year in the Life of College Students during the COVID-19 Pandemic Through the Lens of Mobile Phone Sensing. In CHI Conference on Human Factors in Computing Systems, 1–19.
- Newman (2018) Newman, M. 2018. Networks. Oxford university press.
- Parra, Salmerón, and Velasco (2014) Parra, J. M.; Salmerón, O. J.; and Velasco, M. 2014. The first case of Ebola virus disease acquired outside Africa. New England Journal of Medicine 371(25): 2439–2440.
- Pearl (2010) Pearl, J. 2010. Causal inference. Causality: objectives and assessment 39–58.
- Pennebaker, Francis, and Booth (2001) Pennebaker, J. W.; Francis, M. E.; and Booth, R. J. 2001. Linguistic inquiry and word count: LIWC 2001. Mahway: Lawrence Erlbaum Associates 71(2001): 2001.
- Pörschmann, Lübeck, and Arend (2020) Pörschmann, C.; Lübeck, T.; and Arend, J. M. 2020. Impact of face masks on voice radiation. The Journal of the Acoustical Society of America 148(6): 3663–3670.
- Rabiolo et al. (2021) Rabiolo, A.; Alladio, E.; Morales, E.; McNaught, A. I.; Bandello, F.; Afifi, A. A.; Marchese, A.; et al. 2021. Forecasting the COVID-19 epidemic by integrating symptom search behavior into predictive models: Infoveillance study. Journal of medical Internet research 23(8): e28876.
- Ramchandani, Fan, and Mostafavi (2020) Ramchandani, A.; Fan, C.; and Mostafavi, A. 2020. Deepcovidnet: An interpretable deep learning model for predictive surveillance of covid-19 using heterogeneous features and their interactions. Ieee Access 8: 159915–159930.
- Ranjit et al. (2021) Ranjit, Y. S.; Shin, H.; First, J. M.; and Houston, J. B. 2021. COVID-19 protective model: the role of threat perceptions and informational cues in influencing behavior. Journal of Risk Research 24(3-4): 449–465.
- Rashed and Hirata (2021) Rashed, E. A.; and Hirata, A. 2021. One-year lesson: machine learning prediction of COVID-19 positive cases with meteorological data and mobility estimate in Japan. International Journal of Environmental Research and Public Health 18(11): 5736.
- Redmon et al. (2016) Redmon, J.; Divvala, S.; Girshick, R.; and Farhadi, A. 2016. You only look once: Unified, real-time object detection. In Proceedings of the IEEE conference on computer vision and pattern recognition, 779–788.
- Ren et al. (2015) Ren, S.; He, K.; Girshick, R.; and Sun, J. 2015. Faster r-cnn: Towards real-time object detection with region proposal networks. Advances in neural information processing systems 28.
- Rodríguez et al. (2021) Rodríguez, A.; Tabassum, A.; Cui, J.; Xie, J.; Ho, J.; Agarwal, P.; Adhikari, B.; and Prakash, B. A. 2021. DeepCOVID: An Operational Deep Learning-driven Framework for Explainable Real-time COVID-19 Forecasting. Proceedings of the AAAI Conference on Artificial Intelligence 35(17): 15393–15400. doi:10.1609/aaai.v35i17.17808. URL https://ojs.aaai.org/index.php/AAAI/article/view/17808.
- Rosen et al. (2022) Rosen, A. O.; Holmes, A. L.; Balluerka, N.; Hidalgo, M. D.; Gorostiaga, A.; Gómez-Benito, J.; and Huedo-Medina, T. B. 2022. Is social media a new type of social support? social media use in Spain during the COVID-19 pandemic: A mixed methods study. International Journal of Environmental Research and Public Health 19(7): 3952.
- Saltelli (2002) Saltelli, A. 2002. Sensitivity analysis for importance assessment. Risk analysis 22(3): 579–590.
- Samek, Wiegand, and Müller (2018) Samek, W.; Wiegand, T.; and Müller, K.-R. 2018. Explainable artificial intelligence: Understanding, visualizing and interpreting deep learning models. ITU Journal: ICT Discoveries 1: 39–48.
- Sanders et al. (2021) Sanders, J. G.; Tosi, A.; Obradovic, S.; Miligi, I.; and Delaney, L. 2021. Lessons from the UK’s lockdown: discourse on behavioural science in times of COVID-19. Frontiers in Psychology 12: 647348.
- Saponara, Elhanashi, and Gagliardi (2021) Saponara, S.; Elhanashi, A.; and Gagliardi, A. 2021. Implementing a real-time, AI-based, people detection and social distancing measuring system for Covid-19. Journal of Real-Time Image Processing 18(6): 1937–1947.
- Sardar et al. (2022) Sardar, A. W.; Ullah, F.; Bacha, J.; Khan, J.; Ali, F.; and Lee, S. 2022. Mobile sensors based platform of Human Physical Activities Recognition for COVID-19 pandemic spread minimization. Computers in Biology and Medicine 105662.
- Schuller et al. (2021) Schuller, B. W.; Schuller, D. M.; Qian, K.; Liu, J.; Zheng, H.; and Li, X. 2021. Covid-19 and computer audition: An overview on what speech & sound analysis could contribute in the sars-cov-2 corona crisis. Frontiers in digital health 14.
- Shang et al. (2021) Shang, W.-L.; Chen, J.; Bi, H.; Sui, Y.; Chen, Y.; and Yu, H. 2021. Impacts of COVID-19 pandemic on user behaviors and environmental benefits of bike sharing: A big-data analysis. Applied Energy 285: 116429.
- Shannon (1948) Shannon, C. E. 1948. A mathematical theory of communication. The Bell system technical journal 27(3): 379–423.
- Sheng et al. (2021) Sheng, J.; Amankwah-Amoah, J.; Khan, Z.; and Wang, X. 2021. COVID-19 pandemic in the new era of big data analytics: Methodological innovations and future research directions. British Journal of Management 32(4): 1164–1183.
- Shi et al. (2015) Shi, X.; Chen, Z.; Wang, H.; Yeung, D.-Y.; Wong, W.-K.; and Woo, W.-c. 2015. Convolutional LSTM network: A machine learning approach for precipitation nowcasting. Advances in neural information processing systems 28.
- Shorfuzzaman, Hossain, and Alhamid (2021) Shorfuzzaman, M.; Hossain, M. S.; and Alhamid, M. F. 2021. Towards the sustainable development of smart cities through mass video surveillance: A response to the COVID-19 pandemic. Sustainable cities and society 64: 102582.
- Shorten, Khoshgoftaar, and Furht (2021) Shorten, C.; Khoshgoftaar, T. M.; and Furht, B. 2021. Deep learning applications for covid-19. Journal of Big Data 8(1). doi:10.1186/s40537-020-00392-9.
- Silva et al. (2022) Silva, C. J.; Cantin, G.; Cruz, C.; Fonseca-Pinto, R.; Passadouro, R.; Dos Santos, E. S.; and Torres, D. F. 2022. Complex network model for COVID-19: human behavior, pseudo-periodic solutions and multiple epidemic waves. Journal of mathematical analysis and applications 514(2): 125171.
- Singh and Singh (2020) Singh, J.; and Singh, J. 2020. COVID-19 and its impact on society. Electronic Research Journal of Social Sciences and Humanities 2.
- St, Wold et al. (1989) St, L.; Wold, S.; et al. 1989. Analysis of variance (ANOVA). Chemometrics and intelligent laboratory systems 6(4): 259–272.
- Starr et al. (2021) Starr, T. N.; Greaney, A. J.; Addetia, A.; Hannon, W. W.; Choudhary, M. C.; Dingens, A. S.; Li, J. Z.; and Bloom, J. D. 2021. Prospective mapping of viral mutations that escape antibodies used to treat COVID-19. Science 371(6531): 850–854.
- Szegedy et al. (2016) Szegedy, C.; Vanhoucke, V.; Ioffe, S.; Shlens, J.; and Wojna, Z. 2016. Rethinking the Inception Architecture for Computer Vision. In Proceedings of the IEEE Conference on Computer Vision and Pattern Recognition (CVPR).
- Tahir et al. (2022) Tahir, A.; Cheng, L.; Sheth, P.; and Liu, H. 2022. Improving Vaccine Stance Detection by Combining Online and Offline Data. In International Conference on Social Computing, Behavioral-Cultural Modeling and Prediction and Behavior Representation in Modeling and Simulation. Springer.
- Tan and Le (2019) Tan, M.; and Le, Q. 2019. EfficientNet: Rethinking Model Scaling for Convolutional Neural Networks. In Chaudhuri, K.; and Salakhutdinov, R., eds., Proceedings of the 36th International Conference on Machine Learning, volume 97 of Proceedings of Machine Learning Research, 6105–6114. PMLR. URL https://proceedings.mlr.press/v97/tan19a.html.
- Tang et al. (2020) Tang, B.; Bragazzi, N. L.; Li, Q.; Tang, S.; Xiao, Y.; and Wu, J. 2020. An updated estimation of the risk of transmission of the novel coronavirus (2019-nCov). Infectious disease modelling 5: 248–255.
- Teh, Kempa-Liehr, and Wang (2020) Teh, H. Y.; Kempa-Liehr, A. W.; and Wang, K. I.-K. 2020. Sensor data quality: A systematic review. Journal of Big Data 7(1): 1–49.
- Tilak, Abu-Ghazaleh, and Heinzelman (2002) Tilak, S.; Abu-Ghazaleh, N. B.; and Heinzelman, W. 2002. A Taxonomy of Wireless Micro-Sensor Network Models. SIGMOBILE Mob. Comput. Commun. Rev. 6(2): 28–36. ISSN 1559-1662. doi:10.1145/565702.565708. URL https://doi.org/10.1145/565702.565708.
- Tomeny, Vargo, and El-Toukhy (2017) Tomeny, T. S.; Vargo, C. J.; and El-Toukhy, S. 2017. Geographic and demographic correlates of autism-related anti-vaccine beliefs on Twitter, 2009-15. Social science & medicine 191: 168–175.
- Tripathy and Camorlinga (2021) Tripathy, D.; and Camorlinga, S. G. 2021. Prediction of COVID-19 Cases based on Human Behavior using DNN Regressor for Canada. In 2021 IEEE International Conference on Communications Workshops (ICC Workshops), 1–6. IEEE.
- Tsao et al. (2021) Tsao, S.-F.; Chen, H.; Tisseverasinghe, T.; Yang, Y.; Li, L.; and Butt, Z. A. 2021. What social media told us in the time of COVID-19: a scoping review. The Lancet Digital Health 3(3): e175–e194.
- Ulhaq et al. (2020) Ulhaq, A.; Born, J.; Khan, A.; Gomes, D. P. S.; Chakraborty, S.; and Paul, M. 2020. COVID-19 Control by Computer Vision Approaches: A Survey. IEEE Access 8: 179437–179456. doi:10.1109/ACCESS.2020.3027685.
- Unacast (2020) Unacast, X. 2020. Unacast Social Distancing Dataset. Unacast .
- Urbanin et al. (2022) Urbanin, G.; Meira, W.; Serpa, A.; de Souza Costa, D.; Baldaçara, L.; da Silva, A. P.; Guatimosim, R.; Lacerda, A. M.; Oliveira, E. A.; Braule, A.; et al. 2022. Social Determinants in Self-Protective Behavior Related to COVID-19: Association Rule–Mining Study. JMIR Public Health and Surveillance 8(6): e34020.
- Usherwood, LaJoie, and Srivastava (2021) Usherwood, T.; LaJoie, Z.; and Srivastava, V. 2021. A model and predictions for COVID-19 considering population behavior and vaccination. Scientific Reports 11(1): 1–11.
- Van Dorn, Cooney, and Sabin (2020) Van Dorn, A.; Cooney, R. E.; and Sabin, M. L. 2020. COVID-19 exacerbating inequalities in the US. The Lancet 395(10232): 1243–1244.
- Vargo et al. (2021) Vargo, D.; Zhu, L.; Benwell, B.; and Yan, Z. 2021. Digital technology use during COVID-19 pandemic: A rapid review. Human Behavior and Emerging Technologies 3(1): 13–24.
- Varia et al. (2003) Varia, M.; Wilson, S.; Sarwal, S.; McGeer, A.; Gournis, E.; Galanis, E.; et al. 2003. Investigation of a nosocomial outbreak of severe acute respiratory syndrome (SARS) in Toronto, Canada. Cmaj 169(4): 285–292.
- Vázquez-Martínez, Morales-Mediano, and Leal-Rodríguez (2021) Vázquez-Martínez, U. J.; Morales-Mediano, J.; and Leal-Rodríguez, A. L. 2021. The impact of the COVID-19 crisis on consumer purchasing motivation and behavior. European Research on Management and Business Economics 27(3): 100166.
- Verma and Prakash (2020) Verma, A. K.; and Prakash, S. 2020. Impact of covid-19 on environment and society. Journal of Global Biosciences 9(5): 7352–7363.
- Vincent et al. (2010) Vincent, P.; Larochelle, H.; Lajoie, I.; Bengio, Y.; Manzagol, P.-A.; and Bottou, L. 2010. Stacked denoising autoencoders: Learning useful representations in a deep network with a local denoising criterion. Journal of machine learning research 11(12).
- Viola and Jones (2001) Viola, P.; and Jones, M. 2001. Rapid object detection using a boosted cascade of simple features. In Proceedings of the 2001 IEEE computer society conference on computer vision and pattern recognition. CVPR 2001, volume 1, I–I. Ieee.
- Walsh et al. (2020) Walsh, C. G.; Chaudhry, B.; Dua, P.; Goodman, K. W.; Kaplan, B.; Kavuluru, R.; Solomonides, A.; and Subbian, V. 2020. Stigma, biomarkers, and algorithmic bias: recommendations for precision behavioral health with artificial intelligence. JAMIA open 3(1): 9–15.
- Wan et al. (2018) Wan, L.; Wang, Q.; Papir, A.; and Moreno, I. L. 2018. Generalized end-to-end loss for speaker verification. In 2018 IEEE International Conference on Acoustics, Speech and Signal Processing (ICASSP), 4879–4883. IEEE.
- Wang et al. (2020) Wang, Y.; Yao, Q.; Kwok, J. T.; and Ni, L. M. 2020. Generalizing from a few examples: A survey on few-shot learning. ACM computing surveys (csur) 53(3): 1–34.
- Wang et al. (2019) Wang, Z.; Hale, S.; Adelani, D. I.; Grabowicz, P.; Hartman, T.; Flöck, F.; and Jurgens, D. 2019. Demographic inference and representative population estimates from multilingual social media data. In The world wide web conference, 2056–2067.
- Wang, Yan, and Oates (2017) Wang, Z.; Yan, W.; and Oates, T. 2017. Time series classification from scratch with deep neural networks: A strong baseline. In 2017 International joint conference on neural networks (IJCNN), 1578–1585. IEEE.
- Wong and Kerkez (2016) Wong, B. P.; and Kerkez, B. 2016. Real-time environmental sensor data: An application to water quality using web services. Environmental Modelling & Software 84: 505–517.
- Wu, Lyu, and Luo (2021) Wu, W.; Lyu, H.; and Luo, J. 2021. Characterizing discourse about covid-19 vaccines: A reddit version of the pandemic story. Health Data Science 2021.
- Xing, Liang, and Yang (2020) Xing, C.; Liang, X.; and Yang, R. 2020. Compact One-Stage Object Detection Network. In 2020 IEEE 8th International Conference on Computer Science and Network Technology (ICCSNT), 115–118. doi:10.1109/ICCSNT50940.2020.9304979.
- Xiong et al. (2021) Xiong, Z.; Li, P.; Lyu, H.; and Luo, J. 2021. Social media opinions on working from home in the united states during the covid-19 pandemic: Observational study. JMIR medical informatics 9(7): e29195.
- Xu et al. (2021) Xu, Z.; Su, C.; Xiao, Y.; and Wang, F. 2021. Artificial intelligence for COVID-19: Battling the pandemic with computational intelligence. Intelligent Medicine .
- Yan et al. (2021) Yan, Y.; Malik, A. A.; Bayham, J.; Fenichel, E. P.; Couzens, C.; and Omer, S. B. 2021. Measuring voluntary and policy-induced social distancing behavior during the COVID-19 pandemic. Proceedings of the National Academy of Sciences 118(16): e2008814118.
- Yang et al. (2021) Yang, D.; Yurtsever, E.; Renganathan, V.; Redmill, K. A.; and Özgüner, Ü. 2021. A vision-based social distancing and critical density detection system for COVID-19. Sensors 21(13): 4608.
- Yang et al. (2020) Yang, Y.; Li, O.; Peng, X.; and Wang, L. 2020. Consumption trends during the COVID-19 crisis: How awe, coping, and social norms drive utilitarian purchases. Frontiers in psychology 11: 588580.
- Yang et al. (2019) Yang, Z.; Dai, Z.; Yang, Y.; Carbonell, J.; Salakhutdinov, R. R.; and Le, Q. V. 2019. Xlnet: Generalized autoregressive pretraining for language understanding. Advances in neural information processing systems 32.
- Yeung, Lai, and Luo (2020) Yeung, N.; Lai, J.; and Luo, J. 2020. Face off: Polarized public opinions on personal face mask usage during the COVID-19 pandemic. In 2020 IEEE International Conference on Big Data (Big Data), 4802–4810. IEEE.
- Zhang et al. (2021a) Zhang, L.; Zhu, Y.; Jiang, M.; Wu, Y.; Deng, K.; and Ni, Q. 2021a. Body temperature monitoring for regular COVID-19 prevention based on human daily activity recognition. Sensors 21(22): 7540.
- Zhang, Lyu, and Luo (2021) Zhang, X.; Lyu, H.; and Luo, J. 2021. Understanding the hoarding behaviors during the COVID-19 pandemic using large scale social media data. In 2021 IEEE International Conference on Big Data (Big Data), 5007–5013. IEEE.
- Zhang et al. (2021b) Zhang, Y.; Lyu, H.; Liu, Y.; Zhang, X.; Wang, Y.; Luo, J.; et al. 2021b. Monitoring depression trends on twitter during the COVID-19 pandemic: observational study. JMIR infodemiology 1(1): e26769.
- Zhou and Feng (2017) Zhou, Z.-H.; and Feng, J. 2017. Deep Forest: Towards An Alternative to Deep Neural Networks. In IJCAI, 3553–3559.