Frozen by heating: temperature controlled dynamic states in droplet microswimmers
Abstract
Self-propelling active matter relies on the conversion of energy from the undirected, nanoscopic scale to directed, macroscopic motion. One of the challenges in the design of synthetic active matter lies in the control of dynamic states, or motility gaits. Here, we present an experimental system of self-propelling droplets with thermally controllable and reversible dynamic states, from unsteady over meandering to persistent to arrested motion. These states depend on the Péclet number of the molecular process powering the motion, which we can tune by using a temperature sensitive mixture of surfactants as a fuel medium. We quantify the droplet dynamics by analysing flow and chemical fields for the individual states, comparing them to canonical models for autophoretic particles. In the context of these models, we experimentally observe, in situ, the fundamental first broken symmetry that translates an isotropic, immotile base state to self-propelled motility.
Active matter is defined by the nonlinear conversion of free energy on the molecular scale into macroscopic dynamics - which means that small changes in molecular processes can crucially tip the overall system into a different area in phase space, corresponding to often counter-intuitive dynamical state changes.
It is easy to move agents by external fields: with some more effort we can have them convert free energy on the molecular scale into self-propelled, autonomous motion. However, like a sorcerer’s apprentice von Goethe (1798) we find that stopping this motion is not a trivial task; after all, one is required to deplete an energy reservoir or reverse a dynamic instability.
This kind of control is important in the design and study of artificial and biological microswimmers, their theoretical modeling, experimental realization, and, ultimately, to provide design principles and dynamic control for technological application. Autophoretic particles Bechinger et al. (2016); Moran and Posner (2019); Zhang and Hess (2021); Zöttl and Stark (2023) and, particularly, their experimental counterpart, active droplets Maass et al. (2016); Babu et al. (2022); Birrer et al. (2022); Dwivedi et al. (2022); Michelin (2023); Hanczyc et al. (2007); Thutupalli et al. (2011); Peddireddy et al. (2012); Izri et al. (2014); Herminghaus et al. (2014), are popular active matter models driven by purely physicochemical mechanisms. Generally, their dynamics are characterized by a dimensionless Péclet number Pe, quantifying the ratio of advective and diffusive transport of chemical fuel Michelin et al. (2013). With increasing Pe, autophoretic particles first transition from passive isotropic chemical conversion to active self-propulsion, and further from persistent to unsteady motion via a sequence of broken symmetries and interfacial flow modes of increasing complexity Michelin et al. (2013); Izri et al. (2014); Suga et al. (2018); Izzet et al. (2020); Meredith et al. (2020); Hokmabad et al. (2021); Suda et al. (2021).
Recent studies have investigated the control of speed and dynamic states of such microswimmers in response to externally applied stimuli such as temperature Tu et al. (2017); Cholakova et al. (2021) or illumination Florea et al. (2014); Kaneko et al. (2017); Xiao et al. (2018); Lancia et al. (2019); Alvarez et al. (2021); Ryabchun et al. (2022); van Kesteren et al. (2023). On heating, physical intuition suggests that motion should accelerate and destabilize, either by the increase of translational and rotational diffusion with decreasing viscosity, or by increased activity from the molecular thermodynamics driving the motion. However, the nonlinear dynamics of self-organized activity can drive counter-intuitive effects, as we have previously found for active droplets which destabilize with increasing viscosity due to an associated increase in Pe Hokmabad et al. (2021).
In this study, we explore a counter-intuitive response to increasing temperature. We study active droplets using a temperature sensitive combination of co-surfactants as a fuel medium. We reversibly control the transition between three distinct dynamic states from unsteady to oscillatory to steady, straight swimming to eventual arrest with increasing ambient temperature. Notably, we are able to control Pe to experimentally observe the fundamental first symmetry breaking of the inactive isotropic base state into directed self-propulsion in both chemical and hydrodynamic fields.
I Results
I.1 Self-propelling droplets in co-surfactant solutions
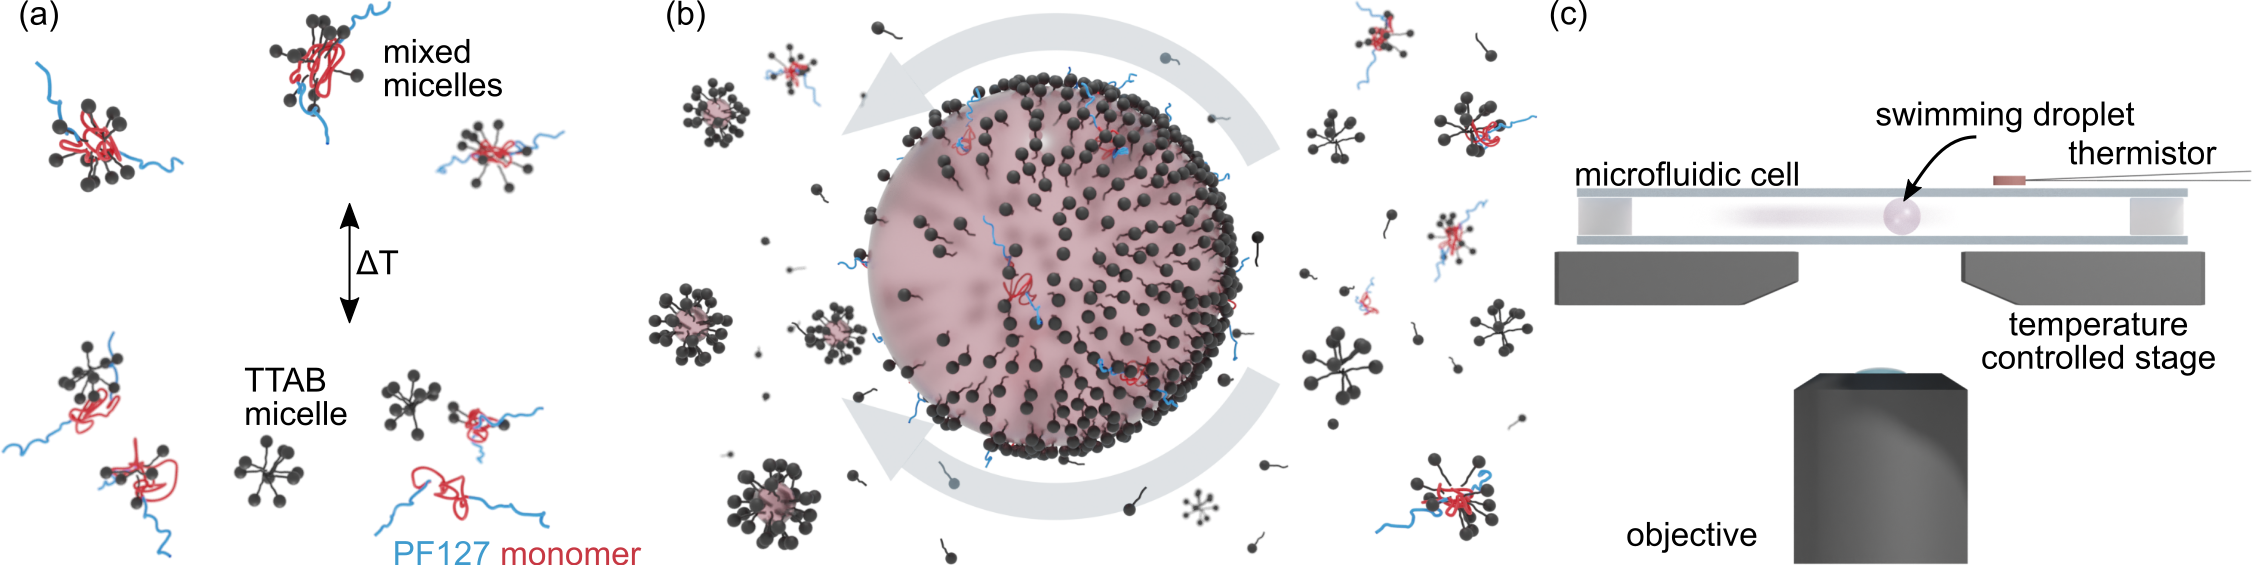
Our experimental system consists of oil droplets (CB15) immersed in an aqueous solution of the ionic surfactant tetradecyltrimethylammonium bromide (TTAB) at 9-1 (267–) and the triblock copolymer Pluronic F127 (PF127) at , or .
CB15 droplets self-propel reliably in supramicellar solutions of pure TTAB above Jin et al. (2017); Hokmabad et al. (2021). Briefly put, the swimming is due to oil diffusing from the droplet into TTAB micelles Peddireddy et al. (2012); Herminghaus et al. (2014); Izzet et al. (2020), which removes surfactant from the droplet posterior, while the anterior is replenished by the advection of fresh surfactant (Fig. 1b). The key point here is that the empty micelles at the anterior are more thermodynamically stable than the oil-filled ones at the posterior Izzet et al. (2020); Rosen and Kunjappu (2012): in consequence the critical micelle concentration is higher in front of a moving droplet. The resulting self-enhancing surface tension gradient drives the droplet forward until it is dissolved. Typically, a CB15 droplet of diameter will swim in TTAB for 1-2 hours. Thus, empty TTAB micelles serve as fresh, and oil-filled ones as spent fuel. Based on this mechanism, one can define a Pe of droplet motion that increases with viscosity, droplet size and surfactant concentration, i.e. chemical activity Izri et al. (2014); Izzet et al. (2020); Hokmabad et al. (2021, 2022a); Suda et al. (2021).
PF127 is a nonionic, triblock copolymer surfactant that in a pure aqueous solution forms micelles with a hydrophobic core of propylene oxide (PPO) and an outer shell of hydrated ethylene oxide (PEO) Alexandridis et al. (1994); Wanka et al. (1994); Bohorquez et al. (1999); Stoeber et al. (2006); Jalaal et al. (2016, 2018) above the critical micelle temperature, at PF127 Bohorquez et al. (1999). In the presence of ionic co-surfactants like TTAB, which bind strongly with PF127, mixed TTAB/PF127 aggregates form (Fig. 1 ()a, SI section 3, Figs. S2, S3 and S4), with excess TTAB forming single-species micelles Nambam and Philip (2012); Hecht and Hoffmann (1994); Li et al. (2001); Tam and Wyn-Jones (2006). It has been found Li et al. (2001) that the TTAB binding capacity of PF127 is amplified with increasing temperature, due to an increasing dehydration of the PPO blocks (hydrophobic effect Butt et al. (2003); Alexandridis et al. (1994)).
Under our experimental conditions, we expect a significant coverage of TTAB at the interface (SI Fig. S5 ()). Furthermore, CB15 droplets are completely immotile and hardly solubilize in pure PF127 solutions (SI Fig. S6 ()), while in a mixed TTAB/PF127 medium self-propelling at speeds , comparable to experiments in pure TTAB solutions (cf. Jin et al. (2017); Hokmabad et al. (2021) and SI Fig. S7 ()). We therefore regard TTAB as the primary surfactant involved in the solubilization and the interfacial gradients driving the droplet motion. This activity is controlled by PF127 binding and relasing TTAB micelles in the bulk medium (Fig. 1a,b). Thus, the Péclet number Pe of droplet activity decreases with increasing temperature, as an increasing fraction of TTAB is bound in mixed micelles.
According to literature on the composition of PF127/TTAB aggregates Hecht and Hoffmann (1994); Li et al. (2001); Hecht et al. (1995), the amount of bound TTAB in our swimming medium should exceed and further increase with temperature, which is on the order of the amounts required () to suppress droplet motility Herminghaus et al. (2014); Hokmabad et al. (2021), as observed in the experiments we show below (see also Fig. S1). We further note that the swimming medium is Newtonian, with only weakly temperature dependent viscosity (SI Fig. S8 ()).
I.2 Swimming dynamics controlled by temperature and fuel concentration
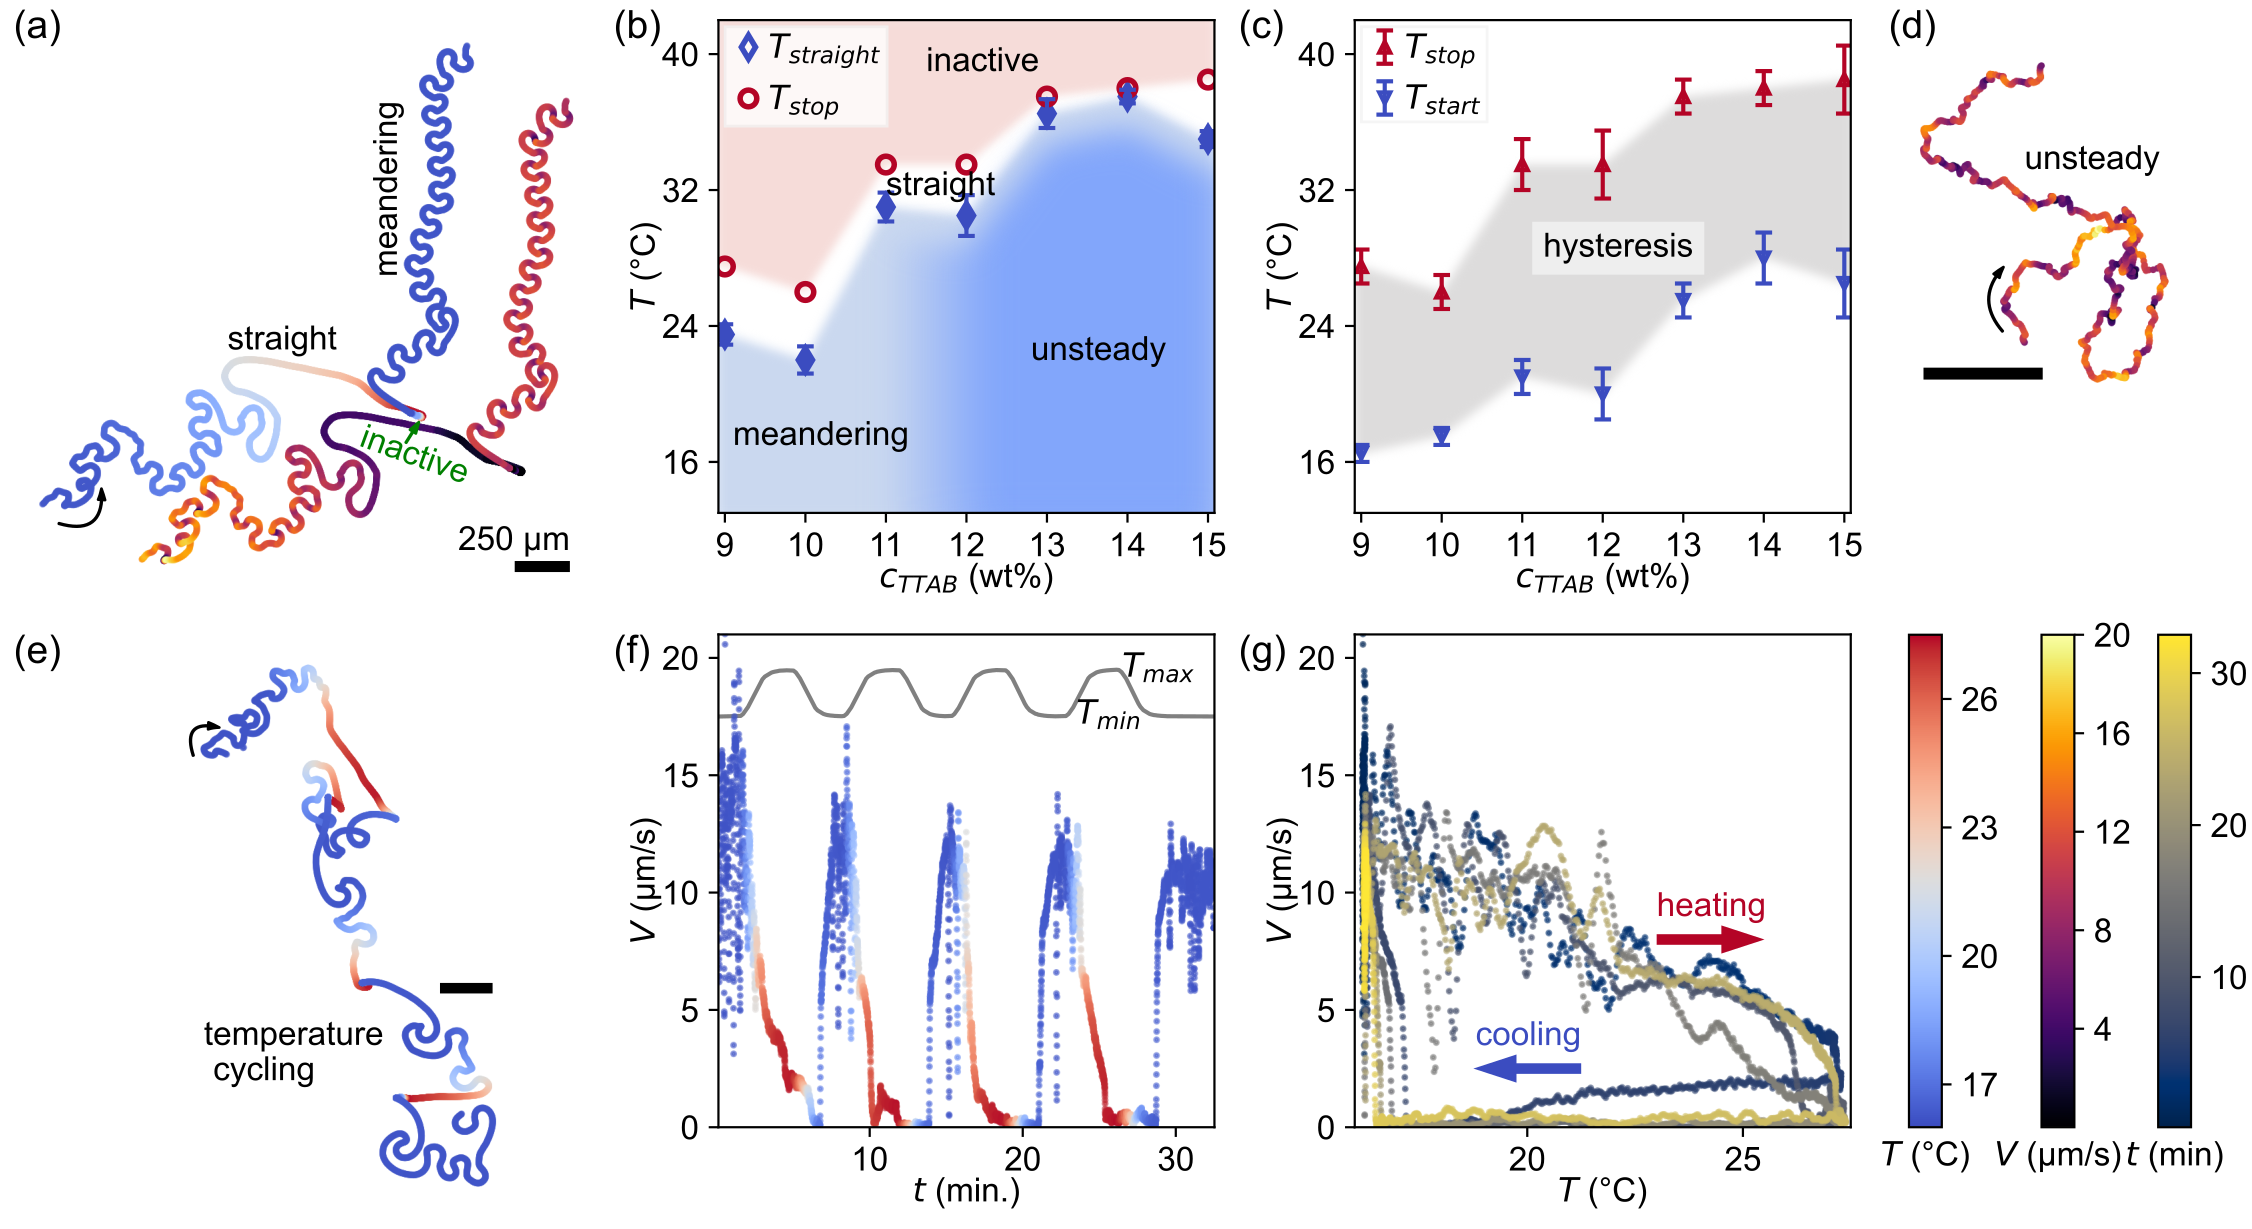
(e) Droplet trajectory during multiple heating/cooling cycles set at and TTAB. See also Movie S3. (f) Corresponding droplet speed vs. time, with inset plot of the recorded temperature ramps. (g) Droplet speed vs. recorded temperature showing a hysteresis in the re-onset of motion during cooling: the arrest during cooling is extended, with a sudden recovery of the initial speed at .
We begin with an overview of the general swimming dynamics taken from wide-field video microscopy under changing the ambient temperature, and for a range of TTAB concentrations. The setup contains a quasi-2D microfluidic cell on a temperature controlled stage (Fig. 1 ()c). Fig. 2 ()a (Movie S1) plots a trajectory colour-coded once by speed and once by temperature, recorded at a set heating/cooling rate of , using a swimming medium containing TTAB.
We start at . Below , the droplet meanders. Above, the motion is straight, gradually slows down and eventually stops at . During a subsequent cooling ramp, the droplet remains immotile down to a significantly lower temperature , where it abruptly starts to meander again.
As well as by temperature, the swimming dynamics are also susceptible to the TTAB concentration. Previous studies on single-surfactant systems found a transition from straight to reorienting to unsteady swimming Izzet et al. (2020); Hokmabad et al. (2022a) in response to an increase in fuel surfactant. This increase corresponds to increased Pe, leading to the emergence of destabilising higher order modes in the interfacial flow and chemical fields, as predicted by canonical models for isotropic autophoretic particles Michelin et al. (2013); Michelin (2023); Morozov and Michelin (2019).
At low temperatures, the presence of a co-surfactant does not change these dynamics, as we find a transition from meandering to unsteady motion (Fig. 2d, Movie S2) with increasing TTAB concentration. We have summarized these swimming dynamics in a map spanned by temperature and surfactant concentration in Fig. 2 ()b. With increasing temperature, we observe a universal transition via straight swimming to eventual arrest. We posit that the temperature dependent TTAB depletion lowers Pe below the critical thresholds of higher order interfacial modes, down to for straight swimming and finally , below the fundamental advection-diffusion instability. We do not provide a quantitative estimate of Pe following Hokmabad et al. (2021), as we cannot quantify the temperature dependence of the underlying physical chemistry parameters. Fig. 2b also shows the transition temperatures to increase with TTAB concentration: for the droplet to arrest, more TTAB needs to be removed from the swimming medium. We found the stop/start hysteresis for all TTAB concentrations in use (Fig. 2c).
These state transitions are well reversible with temperature, up to some slowdown attributable to droplet shrinkage. The experiment shown in Fig. 2 ()e-g and Movie S3 was recorded at a faster rate of to permit multiple heating and cooling cycles, with dynamics similar to the system cooled at slower rates. Fig. 2 ()e and f show the droplet trajectory color coded by temperature and a corresponding plot of speed over time. The initial motion is recovered after each heating and cooling cycle, apart from a very gradual decrease in maximum speed which we may attribute to droplet shrinkage. We have further analyzed speed versus temperature in Fig. 2 ()g), and found a hysteresis cycle with a delayed re-onset of motion reproducible over multiple heating/cooling ramps.
I.3 Chemical and flow fields
We continue with a discussion of the chemical dynamics during the droplet arrest, to motivate the hysteresis in the re-onset of motion; and of the corresponding flow field to investigate the interfacial mode evolution.
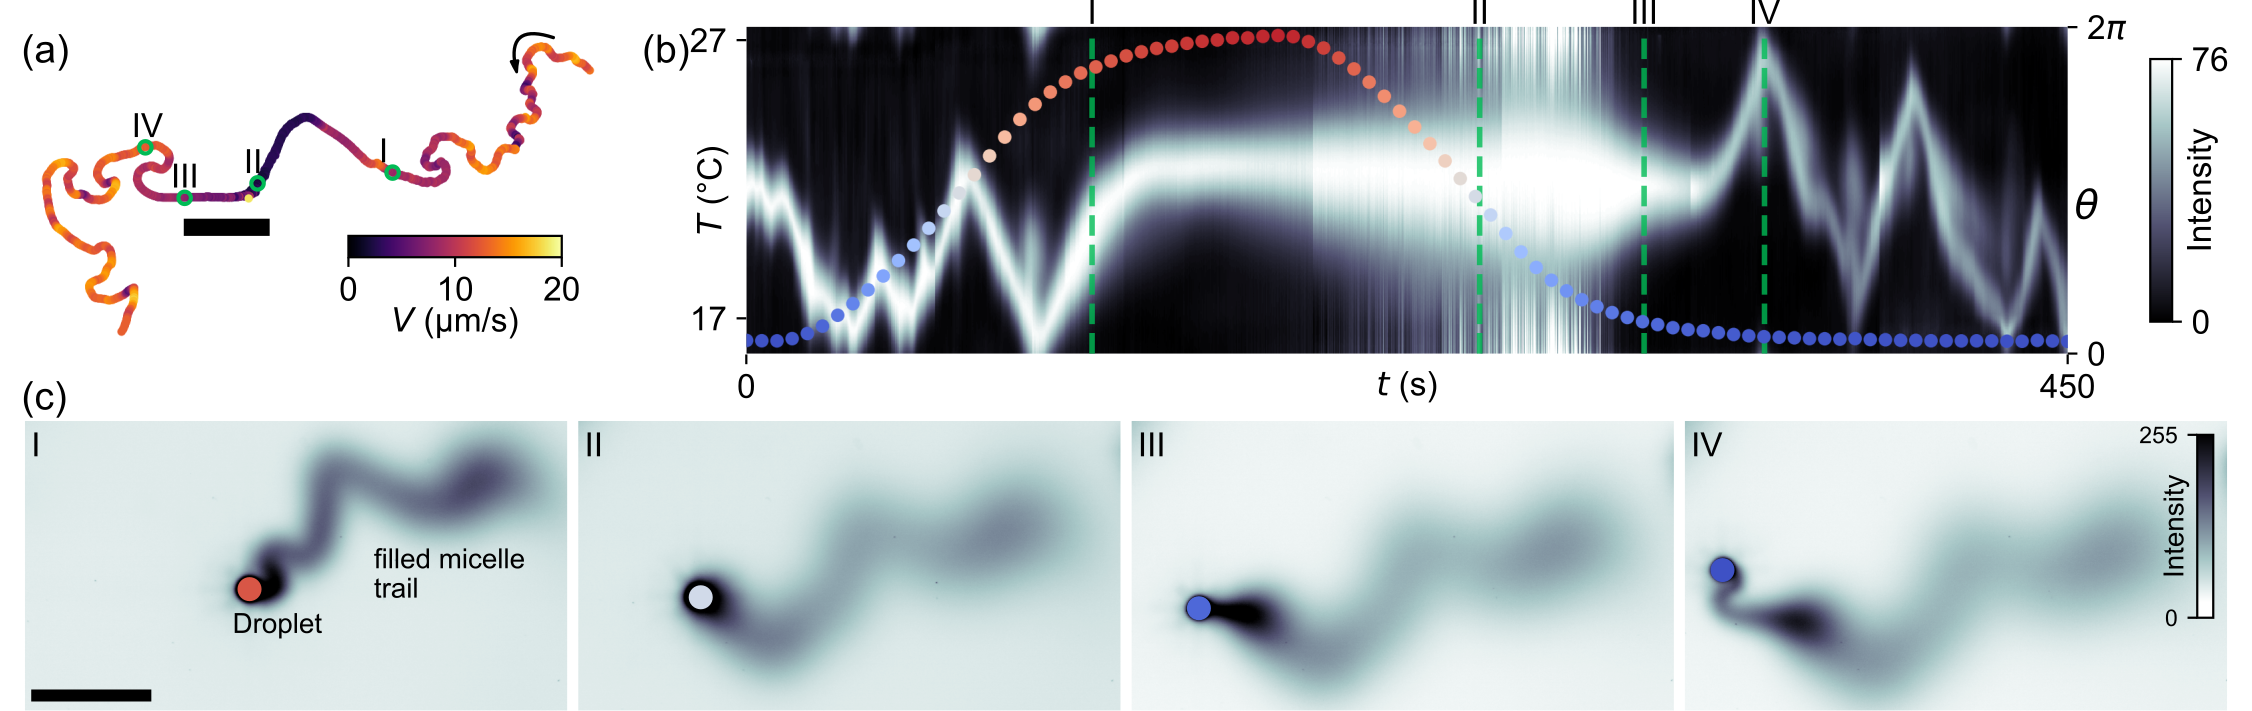
The field of spent chemical fuel affects the interfacial Marangoni gradients driving the droplet Izzet et al. (2020); Hokmabad et al. (2021); Ramesh et al. (2023). We visualise it by doping the droplet with the fluorescent dye Nile Red Hokmabad et al. (2022b), which co-moves with the oil phase into the filled micelles, and extracting the fluorescence intensity under videomicroscopy (Movie S4). In Fig. 3, we analyze the chemical dynamics for one droplet during a heating and cooling cycle, by a speed-coded trajectory (a), a kymograph of around the droplet perimeter, vs. time and recorded temperature (b), and with micrographs at the times marked I–IV (c).
During heating, the droplet transitions from unsteady to straight swimming to immotility (Fig. 3a). We note that this particular experiment featured some global drift causing translation even in the immotile state (see Movie S4). In the kymograph (Fig. 3b), at , the band corresponding to the chemical trail translates in the angular space due to the reorientation of the droplet (I). At , the droplet slows down and comes to a halt. As the system is cooled down to , the inactive droplet still solubilises isotropically, and oil-filled micelles accumulate around the perimeter . Correspondingly, the band in the kymograph widens over the entire angular space (II). The accumulated filled micelles block empty micelles from reaching the interface Ramesh et al. (2023); Morozov (2020), such that in the presence of oil-filled micelles even more mixed micelles need to disintegrate to restart activity. Thus, the motility transition temperature is lowered, here to , where the droplet escapes the oil-filled micelle cloud (III) and swims away (IV).
Before discussing the flow fields, we note two more consequences of oil saturation. First, the hysteresis in Fig. 2 ()c) can be reduced (e.g. to approximately half of at TTAB) if the system is not heated to full inactivity, but it is never entirely suppressed. This can be understood as follows: during the late stage of the heating ramp, the droplet is already dispersing oil into its local environment by recirculation, starting from the posterior - an effect we have also found in self-throttling pumping droplets in Ramesh et al. (2023). During heating, the droplets will come to a stop even before activity has fully ceded (see the discussion of Fig. 4 ()b below), and self-propulsion would always need to restart from inside an oil-rich region as shown in Fig. 3 ()c-II.
The regime of straight swimming appears to be highly localized on cooling (Movies S1 and S6): the droplet switches after a few seconds to a meandering motion (Movie S1). We argue here that outside the strongly localized cloud of spent fuel (see Movie S4 and Fig. 3c), more empty TTAB micelles have been released, such that the droplet experiences a higher Pe once it escapes its self-generated local trap.
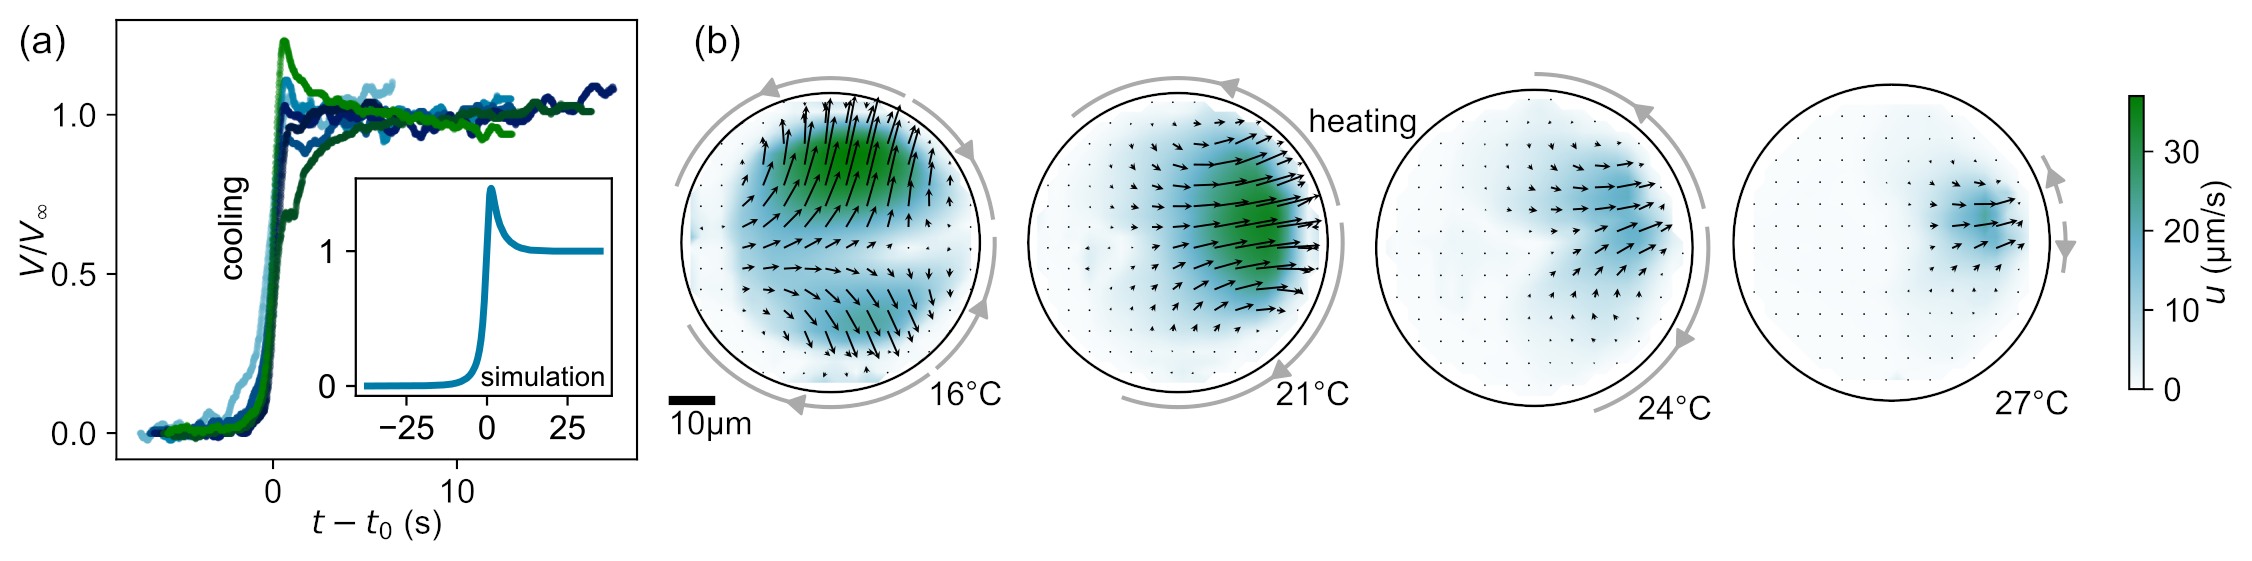
To analyze the mode evolution causing arrest and sudden onset of motion during heating and cooling (Movie S5), we added tracer colloids to the oil phase, performed high resolution bright field videomicroscopy and analyzed the internal flow field by particle image velocimetry (PIV). Fig. 4 ()b shows the evolution of with increasing temperature. At , we see a mixed dipolar and quadrupolar flow field (modes ) corresponding to the meandering trajectory in Fig. 2a Suda et al. (2021); Hokmabad et al. (2021). At even higher temperature, , the droplet swims straight, Pe decreases and the flow field is purely dipolar (). As the droplet begins to slow down, an inactive region spreads from the droplet posterior (). Finally (), just before the droplet stops (), only a small region at the droplet anterior is active Ramesh et al. (2023). As shown in Fig. 3II, the local environment isotropically saturates with spent fuel while the droplet is immotile.
The gradual increase of Pe during cooling now allows us to directly observe the fundamental first transition from the immotile base state to self-propelled motion Michelin et al. (2013); Michelin (2023). This can be realised theoretically using hydrodynamic models, originally proposed in Michelin et al. (2013) as follows:
A spherical particle of radius is immersed in a fluid medium containing a chemical fuel at concentration . At negligible Reynolds numbers, the flow is governed by the Stokes equations, , The chemical field is coupled by an advection-diffusion equation,
| Pe | (1) |
and by the particle consuming fuel at its boundary, . The Péclet number is set by the activity , mobility and diffusivity of the chemical species and the particle radius . Using a decomposition into squirmer modes and a linear stability analysis around the isotropic base state (mode ), the authors find a transition to the propulsive dipolar state () above a threshold value of .
Our mixed surfactant method allows us to observe the growth of the bipolar mode in situ and a detailed comparison with the theory. We recorded the droplet speed at the onset of motion and performed a simulation of the interfacial instability, solving for the full 3D problem following Michelin et al. (2013); Picella and Michelin (2022) and adapted to our cell geometry (see SI section 9), with good qualitative agreement between experimental and numerical data (Fig. 4a, Movie S6).
II Conclusions
We show that controlling the dynamics of self-propelling droplets by micelle mediated interactions Babu et al. (2021); Wentworth et al. (2022) provides a promising framework to regulate active droplet dynamics: we can now control self-propulsion from an unsteady or meandering state over quasi-ballistic propulsion to full arrest without needing to change the chemistry of the system. The transitions are almost fully reversible, excepting a slight reduction in peak speed that can be attributed to droplet shrinkage.
Our hypothesis – fuel binding by thermosensitive polymer cosurfactants – does not include the behavior of adsorbed polymer at the interface, which might also be temperature dependent. However, we argue that these effects are, if present, secondary to the binding and release of TTAB in the swimming medium: generally, the desorption kinetics of large polymers are assumed to be exceedingly slow Butt et al. (2003). Thus, if these kinetics were the main drivers of thermoresponsive mode switching, it would not be consistent with our observations of cyclic reversibility and the fast response to changed external conditions, i.e. the onset of motion in Fig. 4a and particularly the fast, local adaptation to the fuel-rich medium outside the saturation area.
Our experiments fit into the framework of the canonical theory for autophoretic particles, where the observed dynamic regimes correspond to interfacial modes becoming unstable with increasing or decreasing Péclet number.
While such higher order modes have been documented individually, the fundamental spontaneous transition from an isotropic zero order base state to a first order propulsion state is hard to observe experimentally, as the setup of the experiment usually provides sufficient disturbances to instantaneously set off droplet motion. By a non-invasive temperature driven crossing of the critical Pe threshold, this is now possible, and, as we have demonstrated by chemical and flow signatures, even quantifiable.
Acknowledgements, Author contributions, and data availability
We thank Dr. Babak Vajdi Hokmabad and Dr. Stefan Karpitschka for invaluable advice and discussions, Dr. Stephan Weiss for providing the thermistor and Dr. Kristian Hantke for experimental support.
PR designed and performed experiments, analyzed data and wrote the paper, Rä and SV performed experiments and analyzed data, YC designed and performed simulations, MJ designed experiments, CCM designed and performed experiments, analyzed data and wrote the paper. All authors proofread the paper.
The data supporting the findings of this study and the numerical code underlying Fig. 4a are available at DOI:10.5281/zenodo.7818660.
References
- von Goethe (1798) J.-W. von Goethe, “Der Zauberlehrling,” in Musen-Almanach für das Jahr 1798, edited by F. Schiller (J.G. Cotta, 1798) pp. 32–37.
- Bechinger et al. (2016) C. Bechinger, R. Di Leonardo, H. Löwen, C. Reichhardt, G. Volpe, and G. Volpe, “Active Particles in Complex and Crowded Environments,” Rev. Mod. Phys. 88, 045006 (2016).
- Moran and Posner (2019) J. Moran and J. Posner, “Microswimmers with no moving parts,” Phys. Today 72, 44–50 (2019).
- Zhang and Hess (2021) Y. Zhang and H. Hess, “Chemically-powered swimming and diffusion in the microscopic world,” Nat. Rev. Chem. 5, 500–510 (2021).
- Zöttl and Stark (2023) A. Zöttl and H. Stark, “Modeling Active Colloids: From Active Brownian Particles to Hydrodynamic and Chemical Fields,” Annu. Rev. Condens. Matter Phys. 14, 109–127 (2023).
- Maass et al. (2016) C. Maass, C. Krüger, S. Herminghaus, and C. Bahr, “Swimming Droplets,” Annu. Rev. Condens. Matter Phys. 7, 171–193 (2016).
- Babu et al. (2022) D. Babu, N. Katsonis, F. Lancia, R. Plamont, and A. Ryabchun, “Motile behaviour of droplets in lipid systems,” Nat. Rev. Chem. 6, 377–388 (2022).
- Birrer et al. (2022) S. Birrer, S. Cheon, and L. Zarzar, “We the droplets: A constitutional approach to active and self-propelled emulsions,” Curr. Opin. Colloid Interface Sci. 61, 101623 (2022).
- Dwivedi et al. (2022) P. Dwivedi, D. Pillai, and R. Mangal, “Self-propelled swimming droplets,” Curr. Opin. Colloid Interface Sci. 61, 101614 (2022).
- Michelin (2023) S. Michelin, “Self-Propulsion of Chemically Active Droplets,” Annu. Rev. Fluid Mech. 55, 77–101 (2023).
- Hanczyc et al. (2007) M. Hanczyc, T. Toyota, T. Ikegami, N. Packard, and T. Sugawara, “Fatty Acid Chemistry at the Oil-Water Interface: Self-Propelled Oil Droplets,” JACS 129, 9386–9391 (2007).
- Thutupalli et al. (2011) S. Thutupalli, R. Seemann, and S. Herminghaus, “Swarming behavior of simple model squirmers,” New J. Phys. 13, 073021 (2011).
- Peddireddy et al. (2012) K. Peddireddy, P. Kumar, S. Thutupalli, S. Herminghaus, and C. Bahr, “Solubilization of thermotropic liquid crystal compounds in aqueous surfactant solutions.” Langmuir 28, 12426–31 (2012).
- Izri et al. (2014) Z. Izri, M. van der Linden, S. Michelin, and O. Dauchot, “Self-Propulsion of Pure Water Droplets by Spontaneous Marangoni-Stress-Driven Motion,” Phys. Rev. Lett. 113, 248302 (2014).
- Herminghaus et al. (2014) S. Herminghaus, C. Maass, C. Krüger, S. Thutupalli, L. Goehring, and C. Bahr, “Interfacial mechanisms in active emulsions,” Soft Matter 10, 7008–7022 (2014).
- Michelin et al. (2013) S. Michelin, E. Lauga, and D. Bartolo, “Spontaneous autophoretic motion of isotropic particles,” Phys. Fluids 25, 061701 (2013).
- Suga et al. (2018) M. Suga, S. Suda, M. Ichikawa, and Y. Kimura, “Self-propelled motion switching in nematic liquid crystal droplets in aqueous surfactant solutions,” Phys. Rev. E 97, 062703 (2018).
- Izzet et al. (2020) A. Izzet, P. Moerman, P. Gross, J. Groenewold, A. Hollingsworth, J. Bibette, and J. Brujic, “Tunable Persistent Random Walk in Swimming Droplets,” Phys. Rev. X 10, 021035 (2020).
- Meredith et al. (2020) C. Meredith, P. Moerman, J. Groenewold, Y. Chiu, W. Kegel, A. van Blaaderen, and L. Zarzar, “Predator-prey interactions between droplets driven by non-reciprocal oil exchange,” Nat. Chem. 12, 1136–1142 (2020).
- Hokmabad et al. (2021) B. Hokmabad, R. Dey, M. Jalaal, D. Mohanty, M. Almukambetova, K. Baldwin, D. Lohse, and C. Maass, “Emergence of Bimodal Motility in Active Droplets,” Phys. Rev. X 11, 011043 (2021).
- Suda et al. (2021) S. Suda, T. Suda, T. Ohmura, and M. Ichikawa, “Straight-to-Curvilinear Motion Transition of a Swimming Droplet Caused by the Susceptibility to Fluctuations,” Phys. Rev. Lett. 127, 088005 (2021).
- Tu et al. (2017) Y. Tu, F. Peng, X. Sui, Y. Men, P. White, J. van Hest, and D. Wilson, “Self-propelled supramolecular nanomotors with temperature-responsive speed regulation,” Nat. Chem. 9, 480–486 (2017).
- Cholakova et al. (2021) D. Cholakova, M. Lisicki, S. Smoukov, S. Tcholakova, E. Lin, J. Chen, G. De Canio, E. Lauga, and N. Denkov, “Rechargeable self-assembled droplet microswimmers driven by surface phase transitions,” Nat. Phys. 17, 1050–1055 (2021).
- Florea et al. (2014) L. Florea, K. Wagner, P. Wagner, G. Wallace, F. Benito-Lopez, D. Officer, and D. Diamond, “Photo-Chemopropulsion – Light-Stimulated Movement of Microdroplets,” Adv. Mater. 26, 7339–7345 (2014).
- Kaneko et al. (2017) S. Kaneko, K. Asakura, and T. Banno, “Phototactic behavior of self-propelled micrometer-sized oil droplets in a surfactant solution,” Chem. Commun. 53, 2237–2240 (2017).
- Xiao et al. (2018) Y. Xiao, S. Zarghami, K. Wagner, P. Wagner, K. Gordon, L. Florea, D. Diamond, and D. Officer, “Moving Droplets in 3D Using Light,” Adv. Mater. 30, 1801821 (2018).
- Lancia et al. (2019) F. Lancia, T. Yamamoto, A. Ryabchun, T. Yamaguchi, M. Sano, and N. Katsonis, “Reorientation behavior in the helical motility of light-responsive spiral droplets,” Nat. Commun. 10, 5238 (2019).
- Alvarez et al. (2021) L. Alvarez, M. Fernandez-Rodriguez, A. Alegria, S. Arrese-Igor, K. Zhao, M. Kröger, and L. Isa, “Reconfigurable artificial microswimmers with internal feedback,” Nat. Commun. 12, 4762 (2021).
- Ryabchun et al. (2022) A. Ryabchun, D. Babu, J. Movilli, R. Plamont, M. Stuart, and N. Katsonis, “Run-and-halt motility of droplets in response to light,” Chem 8, 2290–2300 (2022).
- van Kesteren et al. (2023) S. van Kesteren, L. Alvarez, S. Arrese-Igor, A. Alegria, and L. Isa, “Self-propelling colloids with finite state dynamics,” Proc. Natl. Acad. Sci. U.S.A. 120, e2213481120 (2023).
- Nambam and Philip (2012) J. Nambam and J. Philip, “Effects of Interaction of Ionic and Nonionic Surfactants on Self-Assembly of PEO–PPO–PEO Triblock Copolymer in Aqueous Solution,” J. Phys. Chem. B 116, 1499–1507 (2012).
- Jin et al. (2017) C. Jin, C. Krüger, and C. Maass, “Chemotaxis and autochemotaxis of self-propelling droplet swimmers,” Proc. Natl. Acad. Sci. U.S.A. 114, 5089–5094 (2017).
- Rosen and Kunjappu (2012) M. Rosen and J. Kunjappu, Surfactants and interfacial phenomena, 4th ed. (Wiley, Hoboken, N.J., 2012).
- Hokmabad et al. (2022a) B. Hokmabad, A. Nishide, P. Ramesh, C. Krüger, and C. Maass, “Spontaneously rotating clusters of active droplets,” Soft Matter 18, 2731–2741 (2022a), arxiv:2112.11801 .
- Alexandridis et al. (1994) P. Alexandridis, J. Holzwarth, and T. Hatton, “Micellization of Poly(ethylene oxide)-Poly(propylene oxide)-Poly(ethylene oxide) Triblock Copolymers in Aqueous Solutions: Thermodynamics of Copolymer Association,” Macromolecules 27, 2414–2425 (1994).
- Wanka et al. (1994) G. Wanka, H. Hoffmann, and W. Ulbricht, “Phase Diagrams and Aggregation Behavior of Poly(oxyethylene)-Poly(oxypropylene)-Poly(oxyethylene) Triblock Copolymers in Aqueous Solutions,” Macromolecules 27, 4145–4159 (1994).
- Bohorquez et al. (1999) M. Bohorquez, C. Koch, T. Trygstad, and N. Pandit, “A Study of the Temperature-Dependent Micellization of Pluronic F127,” J. Colloid Interface Sci. 216, 34–40 (1999).
- Stoeber et al. (2006) B. Stoeber, C. Hu, D. Liepmann, and S. Muller, “Passive flow control in microdevices using thermally responsive polymer solutions,” Phys. Fluids 18, 053103 (2006).
- Jalaal et al. (2016) M. Jalaal, G. Cottrell, N. Balmforth, and B. Stoeber, “On the rheology of Pluronic F127 aqueous solutions,” J. Rheol. 61, 139–146 (2016).
- Jalaal et al. (2018) M. Jalaal, C. Seyfert, B. Stoeber, and N. Balmforth, “Gel-controlled droplet spreading,” J. Fluid Mech. 837, 115–128 (2018).
- Hecht and Hoffmann (1994) E. Hecht and H. Hoffmann, “Interaction of ABA block copolymers with ionic surfactants in aqueous solution,” Langmuir 10, 86–91 (1994).
- Li et al. (2001) Y. Li, R. Xu, S. Couderc, D. Bloor, J. Holzwarth, and E. Wyn-Jones, “Binding of Tetradecyltrimethylammonium Bromide to the ABA Block Copolymer Pluronic F127 (EO97 PO69 EO97): Electromotive Force, Microcalorimetry, and Light Scattering Studies,” Langmuir 17, 5742–5747 (2001).
- Tam and Wyn-Jones (2006) K. Tam and E. Wyn-Jones, “Insights on polymer surfactant complex structures during the binding of surfactants to polymers as measured by equilibrium and structural techniques,” Chem. Soc. Rev. 35, 693–709 (2006).
- Butt et al. (2003) H. Butt, K. Graf, and M. Kappl, Physics and Chemistry of Interfaces (John Wiley & Sons, 2003).
- Hecht et al. (1995) E. Hecht, K. Mortensen, M. Gradzielski, and H. Hoffmann, “Interaction of ABA Block Copolymers with Ionic Surfactants: Influence on Micellization and Gelation,” J. Phys. Chem. 99, 4866–4874 (1995).
- Morozov and Michelin (2019) M. Morozov and S. Michelin, “Nonlinear dynamics of a chemically-active drop: From steady to chaotic self-propulsion,” J. Chem. Phys. 150, 044110 (2019).
- Ramesh et al. (2023) P. Ramesh, B. Hokmabad, D. Pushkin, A. Mathijssen, and C. Maass, “Interfacial activity dynamics of confined active droplets,” J. Fluid Mech. 966, A29 (2023).
- Hokmabad et al. (2022b) B. Hokmabad, J. Agudo-Canalejo, S. Saha, R. Golestanian, and C. Maass, “Chemotactic self-caging in active emulsions,” Proc. Natl. Acad. Sci. U.S.A. 119, e2122269119 (2022b).
- Morozov (2020) M. Morozov, “Adsorption inhibition by swollen micelles may cause multistability in active droplets,” Soft Matter 16, 5624–5632 (2020).
- Picella and Michelin (2022) F. Picella and S. Michelin, “Confined self-propulsion of an isotropic active colloid,” J. Fluid Mech. 933 (2022).
- Babu et al. (2021) D. Babu, R. Scanes, R. Plamont, A. Ryabchun, F. Lancia, T. Kudernac, S. Fletcher, and N. Katsonis, “Acceleration of lipid reproduction by emergence of microscopic motion,” Nat. Commun. 12, 2959 (2021).
- Wentworth et al. (2022) C. Wentworth, A. Castonguay, P. Moerman, C. Meredith, R. Balaj, S. Cheon, and L. Zarzar, “Chemically Tuning Attractive and Repulsive Interactions between Solubilizing Oil Droplets,” Angew. Chem. Int. Ed. 61, e202204510 (2022).
- Parmar et al. (2014) A. Parmar, S. Chavda, and P. Bahadur, “Pluronic–cationic surfactant mixed micelles: Solubilization and release of the drug hydrochlorothiazide,” Colloids Surf., A 441, 389–397 (2014).
- Lopez-Leon and Fernandez-Nieves (2011) T. Lopez-Leon and A. Fernandez-Nieves, “Drops and shells of liquid crystal,” Colloid. Polym. Sci. 289, 345–359 (2011).
- Shechter et al. (2020) J. Shechter, N. Atzin, A. Mozaffari, R. Zhang, Y. Zhou, B. Strain, L. Oster, J. de Pablo, and J. Ross, “Direct Observation of Liquid Crystal Droplet Configurational Transitions using Optical Tweezers,” Langmuir 36, 7074–7082 (2020).
- Kim et al. (2005) A. Kim, V. Manoharan, and J. Crocker, “Swelling-Based Method for Preparing Stable, Functionalized Polymer Colloids,” JACS 127, 1592–1593 (2005).
- Thielicke and Stamhuis (2014) W. Thielicke and E. Stamhuis, “PIVlab – Towards User-friendly, Affordable and Accurate Digital Particle Image Velocimetry in MATLAB,” J. Open Res. Software 2, e30 (2014).
- Chen et al. (2021) Y. Chen, K. Chong, L. Liu, R. Verzicco, and D. Lohse, “Instabilities driven by diffusiophoretic flow on catalytic surfaces,” J. Fluid Mech. 919, A10 (2021).
- Verzicco and Orlandi (1996) R. Verzicco and P. Orlandi, “A Finite-Difference Scheme for Three-Dimensional Incompressible Flows in Cylindrical Coordinates,” J. Comput. Phys. 123, 402–414 (1996).
- Spandan et al. (2017) V. Spandan, V. Meschini, R. Ostilla-Mónico, D. Lohse, G. Querzoli, M. de Tullio, and R. Verzicco, “A parallel interaction potential approach coupled with the immersed boundary method for fully resolved simulations of deformable interfaces and membranes,” J. Comput. Phys. 348, 567–590 (2017).
Frozen by heating: temperature controlled dynamic states in droplet microswimmers. Supporting information
1 Materials and characterization
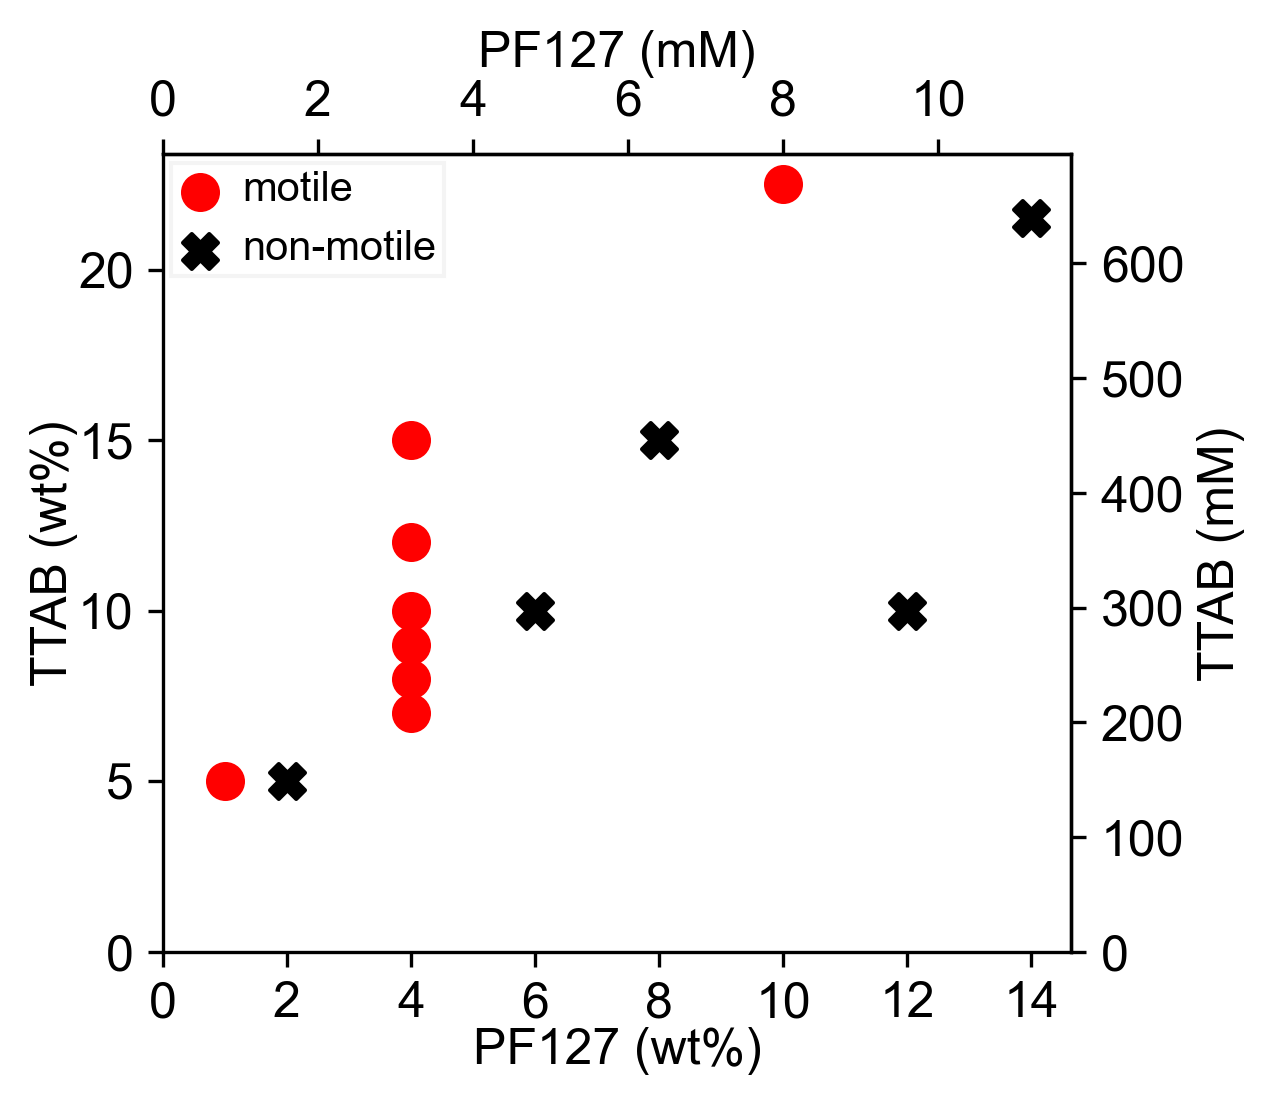
We obtained CB15 (Synthon Chemicals), TTAB and PF127 (Sigma-Aldrich) and used them as-is. To study the influence of mixed micelles on active droplet motility around room temperature, we varied the TTAB concentration between . We note that a low concentration of PF127 requires heating the system to high temperatures to deplete TTAB, causing evaporation issues, while at a higher concentration of PF127 droplets would only be active at low temperatures. This strongly limited the experimentally accessible parameter space for PF127, and we opted to keep the concentration fixed at . An overview of the media compositions for which we observed swimming at room temperature () is shown in Fig. S1. Increasing the amount of PF127 suppresses motility, while an excess of TTAB promotes it. The typical molarity ratios for motility are of the order of 1:100.
2 Microfluidic experiments
We mass produced CB15 droplets in microfluidic flow focusing devices Hokmabad et al. (2021) at a size of . We fabricated the experimental reservoir, a Hele-Shaw geometry, by spin coating a layer of SU-8 photoresist on glass, and creating a rectangular void space of area by UV photolithography. For experiments, we filled it with a dilute droplet emulsion and sealed it with a glass cover slip.
We recorded the motion of active droplets on a bright-field microscope (Olympus IX-81) with a temperature controlled stage (Linkam PE100) which allowed for both heating and cooling protocols. We set the reservoir temperature at the desired initial value for a period of , after which we started measurements.
We performed temperature ramp experiments with a set heating/cooling rate of or . As shown in Fig. 2 (c), the system did not equilibrate instantaneously. We therefore directly measured the sample temperature using a thermistor taped to the top plate of the microfluidic reservoir (Fig. 1). Movie frames were recorded at 4 frames per second (fps) using a Canon digital camera (EOS 600d) with a digital resolution of 1920 x 1080 px.
To estimate whether the quasi 2D confinement affects the observed dynamics, we have also recorded the temperature-dependent droplet motion in reservoirs with a larger height of and , using a swimming medium with TTAB and PF127. We found similar dynamic states and, within the experimental error (see Fig. 2b), the same transition temperatures (, ) as in the case of the quasi-2D geometry, (Fig. 2b).
3 Investigation of TTAB/PF127 micelle formation
To investigate the formation of individual and mixed micelles in our particular swimming medium, we recorded dynamic light scattering and calorimetry data on solutions of pure and mixed surfactants. The nature of these complexes is according to existing literature highly dependent on concentrations and temperature, however, at the relative concentrations exceeding 1:100 in our system, PF127 micelles are presumably fully broken down for the entire temperature range under investigation Li et al. (2001). For this reason, we do not expect the CMT of PF127 to be a characteristic quantity in the dynamics of our system.
3.1 DLS measurements
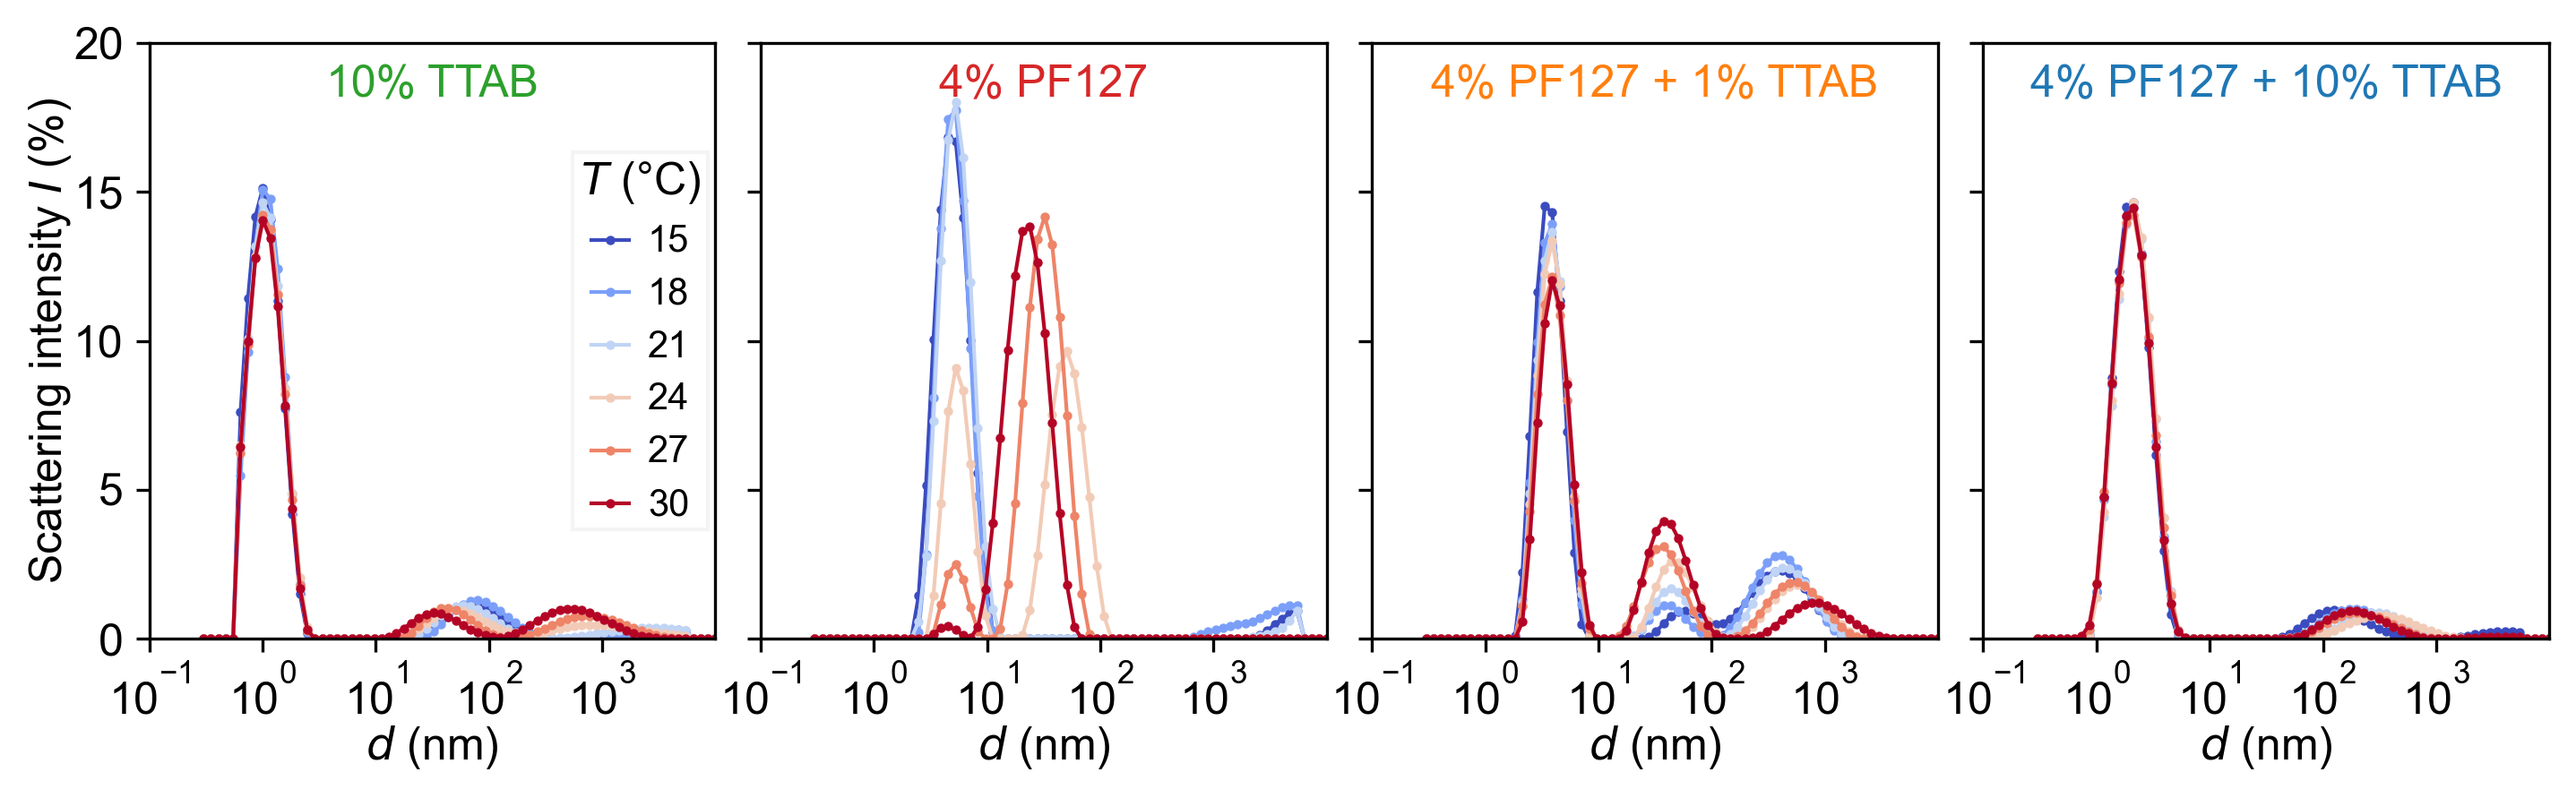
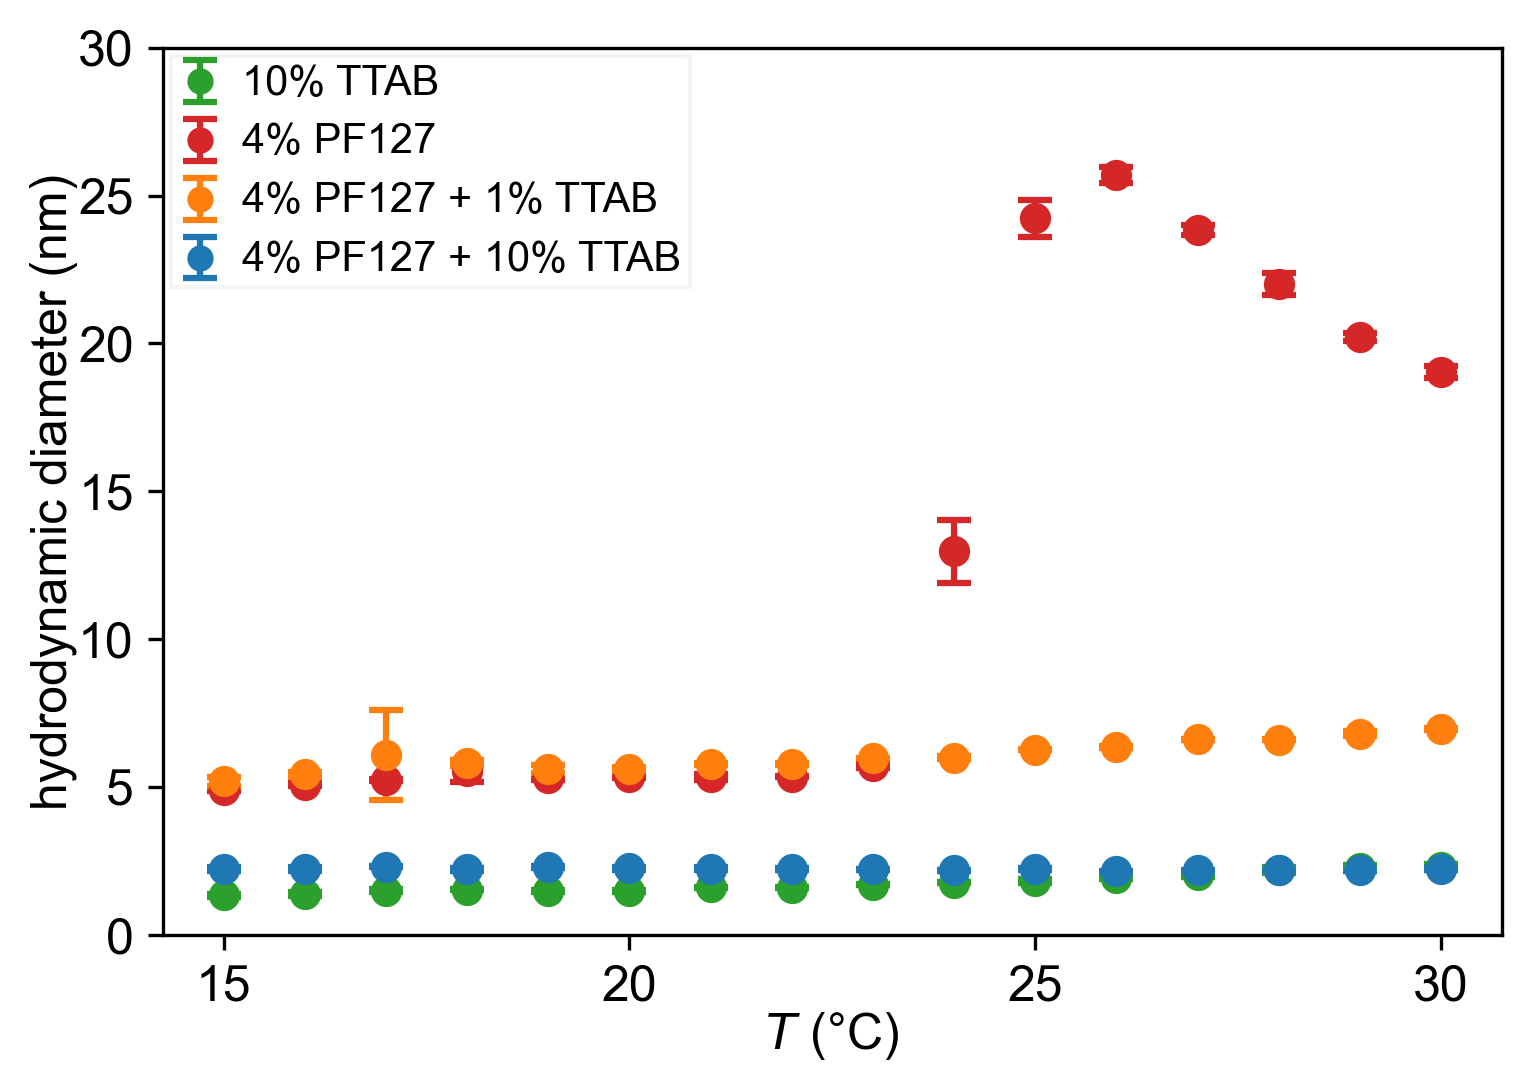
We performed dynamic light scattering (DLS) measurements for the co-surfactant mixtures used in our experiments on a Malvern Zetasizer Ultra Red. We placed a sample in a polystyrene cuvette and recorded the backscattering intensity at between and . At each temperature, the sample was allowed to equilibrate for , and all measurements were carried out in triplicate. We have plotted the size distributions for selected temperatures in Fig. S2 and summarized the temperature dependent behaviour for all samples via the Z average hydrodynamic diameter, i.e. the “intensity weighted mean hydrodynamic size of the ensemble collection of particles” (Malvern) in Fig. S3. For PF127, there is a significant increase in diameter above , corresponding to the formation of PF127 micelles (we note that this appears somewhat higher than the literature value Bohorquez et al. (1999); Alexandridis et al. (1994)). This increase is suppressed in the presence of TTAB, consistent with the formation of PF127/TTAB complexes seen in literature Parmar et al. (2014); Nambam and Philip (2012); Li et al. (2001); Hecht and Hoffmann (1994). We note that, from the Z average, the hydrodynamic diameter of these complexes is somewhat smaller than that of a PF127 monomer, which is in line with existing studies Parmar et al. (2014). Further, these complexes appear to be close in size to pure TTAB micelles in a size range near the lower DLS resolution limit, such that the two species probably cannot be resolved in Fig. S2.
3.2 Differential scanning calorimetry
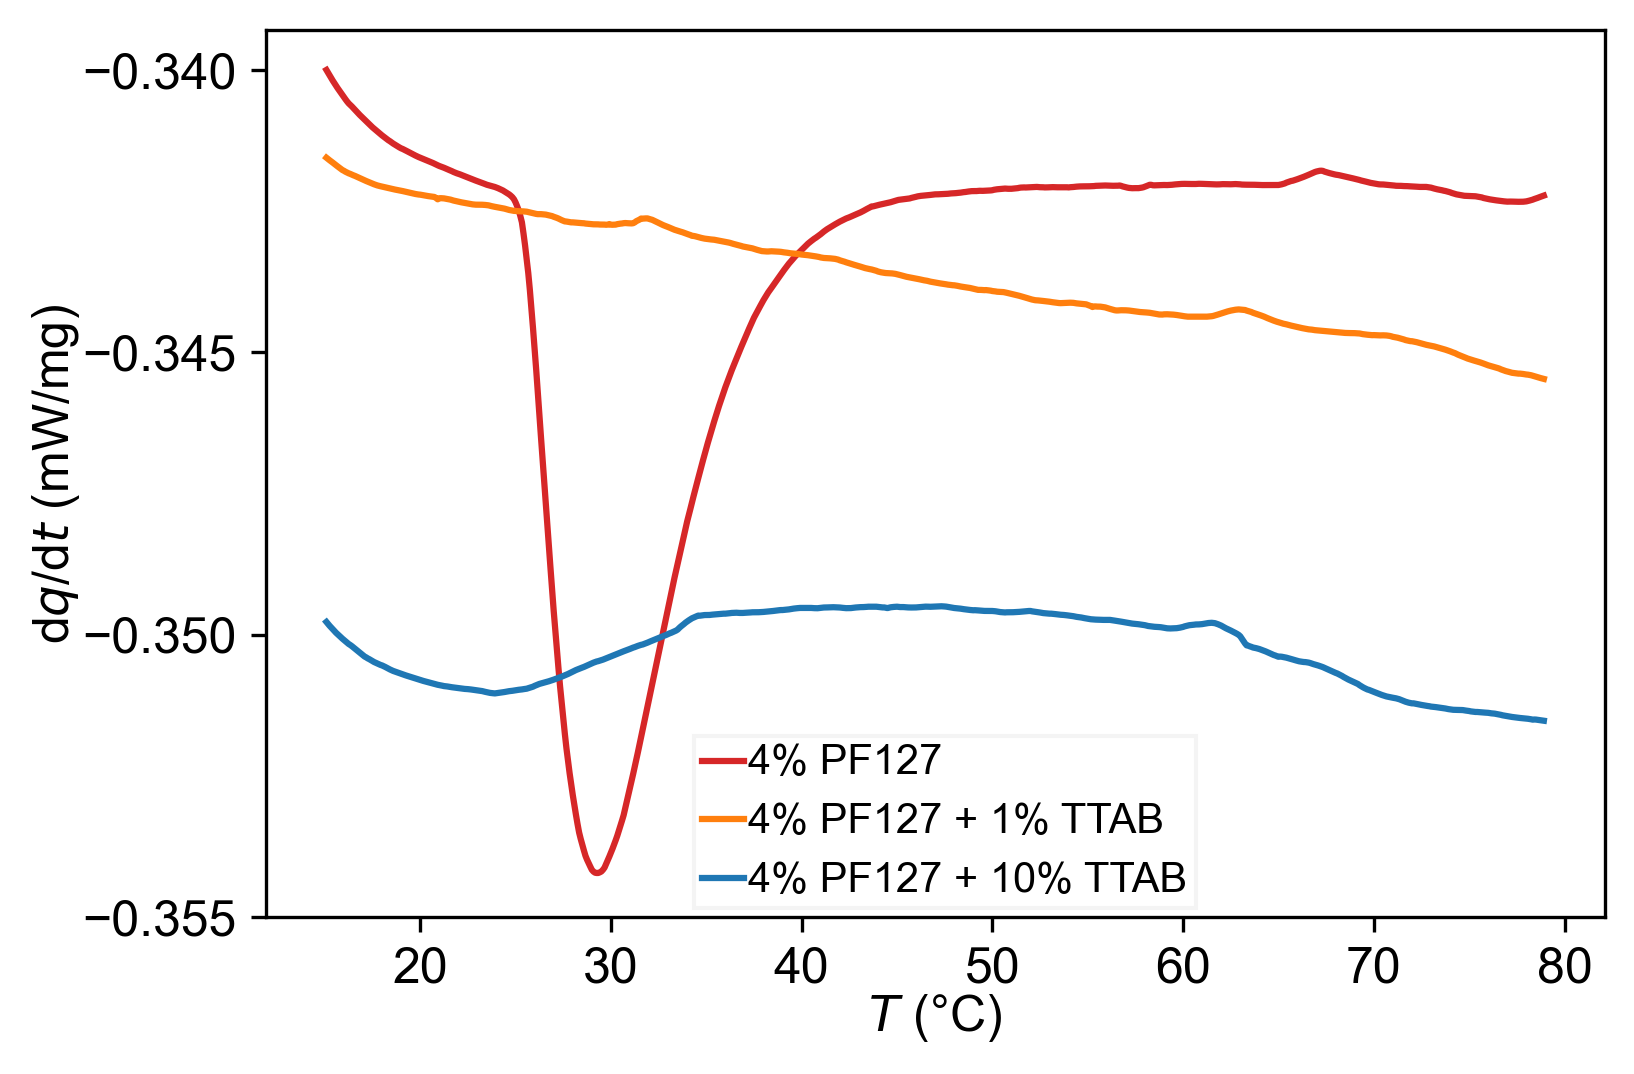
We investigated the temperature dependent PF127 micellization using differential scanning calorimetry (DSC). For the measurements, we prepared three sample types: (1) PF127 in water, (2) PF127 + TTAB in water and (3) PF127 + TTAB in water. Solutions were directly transferred into DSC sample aluminium pans (volume , Mettler-Toledo GmbH, Gießen, Germany). DSC pans were covered with aluminum lids. DSC measurements were performed on a DSC 823 instrument (Mettler-Toledo GmbH, Gießen, Germany). Heating-cooling cycles were recorded at a heating/cooling rate of between 0 and . The measurements were performed under a nitrogen atmosphere with a flow of . Heating curves were normalized to the sample mass. The endothermic dip in the curve for pure PF127 is consistent with the onset of micellization from the DLS results, and is similarly suppressed under the addition of TTAB.
4 Cosurfactants on oil-water droplet interfaces
We conducted further experiments to confirm, under our experimental conditions, (A) that TTAB is the dominant surfactant at the oil-water interface and (B) that the aqueous solubilization of CB15 is mainly TTAB mediated, as follows.
4.1 TTAB interfacial coverage based on nematic anchoring
In liquid crystal emulsions, the interfacial anchoring of the nematic director depends on the surfactant in use. Assuming comparable interfacial activity for both substances, we can infer the presence of TTAB at the oil-water interface from investigating the anchoring for CB15’s nematic isomer 5CB (at room temperature) under polarised microscopy Lopez-Leon and Fernandez-Nieves (2011); Shechter et al. (2020). We show this in three micrographs in Fig. S5: 5CB droplets (left) in TTAB show a cross-shaped interference pattern and a central point defect, consistent with homeotropic (surface normal) anchoring as known for TTAB. On the right, we show a droplet in TTAB and PF127, where we observed a bipolar defect pattern, with two opposing defects at the interface (one visible in the micrograph). This pattern is typical for planar anchoring, and we associate it with the large excess of PF127. In the middle image, for TTAB and PF127 (middle), there is only a single point defect, indicating a transition to TTAB mediated homeotropic anchoring already far below the TTAB used in the experiments on motile droplets.
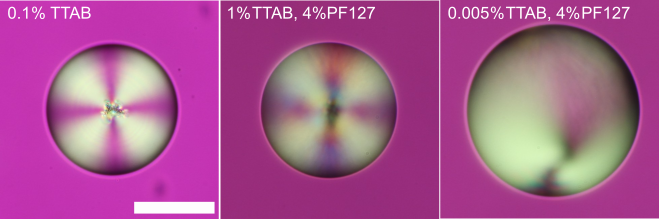
4.2 Solubilization rate measurements
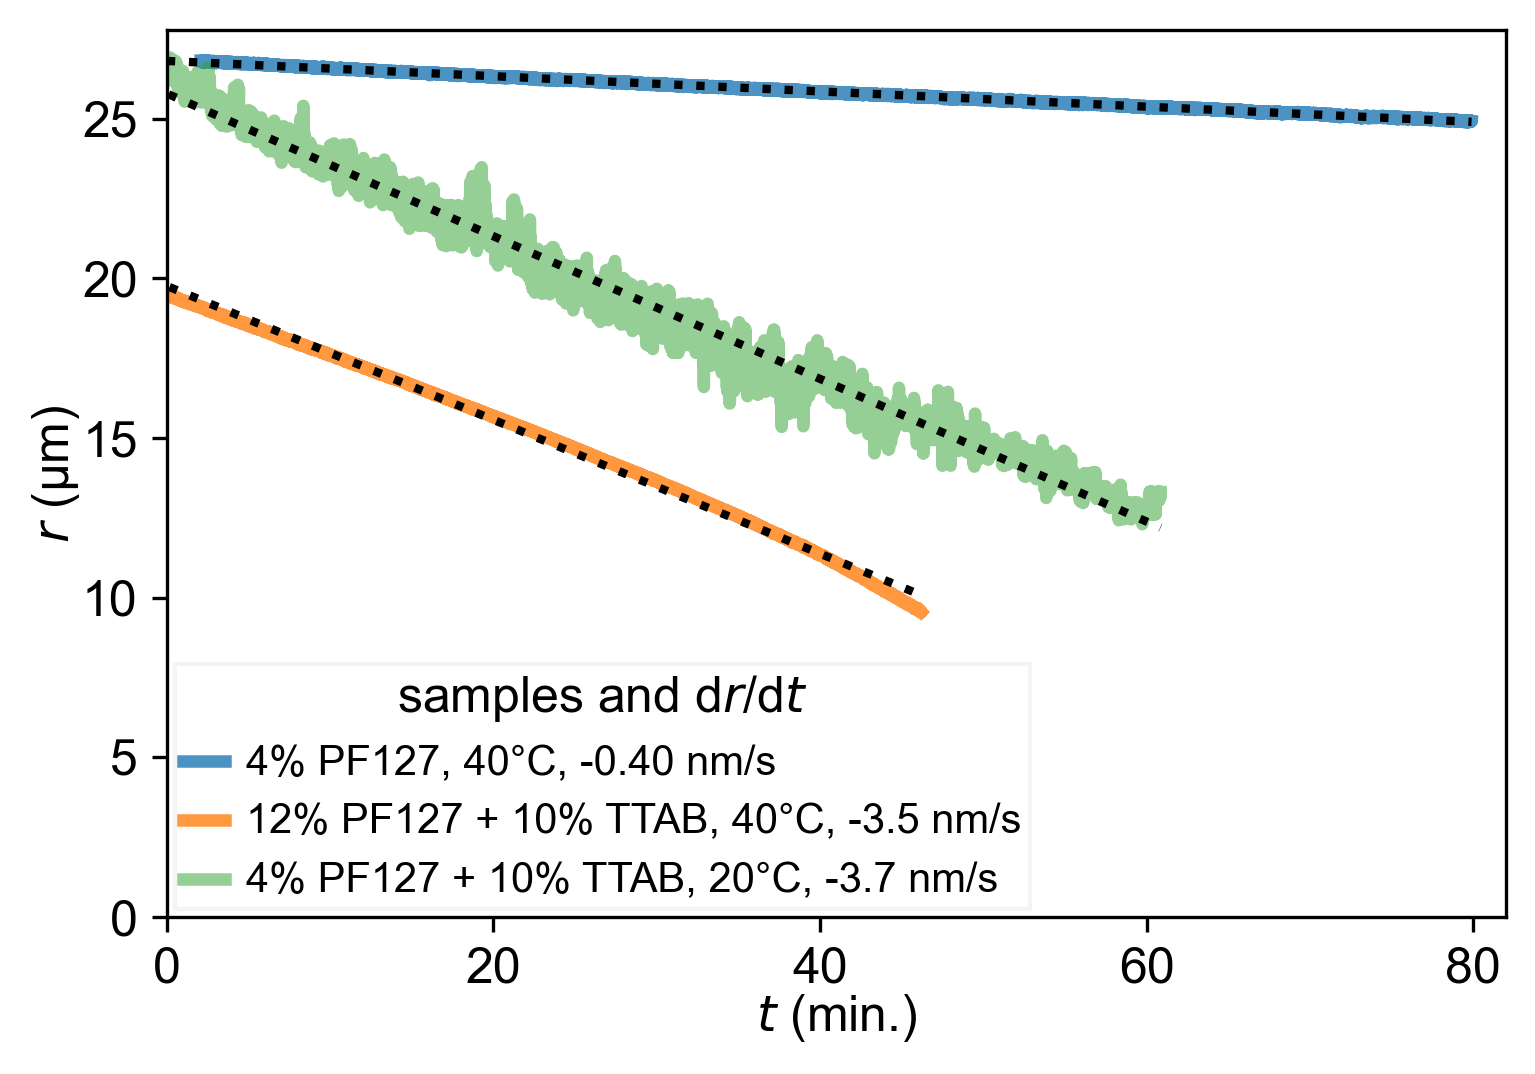
We measured the shrinking rate of a CB15 droplet for two non-motile cases under bright field microscopy at 63x magnification – TTAB + PF127 and PF127, both at – and in an ensemble average of motile droplets under typical experimental conditions, TTAB + PDF127 at under 4x magnification; droplet radii and fitted shrinking rates are shown in Fig. S6 (). Dissolution is reduced by an order of magnitude without TTAB.
Given that (A) there appears to be a considerable fraction of TTAB at the interface and that (B) droplets neither significantly dissolve or move in pure PF127, we conclude that the droplet motion is primarily driven by TTAB gradients in the oil-water interface, by a mechanism similar to the micellar solubilization driven one known for pure TTAB media Herminghaus et al. (2014); Peddireddy et al. (2012); Maass et al. (2016). We also note that the droplet speed is of a similar order of magnitude as the one in pure TTAB (, Fig. S7 ()), such that additional adsorbed PF127 at the interface does not appear to impede the mechanism.
5 Temperature dependent dynamics in pure TTAB solution

In Fig. S7, we show a temperature-coded trajectory of a droplet studied under the same conditions as the experiments shown in the main manuscript, but in an aqueous solution of TTAB only at . Here, the motion destabilises with increasing temperature. We illustrate this by temperature-coded plots of three quantities: the speed (top), which increases, but also fluctuates strongly for high temperatures. Further, two simple correlation estimates, both taken over a running time window of : the standard deviation over average speed, as a measure of unsteadiness in speed, and the cosine of the angle between and via their inner product as a measure of rotational fluctuation. Both indicate strong decorrelation at elevated temperatures. We note that this behavior is strongly different from the one in PF127/TTAB mixtures, where speed and unsteadiness decrease with increasing temperature.
6 Viscosity measurements
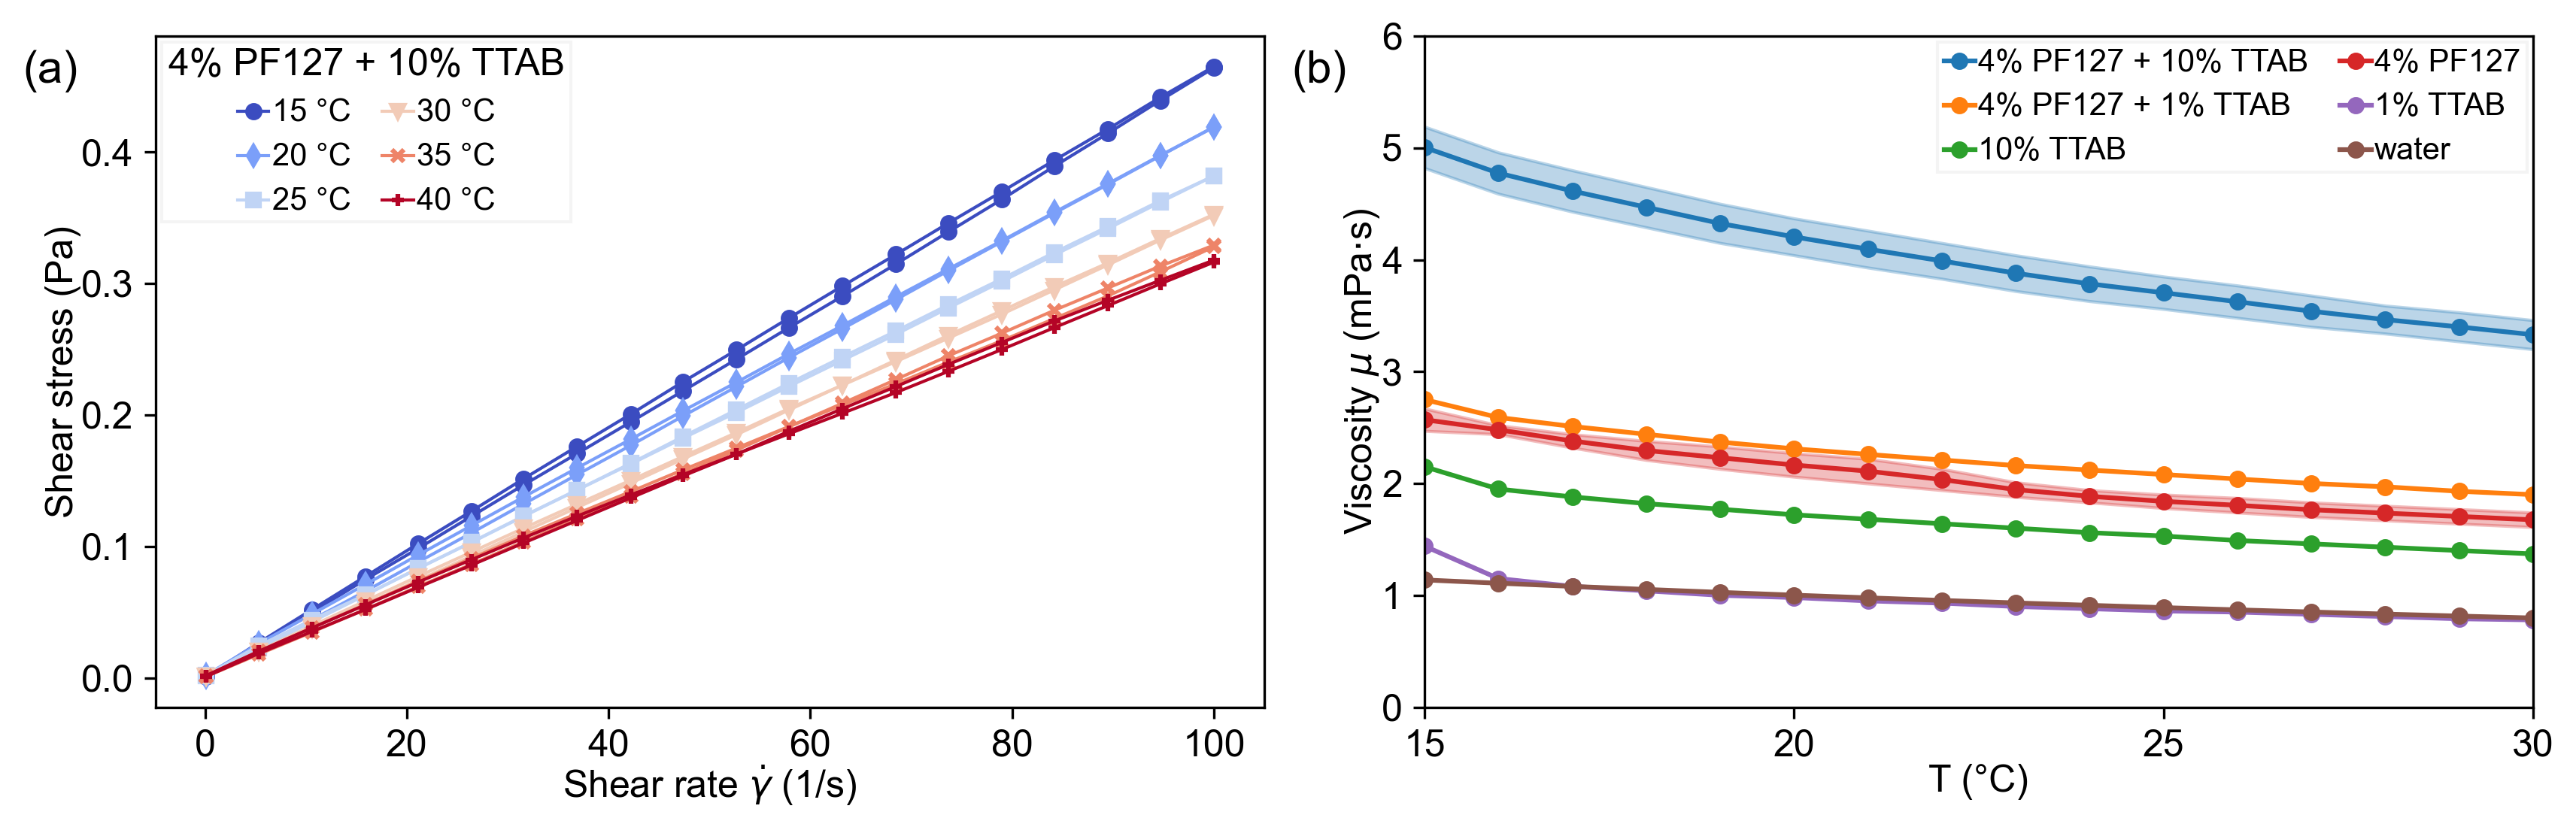
We measured the viscosity of our swimming media on an Anton-Paar MCR 502 rheometer using a cone-plate geometry with a gap width of . Measurements were carried out at temperatures between and and shear rates between and (see Fig. S8 ()). We observe Newtonian rheology and an only weakly temperature dependent viscosity. Thus, while aqueous solutions of PF127 are known to gel at high temperatures, essentially forming a network of micelles, we are still below this non-Newtonian regime at the concentration and temperature range in use.
7 Flow and chemical field measurements
The internal flow field was determined by adding diameter tracer Silica particles (Cospheric SiO2MS-1.8) to the oil phase and analysing high magnification videomicroscopy data by particle image velocimetry (PIV). We did not measure external flow fields, since adsorbed PF127 on colloidal tracer particles Kim et al. (2005) may cause them to aggregate and impedes accurate PIV measurements.
We recorded videomicroscopy data under a 40x objective using a 4MP camera (FLIR Grasshopper 3, GS3-U3-41C6M-C) at 40 fps at different set temperatures.
To study the sudden onset of motion from an inactive state as the system was cooled, images were recorded at a higher frame rate of 80 fps. Droplet speed over time was calculated from the recorded trajectories.
To visualize the oil-filled micelle chemical trail behind the droplet, we doped the oil phase with Nile Red (Sigma-Aldrich) dye. We performed fluorescent microscopy on an Olympus IX81 microscope with a filter cube (excitation filter ET560/40x, beam splitter 585 LP and emissions filter ET630/75m, all Chroma Technology). Images were captured via a 4x objective using a 4 MP CMOS camera (FLIR Grasshopper 3, GS3-U3-41C6M-C) at 4 fps.
8 Digital image processing and data analysis
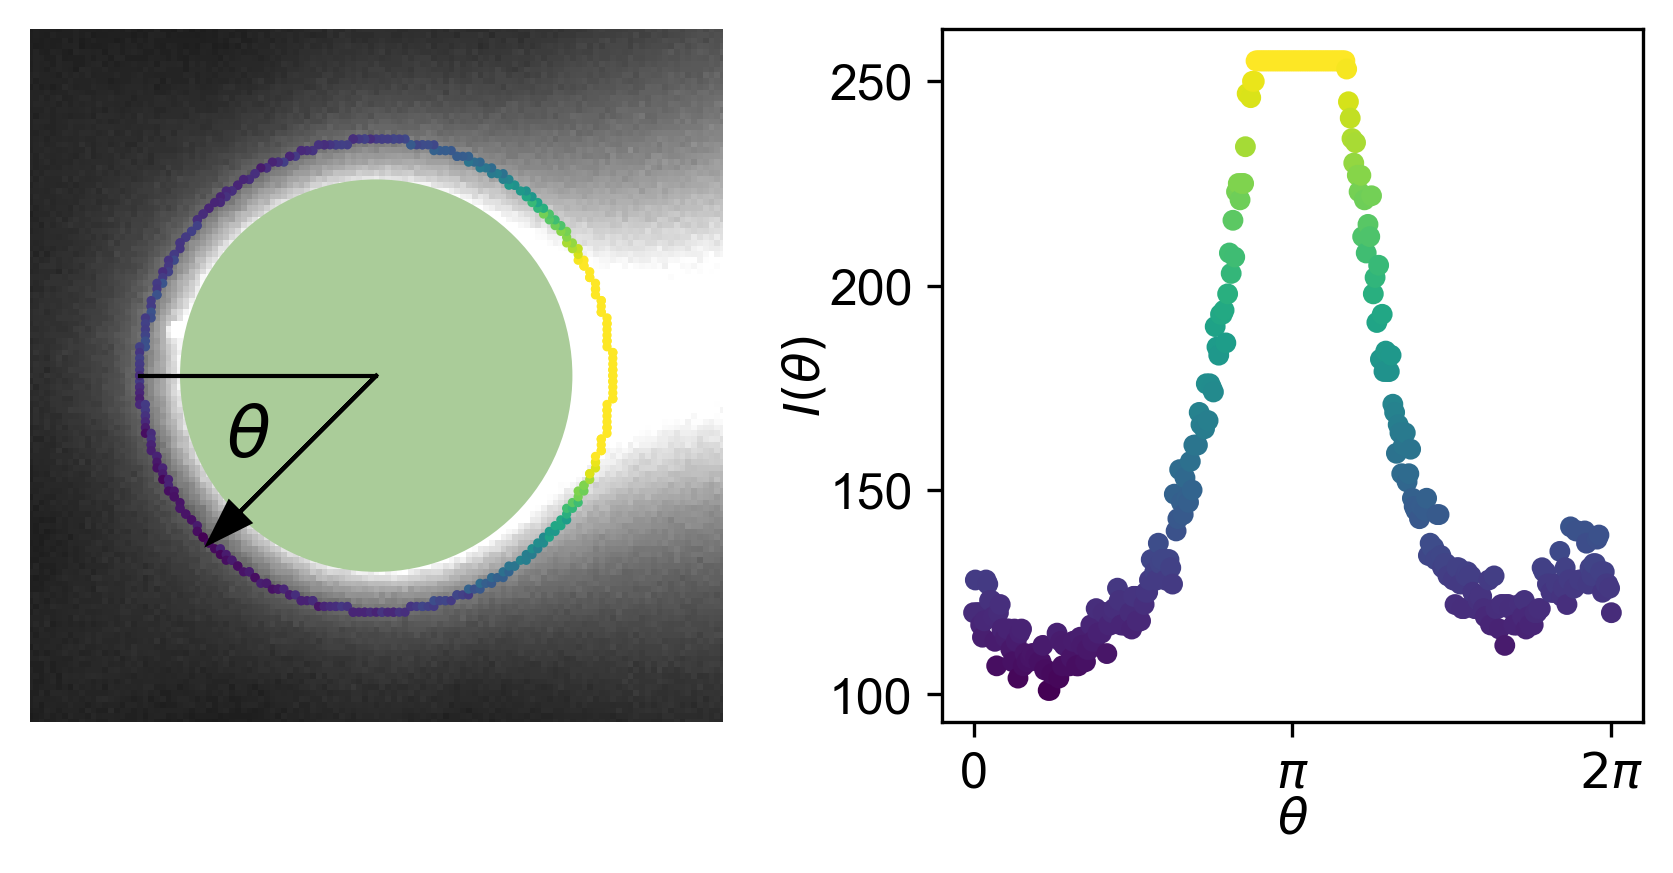
We extracted droplet coordinates from bright field microscopy using a sequence of background correction, binarization, blob detection by contour analysis, and minimum enclosing circle fits, and determined trajectories via a nearest-neighbor algorithm using in-house Python scripts building on numpy and opencv. For the strongly overexposed fluorescence data the droplet centroid was calculated via a distance transform algorithm on the fluorescence intensity. The polar intensity map in Fig. 3(b) was derived by taking the intensity in an annular region around the droplet at a distance of 1.2 droplet radii from the centroid Hokmabad et al. (2021, 2022b); Ramesh et al. (2023), as sketched in supporting figure S9.
Using the time-dependent droplet trajectory and temperature data, we estimated transition temperatures between dynamic states. The error bars for temperature in the regime map (Fig. 2f) represent the maximum variation within three different runs on samples containing on the order of 5–10 droplets each. It should be noted that there is some uncertainty associated with estimating and from low magnification droplet trajectory data. As seen in high magnification data in Movie S5, a droplet could appear to be stationary even though it shows internal activity through the motion of tracer particles. Moreover, the transition between a smooth reorientation and straight motion is somewhat gradual.
We performed PIV analyses using the Matlab PIVlab module Thielicke and Stamhuis (2014) with a multi-pass interrogation window of 64 x 64 pixel and 32 x 32 pixel with 50% overlap. The spatial resolution of the PIV output was .
9 Numerics
We simulate a diffusiophoretic particle of unit radius initially located at the center of a domain of size , , with grids at subcritical Pe. The particle is propelled by diffusiophoresis, a type of microswimmer similar to active droplet, as both move in response to the forces at the surfaces, which depend on the local chemical concentration field (see also Morozov and Michelin (2019)). The chemical reaction takes place at the particle surface and whenever there is a chemical concentration difference along the surface, a flow is generated within the interaction layer near the solid surface, with thickness of nanometers, which propels the particle forward.
We use the same non-dimensional governing equations and boundary conditions at the particle interface as those in previous studies Michelin et al. (2013); Chen et al. (2021) (here, solving for the full 3D problem as opposed to the axisymmetric analytical approach). The governing equations are given as
| (S1) |
| (S2) |
where is the concentration, the velocity. is the Péclet number, which is the ratio of advection to diffusion and is the Schmidt number, which is the ratio between the momentum and mass diffusivities:
| (S3) |
where is the mobility, with the Boltzmann constant and the temperature, the density, the viscosity, and is the diffusion coefficient.
The boundary conditions are given as:
| (S4) |
where represents the concentration gradient at the direction normal to particle surface, the slip velocity and is the tangential gradient. The top and bottom boundaries (at direction) of the domain are set as solid walls, and all other domain boundaries (at and directions) are set as periodic.
We used a central second-order finite difference scheme to spatially discretize the governing equations, with homogeneous staggered grids used in both the horizontal and vertical directions. The equations are integrated by a fractional-step method, with non-linear terms computed explicitly using a low-storage third-order Runge-Kutta scheme and the viscous terms computed implicitly by a Crank-Nicolson scheme Verzicco and Orlandi (1996). For the particle boundary, we make use of the moving least squares (MLS) based immersed boundary (IB) method, where the particle interface is represented by a triangulated Lagrangian mesh Spandan et al. (2017). For the detailed numerical methods and validation, we refer to Chen et al. (2021).
In simulations, we observed the onset of symmetry breaking for ; the velocity profile in the inset of Fig. 4a is taken from a simulation with .
10 Supplementary Movie captions
![[Uncaptioned image]](/html/2303.13442/assets/SI_movies/MovieS1.png)
Movie S1. Temperature dependent droplet dynamics at PF127 + TTAB, showing a reversible transition from meandering to straight swimming to arrest during a heating and subsequent cooling ramp with a set rate of .
![[Uncaptioned image]](/html/2303.13442/assets/SI_movies/MovieS2.png)
Movie S2. Temperature dependent droplet dynamics at PF127 + TTAB, showing a reversible transition from chaotic to straight swimming to arrest during a heating and subsequent cooling ramp with a set rate of
![[Uncaptioned image]](/html/2303.13442/assets/SI_movies/MovieS3.png)
Movie S3. Droplet trajectory at PF127 + TTAB, during multiple heating and subsequent cooling ramps at a set rate of .
![[Uncaptioned image]](/html/2303.13442/assets/SI_figs/speedtraced.png)
Movie S4. Fluorescent microscopy visualising droplet chemical trails upon heating and subsequent cooling ramp with a set rate of .
![[Uncaptioned image]](/html/2303.13442/assets/SI_movies/MovieS5.png)
Movie S5.Internal flow visualisation with increasing temperature, starting at a mixed dipolar/quadrupolar mode (meandering), over a purely dipolar mode (straight) that recedes to the anterior (slowdown) and onset of motion during cooling. Excerpts recorded during one continuous experiment, playback (at 40 fps) corresponding to real-time during heating, sped up by 5x during cooling.
![[Uncaptioned image]](/html/2303.13442/assets/SI_movies/MovieS6.png)
Movie S6. Onset of active motion during recooling in a droplet containing tracer colloids, with a superimposed trajectory and the recorded droplet speed . Experimental duration 18 seconds.