Abstract
Optical and UV properties of radio-quiet (RQ) and radio-loud (RL, relativistically "jetted") active galactic nuclei (AGN) are known to differ markedly; however, it is still unclear what is due to a sample selection and what is associated with intrinsic differences in the inner workings of their emitting regions. Chemical composition is an important parameter related to the trends of the quasar main sequence. Recent works suggest that in addition to physical properties such as density, column density, and ionization level, strong Feii emitters require very high metal content. Little is known, however, about the chemical composition of jetted radio-loud sources. In this short note, we present a pilot analysis of the chemical composition of low- radio-loud and radio-quiet quasars. Optical and UV spectra from ground and space were combined to allow for precise measurements of metallicity-sensitive diagnostic ratios. The comparison between radio-quiet and radio-loud was carried out for sources in the same domain of the Eigenvector 1 / main sequence parameter space. Arrays of dedicated photoionization simulations with the input of appropriate spectral energy distributions indicate that metallicity is sub-solar for RL AGN, and slightly sub-solar or around solar for RQ AGN. The metal content of the broad line emitting region likely reflects a similar enrichment story for both classes of AGN not involving recent circum-nuclear or nuclear starbursts.
keywords:
active galactic nuclei; optical spectroscopy; ionized gas; broad line region; interstellar medium; chemical composition; individual quasar: PKS0226-038; photoionization; radiative transferMetal content of relativistically jetted and radio-quiet quasars in the main sequence context \AuthorPaola Marziani1, Swayamtrupta Panda2 Alice Deconto Machado3, Ascension Del Olmo3 \AuthorNamesPaola Marziani, Swayamtrupta Panda, Alice Deconto Machado, and Ascension Del Olmo \corresCorrespondence: paola.marziani@inaf.it; Tel.: +39-0498293415
1 Introduction
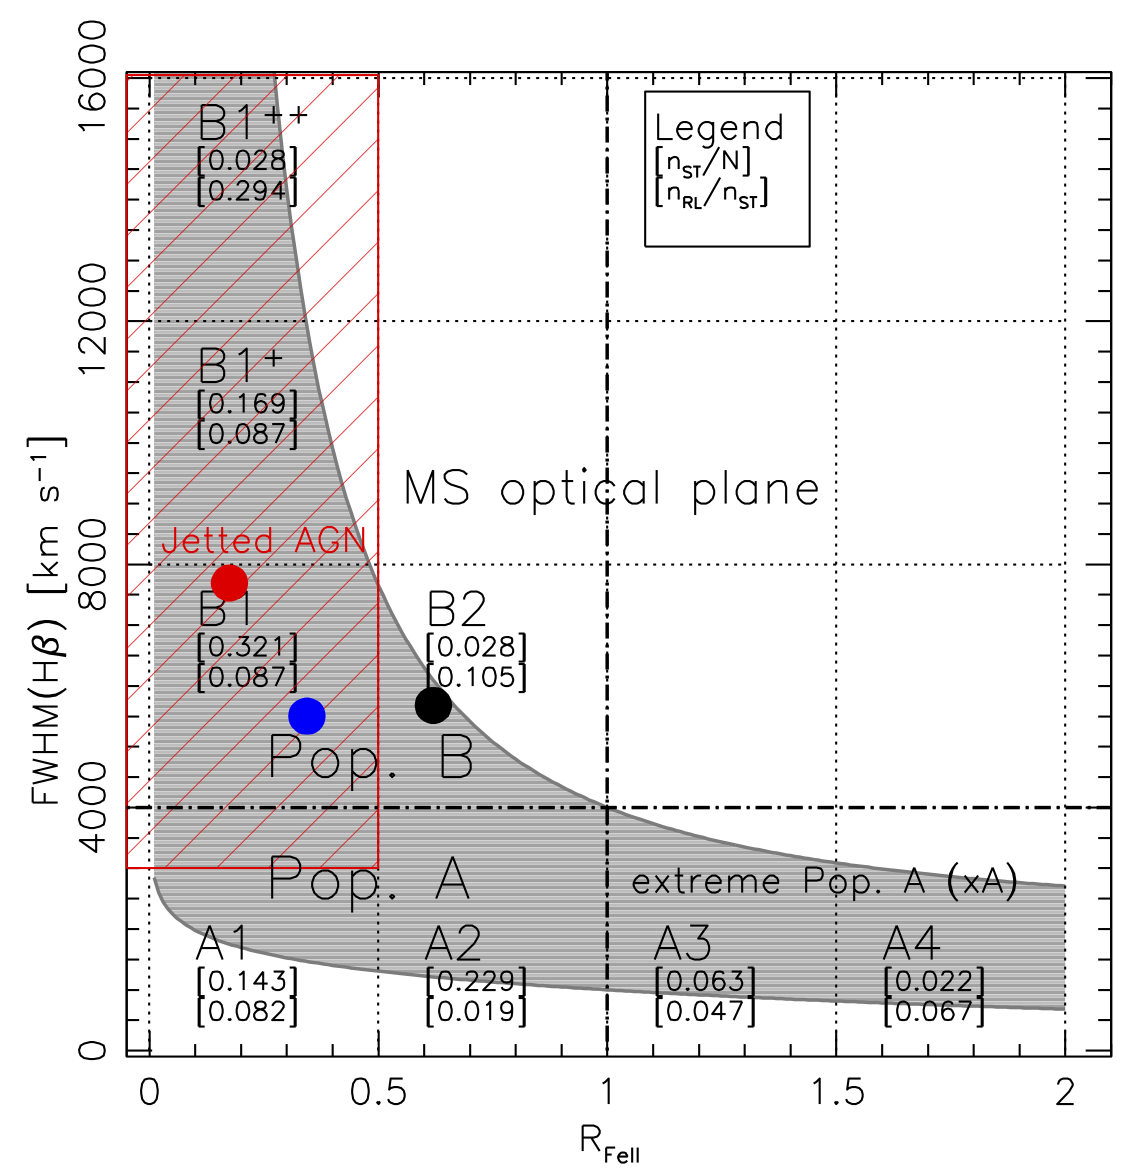
Type-1 active galactic nuclei (AGN) are characterized by the presence of broad and narrow optical and UV lines (for an introduction, see e.g., Netzer (1990); Peterson (1997); Osterbrock and Ferland (2006)). AGN spectra show a mind-boggling variety of broad emission line profiles not only among different objects but also among different lines in the spectrum of the same object. For stars, the identification of optical spectral types and luminosity classes allows for the knowledge of the most relevant physical parameters, including the star’s evolutionary status (Kaler, 1997). This feat is not as yet possible for AGN. Although, progress in the empirical classification has yielded a coarse contextualization of the main accretion properties, such as black hole mass, Eddington ratio, outflow prominence, spectral energy distributions, emitting region size, the metal content of the line emitting gas, etc. (e.g., Peterson, 2014; Du et al., 2016; Marziani et al., 2016; Panda et al., 2018, 2019; Ferland et al., 2020; Panda, 2021). The main set of correlations was derived from a principal component analysis (PCA) on a sample of several tens of quasars (Boroson and Green, 1992). The importance of the Eigenvector 1 derived from the PCA has revealed itself over the years (Sulentic and Marziani, 2015), leading to the definition of what has become known as the main sequence of quasars (Sulentic et al., 2000; Shen and Ho, 2014). The optical plane of this main sequence is identified by the line width of the HI Balmer line H (FWHM H) and the prominence of a singly-ionized emission, defined as the flux ratio between the FeII blends centered at and H itself (hereafter ). The distribution of type 1, unobscured AGN takes the form of an elbow-shaped sequence in the optical plane (see e.g., Figure 1). The ranges of and FWHM H define spectral types (Sulentic et al., 2002; Shen and Ho, 2014), and different classes may show different occupations in the plane (Figure 1). A case in point is provided by RQ and RL (Zamfir et al., 2008): most powerful, relativistically jetted sources cluster in Population B - with moderate Feii emission and relatively broad H line profiles (4000 km s-1 FWHM(H) km s-1). The broader spectral type shows higher fractions of RL; however, these spectral bins have a low prevalence, and a sizeable fraction of all type 1 AGN falls only in bin B1. This spectral type is, therefore, well suited for an inter-comparison between RQ and RL properties. In the following, we will build composite spectra for jetted and non-jetted sources of spectral type B1 (§ 2). The analysis takes advantage of the main sequence (MS) correlations concerning line profiles in the spectral type B1 (§ 3). It’s focused on the measurements of intensity ratios intended to be diagnostics of the metal content of the line emitting gas. Intensity ratios are interpreted using arrays of photoionization simulations covering a broad range in metallicity. Results (§ 4) suggest slightly sub-solar or solar metallicity and provide evidence of significant diversity in terms of chemical enrichment and evolutionary status along the main sequence (§ 5).
2 Composite spectra for spectral type B1 quasars
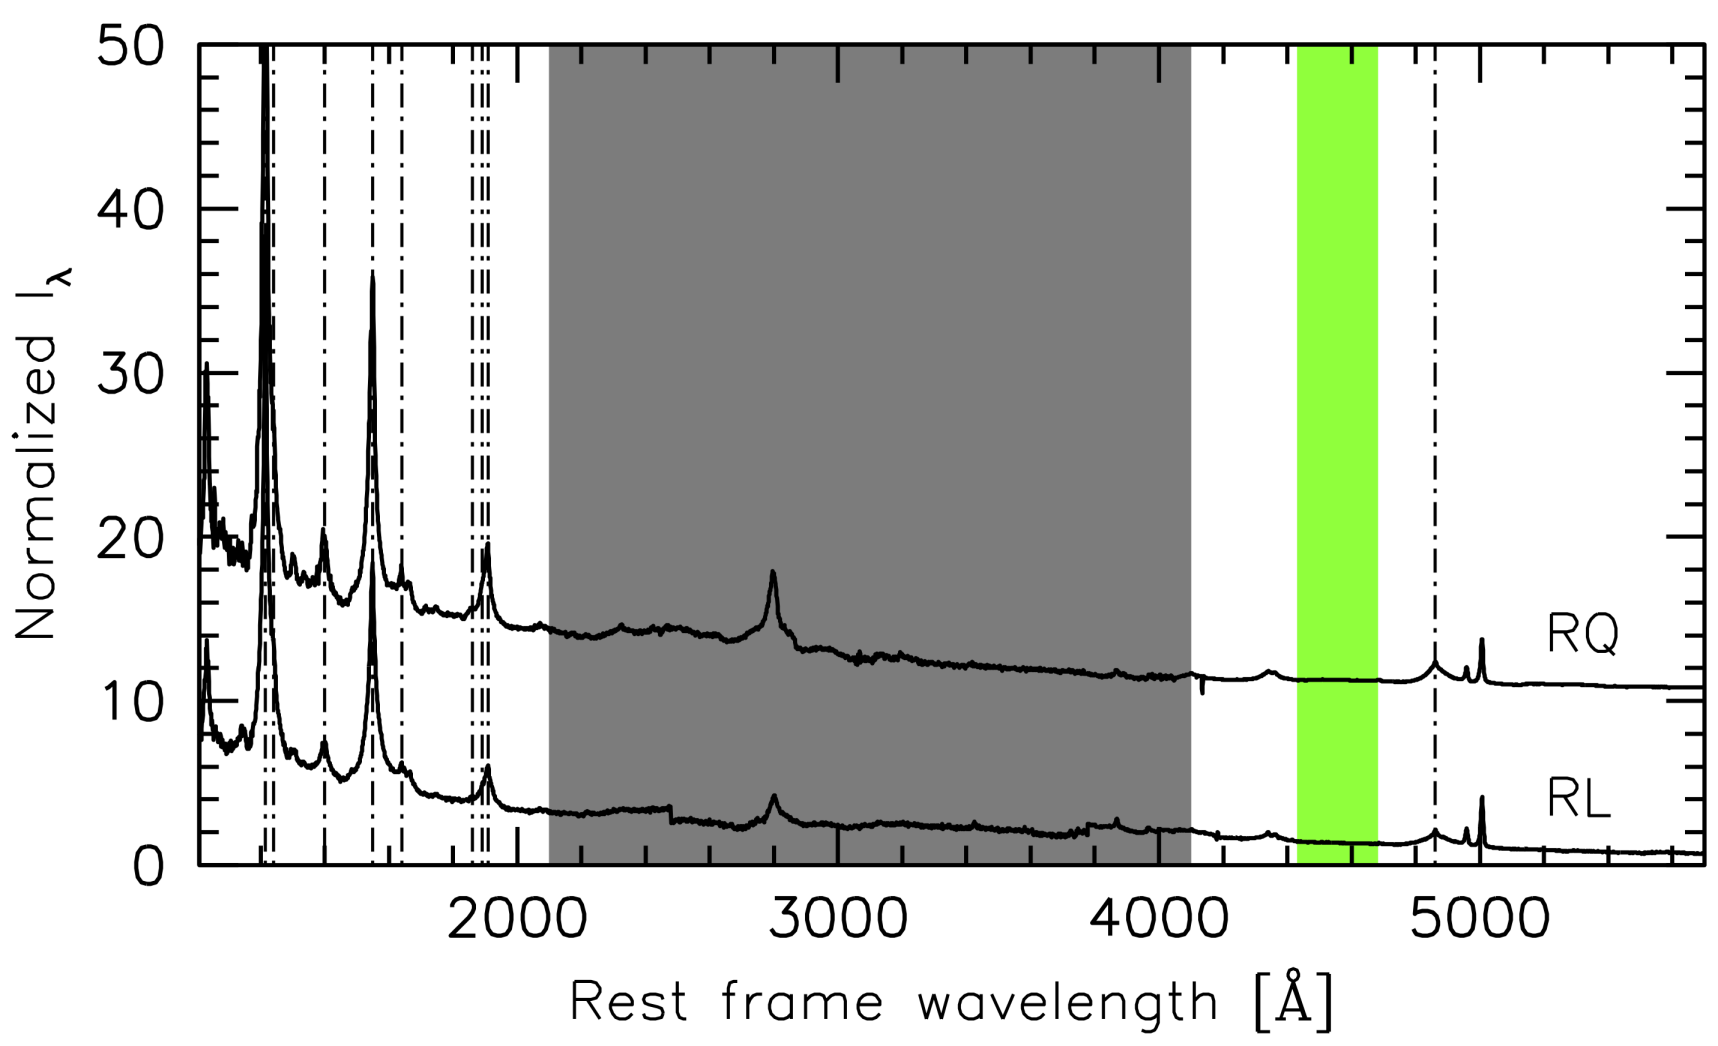
To obtain spectral data of good quality covering the full spectral ranges from 1000 Å to Å (i.e., from Ly to H included) for the same object is still a non-trivial feat for low- quasars, as the UV coverage demands space-based observations. Here, we consider one sample of 20 RL and one sample of 16 RQ sources, all belonging to spectral type B1, in the redshift range 0.002 – 0.5 and , for RQ and RL respectively. The absolute magnitudes derived from the quick look magnitudes in the NASA Extragalactic Database (NED), and the range is between –21 and –27 (RQ), and between –23.5 and –26.5 (RL), which correspond to bolometric luminosities in the range [erg s-1]. The UV data are HST/FOS observations analyzed in Ref. Sulentic et al. (2007), and the optical spectra were obtained from Ref. Marziani et al. (2003). The spectral similarity ensures consistency of black hole mass and Eddington ratio. We built median and average composites for the RQ and RL classes that look consistent. As the median combination is not improving the S/N, the fitting analysis was performed only on the averages. The average S/N is high with S/N90 for the RQ composites, and and for the visual and UV ranges in the RL composite, respectively. The composite spectra are shown in Figure 2.
3 Analysis
3.1 Line profiles
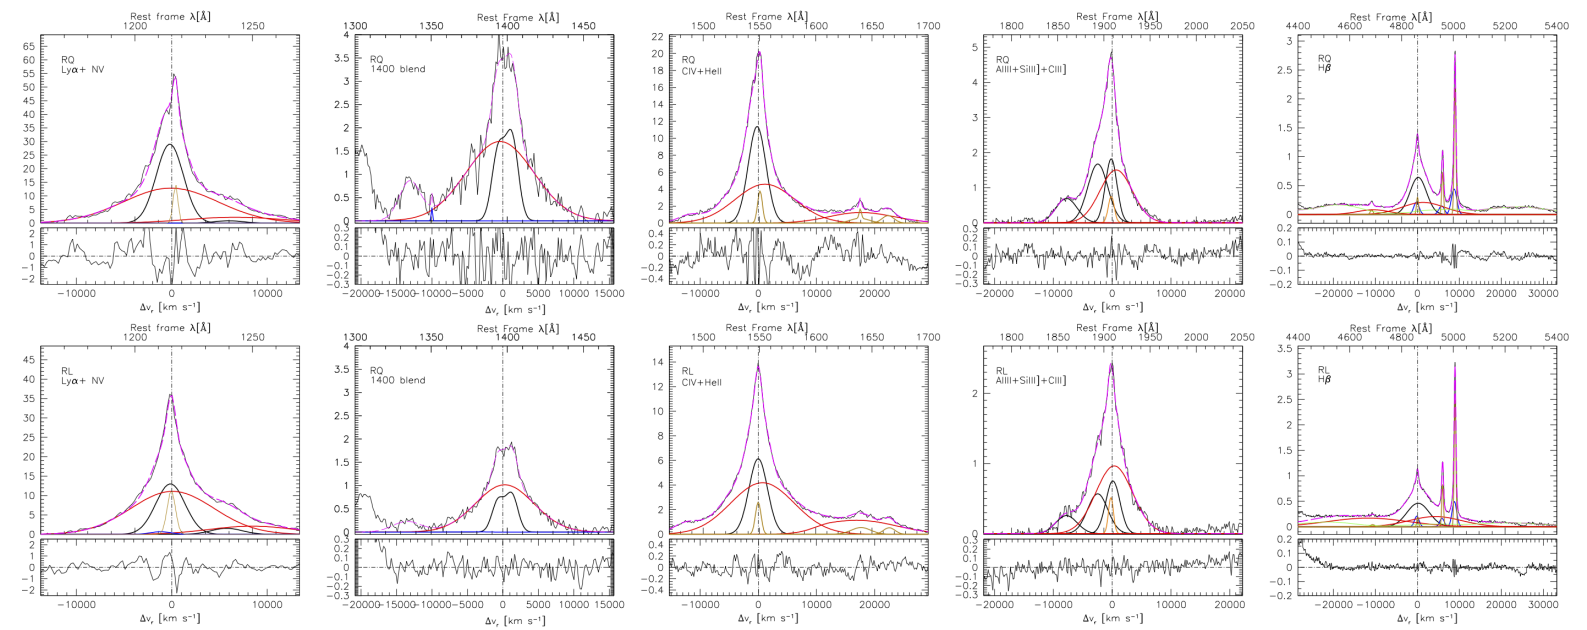
Pop. B H profiles show a redward asymmetry modeled with a broader redshifted (FWHM 10000 km s-1, shift at line base km s-1) and a narrower Gaussian (Sulentic et al., 2002; Marziani et al., 2009). The very broad Gaussian component is meant to represent the innermost part of the broad line region (BLR), providing a simple representation of the radial stratification of the BLR in Pop. B suggested by reverberation mapping (Snedden and Gaskell, 2007). This component (hereafter the very broad component, VBC) has been associated with a physical region of high-ionization virialized gas and closest to the continuum source - the very broad line region, VBLR (Peterson and Ferland, 1986; Brotherton et al., 1994; Sulentic et al., 2000; Wang and Li, 2011). While the physical properties of the VBLR line emitting gas are not well known, a decomposition of the full H profile into a symmetric, unshifted H component (H) and a H provide an excellent fit to most H Pop. B profiles (Sulentic et al., 2002; Zamfir et al., 2010).
The multicomponent fits were performed using the specfit routine from IRAF (Kriss, 1994). This routine allows for the simultaneous minimum- fit of the continuum approximated by a power law and the spectral line components yielding FWHM, peak wavelength, and intensity for all line components. In the optical range, we fit the H profile and the [Oiii]4959,5007 emission lines, and the Feii multiplets for the composite objects.
3.2 Diagnostics of Metallicity and photo-ionization modeling
Diagnostics from the rest-frame UV spectrum take advantage of the observations of strong resonance lines that are collisionally excited Negrete et al. (2012, 2013) and at least constrain density , ionization parameter , and chemical abundance . For instance, C IV1549/Ly, C IV1549/(Si IV + O IV])1400, C IV1549/He II1640, N V1240/He II1640 are sensitive to metallicity; and Al III1860/Si III]1892, Si III]1892/C III]1909 are sensitive to density, since inter-combination lines have a well defined critical density (Negrete et al., 2012; Marziani et al., 2015). Ratios of lines involving different ionic stages of the same element are obviously sensitive to the ionization parameter. The lines emitted from ionic species of Silicon and Aluminium deserve special attention - they are two elements greatly enhanced in Supernova ejecta (Chieffi and Limongi, 2013). This approach has yielded tight constraints, especially for sources radiating at high Eddington ratio (Negrete et al., 2012; Śniegowska et al., 2021; Garnica et al., 2022), where physical properties are consequently well-constrained because they converge toward an extreme.
The photo-ionization code Cloudy Ferland et al. (2017) models the ionization, chemical, and thermal state of gas exposed to a radiation field and predicts its emission spectra and physical parameters. Cloudy simulations require inputs in terms of , , , quasar spectral energy distribution (SED), and column density . The ionization parameter , where is the number of ionizing photons, provides the ratio between photon and hydrogen number density and is dependent on the spectral energy distribution of the ionizing continuum. The simulations were carried out assuming the RL and RQ SEDs from Laor et al. Laor et al. (1997) representative of the SED of B1 objects (work in preparation). The geometry was assumed open, plane-parallel, meaning that a slab of emitting gas is exposed to a radiation field only on one side. Arrays of Cloudy photo-ionization models111N() N(U) = 425. The overall number of models includes 14 values of metallicity, and for RL and RQ SEDs, is 6,358. for a given metallicity and column density , constant density and ionization parameter were evaluated at steps of 0.25 dex covering the ranges [cm-3], . The single-value metallicity arrays were computed for at -3.0, -2.7, -2.3, -2.0, -1.7, -1.3, -1.0, -0.7, -0.3, 0, 0.3., 0.7, 1.0, and 1.3 in solar units, i.e. from 0.001 to 20 .No dust and no microturbulence broadening were included in the calculations. The calculations are based on a single zone assumption for the BLR. The lowest values of the density may bias the solutions toward cases where significant [Oiii]4959,5007 is expected; all cases with [Oiii]5007/H were excluded, as no broad [Oiii]4959,5007 is observed. A more refined analysis in the framework of the locally optimized emitting cloud model (Baldwin et al., 1995; Korista et al., 1997; Guo et al., 2020) is deferred to an eventual work.
4 Results
4.1 Composite spectra
The composite average spectra are shown in Figure 2. The spectral similarity between the two classes already evident in Figure 2 is confirmed by the profile comparison of Fig. 3. Both spectra are Feii weak; show weak Nv; Aliii is weak while the Ciii] line is by far the most prominent in the 1900 Å blend encompassing Siiii] and Ciii] along with Aliii. All lines can be successfully decomposed into a BC and a VBC. Apparently, there is no VBC in the Aliii and Siiii] lines and in FeiiṄo prominent BC is observed in the Heii optical and UV lines, at variance with H, Ly, Civ, and the other lines. The absence of a prominent BC in Helium lines is typical (Marziani and Sulentic, 1993), albeit the implications for the BLR structure are not obvious even on a qualitative basis. Table 1 reports the line fluxes normalized to H. In view of the heuristic decomposition approach, fluxes are reported for the BC, VBC, and sum of the two components, i.e., for the full broad profile (total flux). Each value in this table has been normalized by the corresponding component of H. Error analysis has been performed empirically or on the basis of previous analyses (H and Feii: Refs. Marziani et al. (2003, 2022); Civ: (Sulentic et al., 2017); blend at 1900 Å: Refs. Garnica et al. (2022); Marziani et al. (2022); Nv: Ref. Śniegowska et al. (2021)). The undetected Heii BC was considered in the models as Heii/H 0.1. A more refined treatment of uncertainties is deferred to future work.
| Line Id. | Comp. | ||
|---|---|---|---|
| RQ | RL | ||
| Nv | BC | 0.257 0.081 | 0.450 0.142 |
| VBC | 2.604 0.701 | 1.646 0.792 | |
| Total | 1.323 0.402 | 1.053 0.320 | |
| Siiv+ Oiv]1402 | BC | 0.667 0.149 | 0.294 0.053 |
| VBC | 2.237 0.403 | 0.961 0.173 | |
| Total | 1.380 0.218 | 0.630 0.100 | |
| Civ | BC | 4.382 0.620 | 2.545 0.360 |
| VBC | 7.158 1.012 | 5.840 0.826 | |
| Total | 5.643 0.399 | 4.207 0.297 | |
| Heii1640 | BC | 0.228 0.072 | 0.238 0.075 |
| VBC | 2.099 0.469 | 1.817 0.406 | |
| Total | 1.078 0.222 | 1.034 0.213 | |
| Aliii | BC | 0.388 0.123 | 0.150 0.046 |
| Total | 0.485 0.100 | 0.156 0.063 | |
| Ciii] | BC | 0.556 0.124 | 0.291 0.064 |
| VBC | 1.548 0.346 | 0.951 0.213 | |
| Total | 1.007 0.113 | 0.624 0.070 | |
| Feii4570 | Total | 0.344 0.088 | 0.175 0.088 |
| Heii | BC | ||
| VBC | 0.299 0.152 | 1.299 | |
| Total | 0.136 0.068 | 0.655 |
Spectral differences between the two classes are not striking on a qualitative basis. We note a stronger redward asymmetry in RL sources. This is, however, a result known for a long time (Marziani et al., 2003; Punsly, 2010). The optical Feii emission is twice as strong in RQ than in RL; this is also consistent with previous results Marziani et al. (2021). The intensity ratios most commonly used in estimates are marginally higher for RQ than for RL. Siiv+Oiv]1402/Civ, 0.24 vs 0.15 for RQ and RL, respectively. Similarly, Aliii/Ciii] 0.2 vs 0.12; Nv/H 1.32 vs 1.05, if total fluxes are considered.
We computed the normalized in the following form, to constrain the value of the metallicity from the values of the diagnostic ratios. For each spectrum , and for each component , we can write (following Ref. Śniegowska et al. (2021)):
| (1) |
where the summation is made over the available diagnostic ratios. The number of degrees of freedom is 8 for the composites and 7 for the case of PKS 0226-038 presented in § 4.2. The is computed to the results of the Cloudy simulations as a function of , , and (subscript ‘mod’). The following independent intensity ratios were considered in the summation: Nv/Civ, Civ/Heii1640, Civ/H, Siiv+Oiv]1402/Civ, Aliii/Civ, Aliii/Siiii], Aliii/Ciii], Heii/H, Feii4570/H. The ratios were computed for BC, VBC, and total line intensity. Non-detections were treated as upper limits.
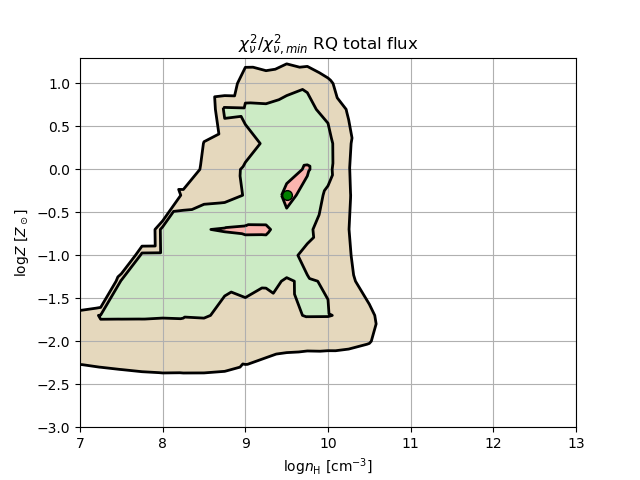
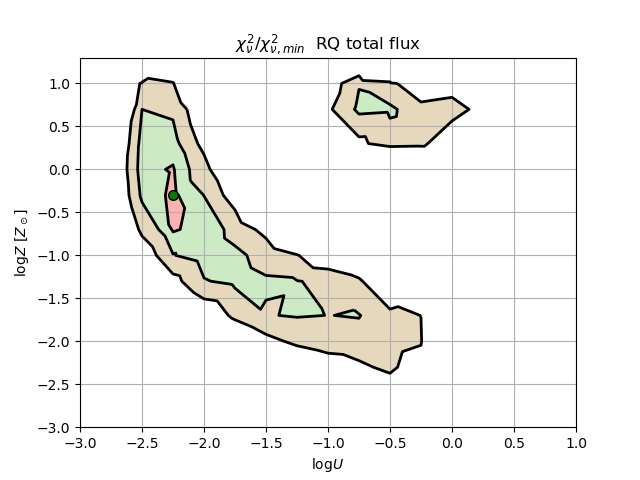
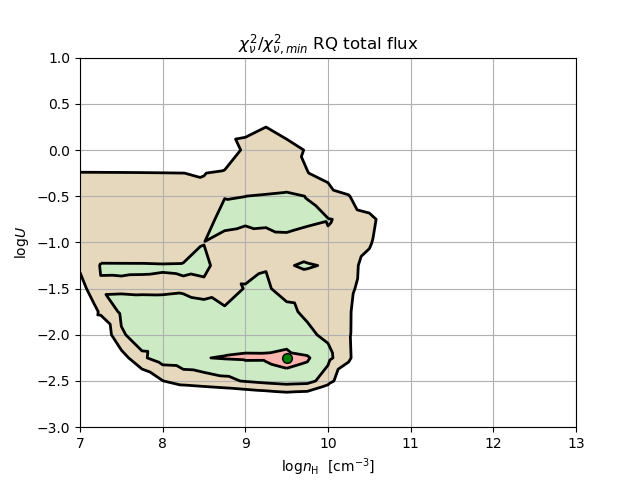
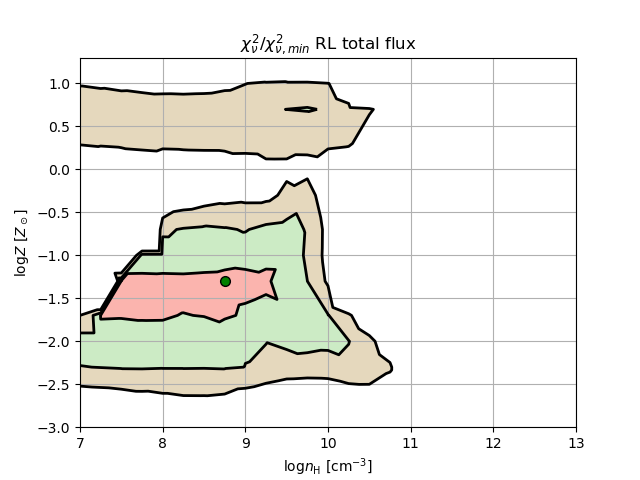
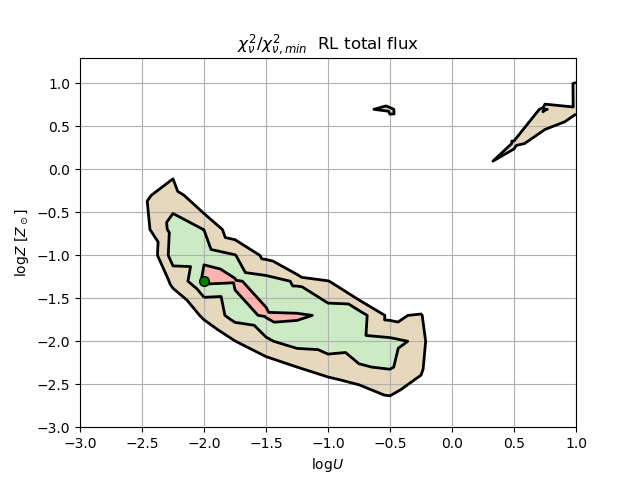
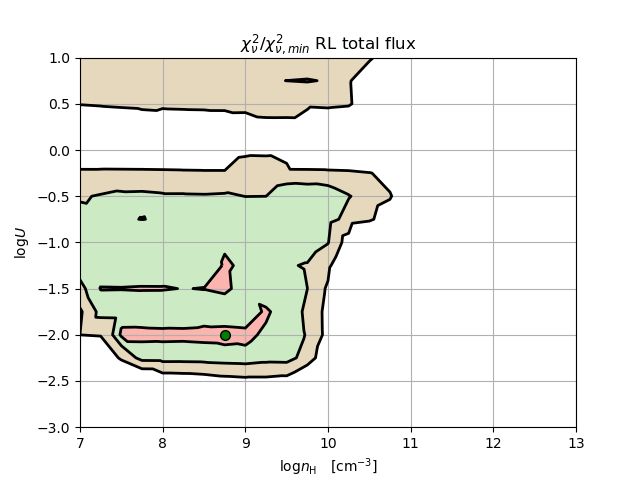
Fig. 4 shows the projections of the 3D space , , . Each contour in the plane braces elements of the grid of Cloudy parameter space that is consistent with the minimum within the uncertainties at 1, 2, and 3 confidence levels.
The distribution of the data points is constrained in a range of , , , at very low density, relatively high ionization, and low metallicity. Within the limit in , and , the distribution of is slightly subsolar for the RQ (), and even more subsolar for the radio loud, (). There is a relatively broad range of density and ionization parameters and metallicities that are consistent within confidence level from the minimum . This is probably a reflection of the stratified nature of the emitting region in Population B and the intrinsic heterogeneity of the composites.
The values reported in Table 2 for the sub-regions confirm the validity of the virial scenario, with increasing by a factor between BLR and VBLR. The derived density is not changing strongly, as implied by the strong Ciii] VBC. Since the distance from the center of gravity scales with the inverse of the velocity dispersion squared (i.e., FWHM-2, we might expect that FWHM/FWHM. The values reported in Table 2 indicate ratios between 1 – 2 orders of magnitudes, consistent with the ones expected from a virial velocity field.
The values all fall in ranges that are consistent. The results for the sub-regions should be seen with some care, as the VBC measurements are difficult for Heii, Heii1640, Nv. The fairly high metallicity value for RQ VBLR is due to several line ratios being consistently higher than for the RL case: Civ/H, (Siiv+Oiv]1402)/Civ, (Siiv+Oiv]1402)/Heii1640, and Nv/Heii1640 are between 30% and a factor 2 higher for the VBLR of RQ than of RL. This epitomizes the need for very accurate measurements on the line profiles.
These results can be compared with the ones derived from the analysis of the Sloan composite spectrum (Vanden Berk et al., 2004). Values of the intensity ratios reported in their Table 2, and the assumption of typical 10% uncertainties for most ratios, do not provide any constraint on , and loose constraints on density () and ionization (). Averaging the full dataset of a large color-based spectroscopic survey presents major hindrances. Spectral bins are likely to be associated with intrinsic differences in . Building a composite combines all survey spectra with a weight proportional to the relative prevalence of each spectral type (e.g., Sulentic and Marziani, 2015). Since the most populated spectral bins along the sequence is B1, with A2 the second most populated (Marziani et al., 2013; Shen and Ho, 2014), the appearance of the composite spectrum is resembling the Pop. B RQ composite is some key features, and A2 in others. For example, the moderate Feii/H and Siiv+Oiv]1402)/Civ values are consistent with solar or supersolar supersolar . The composite is yielding line ratios that reflect a combination of physical properties from individual spectra; on the other hand, it does not reflect the spectral diversity of a large population of type-1 AGN, as extreme sources are just a minority (%; Fig. 1).
| Class | Region | ||||||
|---|---|---|---|---|---|---|---|
| RQ | Tot. | -2.25 | -2.25 – -2.25 | -0.30 | -0.70 – 0.00 | 9.50 | 8.50 – 9.75 |
| RQ | BLR | -2.25 | -2.25 – -1.75 | 0.30 | -0.70 – 1.00 | 10.25 | 9.25 – 10.75 |
| RQ | VBLR | 0.00 | 0.00 – 0.00 | 0.70 | 0.70 – 0.70 | 9.50 | 9.50 – 9.75 |
| RL | Tot. | -2.00 | -2.00 – -0.75 | -1.30 | -2.00 – -1.30 | 8.75 | 7.00 – 9.75 |
| RL | BLR | -1.50 | -2.00 – -0.75 | -1.70 | -2.00 – -1.00 | 10.25 | 8.75 – 10.50 |
| RL | VBLR | -0.75 | -1.25 – -0.25 | -2.00 | -2.00 – -1.70 | 7.75 | 7.00 – 10.25 |
a: ionization parameter , abundance in solar units, and Hydrogen particle density in units of cm-3. The ranges are defined by the limiting elements of the model grid that are compatible with the minimum within 1 confidence level.
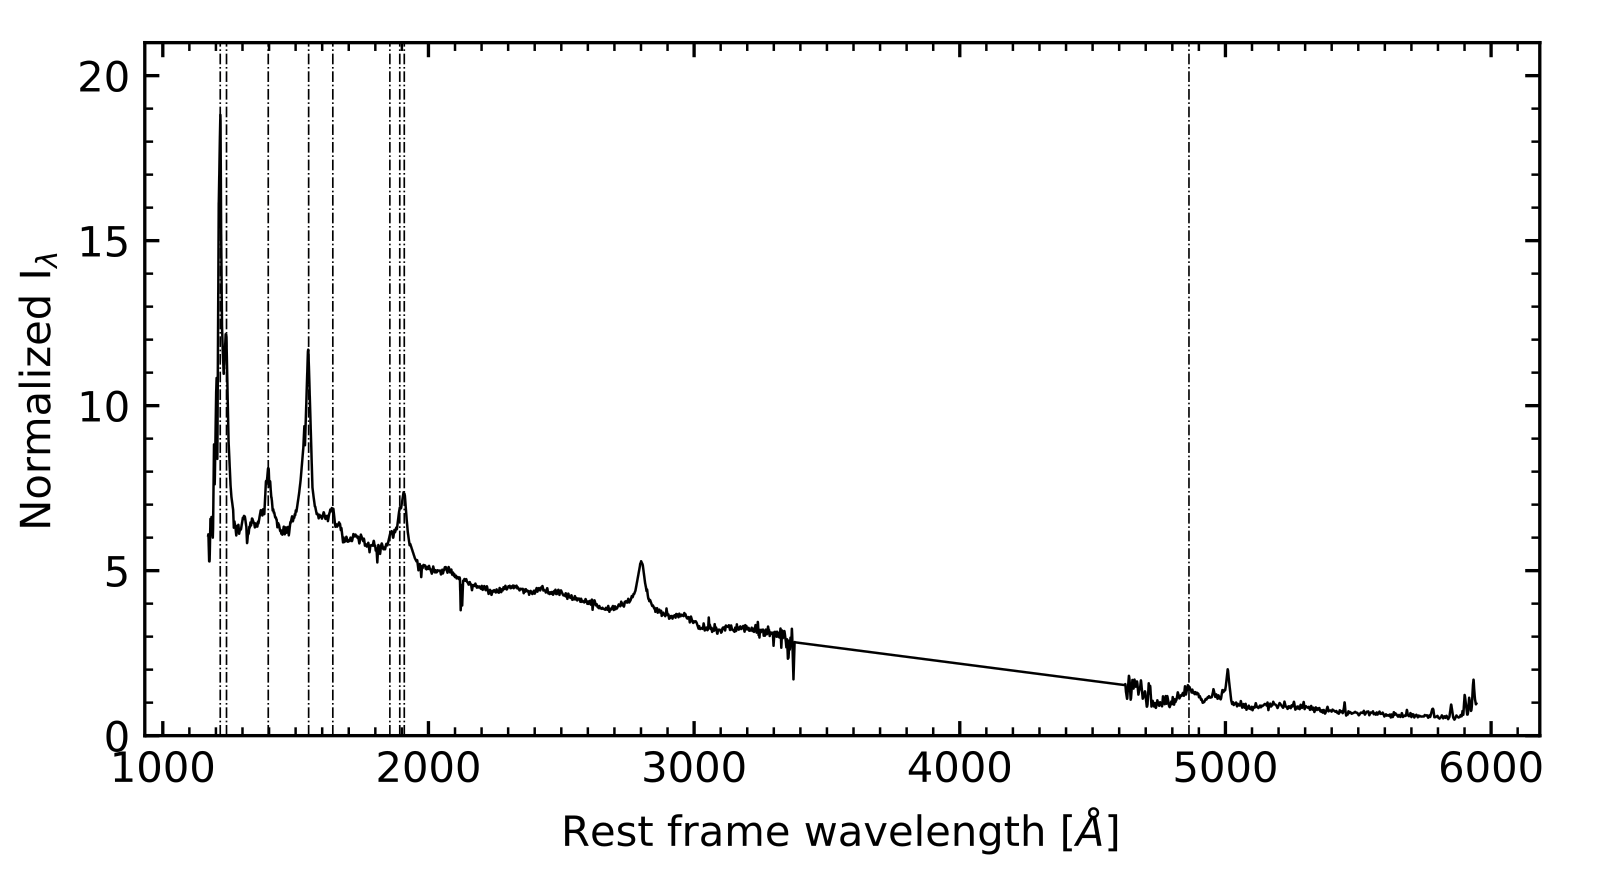
4.2 A typical RL source at high
PKS 0226–038 is a luminous jetted source at the cosmic noon ( 2.06922; , and Kellermann’s radio loudness parameter Kellermann et al. (1989), ). Its optical and UV spectrum is markedly different from the Population B composite at low : Ciii] is weaker, Feii stronger, and Aliii is almost as strong as Civ (Fig. 5). No diagnostic based on Nv and Heii is available in this case. The measured diagnostic ratios are reported in Table 3. The uncertainties were assumed to be % for the intensities normalized to H save for Civ/H that is affected by a re-scaling ( 20%) and for Feii4570 for which = 0.1 was assumed. In this case, the Feii4570 (Fig. 5) is partly missing because of a telluric absorption. The Feii optical emission is well-represented by a "solid" template with fixed multiplet ratios.
| Ratio Id. | Value |
|---|---|
| Civ/Heii1640 | 4.436 0.627 |
| (Siiv+ Oiv]1402)/Civ | 0.361 0.051 |
| (Siiv+ Oiv]1402)/Heii1640 | 1.603 0.227 |
| Civ/H | 3.460 0.720 |
| Aliii/Civ | 0.986 0.139 |
| Aliii/Siiii] | 0.642 0.091 |
| Siiii]/Ciii] | 6.034 0.853 |
| 0.62 0.10 |
aLine ratios refer to the total flux of the full broad line profiles.
The derived values of the metallicity are well constrained with minimum obtained for , with uncertainty equal to 0.3 dex. The ionization parameter and density [cm-3] are significantly lower and higher with respect to the values at low-. The three parameters reflect the moderate , high Aliii/Civ (yielding low ionization and high ), and low Ciii]/Siiii] (implying a high density).
5 Discussion: metal enrichment along the quasar Main Sequence
Several basic results emerge from the present analysis:
- 1
-
RQ Pop. B sources show slightly sub-solar or solar metallicities;
-
in the same spectral bin along the MS, RL sources show definitely sub-solar chemical abundances, lower with respect to RQ. The difference is not marginal and is supported by several diagnostic indicators consistently observed to be lower in RL sources. It is also consistent with the location of the RL template in the MS, displaced toward broader H and lower with respect to the RQ one.
- 2
The first result is not completely unexpected, since a similar analysis yielded slightly sub-solar abundances for NGC 1275 (Punsly et al., 2018) and Pop. B sources are known to have similar intensity ratios (Marziani et al., 2010).
The origin of the RQ and RL difference is likely associated with a difference in sample/host galaxy evolutionary history. At the modest accretion rates required to sustain the low Eddington ratio of B1 sources, there is no need to invoke "cataclysmic" events such as recent, major wet mergers to explain the AGN luminosity via super-Eddington accretion rates (D’Onofrio and Marziani, 2018), and accretion material could be provided via stellar mass loss in early-type galaxies (Padovani and Matteucci, 1993). The general impression of low- Population B is that of fairly evolved systems, past their prime of accretion events (Fraix-Burnet et al., 2017). This impression, is further reinforced in the case of radio-loud sources, where sub-parsec binary black holes at the stable end of their in-spiral phase are relatively frequent (Krause et al., 2019).
The gradient in chemical composition is also no surprise. While it is possible to account for an increase in Feii along the sequence only based on ionization degree and density Marziani et al. (2001), a thorough quantitative assessment requires also a change in chemical composition Panda et al. (2019). We pass from sources where singly ionized iron emission is barely detected to sources where it dominates the thermal balance of the emitting regions, overwhelming the entire Balmer line emission.
The case of the high- RL source PKS 0226–038 signifies the co-existence of powerful relativistic ejections and BLR physical conditions typical of sources radiating at (Population A according to Ref. Sulentic et al. (2000)). It is known for a long time that the radio-loud fraction among AGN increases with redshift Padovani et al. (1993); La Franca et al. (1994). However, the realization of the high prevalence of unambiguously jetted AGN at radiating at high is a recent result. The Eddington ratio of PKS 0226-038 is . It belongs to the spectral type B2, that include sources in the range 0.5 – 1, and with moderate accretion rate. Strong Feii emission is a rather rare occurrence among RLs at low- (especially in Fanaroff-Riley II sources, (Zamfir et al., 2008)), it is frequently found at high redshift (Ref. Deconto-Machado et al. (2022), and article in preparation), along with higher . This is probably a consequence of the increase in average accretion rate at the epochs corresponding to the cosmic noon (Cavaliere and Vittorini, 2000; Marconi et al., 2004; Hopkins et al., 2006), and much beyond. Indeed, highly accreting jetted sources are being discovered up to redshift (Bañados et al., 2021; Ighina et al., 2023).
6 Conclusions
This pilot work revealed a population of quasars with slightly sub-solar abundances. We can infer a metallicity trend along the quasar MS on the basis of previous results and of the analysis presented in this paper, supporting the assumptions in the study of Panda et al. Panda et al. (2019), although the MS-oriented analysis has been yet focused only on the spectral types, B1 and extreme Population A. Full analysis for individual spectral types isolated along the MS (Sulentic et al., 2002) is still needed. Special attention should also be devoted to high- high- sources. At high-, sample selection effects could be even more important, excluding a population of sources on the basis of their low accretion rate (Sulentic et al., 2014). At high luminosities, wind effects are expected to be maximized and may introduce another factor in the chemical enrichment of the broad-line emitting gas.
All authors contributed equally to this paper.
Acknowledgements.
SP acknowledges the financial support from the Conselho Nacional de Desenvolvimento Científico e Tecnológico (CNPq) Fellowship (164753/2020-6) and the computational facility at Nicolaus Copernicus Astronomical Center in Warsaw, Poland where the Cloudy simulations presented in this work were performed. \conflictsofinterestThe authors declare no conflict of interest. \abbreviationsThe following abbreviations are used in this manuscript:| AGN | Active Galactic Nucleus |
| BC | Broad Component |
| BLR | Broad Line Region |
| FWHM | Full Width Half-Maximum |
| MS | Main Sequence |
| NLSy1 | Narrow-Line Seyfert 1 |
| RL | Radio loud |
| RQ | Radio quiet |
| SDSS | Sloan Digital Sky Survey |
| SED | Spectral energy distribution |
| S/N | Signal-to-noise ratio |
| VBC | Very Broad Component |
| VBLR | Very Broad Line Region |
References
- Netzer (1990) Netzer, H. AGN emission lines. Active Galactic Nuclei; R. D. Blandford, H. Netzer, L. Woltjer, T. J.-L. Courvoisier, & M. Mayor., Ed., 1990, pp. 57–160.
- Peterson (1997) Peterson, B.M. An Introduction to Active Galactic Nuclei; Cambridge University Press, 1997.
- Osterbrock and Ferland (2006) Osterbrock, D.E.; Ferland, G.J. Astrophysics of gaseous nebulae and active galactic nuclei; University Science Books: Mill Valley, CA, 2006.
- Kaler (1997) Kaler, J.B. Stars and their Spectra, An Introduction to the Spectral Sequence; Cambridge University Press, 1997.
- Peterson (2014) Peterson, B.M. Measuring the Masses of Supermassive Black Holes. SpScieRev 2014, 183, 253–275. doi:\changeurlcolorblack10.1007/s11214-013-9987-4.
- Du et al. (2016) Du, P.; Wang, J.M.; Hu, C.; Ho, L.C.; Li, Y.R.; Bai, J.M. The Fundamental Plane of the Broad-line Region in Active Galactic Nuclei. ApJL 2016, 818, L14, [1601.01391]. doi:\changeurlcolorblack10.3847/2041-8205/818/1/L14.
- Marziani et al. (2016) Marziani, P.; Sulentic, J.W.; Stirpe, G.M.; Dultzin, D.; Del Olmo, A.; Martínez-Carballo, M.A. Blue outliers among intermediate redshift quasars. ApSS 2016, 361, 3, [1511.07138]. doi:\changeurlcolorblack10.1007/s10509-015-2590-2.
- Panda et al. (2018) Panda, S.; Czerny, B.; Adhikari, T.P.; Hryniewicz, K.; Wildy, C.; Kuraszkiewicz, J.; Śniegowska, M. Modeling of the Quasar Main Sequence in the Optical Plane. The Astrophysical Journal 2018, 866, 115. doi:\changeurlcolorblack10.3847/1538-4357/aae209.
- Panda et al. (2019) Panda, S.; Marziani, P.; Czerny, B. The Quasar Main Sequence Explained by the Combination of Eddington Ratio, Metallicity, and Orientation. ApJ 2019, 882, 79, [arXiv:astro-ph.HE/1905.01729]. doi:\changeurlcolorblack10.3847/1538-4357/ab3292.
- Ferland et al. (2020) Ferland, G.J.; Done, C.; Jin, C.; Landt, H.; Ward, M.J. State-of-the-art AGN SEDs for photoionization models: BLR predictions confront the observations. MNRAS 2020, 494, 5917–5922, [arXiv:astro-ph.HE/2004.11873]. doi:\changeurlcolorblack10.1093/mnras/staa1207.
- Panda (2021) Panda, S. Physical Conditions in the Broad-line Regions of Active Galaxies. PhD thesis, Polish Academy of Sciences, Institute of Physics, 2021.
- Boroson and Green (1992) Boroson, T.A.; Green, R.F. The Emission-Line Properties of Low-Redshift Quasi-stellar Objects. ApJS 1992, 80, 109. doi:\changeurlcolorblack10.1086/191661.
- Sulentic and Marziani (2015) Sulentic, J.; Marziani, P. Quasars in the 4D Eigenvector 1 Context: a stroll down memory lane. Frontiers in Astronomy and Space Sciences 2015, 2, 6, [1506.01276]. doi:\changeurlcolorblack10.3389/fspas.2015.00006.
- Sulentic et al. (2000) Sulentic, J.W.; Marziani, P.; Dultzin-Hacyan, D. Phenomenology of Broad Emission Lines in Active Galactic Nuclei. ARA&A 2000, 38, 521–571. doi:\changeurlcolorblack10.1146/annurev.astro.38.1.521.
- Shen and Ho (2014) Shen, Y.; Ho, L.C. The diversity of quasars unified by accretion and orientation. Nat 2014, 513, 210–213, [1409.2887]. doi:\changeurlcolorblack10.1038/nature13712.
- Sulentic et al. (2002) Sulentic, J.W.; Marziani, P.; Zamanov, R.; Bachev, R.; Calvani, M.; Dultzin-Hacyan, D. Average Quasar Spectra in the Context of Eigenvector 1. ApJL 2002, 566, L71–L75, [arXiv:astro-ph/0201362]. doi:\changeurlcolorblack10.1086/339594.
- Zamfir et al. (2008) Zamfir, S.; Sulentic, J.W.; Marziani, P. New insights on the QSO radio-loud/radio-quiet dichotomy: SDSS spectra in the context of the 4D eigenvector1 parameter space. MNRAS 2008, 387, 856–870, [0804.0788]. doi:\changeurlcolorblack10.1111/j.1365-2966.2008.13290.x.
- Marziani et al. (2021) Marziani, P.; Berton, M.; Panda, S.; Bon, E. Optical Singly-Ionized Iron Emission in Radio-Quiet and Relativistically Jetted Active Galactic Nuclei. Universe 2021, 7, 484, [arXiv:astro-ph.GA/2112.02632]. doi:\changeurlcolorblack10.3390/universe7120484.
- Marziani et al. (2003) Marziani, P.; Sulentic, J.W.; Zamanov, R.; Calvani, M.; Dultzin-Hacyan, D.; Bachev, R.; Zwitter, T. An Optical Spectroscopic Atlas of Low-Redshift Active Galactic Nuclei. ApJS 2003, 145, 199–211. doi:\changeurlcolorblack10.1086/346025.
- Sulentic et al. (2007) Sulentic, J.W.; Bachev, R.; Marziani, P.; Negrete, C.A.; Dultzin, D. C IV 1549 as an Eigenvector 1 Parameter for Active Galactic Nuclei. ApJ 2007, 666, 757–777, [arXiv:astro-ph/0705.1895]. doi:\changeurlcolorblack10.1086/519916.
- Marziani et al. (2009) Marziani, P.; Sulentic, J.W.; Stirpe, G.M.; Zamfir, S.; Calvani, M. VLT/ISAAC spectra of the H region in intermediate-redshift quasars. III. H broad-line profile analysis and inferences about BLR structure. A&Ap 2009, 495, 83–112, [0812.0251]. doi:\changeurlcolorblack10.1051/0004-6361:200810764.
- Snedden and Gaskell (2007) Snedden, S.A.; Gaskell, C.M. The Case for Optically Thick High-Velocity Broad-Line Region Gas in Active Galactic Nuclei. ApJ 2007, 669, 126–134. doi:\changeurlcolorblack10.1086/521290.
- Peterson and Ferland (1986) Peterson, B.M.; Ferland, G.J. An accretion event in the Seyfert galaxy NGC 5548. Nature 1986, 324, 345–347. doi:\changeurlcolorblack10.1038/324345a0.
- Brotherton et al. (1994) Brotherton, M.S.; Wills, B.J.; Francis, P.J.; Steidel, C.C. The intermediate line region of QSOs. ApJ 1994, 430, 495–504. doi:\changeurlcolorblack10.1086/174425.
- Sulentic et al. (2000) Sulentic, J.W.; Zwitter, T.; Marziani, P.; Dultzin-Hacyan, D. Eigenvector 1: An Optimal Correlation Space for Active Galactic Nuclei. ApJL 2000, 536, L5–L9, [arXiv:astro-ph/0005177]. doi:\changeurlcolorblack10.1086/312717.
- Wang and Li (2011) Wang, J.; Li, Y. Strong Response of the Very Broad H Emission Line in the Luminous Radio-quiet Quasar PG 1416-129. ApJL 2011, 742, L12, [1110.4701]. doi:\changeurlcolorblack10.1088/2041-8205/742/1/L12.
- Zamfir et al. (2010) Zamfir, S.; Sulentic, J.W.; Marziani, P.; Dultzin, D. Detailed characterization of H emission line profile in low-z SDSS quasars. MNRAS 2010, 403, 1759, [0912.4306]. doi:\changeurlcolorblack10.1111/j.1365-2966.2009.16236.x.
- Kriss (1994) Kriss, G. Fitting Models to UV and Optical Spectral Data. Astronomical Data Analysis Software and Systems III, A.S.P. Conference Series 1994, 61, 437.
- Negrete et al. (2012) Negrete, A.; Dultzin, D.; Marziani, P.; Sulentic, J. BLR Physical Conditions in Extreme Population A Quasars: a Method to Estimate Central Black Hole Mass at High Redshift. ApJ 2012, 757, 62, [arXiv:astro-ph.CO/1107.3188].
- Negrete et al. (2013) Negrete, C.A.; Dultzin, D.; Marziani, P.; Sulentic, J.W. Reverberation and Photoionization Estimates of the Broad-line Region Radius in Low-z Quasars. ApJ 2013, 771, 31, [arXiv:astro-ph.CO/1305.4574]. doi:\changeurlcolorblack10.1088/0004-637X/771/1/31.
- Marziani et al. (2015) Marziani, P.; Sulentic, J.W.; Negrete, C.A.; Dultzin, D.; Del Olmo, A.; Martínez Carballo, M.A.; Zwitter, T.; Bachev, R. UV spectral diagnostics for low redshift quasars: estimating physical conditions and radius of the broad line region. ApSS 2015, 356, 339–346, [1410.3146]. doi:\changeurlcolorblack10.1007/s10509-014-2136-z.
- Chieffi and Limongi (2013) Chieffi, A.; Limongi, M. Pre-supernova Evolution of Rotating Solar Metallicity Stars in the Mass Range 13-120 M ⊙ and their Explosive Yields. ApJ 2013, 764, 21. doi:\changeurlcolorblack10.1088/0004-637X/764/1/21.
- Śniegowska et al. (2021) Śniegowska, M.; Marziani, P.; Czerny, B.; Panda, S.; Martínez-Aldama, M.L.; del Olmo, A.; D’Onofrio, M. High Metal Content of Highly Accreting Quasars. ApJ 2021, 910, 115, [arXiv:astro-ph.HE/2009.14177]. doi:\changeurlcolorblack10.3847/1538-4357/abe1c8.
- Garnica et al. (2022) Garnica, K.; Negrete, C.A.; Marziani, P.; Dultzin, D.; Śniegowska, M.; Panda, S. High metal content of highly accreting quasars: Analysis of an extended sample. A&A 2022, 667, A105, [arXiv:astro-ph.GA/2208.02387]. doi:\changeurlcolorblack10.1051/0004-6361/202142837.
- Ferland et al. (2017) Ferland, G.J.; Chatzikos, M.; Guzmán, F.; Lykins, M.L.; van Hoof, P.A.M.; Williams, R.J.R.; Abel, N.P.; Badnell, N.R.; Keenan, F.P.; Porter, R.L.; Stancil, P.C. The 2017 Release Cloudy. RevMexA&Ap 2017, 53, 385–438, [arXiv:astro-ph.GA/1705.10877].
- Laor et al. (1997) Laor, A.; Fiore, F.; Elvis, M.; Wilkes, B.J.; McDowell, J.C. The Soft X-Ray Properties of a Complete Sample of Optically Selected Quasars. II. Final Results. ApJ 1997, 477, 93–+, [arXiv:astro-ph/9609164]. doi:\changeurlcolorblack10.1086/303696.
- Baldwin et al. (1995) Baldwin, J.; Ferland, G.; Korista, K.; Verner, D. Locally Optimally Emitting Clouds and the Origin of Quasar Emission Lines. ApJL 1995, 455, L119+, [arXiv:astro-ph/9510080]. doi:\changeurlcolorblack10.1086/309827.
- Korista et al. (1997) Korista, K.; Baldwin, J.; Ferland, G.; Verner, D. An Atlas of Computed Equivalent Widths of Quasar Broad Emission Lines. ApJS 1997, 108, 401–+, [arXiv:astro-ph/9611220]. doi:\changeurlcolorblack10.1086/312966.
- Guo et al. (2020) Guo, H.; Shen, Y.; He, Z.; Wang, T.; Liu, X.; Wang, S.; Sun, M.; Yang, Q.; Kong, M.; Sheng, Z. Understanding Broad Mg II Variability in Quasars with Photoionization: Implications for Reverberation Mapping and Changing-look Quasars. ApJ 2020, 888, 58, [arXiv:astro-ph.GA/1907.06669]. doi:\changeurlcolorblack10.3847/1538-4357/ab5db0.
- Marziani and Sulentic (1993) Marziani, P.; Sulentic, J.W. Evidence for a very broad line region in PG 1138+222. ApJ 1993, 409, 612–616, [arXiv:astro-ph/9210005]. doi:\changeurlcolorblack10.1086/172692.
- Marziani et al. (2022) Marziani, P.; Olmo, A.d.; Negrete, C.A.; Dultzin, D.; Piconcelli, E.; Vietri, G.; Martínez-Aldama, M.L.; D’Onofrio, M.; Bon, E.; Bon, N.; Deconto Machado, A.; Stirpe, G.M.; Buendia Rios, T.M. The Intermediate-ionization Lines as Virial Broadening Estimators for Population A Quasars. ApJS 2022, 261, 30, [arXiv:astro-ph.GA/2205.07034]. doi:\changeurlcolorblack10.3847/1538-4365/ac6fd6.
- Sulentic et al. (2017) Sulentic, J.W.; del Olmo, A.; Marziani, P.; Martínez-Carballo, M.A.; D’Onofrio, M.; Dultzin, D.; Perea, J.; Martínez-Aldama, M.L.; Negrete, C.A.; Stirpe, G.M.; Zamfir, S. What does CIV1549 tell us about the physical driver of the Eigenvector quasar sequence? A&A 2017, 608, A122, [1708.03187]. doi:\changeurlcolorblack10.1051/0004-6361/201630309.
- Marziani et al. (2003) Marziani, P.; Zamanov, R.K.; Sulentic, J.W.; Calvani, M. Searching for the physical drivers of eigenvector 1: influence of black hole mass and Eddington ratio. MNRAS 2003, 345, 1133–1144, [arXiv:astro-ph/0307367]. doi:\changeurlcolorblack10.1046/j.1365-2966.2003.07033.x.
- Punsly (2010) Punsly, B. The Redshifted Excess in Quasar C IV Broad Emission Lines. ApJ 2010, 713, 232–238, [1002.4681]. doi:\changeurlcolorblack10.1088/0004-637X/713/1/232.
- Marziani et al. (2021) Marziani, P.; Berton, M.; Panda, S.; Bon, E. Optical Singly-Ionized Iron Emission in Radio-Quiet and Relativistically Jetted Active Galactic Nuclei. Universe 2021, 7, 484, [arXiv:astro-ph.GA/2112.02632]. doi:\changeurlcolorblack10.3390/universe7120484.
- Vanden Berk et al. (2004) Vanden Berk, D.E.; Wilhite, B.C.; Kron, R.G.; Anderson, S.F.; Brunner, R.J.; Hall, P.B.; Ivezić, Ž.; Richards, G.T.; Schneider, D.P.; York, D.G.; Brinkmann, J.V.; Lamb, D.Q.; Nichol, R.C.; Schlegel, D.J. The Ensemble Photometric Variability of ~25,000 Quasars in the Sloan Digital Sky Survey. ApJ 2004, 601, 692–714, [astro-ph/0310336]. doi:\changeurlcolorblack10.1086/380563.
- Marziani et al. (2013) Marziani, P.; Sulentic, J.W.; Plauchu-Frayn, I.; del Olmo, A. Is Mg II 2800 a Reliable Virial Broadening Estimator for Quasars? AAp 2013, 555, 89, 16pp, [arXiv:astro-ph.CO/1305.1096].
- Kellermann et al. (1989) Kellermann, K.I.; Sramek, R.; Schmidt, M.; Shaffer, D.B.; Green, R. VLA Observations of Objects in the Palomar Bright Quasar Survey. AJ 1989, 98, 1195. doi:\changeurlcolorblack10.1086/115207.
- Punsly et al. (2018) Punsly, B.; Marziani, P.; Bennert, V.N.; Nagai, H.; Gurwell, M.A. Revealing the Broad Line Region of NGC 1275: The Relationship to Jet Power. ApJ 2018, 869, 143, [1810.11716]. doi:\changeurlcolorblack10.3847/1538-4357/aaec75.
- Marziani et al. (2010) Marziani, P.; Sulentic, J.W.; Negrete, C.A.; Dultzin, D.; Zamfir, S.; Bachev, R. Broad-line region physical conditions along the quasar eigenvector 1 sequence. MNRAS 2010, 409, 1033–1048, [arXiv:astro-ph.CO/1007.3187]. doi:\changeurlcolorblack10.1111/j.1365-2966.2010.17357.x.
- D’Onofrio and Marziani (2018) D’Onofrio, M.; Marziani, P. A multimessenger view of galaxies and quasars from now to mid-century. Frontiers in Astronomy and Space Sciences 2018, 5, 31, [arXiv:astro-ph.GA/1807.07435]. doi:\changeurlcolorblack10.3389/fspas.2018.00031.
- Padovani and Matteucci (1993) Padovani, P.; Matteucci, F. Stellar Mass Loss in Elliptical Galaxies and the Fueling of Active Galactic Nuclei. ApJ 1993, 416, 26. doi:\changeurlcolorblack10.1086/173212.
- Fraix-Burnet et al. (2017) Fraix-Burnet, D.; Marziani, P.; D’Onofrio, M.; Dultzin, D. The Phylogeny of Quasars and the Ontogeny of Their Central Black Holes. Frontiers in Astronomy and Space Sciences 2017, 4, 1. doi:\changeurlcolorblack10.3389/fspas.2017.00001.
- Krause et al. (2019) Krause, M.G.H.; Shabala, S.S.; Hardcastle, M.J.; Bicknell, G.V.; Böhringer, H.; Chon, G.; Nawaz, M.A.; Sarzi, M.; Wagner, A.Y. How frequent are close supermassive binary black holes in powerful jet sources? MNRAS 2019, 482, 240–261, [arXiv:astro-ph.HE/1809.04050]. doi:\changeurlcolorblack10.1093/mnras/sty2558.
- Marziani et al. (2001) Marziani, P.; Sulentic, J.W.; Zwitter, T.; Dultzin-Hacyan, D.; Calvani, M. Searching for the Physical Drivers of the Eigenvector 1 Correlation Space. ApJ 2001, 558, 553–560, [arXiv:astro-ph/0105343]. doi:\changeurlcolorblack10.1086/322286.
- Padovani et al. (1993) Padovani, P.; Ghisellini, G.; Fabian, A.C.; Celotti, A. Radio-loud AGN and the extragalactic gamma-ray background. MNRAS 1993, 260, L21–L24. doi:\changeurlcolorblack10.1093/mnras/260.1.L21.
- La Franca et al. (1994) La Franca, F.; Gregorini, L.; Cristiani, S.; de Ruiter, H.; Owen, F. Deep VLA Observations of an Optically Selected Sample of Intermediate Redshift QSOs and the Optical Luminosity Function of the Radio Loud QSOs. AJ 1994, 108, 1548. doi:\changeurlcolorblack10.1086/117176.
- Deconto-Machado et al. (2022) Deconto-Machado, A.; del Olmo, A.; Marziani, P.; Perea, J.; Stirpe, G.M. High-redshift quasars along the Main Sequence. arXiv e-prints 2022, p. arXiv:2211.03853, [arXiv:astro-ph.GA/2211.03853].
- Cavaliere and Vittorini (2000) Cavaliere, A.; Vittorini, V. The Fall of the Quasar Population. ApJ 2000, 543, 599–610, [arXiv:astro-ph/0006194]. doi:\changeurlcolorblack10.1086/317155.
- Marconi et al. (2004) Marconi, A.; Risaliti, G.; Gilli, R.; Hunt, L.K.; Maiolino, R.; Salvati, M. Local supermassive black holes, relics of active galactic nuclei and the X-ray background. MNRAS 2004, 351, 169–185, [arXiv:astro-ph/astro-ph/0311619]. doi:\changeurlcolorblack10.1111/j.1365-2966.2004.07765.x.
- Hopkins et al. (2006) Hopkins, P.F.; Hernquist, L.; Cox, T.J.; Di Matteo, T.; Robertson, B.; Springel, V. A Unified, Merger-driven Model of the Origin of Starbursts, Quasars, the Cosmic X-Ray Background, Supermassive Black Holes, and Galaxy Spheroids. ApJS 2006, 163, 1–49, [astro-ph/0506398]. doi:\changeurlcolorblack10.1086/499298.
- Bañados et al. (2021) Bañados, E.; Mazzucchelli, C.; Momjian, E.; Eilers, A.C.; Wang, F.; Schindler, J.T.; Connor, T.; Andika, I.T.; Barth, A.J.; Carilli, C.; Davies, F.B.; Decarli, R.; Fan, X.; Farina, E.P.; Hennawi, J.F.; Pensabene, A.; Stern, D.; Venemans, B.P.; Wenzl, L.; Yang, J. The Discovery of a Highly Accreting, Radio-loud Quasar at z = 6.82. ApJ 2021, 909, 80, [arXiv:astro-ph.CO/2103.03295]. doi:\changeurlcolorblack10.3847/1538-4357/abe239.
- Ighina et al. (2023) Ighina, L.; Caccianiga, A.; Moretti, A.; Belladitta, S.; Broderick, J.W.; Drouart, G.; Leung, J.K.; Seymour, N. New radio-loud QSOs at the end of the Re-ionization epoch. MNRAS 2023, 519, 2060–2068, [arXiv:astro-ph.GA/2212.06168]. doi:\changeurlcolorblack10.1093/mnras/stac3668.
- Sulentic et al. (2014) Sulentic, J.W.; Marziani, P.; del Olmo, A.; Dultzin, D.; Perea, J.; Alenka Negrete, C. GTC spectra of z 2.3 quasars: comparison with local luminosity analogs. A&A 2014, 570, A96, [1406.5920]. doi:\changeurlcolorblack10.1051/0004-6361/201423975.