Calibrated Out-of-Distribution Detection with a Generic Representation
Abstract
Out-of-distribution detection is a common issue in deploying vision models in practice and solving it is an essential building block in safety critical applications. Most of the existing OOD detection solutions focus on improving the OOD robustness of a classification model trained exclusively on in-distribution (ID) data. In this work, we take a different approach and propose to leverage generic pre-trained representation. We propose a novel OOD method, called GROOD, that formulates the OOD detection as a Neyman-Pearson task with well calibrated scores and which achieves excellent performance, predicated by the use of a good generic representation. Only a trivial training process is required for adapting GROOD to a particular problem. The method is simple, general, efficient, calibrated and with only a few hyper-parameters. The method achieves state-of-the-art performance on a number of OOD benchmarks, reaching near perfect performance on several of them. The source code is available at https://github.com/vojirt/GROOD.
1 Introduction
The problem of detection of out-of-distribution data points, OOD in short, is important in many computer vision applications [1, 21, 5]. One can even argue that no model obtained by machine learning on a training set should be deployed without the OOD ability, since in practice it is almost never the case that all the models input data will be drawn from the same distribution that generated [52]. For undetected out-of-distribution data, the prediction will in general be arbitrary, with possibly grave real-world consequences, especially in safety-critical applications. The importance and ubiquity of OOD is evidenced by the fact that virtually the same problem has emerged in different contexts under different names - open set recognition, anomaly or outlier detection, and one-class classification.
The reasons for test data not being from the training set distribution are diverse; they often influence the terminology used. In open set recognition (OSR) [26, 49], the semantic shift is considered, i.e. the introduction of new classes at test time. Failures of the measurements system generate outlier data. In anomaly detection, the presence of out-of-distribution data is assumed rare. A domain shift, e.g. when a classifier trained on real-world images is applied to clip art, leads to a severe data distribution change.
So far, prior art has mainly developed OOD detection models by supervised training on in-distribution (ID) data [49, 4, 2]. We follow the recent success of self-supervised representation model training [33, 34], we apply it to out-of-distribution detection, our approach produces a calibrated decision strategy and we analyze its performance in various scenarios.
The performance of the proposed method is predicated by the use of a good generic representation. Any good representation should enable solving a given, a priori unknown, downstream task. A good generic representation should enable solving multiple tasks without the need of fine-tuning on the task data. To verify the goodness and generality of tested representations, we first exploit two commonly used simple classifiers: (i) linear probe (LP), and (ii) the nearest mean (NM) classifier. These simple classifiers already outperform the state-of-the-art on a broad range of OOD detection problems, often by a large margin, however, without apriori knowledge about the specificity of the OOD data its unclear which of these simple methods (or any other score based methods build on top of generic representation) should be preferred.
Since the LP and NM methods perform each well on different classes of the OOD problems, we formulate a Neyman-Pearson task [35, 30, 31] on their combination. We call this approach GROOD (for Generic Representation based OOD detection). It models the in-distribution (ID) as a 2D Gaussian in the space of LP and NM responses and provides a robust solution to the OOD problem. It also naturally results in well calibrated rejection scores, which allow us to define a global threshold for data rejection, i.e. OOD identification. The global threshold can be set to incur user-specified pre-defined error on ID data and is calibrated for all classes, meaning, the pre-defined error is the same for all classes. In contrast, most current state-of-the-art methods work on basis of similarity scores with no simple mechanism for selecting a single threshold for OOD rejection. This novel approach significantly improves OOD performance and the experiments also confirm the superiority of using the generic representation over problem-specific approaches that train or fine-tune the feature extractor on a particular ID training set.
The GROOD does not require any information about the out-of-distribution data, e.g. in the form of a few examples of the anomalies, and is thus applicable to all the standard setting of the OOD and OSR problems [49]. To summarize, the contributions of the paper are:
-
•
We show that using a generic pre-trained representation together with a simple classifier achieves state-of-the-art performance on a number of OOD benchmarks.
-
•
We formulate the OOD detection as a Neyman-Pearson task in the space of LP and NM scores. The operating point is selected by the allowed false negative rate for all ID classes. This results in a well calibrated classification score on the ID task.
-
•
We evaluate the method on a wide range of OOD problems. The proposed method outperforms the state-of-the-art by a large margin on most of the problems and even saturates several commonly used benchmarks.
2 Related Work
Out-of-distribution (OOD) detection refers to the identification of test samples that are drawn from a different distribution than the underlying training distribution of a given classification model. Hendrycks et al. [14] was one of the first to explore this problem with modern neural networks using maximum softmax probability (MSP) obtained from a classification model as a detection score. While being an classical baseline in OOD detection, MSP can output high ID probabilities for unknown OOD samples [37]. Subsequent work has attempted to provide more robust OOD detection by either operating on a fixed model, or performing additional ID training or even leveraging auxiliary OOD data. We refer an interested reader to [49] for a complete survey on the different lines of OOD detection research and cover only the main directions in this section.
Post-hoc methods consider a pre-trained ID classifier and define different OOD detection scores or perform manipulation of the input samples to increase the separability between the distributions of ID and OOD scores [24, 18]. As a more robust alternative to the MSP score, [25] proposed to use the energy of the output logits as a scoring function showing strong improvements over MSP and more separable scores. Later, [12] showed that using maximum logit as an OOD detection score is significantly more robust than MSP, suggesting that the normalization of the probability of the closed set classes is the source for the overconfident predictions.
Of the distance based detection scores, we mention [23] which estimates the Mahalanobis distance to the closest class. Based on the estimated distances in the learned embedding space, [38] propose instead to use the K-nearest neighbour (KNN) distance as a detection score. This improves significantly over the Mahalanobis distance. Manipulating the logits of a pre-trained ID classifier has its limits though, which led to the second group of approaches.
Training based methods target a stronger OOD detection performance through regularizing the training such that the resulting classifier or representation behave differently for ID compared to OOD inputs. Tackling the same overconfident issue as in post-hoc methods, [45] proposed to train the ID classification model while enforcing a constant logit norm. Deep ensemble [22] combines adversarial training with neural networks ensemble in addition to using the loss function as a scoring rule. The computational cost of such approach might be prohibitive for big networks.
Other work aims at regularizing the training with virtual representatives of OOD input. CSI [39] utilizes contrastive training and apply strong augmentations to the input images as an alternative to OOD data. Adversarial Reciprocal Points Learning (ARPL) [6] proposes the concept of ”reciprocal” points as a proxy for OOD samples which are obtained by combined discriminative and metric learning. This method showed state-of-the-art OOD detection performance, however, it requires complex training scheme and large hyper-parameter tuning. The proposed method is significantly more efficient and improve over ARPL with a large margin in multiple benchmarks.
“A closed set classifier is all you need” [43] suggests that an improved training scheme that leads to better performance on ID data discrimination offers competitive OOD detection quality that rivals that of OOD regularized training such as ARPL [6]. Further, [48] has evaluated a wide range of OOD detection methods and their empirical results suggest that strong input augmentation techniques, e.g. MixUp [40], CutMix [50] and PixMix [17] are the most effective type of training methods for OOD detection.
Recently, the focus has shifted to OOD detection based on self-supervised pre-trained representations. A rotation prediction head was used in [16], while [15] employs adversarial pre-training and label corruption, but still needs full network fine-tuning on the specific ID task. SSD [36] first trains a feature extractor using contrastive self-supervised learning and then uses Mahalanobis distance to the class representants found by k-means. MCM [28] builds on CLIP [34] by measuring a distance to ”this is a photo of a …” text encoder class prototype. However, they evaluate only on ImageNet-1k as ID, which was shown to be problematic [3]. Moreover, the text prompt prototypes in this form are limited to tasks with clearly defined objects. ZOC [11] goes further in using the CLIP text encoder by dynamically generating semantically meaningful textual labels for each image and forming the ID score as a probability of classifying it into the seen classes instead of the generated ones.
We follow the last group of methods by using a rich representation trained in self-supervised manner. However, we avoid using the text encoder, build the OOD detector in formally well defined way and evaluate on a wide and diverse range of OOD problems common in literature.
3 The GROOD Method
 |
 |
 |
| (a) | (b) | (c) |
In this section we describe the proposed Generic Representation based OOD detection approach, GROOD in short, which exploits a representation pre-trained on auxiliary large-scale non-OOD-related data. The intuition behind the method is that a generic representation is a good starting point for the OOD detection. The proposed method also produces well-calibrated classification scores for a given ID task corresponding directly to the same false negative rate for every ID class.
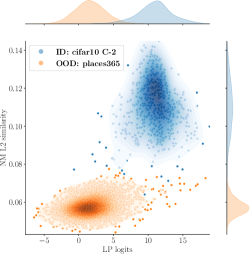
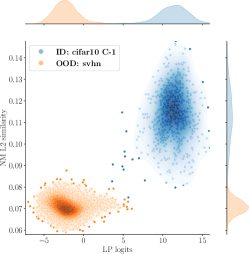
We expect the representation to be strong, allowing in- and out-of-distribution data separation by a low-complexity classifier. In particular, we investigate two such classifiers, Linear Probe (LP) and Nearest Mean (NM), trained on ID data only. The LP classifier consists of a single linear projection layer followed by a softmax normalization (i.e. multi-class logistic regression model). This type of classifier has been used in representation learning to test the expressiveness of a representation [7]. The NM classifier assigns data to the class with the nearest class mean as measured by the distance; learning this classifier consists of computation of a mean vector representation for each class. We chose the LP and NM classifiers because of (i) their simplicity – simple classifiers generalize well, do not overfit to ID problem – and (ii) complementarity - one is based on a discriminative score and the other on a distance metric - as illustrated in Fig 1 and Fig 4. At the test time, when OOD data points are detected, the LP and NM classifier responses are simply thresholded (like in [43]) and this threshold is varied to compute the ROC curves in the experiments.
Although each of these classifiers performs already better then state-of-the-art methods on several benchmarks, we show in Sec 4.5 that they are in fact complementary, each working better on different type of problems. Further, as shown in Sec 2, their logit/distance scores are not well calibrated, i.e. when setting an in-out decision threshold, the ID classes are rejected unevenly, some producing higher false negative rates then the others.
To solve these issues, we propose a new method, called GROOD, which combines the outputs of the two classifiers. The distribution of the outputs is modelled as a bi-variate Guassian which permits addressing OOD as a formally defined two-class Neyman-Pearson task [35, 30, 31] through which calibration of the OOD detector is achieved.111We experiment with 2D space of scores only, as the amount of data for model estimation is limited (100 or less examples in some cases).
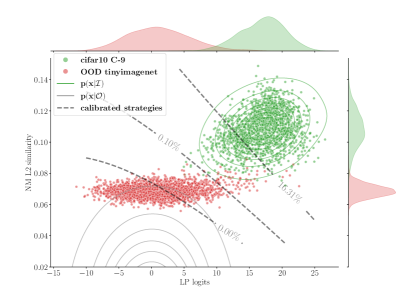
We illustrate the approach on an example OOD problem shown in Fig 3. CIFAR10 is considered ID (class 9 shown here) and the TinyImageNet represents an OOD dataset (see Sec 4 for details on datasets). The figure shows in green the ID and in red the OOD distribution of LP scores (top) and NM similarity (right), see Sec 4.3 for the definitions. The data are plotted as green (ID) and red (OOD) dots. The ID distribution is specified by the desired ID classification problem, the OOD distribution may vary depending on particular ID/OOD benchmark. Notice, that shifting the problem from a one-dimensional score (either LP or NM) to a two-dimensional space allows us to leverage the best of LP and NM (cf Fig 1 & 4) and leads to a better ID/OOD separation when considering jointly all tested OOD problems.
In the proposed GROOD method we model the ID distribution as a Normal distribution. Although an approximation, we observed empirically that it holds reasonably well over a wide range of tasks222A breaking point would be the case of ID data where one class consists of multiple clusters. In this case, the NM classifier would need to be modified to consider several ”means”.. Of course, nothing prevents us from using a more complex model of the distribution, e.g. the non-parametric Parzen estimate, if needed, but the Normal distribution assumption makes the next step in designing GROOD significantly easier.
Next we formulate the ID/OOD classification problem as a multi-class Neyman-Pearson task [35, 30, 31]. We start by considering a single ID class. Let be a class representing the ID samples and the class for OOD data. Assume the data are sampled from a two-dimension domain , where is the domain of LP logit scores and the domain of NM distances. The task is then to find a strategy such that
| (1) | ||||
| s.t. |
This optimization problem minimises the false ID acceptance rate for a particular ID class and bounds the maximal ID rejection rate by . For classes we specify such problems and use the same constant for all of them, so that the same fixed rejection rate is required for all classes.
It is known [35] that the optimal strategy for a given is constructed using a the likelihood ratio so that if and if . The optimal strategy is obtained by selecting the minimal threshold such that . The problem is solved either analytically for some simple distributions (such as Gaussian) or numerically otherwise.
To solve this problem we still have to specify the distribution. If we assume this distribution to be uniform in , we would decide based on the quantiles of the Normal distribution . However, we constructed not from general 1D random variables, but from the classification scores of LP and NM. It is thus reasonable to assume that the OOD data will lie in the region where the LP score and NM similarity are low.
To implement this assumption, we construct as another Normal distribution with a zero mean and a diagonal covariance matrix with large variances. For the LP, the zero mean assumption is motivated by the fact that in high dimensional spaces, a random vector is likely to be close to orthogonal to the id-class directional vectors (the weights of the linear layer before the softmax). For the NM similarity, the choice was made empirically as a limit case for very large distance from a class mean center. The variance, in both directions, is set so that the range of the data is a multiple of the in-distribution range, i.e. it is very broad. The in-distribution range was robustly estimated as a quantile of all in-distribution data scores and the multiplicative factor was set empirically. Both Normal distributions for ID and OOD are plotted in Fig 3 in green and gray solid line contours respectively. Fig 3 shows also three optimal strategies (if the assumptions about normality were true) as gray dashed decision boundaries and their corresponding ID rejection rates. Clearly, the strategy rejects the least confident ID samples first.
Solving this Neyman-Pearson problem for each ID class gives strategies , each calibrated for the same rejection rate. In practice, we would specify acceptable rejection rate and obtain the optimal strategies for normally distributed data. For the evaluation where we need to sweep over the values of , we sample a limited set of values, find their likelihood ratio and interpolate in-between.
Finally, for the ID classification we use the of the probabilities obtained as bi-variate Normal distributions for each class .
4 Experiments
In this section we evaluate the proposed GROOD method and other state-of-the-art methods on a wide and diverse set of benchmark problems described in the OOD literature. We select the benchmarks to cover various scenarios and to demonstrate the generality of the proposed approach.
4.1 Benchmarks
There are several commonly used benchmarks to evaluate OOD and OSR methods and most papers typically evaluate on their subset. In our evaluation we attempt to cover most of the commonly used variations. We categorize the experiments based on the presence/absence of the domain shift (DS) and the semantic shift (SS).
No DS, only SS. For MNIST [9], SVHN [29] and CIFAR10 [20] datasets we perform the 6-vs-4 split [6, 48, 43]. Here six classes are selected as ID at random and the remaining four as OOD. The experiment is repeated five times with different splits and the average metrics are reported together with their standard deviations.
For a bit larger CIFAR+10 and CIFAR+50 experiments, four classes are sampled from CIFAR10 and are considered ID and another 10 (or 50) non-overlapping classes are randomly selected from CIFAR100 [20] and used as OOD [6, 48, 43]. Again, five trials are averaged. For the biggest TIN-20 experiment, twenty classes are selected randomly as ID and 180 as OOD from the TinyImageNet dataset [41]. For the above experiments we use the same splits as in [6] for compatibility with previous results.
Finally, to test this type of settings to its limits, we evaluate on the fine-grained class splits from the Semantic Shift Benchmark [43]. Here three splits are given: easy, medium and hard, with increasing semantic shift overlap with ID classes. This overlap is determined from a set of detailed class attributes. We use the splits for the CUB [44] (birds), StanfordCars [19], and FGVC-Aircraft datasets [27].
DS and SS mixed. Another common experimental setting is to consider CIFAR10 as ID and use other datasets as OOD [25, 6, 38, 43]. In this case there is an explicit SS and an implicit DS. We evaluate against MNIST [9], SVHN [29], Textures [8], Places365 [53], CIFAR100 [20], iNaturalist [42], TinyImageNet [41] and LSUN datasets [46].
DS only. A special kind of shift is when the classes stay the same, but the image domain changes. For this experiment we adopt the benchmark from [6] based on DomainNet dataset [32]. The challenge is to distinguish between photos of objects from 173 classes (ID) and clipart/quickdraw images from the same classes (OOD). The benchmark also contains an OOD part with real images from different 173 classes (SS task).
| arch | pre-trained | classif | SS only | SS + DS | ||
|---|---|---|---|---|---|---|
| AUROC | OSCR | AUROC | FPR95 | |||
| ViT-L/16 | ImageNet | LP | ||||
| ImageNet | NM | |||||
| ViT-L/14 | DIHT | LP | 99.27 | 2.68 | ||
| DIHT | NM | |||||
| ViT-L/14 | CLIP | LP | 94.35 | 91.10 | ||
| CLIP | NM | |||||
 |
 |
| (a) | (b) |
| AUROC | |||||||
| from | MNIST | SVHN | CIFAR10 | CIFAR+10 | CIFAR+50 | TIN | |
| Deep KNN [38] | [48] | 97.50 | — | 86.90 | — | — | 74.10 |
| DeepEnsemble [22] | [48] | 97.20 | — | 87.80 | — | — | 76.00 |
| Pixmix [17] | [48] | 93.90 | — | 90.90 | — | — | 73.50 |
| OpenHybrid [51] | [43] | 99.50 | 94.70 | 95.00 | 96.20 | 95.50 | 79.30 |
| MLS [43] | [43] | 99.30 | 97.10 | 93.60 | 97.90 | 96.50 | 83.00 |
| ARPL+CS [6] | [6] | 99.700.10 | 96.700.20 | 91.000.70 | 97.100.30 | 95.100.20 | 78.201.30 |
| GROOD | ours | 96.880.47 | 76.141.14 | 97.760.43 | 98.880.38 | 98.310.25 | 94.180.94 |
4.2 Evaluation Metrics
There seems to be no consensus, which metrics to report for OOD detection. The most commonly used is the AUROC metric, which measures the ability to distinguish OOD data from ID data. Often this is the only metric reported even though it does not show, how well the method performs on the ID classification task. For ID classification people report either the ID accuracy, FPR95 or OSCR score. In the tables in Sec 4 we report the most commonly used metric for particular OOD problem.
Assuming a binary ID vs OOD classification problem, the AUROC measures the area under the true positive (TP) – false positive (FP) rates curve, where the ID data is considered be the positive class. We adopt the evaluation code from [43, 6].
The FPR at TPR (FPR95) metric measures the false positive rate at true positive rate on the same binary problem as the AUROC measure.
The Open-Set Classification Rate (OSCR) [10, 6] measures the trade-off between the ID classification accuracy and OOD detection accuracy. It is computed as area under - curve where is the correct classification rate defined as
| (2) |
where is the sub-set of the ID training data belonging to the class , and is the false positive rate defined as
| (3) |
where is the set of OOD data available at the test time.
Finally, the ACC measures the accuracy on the ID classification problem.
| FPR at TPR AUROC | |||||||||
|---|---|---|---|---|---|---|---|---|---|
| from | SVHN | MNIST | Textures | Places365 | CIFAR-100 | iNaturalist | TIN | LSUN | |
| Deep KNN [38] | [48] | 33.32 / 95.13 | 50.08 / 91.63 | 46.01 / 92.77 | 43.78 / 91.82 | 52.49 / 89.55 | — | 46.66 / 91.41 | — |
| [38] | 2.40 / 99.52 | — | 8.09 / 98.56 | 23.02 / 95.36 | — | — | — | 1.78 / 99.48 | |
| LogitNorm [45] | [48] | 5.30 / 98.86 | 4.75 / 98.82 | 30.94 / 94.30 | 31.17 / 94.76 | 46.99 / 91.13 | — | 36.34 / 93.90 | — |
| UDG [47] | [48] | 61.91 / 92.50 | 39.32 / 93.81 | 43.97 / 93.56 | 42.44 / 93.58 | 55.33 / 90.38 | — | 42.48 / 93.33 | — |
| DeepEnsemble [22] | [48] | 37.03 / 94.95 | 41.65 / 94.34 | 48.39 / 92.59 | 50.20 / 91.06 | 54.31 / 89.76 | — | 48.93 / 91.35 | — |
| Pixmix [17] | [48] | 13.70 / 98.01 | 49.72 / 91.78 | 8.07 / 98.83 | 38.51 / 94.03 | 47.12 / 91.81 | — | 36.47 / 94.31 | — |
| ARPL+CS [6] | 53.20 / 90.64 | 42.44 / 94.13 | 51.84 / 90.68 | 47.42 / 90.72 | 57.11 / 88.52 | 56.02 / 89.73 | 53.40 / 88.61 | 46.32 / 91.85 | |
| SSD [36] | [36] | — / 99.6 | — | — / 97.6 | — / 95.2 | — / 90.6 | — | — | — / 96.5 |
| GROOD | ours | 0.00 / 99.97 | 0.20 / 99.74 | 0.09 / 99.96 | 1.05 / 99.78 | 13.41 / 97.32 | 0.00 / 100.00 | 11.11 / 95.97 | 0.00 / 100.00 |
| ID: Real-A AUROC / OSCR | ||||||
|---|---|---|---|---|---|---|
| from | Real-B | Clipart-A | Clipart-B | Quickdraw-A | Quickdraw-B | |
| ARPL+CS | [6] | 75.20 / 61.90 | 72.70 / 59.40 | 82.90 / 66.60 | 86.70 / 69.00 | 87.50 / 69.50 |
| GROOD | ours | 91.50 / 83.54 | 71.84 / 65.20 | 93.31 / 85.19 | 89.91 / 81.98 | 91.11 / 82.83 |
4.3 Low-Complexity Classifiers
As we argue for a good and general enough representation as the basis for the OOD detection, we use only simple low-complexity classifiers (i.e. letting the representation play the essential part in the decision). In particular, we use the Linear Probe (LP) and the Nearest Mean (NM) classifiers. The LP classifier is trained on the ID data only. We use the training code from [34]. As an OOD detection score we use the Maximum logit [43]. The NM classifier’s means are also estimated on the ID data only. The NM similarity is computed from the NM distance as .
4.4 Power of a Good Representation
We start by investigating the effect of different pre-trained representations on various OOD problems. We consider three rich representations: one trained with full supervision on the ImageNet1k classification task, and two self-supervised representations, CLIP [34] and DIHT [33].
The ImageNet pre-trained representation proved to be a strong baseline for many problems in computer vision. We use the ViT-L/16 model pre-trained on ImageNet1k available in the PyTorch Torchvision library and use its penultimate layer as a feature extractor. It produces 1048-dimensional feature vectors.
The CLIP/DIHT representations have shown outstanding performance on various zero-shot classification problems [34, 33] demonstrating their versatility. From the point of view of OOD detection, what makes the representation appealing is that it was trained on image-text pairs instead of a fixed set of classes. This, together with the self-supervised training possibly allows the model to extract very rich representation of the visual world. This makes it a good candidate for separating ID classes from OOD data irrespective of the type of semantic and distribution shift if these shifts are covered by natural language and represented sufficiently by the training data. The CLIP and DIHT models (we are using only the image encoder) produce 768-dimensional feature vectors.
We have also considered smaller ImageNet and CLIP models, but they perform consistently worse, please refer to supplementary materials for smaller models results.
For all representations, we train the LP and NM classifiers and test over a range of tasks. We obtain consistent relative performance over different OOD tasks hence we report only the average metrics. We refer to supplementary materials for full results. Tab 1 reports the average performance on the studied benchmarks. Our results show that self-supervised representation works better irrespective of the classifier and the type of OOD shift. We chose the CLIP representation in the following experiments.
4.5 Complementarity of LP and NM
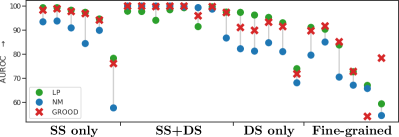
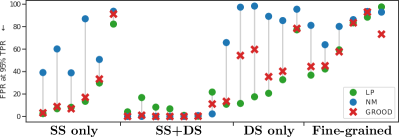
Fig 4 shows that the LP and NM classifiers are complementary, each performing well on different types of OOD data. This observation motivated the proposed method. Without a priori information, GROOD is able to use efficiently the information provided by both LP and NM and in most cases achieve performance of the better one.
Fig 1 further illustrates LP and NM scores distributions for different ID and OOD datasets. We observed that for OOD tasks where ID and OOD classes are from the same domain (e.g. 6-vs-4 experiment on MNIST) and are thus close to each other in the considered representation, LP tends to work better by finding a suitable linear projection where the ID classes can be well separated whereas the NM classifier struggles distinguishing small distances in the high-dimensional representation (Fig 1a). When the ID and OOD classes are from rather distant domains (e.g. CIFAR10 and Places365), the NM method works better as the distance starts to be discriminative enough (Fig 1b). And there are some problems (e.g. CIFAR10 vs SVHN) where both classifiers produce similarly good separation between ID and OOD classes (Fig 1c).
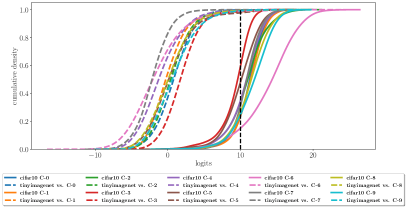
4.6 Mis-calibration of the Logit Scores
Another issue revealed in our experiments is mis-calibration of the maximum logit (or probability) approaches [43, 14, 24, 13]. We demonstrate this in Fig 2. When a logit score threshold is selected (10 in the figure), it produces different false negative (FN) rates for each class. This is in contrast with GROOD method, where the threshold is imposed directly on the class FN rate. This allows to specify an allowed FN rate while minimizing the FP rate (i.e. the number of OOD data classified as ID). This quality is important in safe-critical applications where certain classes are reported as OOD more often or in social-related applications where having uneven FN rates on ID classes may lead to unwanted biases.
4.7 GROOD vs State-of-the-Art
| CUB [Easy / Hard] | SCars [Easy / Hard] | FGVC-Aircraft [Easy / Hard] | ||||||||
|---|---|---|---|---|---|---|---|---|---|---|
| from | ACC | AUROC | OSCR | ACC | AUROC | OSCR | ACC | AUROC | OSCR | |
| ARPL+ | [43] | 85.90 | 83.50 / 75.50 | 76.00 / 69.60 | 96.90 | 94.80 / 83.60 | 92.80 / 82.30 | 91.50 | 87.00 / 77.70 | 83.30 / 74.90 |
| MLS | [43] | 86.20 | 88.30 / 79.30 | 79.80 / 73.10 | 97.10 | 94.00 / 82.20 | 92.20 / 81.10 | 91.70 | 90.70 / 82.30 | 86.80 / 79.80 |
| GROOD | ours | 90.12 | 91.69 / 72.83 | 82.49 / 65.38 | 96.82 | 89.74 / 85.16 | 86.79 / 82.31 | 70.8 | 78.42 / 54.18 | 58.40 / 42.62 |
Finally, we compare GROOD with state-of-the-art methods on an extensive range of benchmarks. See the results in Tab 2-5. In all the tables we compare against a selection of best performing methods collected from literature and indicate the respective source publication. For comparison with many other methods reported earlier and with worse results see the benchmark papers [48, 49, 43].
Tab 2 and Tab 3 summarize the most common benchmarks used in literature, the first one with the semantic shift only and the other with mixed semantic and domain shifts. Compared to state-of-the-art methods, GROOD outperforms all of them by a large margin on most of the OOD problems. Especially on the mixed semantic and domain shift problems in Tab 3, our approach basically solves all the benchmarks.
The proposed method is the most effective on more complex problems like CIFAR variants and TIN and struggles a bit on the 6-vs-4 SVHN problem in Tab 2. We attribute this mainly to the dataset ground truth construction. The images do not contain the single digit stated in the GT label but also “some distracting digits to the sides of the digit of interest”333http://ufldl.stanford.edu/housenumbers). For CLIP which was trained on many images containing text (with full text label) all digits in the image influence the representation. The performance drop does not happen for MNIST dataset with a single digit per-image, which supports our analysis. Since methods that train the representation on ID data do not suffer from this phenomena, these issues can be potentially alleviated by fine-tuning the representation or using more complex classifiers.
GROOD is also very efficient on the problems with domain shift only as shown in Tab 4. Here our method again outperforms the current state-of-the-art significantly, showing the ability to distinguish data even along such distribution shifts like real-image vs clipart vs quick draw. There is still a space for improvement on the Clipart-A split which is very similar to the ID Real-A dataset (same classes, photos vs complex clipart). This is though difficult even for ARPL+CS which is trained on the ID data.
Finally, to test the limits of the proposed method we evaluated GROOD on the Semantic Shift Benchmark problems with very fine-grained semantic shift in Tab 5. Although the class separation is often very subtle, our method performs comparably to state-of-the-art. The Easy/Hard splits in SCars and FGVC-Aircrafts datasets (in contrast to CUB) are not based on strictly visual attributes, but on attributes like the year of production or an aircraft variant. They do not seem to correspond to differences captured by the CLIP representation. This is more pronounced in case of the airplanes where for instance the overall shape do not change between production years (as oppose to cars). We see this as a border case and a weakness of the benchmark444“…open-set bins of different difficulties in Stanford Cars are the most troublesome to define. This is because the rough hierarchy in the class names may not always correspond to the degree of visual similarity between the classes”[43]. and a possible future direction of research.
Overall, the experiments demonstrate how using a powerful representation leads not only to a state-of-the-art ID classification as demonstrated earlier [34], but provides a classifier with very strong cues for OOD detection as well.
5 Conclusions
In this paper we propose a novel approach to OOD detection which uses a generic pre-trained representation instead of training a discriminative classifier on the ID classes.
We model the classification scores of the LP and NM classifiers for the ID classes as a multivariate Guassian and show that this permits addressing OOD detection as a formally defined two-class Neyman-Pearson task. Compared to traditional logit (or distance) thresholding, the solution to this task leads to naturally calibrated OOD detection score connected directly to the same false negative rate on all ID classes. Moreover, the resulting GROOD method leverages the strengths of both used classifiers leading to consistent performance over all considered benchmarks.
The proposed GROOD method was compared to the state-of-the-art methods on a wide and diverse range of OOD problems with various types and strengths of semantic and domain shifts. It effectively solves the mixed semantic and distribution shift benchmarks and achieves the best performance on most of the other considered problems.
The only observed limitations are related to the interaction of the annotation in SVHN dataset with the CLIP representation, and very fine-grained classification of airplanes which goes beyond visual attributes.
The simplicity of the adaptation of the GROOD method to a novel problem – only a multi-class logistic regression and finding the mean of each class is needed for training – makes the process fast.
We suggest that the proposed method combined with a generic representation is suitable for most OOD tasks based on natural images; with GROOD many of the standard benchmarks are saturated and no longer stimulate further progress. A recently introduced NINCO dataset [3] may be a possible direction, but is left as a future work.
Acknowledgement This work was supported by Toyota Motor Europe. We would also like to thank Jonáš Šerých for many valuable discussions related to this paper.
References
- [1] Paul Bergmann, Kilian Batzner, Michael Fauser, David Sattlegger, and Carsten Steger. The MVTec Anomaly Detection Dataset: A Comprehensive Real-World Dataset for Unsupervised Anomaly Detection. Int. J. Comput. Vis., 129(4):1038–1059, 2021.
- [2] Julian Bitterwolf, Alexander Meinke, Maximilian Augustin, and Matthias Hein. Breaking down out-of-distribution detection: Many methods based on ood training data estimate a combination of the same core quantities, 2022.
- [3] Julian Bitterwolf, Maximilian Mueller, and Matthias Hein. In or out? fixing imagenet out-of-distribution detection evaluation. In ICLR 2023 Workshop on Pitfalls of limited data and computation for Trustworthy ML, 2023.
- [4] Daniel Bogdoll, Maximilian Nitsche, and J. Marius Zollner. Anomaly detection in autonomous driving: A survey. In IEEE Conf. Comput. Vis. Pattern Recog. Worksh. IEEE, jun 2022.
- [5] Robin Chan, Krzysztof Lis, Svenja Uhlemeyer, Hermann Blum, Sina Honari, Roland Siegwart, Pascal Fua, Mathieu Salzmann, and Matthias Rottmann. SegmentMeIfYouCan: A Benchmark for Anomaly Segmentation, 2021.
- [6] Guangyao Chen, Peixi Peng, Xiangqian Wang, and Yonghong Tian. Adversarial reciprocal points learning for open set recognition. IEEE Trans. Pattern Anal. Mach. Intell., 2021.
- [7] Ting Chen, Simon Kornblith, Mohammad Norouzi, and Geoffrey Hinton. A simple framework for contrastive learning of visual representations. In Int. Conf. Mach. Learn., pages 1597–1607. PMLR, 2020.
- [8] Mircea Cimpoi, Subhransu Maji, Iasonas Kokkinos, Sammy Mohamed, and Andrea Vedaldi. Describing textures in the wild. In IEEE Conf. Comput. Vis. Pattern Recog., pages 3606–3613, 2014.
- [9] Li Deng. The mnist database of handwritten digit images for machine learning research. IEEE Signal Processing Magazine, 29(6):141–142, 2012.
- [10] Akshay Raj Dhamija, Manuel Günther, and Terrance E. Boult. Reducing network agnostophobia. In Adv. Neural Inform. Process. Syst., 2018.
- [11] Sepideh Esmaeilpour, Bing Liu, Eric Robertson, and Lei Shu. Zero-shot out-of-distribution detection based on the pre-trained model clip. In Proceedings of the AAAI conference on artificial intelligence, volume 36, pages 6568–6576, 2022.
- [12] Dan Hendrycks, Steven Basart, Mantas Mazeika, Mohammadreza Mostajabi, Jacob Steinhardt, and Dawn Song. Scaling out-of-distribution detection for real-world settings. Int. Conf. Mach. Learn., 2022.
- [13] Dan Hendrycks, Steven Basart, Mantas Mazeika, Andy Zou, Joe Kwon, Mohammadreza Mostajabi, Jacob Steinhardt, and Dawn Song. Scaling out-of-distribution detection for real-world settings. Int. Conf. Mach. Learn., 2022.
- [14] Dan Hendrycks and Kevin Gimpel. A baseline for detecting misclassified and out-of-distribution examples in neural networks. arXiv preprint arXiv:1610.02136, 2016.
- [15] Dan Hendrycks, Kimin Lee, and Mantas Mazeika. Using pre-training can improve model robustness and uncertainty. In Int. Conf. Mach. Learn., pages 2712–2721. PMLR, 2019.
- [16] Dan Hendrycks, Mantas Mazeika, Saurav Kadavath, and Dawn Song. Using self-supervised learning can improve model robustness and uncertainty. Adv. Neural Inform. Process. Syst., 32, 2019.
- [17] Dan Hendrycks, Andy Zou, Mantas Mazeika, Leonard Tang, Bo Li, Dawn Song, and Jacob Steinhardt. Pixmix: Dreamlike pictures comprehensively improve safety measures. In IEEE Conf. Comput. Vis. Pattern Recog., pages 16783–16792, 2022.
- [18] Yen-Chang Hsu, Yilin Shen, Hongxia Jin, and Zsolt Kira. Generalized odin: Detecting out-of-distribution image without learning from out-of-distribution data. In IEEE Conf. Comput. Vis. Pattern Recog., pages 10951–10960, 2020.
- [19] Jonathan Krause, Michael Stark, Jia Deng, and Li Fei-Fei. 3d object representations for fine-grained categorization. In Int. Conf. Comput. Vis. Workshops, pages 554–561, 2013.
- [20] Alex Krizhevsky. Learning multiple layers of features from tiny images. Technical report, University of Toronto, 2009.
- [21] Weicheng Kuo, Christian Häne, Pratik Mukherjee, Jitendra Malik, and Esther Yuh. Expert-level detection of acute intracranial hemorrhage on head computed tomography using deep learning. Proceedings of the National Academy of Sciences, 116:201908021, 10 2019.
- [22] Balaji Lakshminarayanan, Alexander Pritzel, and Charles Blundell. Simple and scalable predictive uncertainty estimation using deep ensembles. Adv. Neural Inform. Process. Syst., 30, 2017.
- [23] Kimin Lee, Kibok Lee, Honglak Lee, and Jinwoo Shin. A simple unified framework for detecting out-of-distribution samples and adversarial attacks. In Adv. Neural Inform. Process. Syst., pages 7167–7177, 2018.
- [24] Shiyu Liang, Yixuan Li, and Rayadurgam Srikant. Enhancing the reliability of out-of-distribution image detection in neural networks. arXiv preprint arXiv:1706.02690, 2017.
- [25] Weitang Liu, Xiaoyun Wang, John Owens, and Yixuan Li. Energy-based out-of-distribution detection. Adv. Neural Inform. Process. Syst., 33:21464–21475, 2020.
- [26] Atefeh Mahdavi and Marco Carvalho. A survey on open set recognition. In 2021 IEEE Fourth International Conference on Artificial Intelligence and Knowledge Engineering (AIKE). IEEE, dec 2021.
- [27] Subhransu Maji, Esa Rahtu, Juho Kannala, Matthew Blaschko, and Andrea Vedaldi. Fine-grained visual classification of aircraft. arXiv preprint arXiv:1306.5151, 2013.
- [28] Yifei Ming, Ziyang Cai, Jiuxiang Gu, Yiyou Sun, Wei Li, and Yixuan Li. Delving into out-of-distribution detection with vision-language representations. Advances in Neural Information Processing Systems, 35:35087–35102, 2022.
- [29] Yuval Netzer, Tao Wang, Adam Coates, A. Bissacco, Bo Wu, and A. Ng. Reading digits in natural images with unsupervised feature learning. In NIPS Workshop on Deep Learning and Unsupervised Feature Learning, 2011.
- [30] Jerzy Neyman and Egon S Pearson. On the use and interpretation of certain test criteria for purposes of statistical inference. Biometrika, pages 175–240, 1928.
- [31] Jerzy Neyman and Egon Sharpe Pearson. Ix. on the problem of the most efficient tests of statistical hypotheses. Philosophical Transactions of the Royal Society of London. Series A, Containing Papers of a Mathematical or Physical Character, 231(694-706):289–337, 1933.
- [32] Xingchao Peng, Qinxun Bai, Xide Xia, Zijun Huang, Kate Saenko, and Bo Wang. Moment matching for multi-source domain adaptation. In Int. Conf. Comput. Vis., pages 1406–1415, 2019.
- [33] Filip Radenovic, Abhimanyu Dubey, Abhishek Kadian, Todor Mihaylov, Simon Vandenhende, Yash Patel, Yi Wen, Vignesh Ramanathan, and Dhruv Mahajan. Filtering, distillation, and hard negatives for vision-language pre-training. In IEEE Conf. Comput. Vis. Pattern Recog., pages 6967–6977, June 2023.
- [34] Alec Radford, Jong Wook Kim, Chris Hallacy, Aditya Ramesh, Gabriel Goh, Sandhini Agarwal, Girish Sastry, Amanda Askell, Pamela Mishkin, Jack Clark, et al. Learning transferable visual models from natural language supervision. In Int. Conf. Mach. Learn., pages 8748–8763. PMLR, 2021.
- [35] Michail I. Schlesinger and Vaclav Hlavac. Ten Lectures on Statistical and Structural Pattern Recognition. Computational Imaging and Vision, 2002.
- [36] Vikash Sehwag, Mung Chiang, and Prateek Mittal. Ssd: A unified framework for self-supervised outlier detection. In Int. Conf. Learn. Represent., 2021.
- [37] Yiyou Sun, Chuan Guo, and Yixuan Li. React: Out-of-distribution detection with rectified activations. Adv. Neural Inform. Process. Syst., 34:144–157, 2021.
- [38] Yiyou Sun, Yifei Ming, Xiaojin Zhu, and Yixuan Li. Out-of-distribution detection with deep nearest neighbors. Int. Conf. Mach. Learn., 2022.
- [39] Jihoon Tack, Sangwoo Mo, Jongheon Jeong, and Jinwoo Shin. Csi: Novelty detection via contrastive learning on distributionally shifted instances. Adv. Neural Inform. Process. Syst., 33:11839–11852, 2020.
- [40] Sunil Thulasidasan, Gopinath Chennupati, Jeff A Bilmes, Tanmoy Bhattacharya, and Sarah Michalak. On mixup training: Improved calibration and predictive uncertainty for deep neural networks. Adv. Neural Inform. Process. Syst., 32, 2019.
- [41] Antonio Torralba, Rob Fergus, and William T Freeman. 80 million tiny images: A large data set for nonparametric object and scene recognition. IEEE Trans. Pattern Anal. Mach. Intell., 30(11):1958–1970, 2008.
- [42] Grant Van Horn, Oisin Mac Aodha, Yang Song, Yin Cui, Chen Sun, Alex Shepard, Hartwig Adam, Pietro Perona, and Serge Belongie. The inaturalist species classification and detection dataset. In IEEE Conf. Comput. Vis. Pattern Recog., pages 8769–8778, 2018.
- [43] Sagar Vaze, Kai Han, Andrea Vedaldi, and Andrew Zisserman. Open-set recognition: A good closed-set classifier is all you need. In Int. Conf. Learn. Represent., 2022.
- [44] Catherine Wah, Steve Branson, Peter Welinder, Pietro Perona, and Serge Belongie. The caltechucsd birds-200-2011 dataset. Technical Report CNS-TR-2011-001, California Institute ofTechnology, 2011.
- [45] Hongxin Wei, Renchunzi Xie, Hao Cheng, Lei Feng, Bo An, and Yixuan Li. Mitigating neural network overconfidence with logit normalization. Int. Conf. Mach. Learn., 2022.
- [46] Jianxiong Xiao, James Hays, Krista A Ehinger, Aude Oliva, and Antonio Torralba. Sun database: Large-scale scene recognition from abbey to zoo. In IEEE Conf. Comput. Vis. Pattern Recog., pages 3485–3492. IEEE, 2010.
- [47] Jingkang Yang, Haoqi Wang, Litong Feng, Xiaopeng Yan, Huabin Zheng, Wayne Zhang, and Ziwei Liu. Semantically coherent out-of-distribution detection. Int. Conf. Comput. Vis., pages 8281–8289, 2021.
- [48] Jingkang Yang, Pengyun Wang, Dejian Zou, Zitang Zhou, Kunyuan Ding, Wenxuan Peng, Haoqi Wang, Guangyao Chen, Bo Li, Yiyou Sun, et al. OpenOOD: Benchmarking generalized out-of-distribution detection. In Thirty-sixth Conference on Neural Information Processing Systems Datasets and Benchmarks Track, 2022.
- [49] Jingkang Yang, Kaiyang Zhou, Yixuan Li, and Ziwei Liu. Generalized out-of-distribution detection: A survey. arXiv preprint arXiv:2110.11334, 2021.
- [50] Sangdoo Yun, Dongyoon Han, Seong Joon Oh, Sanghyuk Chun, Junsuk Choe, and Youngjoon Yoo. Cutmix: Regularization strategy to train strong classifiers with localizable features. In Int. Conf. Comput. Vis., pages 6023–6032, 2019.
- [51] Hongjie Zhang, Ang Li, Jie Guo, and Yanwen Guo. Hybrid models for open set recognition. In Eur. Conf. Comput. Vis., 2020.
- [52] Zhilin Zhao, Longbing Cao, and Kun-Yu Lin. Revealing distributional vulnerability of explicit discriminators by implicit generators. CoRR, abs/2108.09976, 2021.
- [53] Bolei Zhou, Agata Lapedriza, Aditya Khosla, Aude Oliva, and Antonio Torralba. Places: A 10 million image database for scene recognition. IEEE Trans. Pattern Anal. Mach. Intell., 40(6):1452–1464, 2017.