Sub-nominal resolution Fourier transform
spectrometry with chip-based combs
Lukasz A. Sterczewski1,2,∗, and Mahmood Bagheri1,
1Jet Propulsion Laboratory, California Institute of Technology, Pasadena, CA 91109, USA
2Faculty of Electronics, Photonics and Microsystems, Wroclaw University of Science and Technology, Wyb. Wyspianskiego 27, 50-370 Wroclaw, Poland
∗e-mail: lukasz.sterczewski@pwr.edu.pl
¶e-mail: mahmood.bagheri@jpl.nasa.gov
Chip-based optical frequency combs address the demand for compact, bright, coherent light sources of equidistant phase-locked lines. Traditionally, the Fourier Transform Spectroscopy (FTS) technique has been considered a suboptimal choice for resolving comb lines in chip-based sensing applications due to the requirement of long optical delays, and spectral distortion from the instrumental line shape. Here, we develop a sub-nominal resolution FTS technique that precisely extracts the comb’s offset frequency in any spectral region directly from the measured interferogram without resorting to nonlinear -to- interferometry. This in turn enables MHz-resolution spectrometry with millimeter optical retardations. Low-pressure MHz-wide absorption lines probed by widely-tunable chip-scale mid-infrared OFCs with electrical pumping are fully resolved over a span of tens of nanometers. This versatile technique paves the way for compact, electrostatically-actuated, or even all-on-chip high-fidelity FTS, and can be readily applied to boost the resolution of existing commercial instruments several hundred times.
The compact footprint, low power consumption and native operation in spectral regions relevant for optical sensing makes chip-scale optical frequency combs (OFCs) 1, 2, 3, 4 ideal candidates for broadband and high-resolution spectrometers 5. Arguably, the most popular technique to resolve comb lines relies on dual-comb beating between a pair of mismatched combs 6 on a fast microwave-bandwidth photodetector. Although dual-comb spectroscopy (DCS) enables real-time monitoring of broad optical bandwidths, it poses a significant challenge for precise, extended-timescale measurements. The difficulty lies in ensuring high mutual coherence between the sources via analog 7, 8, 9 or digital synchronization schemes 10, 11, 12, and the need for high-speed digital signal processing. Additionally, strict requirements on the comb optical linewidth make many devices incompatible with the DCS technique. Another challenge faced by chip-scale OFCs is gap-less tunability 8, 13, 14 for performing measurements beyond the coarse mode spacing on the order of 5–20 GHz, which requires the presence of spectrally-matched low-phase noise regimes.
Here, we show that a solution to precise high-resolution measurements using chip-scale OFCs lies in the Fourier Transform Spectroscopy (FTS) technique 15, which fundamentally requires an identical integration time as the DCS technique to reach the same signal-to-noise ratio (SNR) 16, yet needs only a single comb. The high brightness of OFCs 17, 18 previously explored in conventional FTS systems 19, 20 is now merged with MHz resolutions obtainable at millimeters of optical retardations, which exceeds 100 the nominal resolution. All that is possible to implement in an arbitrary spectral region even for free-running OFCs. The only requirement is the knowledge of the comb’s repetition rate, which can be obtained directly from the device’s electrical bias or a photodetector.
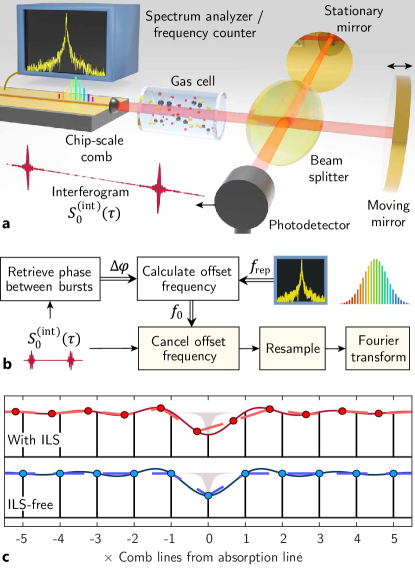
Whereas the apparent modal sparsity of chip-scale OFCs can be seen as a disadvantage, it becomes a key enabler for compact high-resolution FTS. The FTS technique employs a Michelson or Mach-Zehnder interferometer to measure a time-averaged field autocorrelation known as the interferogram (IGM, ) related to the power spectral density via the Fourier transform. The IGM results from optical interference between the optical source’s waveform and its time-delayed copy on a slow photodetector. A typical IGM of an OFC is expected to possess intensive bursts separated by lower-intensity regions (Fig. 1a) with envelope periodicity relating to the inverse of the comb repetition rate .
For an arbitrary (even incoherent) source, the nominal spectral resolution in FTS is limited by the inverse of the maximum optical path difference (OPD) between the interferometer moving and stationary arms. However, the delay range resolution limit can be greatly surpassed if the light source has OFC properties 21, 22. A special IGM sampling procedure can virtually eliminate a convolution of the measured spectrum with an instrumental line shape (ILS) function induced by a truncation of the scanned optical path. The truncation acts as a box-car window, which limits the resolution and distorts the measured spectrum. This can be mitigated via ILS-free FTS: one has to measure exactly one period of the IGM, which implies an OPD of . This is why a 10 GHz semiconductor laser OFC requires only cm of OPD for megahertz resolution FTS spectra, which translates into 15 mm of the moving arm displacement in conventional, and 7.5 mm in double-sided mirror 23 or double-pass 24 configurations, or even sub-mm in double-pendulum arrangements 25. This is in stark contrast to nominal MHz-resolution FTS, which requires an OPD in the range of meters.
Unfortunately, the indispensable requirement of prior ILS-free FTS approaches is the knowledge (and stabilization) of the comb’s carrier-envelope-offset (CEO), or simply offset frequency , which traditionally has been obtained via -to- interferometry 26 of an octave-spanning source. Since in many spectral regions the -to- scheme is either impractical or virtually impossible to implement, this limitation has excluded spectrally narrower sources with low pulse energies or with frequency-modulated (FM) emission spectra from surpassing the nominal FTS resolution, which constitute a majority of chip-scale OFCs. From a system complexity standpoint, bulky stabilized near-infrared fiber OFCs with MHz repetition rates require meters of OPD to meet the subnominal resolution criterion, which has restricted such instruments to a laboratory environment. Additionally, access to the spectroscopically-relevant mid-infrared spectral range has relied on nonlinear frequency conversion techniques 27, which further increased the system complexity and footprint. By adapting the subnominal FTS procedure to electrically-tunable chip-scale OFCs without an easily measurable offset frequency, we perform high-resolution (MHz) and broadband (THz-wide) spectroscopy with millimeter-long mechanical displacements using millimeter-scale free-running sources operating natively in the mid-infrared. The technique may find application in existing Fourier Transform Infrared Spectrometers (FTIRs), which have conventionally been seen as incompatible with high-resolution applications. Our technique (inspired by prior work of Maslowski et al. in Ref. 21, where all comb parameters needed to be known and stabilized) enables turning them into instruments with equivalent OPDs on the order of meters without any modifications. This in turn gives access to Doppler-limited molecular transitions at lower pressures and temperatures such as occurring in space. Also, recent developments in on-chip FTS with millimeter-scale displacements 28 can be leveraged to perform high-resolution on-chip spectrometry with meter-scale equivalent OPDs.
Experiment
We will now demonstrate the application of the sub-nominal FTS technique to interleaved measurements of low-pressure gaseous analytes performed using a compact Michelson interferometer (Fig. 1a). Here, we use two different mid-infrared chip-scale OFCs: a widely-tunable interband cascade laser (ICL) comb, and a quantum well diode laser (QWDL) comb (see Supplementary Information for details). A full mathematical description of the technique is given in Methods, but the general idea is laid out here. The essence of the proposed ILS-free FTS procedure (Fig. 1b) is to modify the measured single-period IGM so that comb lines in the frequency domain are located at zero-crossings of the truncation-induced ILS 21, 22. This is shown schematically in Fig. 1c, which clearly shows what happens when this condition if fulfilled (ILS-free) and violated (with ILS). Conventionally, a prerequisite for implementing this technique is the knowledge of the comb’s and . The ILS-cancelling routine digitally nulls followed by IGM resampling and truncation to include exactly one signal period defined by . Unfortunately, whereas is easily measurable directly from a laser cavity or photodetector (with or higher precision), for most electrically-pumped OFCs it is extremely challenging to measure . Fortunately, the combination of knowledge with digital retrieval of the IGM phase increment allows us to bypass this limitation. The key is to acquire an asymmetric single-sided IGM that carries information about instead of the double-sided used conventionally. This technique unlocks the high-resolution FTS potential of many comb platforms, where retrieval via -to- interferometry 26 would be difficult or virtually impossible to implement. By definition, the IGM centerburst has zero phase at zero delay (constructive interference of all wavelengths). However, the peak of the first IGM satellite (at a temporal delay of ) accumulates a phase related to . When corrected for the discrete number of points in the IGM (which are sampled at multiples of the FTS reference wavelength ), it can be used as a MHz-accurate estimate of .
Spectroscopy
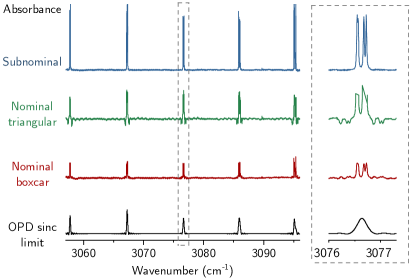
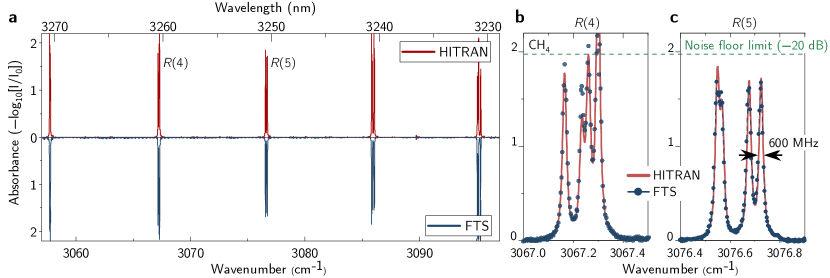
To prove the exactitude of the technique, we have compared the ILS-free spectra of 95 Torr methane (CH4) with those obtained by conventional treatment of IGMs acquired by an interferometer with an OPD of 35 mm (8.5 GHz resolution), which captures the full centerburst, and one roundtrip burst. As an OFC source, we used an ICL comb 4 with a 9.6 GHz repetition rate tuned by the injection current in a gap-less fashion (over a full ). Peak intensities and positions were tracked for line intensity data in conventional FTS for comparison. Fig. 2 shows the measured absorbance in the case of unapodized (nominal boxcar), apodized (triangular window), and proposed subnominal FTS technique. While the peak tracking approach enables us to bypass the conventional incoherent source resolution limit (OPD sinc limit), the lines remain nonetheless severely distorted. They possess ringing artifacts, and display negative absorbances, while some features remain unresolved with drastically reduced intensities. In contrast, the ILS-free data that required only the knowledge of the comb’s possess clear, well-resolved, and undistorted lines. A comparison of the full-span methane absorbance measurement including spectral elements spaced by 96 MHz with the HITRAN 2020 database 29 is shown in Fig. 3a, and reveals excellent agreement between the fitted, and measured spectrum covering cm-1 (1.2 THz / 42 nm) with a 96 MHz point spacing. Manifold features of lines , and in the band of CH4 as narrow as 600 MHz at these conditions, are faithfully reproduced (Fig. 3b, and Fig. 3c, respectively). The major limitation results from the limited dynamic range of 20 dB (absorbance of 2), when the measurement noise floor is reached. Consequently, the SNR of comb lines probing such strong absorptions is drastically lower. It can be greatly improved with longer averaging (here it took 1.5 seconds per step), or a comb source with a greater power per mode.
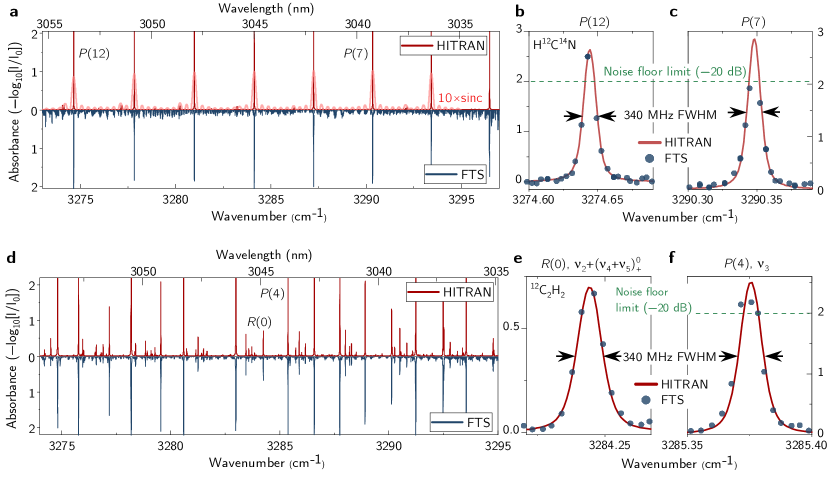
To demonstrate the versatility of the technique and its independence on the comb source, we employed a recently demonstrated mid-IR quantum well diode laser (QWDL) comb 30 at 3 m to probe two pure molecular standards: hydrogen cyanide (H12C14N), and acetylene (12C2H2), at pressures of 2 Torr, and 10 Torr, respectively. Both analytes possess 340 MHz wide Doppler-limited absorption lines (FWHM), which practically require an instrumental resolution greater than 100 MHz to accurately reproduce the lineshape. Figure 4a plots the subnominal resolution FTS measurement of the fundamental mid-infrared band of pure H12C14N, which displays pronounced amounts of noise (0.1 in absorbance units) due to a greater sensitivity to optical feedback of QWDL devices (see Methods). Also, the QWDL comb has a narrower span (20 nm). Nevertheless, the FTS measurement is of high fidelity, as shown in Fig. 4b for line , and Fig. 4c for , except for weak absorbance clipping to a value of 2 due to the SNR limit. Even more complex features due to overlapping spectroscopic bands are well resolved for the second molecular standard of 12C2H2 at 2 Torr (Fig. 4d) with two representative lines in the low-absorbance (Fig. 4d), and high-absorbance regime (Fig. 4e), both in excellent agreement with the HITRAN model. Note that in all measurements, the spectroscopic axis was retrieved solely from the measured repetition rate and a known interferometer reference wavelength (here HeNe laser). The uncertainty of the frequency scale retrieved from consecutive measurements is estimated to be 0.005 cm-1 (150 MHz, 1.5% relative to ). Note that the feasibly of exactly matching the spectrometer sampling points to the comb peak locations is in stark contrast to comb spectroscopy based on grating optical spectrum analyzers (OSA) 5, which additionally lacks the Jacquinot- (throughput), Fellgett- (multiplex), and Connes- (wavelength accuracy) advantages of FTS. To date, high-resolution OSA instruments have been used to probe only multi-GHz absorption lines, while distortion effects arising due to this mismatch and entrance slit effects may become dominant in the Doppler-limited regime, as probed here.
Although in this proof-of-concept, minute-scale demonstration we utilize a commercial FTIR instrument, the combination of millimeter-long optical displacements with the electrically-pumped chip-scale source paves the way for extremely compact, precise, battery-operated spectroscopic instruments with chip-size footprints 28. Even existing on-chip spectrometers may be boosted in resolution almost a thousand times by employing widely-tunable shorter-cavity OFCs with repetitions on the order of tens of GHz like microresonators 2 or quantum cascade lasers (QCLs) 1, 3. Obviously, the sub-nominal technique does not change their coarse, GHz spectral sampling grid. It only ensures that sparse, interleaved spectra with MHz resolutions around the comb teeth are undistorted. For electrically-pumped OFC, the need for comb line positions tuning for spectral interleaving can be easily fulfilled by simply changing the injection current or temperature. This motivates the future development of broadband OFC sources with reproducible gap-less tuning capabilities yet with less focus on absolute frequency stability. This is because the proposed technique unlocks the high-resolution spectroscopy potential of emerging OFC chips with DCS-incompatible optical linewidths. For instance, in some regimes, the ICL comb used here exhibits a comb linewidth of 50 MHz, which would render an unresolved and noisy microwave spectrum with the DCS technique, but performs well in FTS. Analogous challenges are faced by QCLs operating in the terahertz range 31. We also envision enhancing the digitally-enabled ILS-free technique by laser modulation schemes to sense low concentrations of analytes without relying on direct absorption measurements. Beyond analytical spectroscopy, the technique may also find application in OFC coherence characterization using linear microwave interferometry techniques such as SWIFTS 32 to completely eliminate the need for lineshape deconvolution. It will also enable one to analyze the offset frequency tuning characteristics and dynamics in emerging OFC platforms without resorting to optical heterodyne techniques, which are difficult to implement in more exotic spectral regions.
Methods
Offset frequency retrieval: The electric field emitted by an optical frequency comb can be expressed as a superposition of its equidistant lines
| (1) |
where is the -th comb line intensity, is the angular optical frequency, and is the phase. obviously follows the frequency comb model with a common offset frequency , and a repetition frequency such that . The summation in Eq. 1 is over both positive and negative because the field is real, which implies that = and .
In FTS, the measured interferometric quantity is the autocorrelation of the time-averaged electric field , which disregards the optical phase:
| (2) |
The autocorrelation , referred to as the IGM, is a function of a relative optical delay . For an infinitely long acquisition using a perfect Michelson interferometer, the Fourier transform of Eq. 2 yields an array of Dirac deltas located at with intensities . Real interferometers, however, have limited optical displacements (), which introduce a truncation of the acquisition, corresponding in the frequency domain to a convolution of the true optical spectrum with an ILS function. For short optical displacements, not only will it limit the spectral resolution, but also introduce ringing artifacts from absorption lines. Fortunately, the influence of the ILS can be suppressed if one uses an optical frequency comb source 21. Note that in contrast to earlier approaches that correct the IGM based on known and stabilized and to obtain an ILS-free spectrum, here we are solving a quasi-inverse problem. Given a measurement of free-running , we estimate directly from the IGM, which is next digitally removed. Both frequencies are then used for frequency axis calibration.
At the heart of the ILS-free technique proposed here is the idea to convert a single-sided interferogram measured over , where , into a harmonic signal so that it can be circularly shifted just like it was recorded in double-sided mode (). In fact, the measured interferogram can be seen as a carrier wave modulated by a periodic envelope function. While the phase of the centerburst (around ) is zero (by definition of the autocorrelation requiring to have a global maximum at ), satellite bursts possess a relative phase shift between the envelope peak and the carrier, which is directly related to the offset frequency. The measured 1-st satellite (roundtrip) IGM burst can be expressed as:
| (3) |
Periodicity of the interferogram every takes place only for harmonic (offset-free) combs i.e. such that have because . Therefore, needs to be estimated and digitally removed from the IGM via frequency shifting.
To computationally extract the angular offset frequency much more precisely than via interpolating peaks in the frequency spectrum of a long interferometer scan covering multiple interferogram bursts, it is sufficient to retrieve the phase increment between the complex interferogram centerburst and the first satellite occurring after , namely:
| (4) |
where the real IGM has been converted into an analytic signal via the Hilbert transform
| (5) |
It is easy to realize that if one recalls the definition of the offset frequency , which for the angular frequency is simply . Therefore, .
The power of this retrieval technique stems from the fact that even for a free-running laser, is typically known with relatively high precision ( or higher), which allows one to incorporate this knowledge to obtain directly from acquired single-period IGMs. The exactitude of the retrieval will predominantly depend on the accuracy of the reference laser frequency used for measuring the optical displacement, and that of . It should be also noted that this technique is restricted to probe only slow offset temporal dynamics, as only time-averaged signals are measured, yet it is still sufficient for the retrieval of correction parameters for near-second acquisition timescales of FTS.
What follows from Eq. 4 is that in principle only one point is sufficient to retrieve ; however, for a statistically more accurate estimate, it is practical to calculate the mean of many samples. Rather than calculating the mean of complex arguments, which would be statistically biased due to the nonlinear operation of the arctangent function and issues with phase unwrapping, the correct way would be to average complex vectors first, and then calculate the complex argument of the average only.
Dealing with discrete number of points: Because the actual interferometer displacement is constrained to be a multiple of the reference wavelength , the offset phase increment will almost never be measured at exactly . This also means that the natural frequency spacing in FTS will be close, but not perfectly matched to that of the comb , where is the number of acquired IGM points. Fortunately, it can be corrected to arbitrary precision by means of Fourier interpolation, i. e. the IGM can have an arbitrary length with an equivalent change of also known as resampling. Simple IGM interpolation times also helps to suppress errors introduced by the discrete intervals of sampled data like the phase error resulting from missing the peak of the centerburst occurring at . Another advantage is that when the repetition rate varies throughout the scan, IGMs can be made of the same length (number of samples) through interpolation. This greatly simplifies the analysis of interleaved spectra.
To ensure that after phase-shifting the IGM is symmetric (since the measured spectrum is real), one has to acquire samples, unique on each side. This is equivalent to an IGM with one sample at ZPD () surrounded by samples on each side obtained through
| (6) |
where stands for rounding to the nearest integer. A discrete Fourier transform (or more specifically, the Fast Fourier Transform / FFT) of the -samples-long signal will yield a frequency spectrum with points between DC and the Nyquist frequency , or equivalently spaced by . Still, to avoid ILS distortion, the linear phase ramp in the IGM due to must be removed prior to FFT calculation.
To obtain an estimate of the offset frequency given the discrete constraints, one has to retrieve the carrier phase increment for the -th IGM point with that spaced points apart
| (7) |
assuming sample indexing starts at 1. The estimation exactitude can be greatly improved by averaging () in the complex domain using IGM samples that have non-zero magnitudes:
| (8) |
Although this value is close to the true offset phase increment , the discrete domain constraints may introduce a significant estimation bias. The non-integer number of IGM points required for a bias-free estimate in the perfect ODL-comb match condition is:
| (9) |
while measured are discrete IGM points. Therefore, one has correct the estimate by a phase shift due to the mismatch dependent on the IGM carrier frequency. It can either be coarsely assumed to lie around the center of mass of the comb emission spectrum, or retrieved from the IGM. Here, we rely on the latter. Using the Kay frequency estimator that avoids phase unwrapping 33, in units of cycles per samples is retrieved analogously to Eq. 8:
| (10) |
Oscillation at over samples accumulates a phase
| (11) |
This correction term is included in the offset frequency estimate:
| (12) |
Of course, the numerator must be phase-unwrapped to avoid large frequency jumps ( typically evolves slowly, much slower than per current step). Please also note that this frequency is used only for retrieving the frequency axis in the FTS measurement or studying the offset frequency evolution versus injection current. In the offset phase removal routine, however, it is better to multiply by a complex exponential with a linear phase ramp from 0 to in the IGM domain, as discussed in the next section.
Preparation of the interferogram: The offset frequency correction to ensure signal harmonicity relies on complex multiplication. The analytic signal is phase-shifted according to a phase ramp that increases linearly from 0 up to the scaled phase argument retrieved from the IGM as in Eq. 8
| (13) |
where stands for the real part of a complex argument. Consequently, is used only for retrieving the frequency axis rather than employed in the correction procedure. A visual depiction of the IGM at each processing step is provided in Supplementary Figure S1.
Ambiguity of the offset frequency sign: Because the IGM is a real signal, one cannot unambiguously determine the sign of solely from a single-period IGM. While it is not relevant for offset frequency cancellation, information if one deals with or is of critical importance for optical frequency axis calibration or for diagnostic purposes like studying the evolution of as a function of injection current or temperature. This problem is analogous to that of -to- interferometry, where between DC and two microwave beat notes lie symmetrically between (Nyquist frequency). Initially, one cannot distinguish between and , until one actuates the laser to check in what directions they move. This piece of information enables one to determine if is positive or negative.
This algorithm deals with the ambiguity by incorporating prior knowledge about the tuning linearity of multimode (or comb) sources. Supplementary Figure S3 shows that the incorrect sign of the retrieved magnifies the oscillatory frequency change due to (which is measured electrically from the device). When guessed correctly, it suppresses frequency fluctuations and yields a smooth tuning curve. This behavior is typical for chip-scale emitters and has been validated (with coarse instrumental resolution), as shown in Supplementary Figures S4 and S5.
Calculation of the frequency spectrum: We calculate an -point discrete Fourier transform (DFT) of using the FFT algorithm. This yields unique points starting from zero frequency (DC) spaced by in the optical domain . The offset frequency is added globally for each comb line position, so that the -th point of the ILS-free spectrum lies at an optical frequency
| (14) |
Supplementary Figures S2 and S6 show the retrieved optical frequency for one individual comb line along with and as a function of injection current. Both comb platforms exhibit nearly linear tuning.
The FFT is performed on an IGM that starts at (ZPD) and lasts exactly one period. Because in some cases the centerburst is not sampled at exactly , there is a small phase error due to IGM’s asymmetry, which implies phase correction. Such errors may also arise from residual offset phase persistent in the round trip burst. Here, a variation of the Mertz method is used 34 to address this issue. Assuming the Fourier transform yields a complex frequency spectrum:
| (15) |
we can ensure the spectrum is real (or equivalently that the IGM is symmetric) by compensating the spectral phase term using data from regions with non-zero intensity, i.e. where . The spectral phase for the correction is defined as
| (16) |
where stands for the imaginary part of a complex argument. Finally, we find the corrected ILS-free frequency spectrum from
| (17) |
Such-treated spectra were used for absorbance calculations.
Experimental setup details: Light from the chip-scale comb devices was first collimated with a black-diamond high-numerical-aperture anti-reflective (AR) coated lens, and next guided to the inteferometer through a free-space Faraday optical isolator to prevent dynamic optical feedback effects resulting from the moving mirror. To record FTS IGMs, we used a Bruker Vertex 80 FTIR spectrometer with an external thermoelectrically-cooled photodetector (PVI-4TE-3.4, VIGO), whose near-DC output was conditioned by a a low-noise current preamplifier (SR570, Stanford Research Systems) set to filter signals below 100 kHz. The internal apertures of the FTS system were set to 1 mm. At a mirror modulation frequency of 40 kHz, 25.3 mm of OPD were scanned in 1 s, which accounting for the return of the mirror to the start position, communication with the instruments, and data exchange overhead, yielded 10 IGMs with 3–3.15 cm OPD per minute. Injection current stepping was provided by a precision source meter (Keithley, 2420) connected to the external modulation input port of a low-noise laser driver (D2-105-500, Vescent Photonics), which was also responsible for device’s temperature stabilization. The ICL comb device was a single-section Fabry-Pérot device with a 3 m wide ridge waveguide (Thorlabs) run without any frequency stabilization. The QWDL device described elsewhere 30 was analogously housed and biased, except for using a different laser driver due to the insufficient modulation range of the D2-105-500. In the latter case, we used an LDX-3620, ILX Lightwave low-noise laser driver capable of being modulated by tens of mA. Simultaneously with the optical IGMs, using a microwave spectrum analyzer we measured and recorded the intermode beat note spectrum extracted electrically from the device through a bias-T.
Data processing: A Lorentzian fit was performed to all microwave intermode beat note spectra for retrieval, while estimation followed the previously described protocols. To obtain the absorbance spectra (base-10 logarithm), we calculated the difference between two ILS-free spectra: with and without the analyte (see Supplementary Figures S7 and S8 for raw sub-nominal resolution optical spectra). The absorbance spectra were next de-fringed using a sum-of-sines model due to parasitic etalons produced by the absorption cell’s windows. For the methane, and acetylene measurements, simple point-wise division yielded effective cancellation of residual intensity versus current modulation produced by external cavity effects, which is also visible in the repetition rate and tuning characteristics of both comb platforms (see Supplementary Information, Section 2 and 5). For the HCN, due to the pronounced feedback sensitivity of the QWDL, the noise cancellation by means of point-wise division was less effective.
References
- 1 Scalari, G., Faist, J. & Picqué, N. On-chip mid-infrared and THz frequency combs for spectroscopy. Applied Physics Letters 114, 150401 (2019).
- 2 Kippenberg, T. J., Holzwarth, R. & Diddams, S. A. Microresonator-Based Optical Frequency Combs. Science 332, 555–559 (2011).
- 3 Hugi, A., Villares, G., Blaser, S., Liu, H. C. & Faist, J. Mid-infrared frequency comb based on a quantum cascade laser. Nature 492, 229–233 (2012).
- 4 Bagheri, M. et al. Passively mode-locked interband cascade optical frequency combs. Scientific Reports 8, 3322 (2018).
- 5 Yu, M., Okawachi, Y., Griffith, A. G., Lipson, M. & Gaeta, A. L. Microresonator-based high-resolution gas spectroscopy. Optics Letters 42, 4442 (2017).
- 6 Coddington, I., Newbury, N. & Swann, W. Dual-comb spectroscopy. Optica 3, 414 (2016).
- 7 Coddington, I., Swann, W. C. & Newbury, N. R. Coherent Multiheterodyne Spectroscopy Using Stabilized Optical Frequency Combs. Physical Review Letters 100, 013902 (2008).
- 8 Villares, G., Hugi, A., Blaser, S. & Faist, J. Dual-comb spectroscopy based on quantum-cascade-laser frequency combs. Nature Communications 5, 5192 (2014).
- 9 Westberg, J., Sterczewski, L. A. & Wysocki, G. Mid-infrared multiheterodyne spectroscopy with phase-locked quantum cascade lasers. Applied Physics Letters 110, 141108 (2017).
- 10 Burghoff, D., Yang, Y. & Hu, Q. Computational multiheterodyne spectroscopy. Science Advances 2, e1601227 (2016).
- 11 Hébert, N. B. et al. Self-corrected chip-based dual-comb spectrometer. Optics Express 25, 8168 (2017).
- 12 Sterczewski, L. A., Westberg, J. & Wysocki, G. Computational coherent averaging for free-running dual-comb spectroscopy. Optics Express 27, 23875–23893 (2019).
- 13 Sterczewski, L. A. et al. Multiheterodyne spectroscopy using interband cascade lasers. Optical Engineering 75, 011014 (2017).
- 14 Gianella, M. et al. High-resolution and gapless dual comb spectroscopy with current-tuned quantum cascade lasers. Optics Express 28, 6197–6208 (2020).
- 15 Griffiths, P. R. & De Haseth, J. A. Fourier transform infrared spectrometry, vol. 171 (John Wiley & Sons, 2007).
- 16 Newbury, N. R., Coddington, I. & Swann, W. Sensitivity of coherent dual-comb spectroscopy. Optics Express 18, 7929–7945 (2010).
- 17 Udem, T., Holzwarth, R. & Hänsch, T. W. Optical frequency metrology. Nature 416, 233–237 (2002).
- 18 Picqué, N. & Hänsch, T. W. Frequency comb spectroscopy. Nature Photonics 13, 146–157 (2019).
- 19 Mandon, J., Guelachvili, G., Picqué, N., Druon, F. & Georges, P. Femtosecond laser Fourier transform absorption spectroscopy. Optics letters 32, 1677–1679 (2007).
- 20 Mandon, J., Guelachvili, G. & Picqué, N. Fourier transform spectroscopy with a laser frequency comb. Nature Photonics 3, 99–102 (2009).
- 21 Maslowski, P. et al. Surpassing the path-limited resolution of Fourier-transform spectrometry with frequency combs. Physical Review A 93, 021802 (2016).
- 22 Rutkowski, L., Masłowski, P., Johansson, A. C., Khodabakhsh, A. & Foltynowicz, A. Optical frequency comb Fourier transform spectroscopy with sub-nominal resolution and precision beyond the Voigt profile. Journal of Quantitative Spectroscopy and Radiative Transfer 204, 63–73 (2018).
- 23 Yang, Q., Zhao, B. & Wen, D. Principle and analysis of a moving double-sided mirror interferometer. Optics & Laser Technology 44, 1256–1260 (2012).
- 24 Jennings, D. E., Hubbard, R. & Brault, J. W. Double passing the Kitt Peak 1-m Fourier transform spectrometer. Applied Optics 24, 3438 (1985).
- 25 Jaacks, R. G. & Rippel, H. Double pendulum Michelson interferometer with extended spectral resolution. Applied Optics 28, 29–30 (1989).
- 26 Telle, H. R. et al. Carrier-envelope offset phase control: A novel concept for absolute optical frequency measurement and ultrashort pulse generation. Applied Physics B 69, 327–332 (1999).
- 27 Khodabakhsh, A. et al. Fourier transform and Vernier spectroscopy using an optical frequency comb at 3–5.4 m. Optics Letters 41, 2541 (2016).
- 28 Zhang, L. et al. Research progress on on-chip Fourier transform spectrometer. Laser & Photonics Reviews 15, 2100016 (2021).
- 29 Gordon, I. et al. The HITRAN2020 molecular spectroscopic database. Journal of Quantitative Spectroscopy and Radiative Transfer 277, 107949 (2022).
- 30 Sterczewski, L. A., Fradet, M., Frez, C., Forouhar, S. & Bagheri, M. Battery-operated mid-infrared diode laser frequency combs. Laser & Photonics Reviews 16, 2200224 (2022).
- 31 Burghoff, D. et al. Terahertz laser frequency combs. Nature Photonics 8, 462–467 (2014).
- 32 Burghoff, D. et al. Evaluating the coherence and time-domain profile of quantum cascade laser frequency combs. Optics Express 23, 1190–1202 (2015).
- 33 Kay, S. A fast and accurate single frequency estimator. IEEE Transactions on Acoustics, Speech, and Signal Processing 37, 1987–1990 (1989).
- 34 Mertz, L. Auxiliary computation for Fourier spectrometry. Infrared Physics 7, 17–23 (1967).
Acknowledgements
This work was supported under National Aeronautics and Space Agency’s (NASA) PICASSO program (106822 / 811073.02.24.01.85), and Research and Technology Development Spontaneous Concept Fund. It was in part performed at the Jet Propulsion Laboratory (JPL), California Institute of Technology, under contract with the NASA. L. A. Sterczewski’s research was supported by an appointment to the NASA Postdoctoral Program at JPL, administered by Universities Space Research Association under contract with NASA. L. A. Sterczewski acknowledges funding from the European Union’s Horizon 2020 research and innovation programme under the Marie Skłodowska-Curie grant agreement No 101027721. The authors would like to thank Dr. Kevin Lascola, and Dr. Feng Xie at Thorlabs Inc. for providing the ICL material, and Dr. Clifford Frez at JPL for providing the diode laser material used in this study. Dr. Jerry Meyer, and Dr. Igor Vurgaftman at NRL are acknowledged for fruitful discussions on ICL combs.
Author contributions
L.A.S. conceived the idea. L.A.S. carried out the optical and electrical measurements and analyzed the data. L.A.S and M.B. wrote the manuscript. M.B. coordinated the project.
Conflict of interest
The authors have filed a provisional patent application on this idea, U.S. provisional application no. 63/418,717. No other conflict of interest is present.
Data availability statement
The data that support the plots within this paper and other findings of this study are available from the corresponding author upon reasonable request.
Supplementary information
Supplementary information accompanies this paper.