2.3 DataAugmentationBasedon3DPixel-levelStatisticsAlgorithm
2.3.1 Three-dimensionalReconstructionTechnique
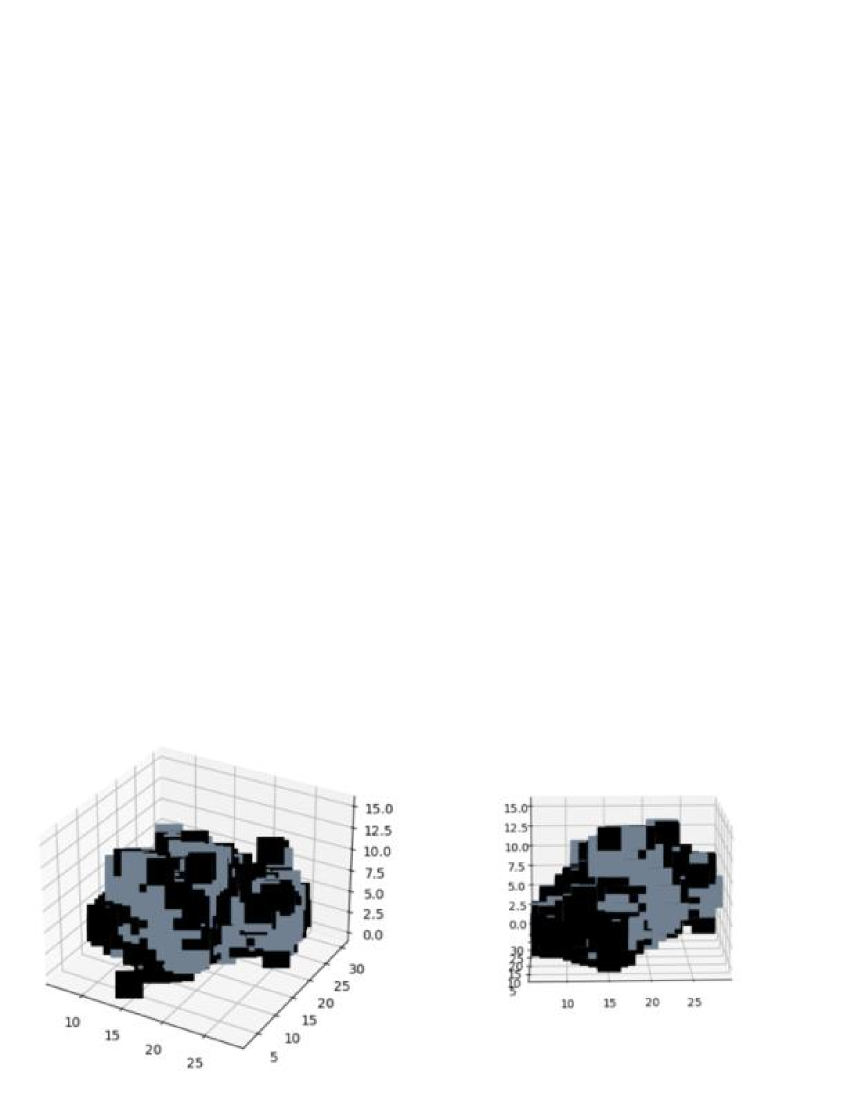
Inthissection,athree-dimensionalreconstructiontechniqueisusedtovisualizethelungCTsectionandnodules.Three-dimensionalreconstructionofmedicaldatacanmakeiteasiertounderstandthedatainformationobtainedintheexperiment.ImagescontainingonlynoduleswereobtainedfromCTimagesofLuna16database.Inordertoseparatethenodulefromthesurroundingtissue,thenodulecoordinateregionselectedintheboxwasusedtofindthecenterpointwiththesamegrayvalueaccordingtothealgorithmforthecenteralignmentofthetwo-dimensionalimage,andthenconvertedintothethree-dimensionalmatrixthroughtheconversionfunctiontoestablishthecorrespondingrelationshipbetweenthegrayvalueofthenoduleandthesurroundingtissue[lifrancis2017].Theoriginalimagesequenceisconvertedintoathree-dimensionalmatrixsequencetoformathree-dimensionalspacecontaininggrayvalues.Finally,the3Ddataofthenoduleisreconstructedinto3Dstereogram,andthecorrespondingrelationshipofgraylevelisfine-tunedaccordingtothe3Dstereogramofthenodule,soastoobtainamoreaccurate3Dstereogramofthepulmonarynodule.Figure2showsathree-dimensionalviewofthenodule.
2.3.2 Predictionof3DPulmonaryNodules
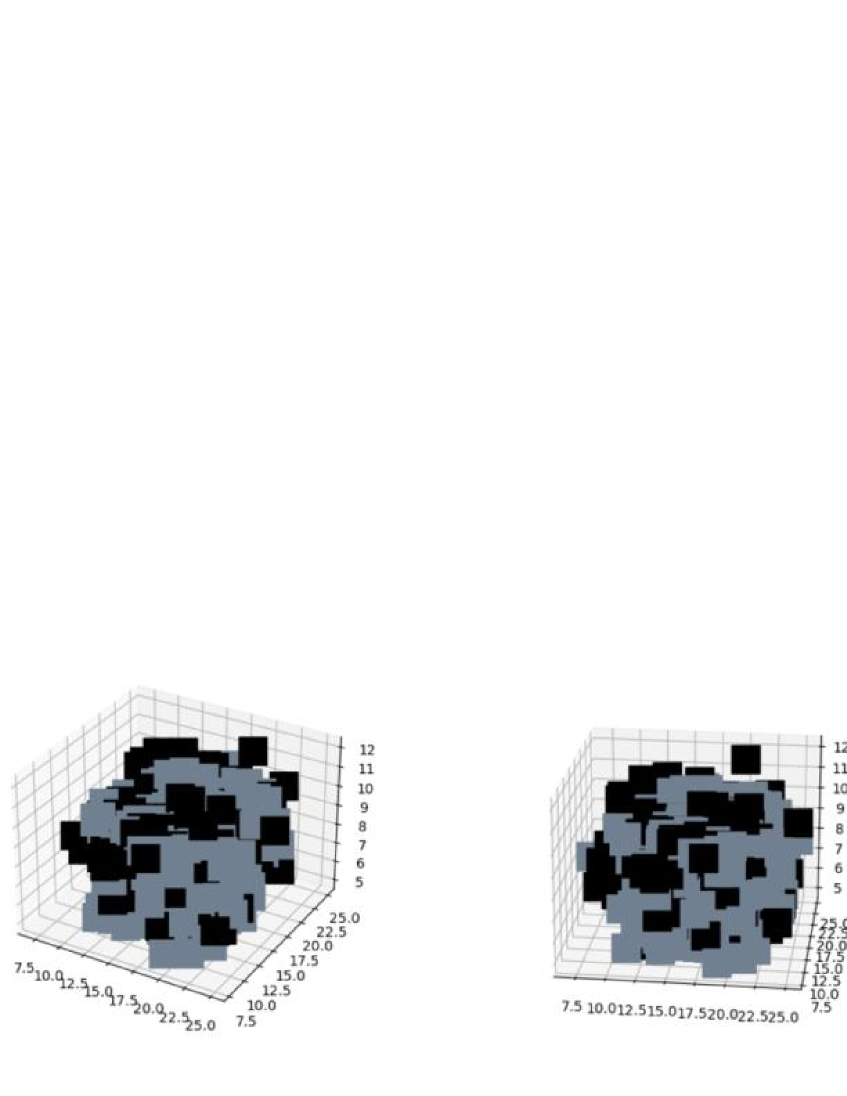
Thespecificimplementationofthelungnodulegenerationalgorithmisasfollows:Theimageofthedatasetistransformedintoa3Dmatrixcontaininggrayvalueby3Dreconstruction.Then,thethree-dimensionaldataofmultiplenoduleswerecounted,thatis,thegrayscalevalueofeachthree-dimensionalcoordinatepointanditsoccurrencetimeswereconvertedintoprobability.Asequenceoftwo-dimensionalimagesofpulmonarynodulesistransformedintoathree-dimensionalmatrix,witheachcoordinatepoint(x,y,z)correspondingtoagrayvalue.Thegray-scalevaluesofthethree-dimensionaldataofmultipledifferentpulmonarynodules,appearinginthesamecoordinatepointsandtheiroccurrencetimesnwerecounted,andthecentersofthemwereallsettothesamecoordinate(x0,y0,z0)foraxisalignment.Thesinglecoordinate(x,y,z),thegrayvalueofoccurrenceandthecorrespondingtimesareconvertedintoprobability,asshowninFormula(2.1).Theprobabilityoftheoccurrenceofthegrayvalueinthecorrespondingcoordinatesisusedtogeneratethe3Dmatrix.
| (2.1) |
3.
2.4 DataAugmentationBasedonGenerativeAdversarialNetworks
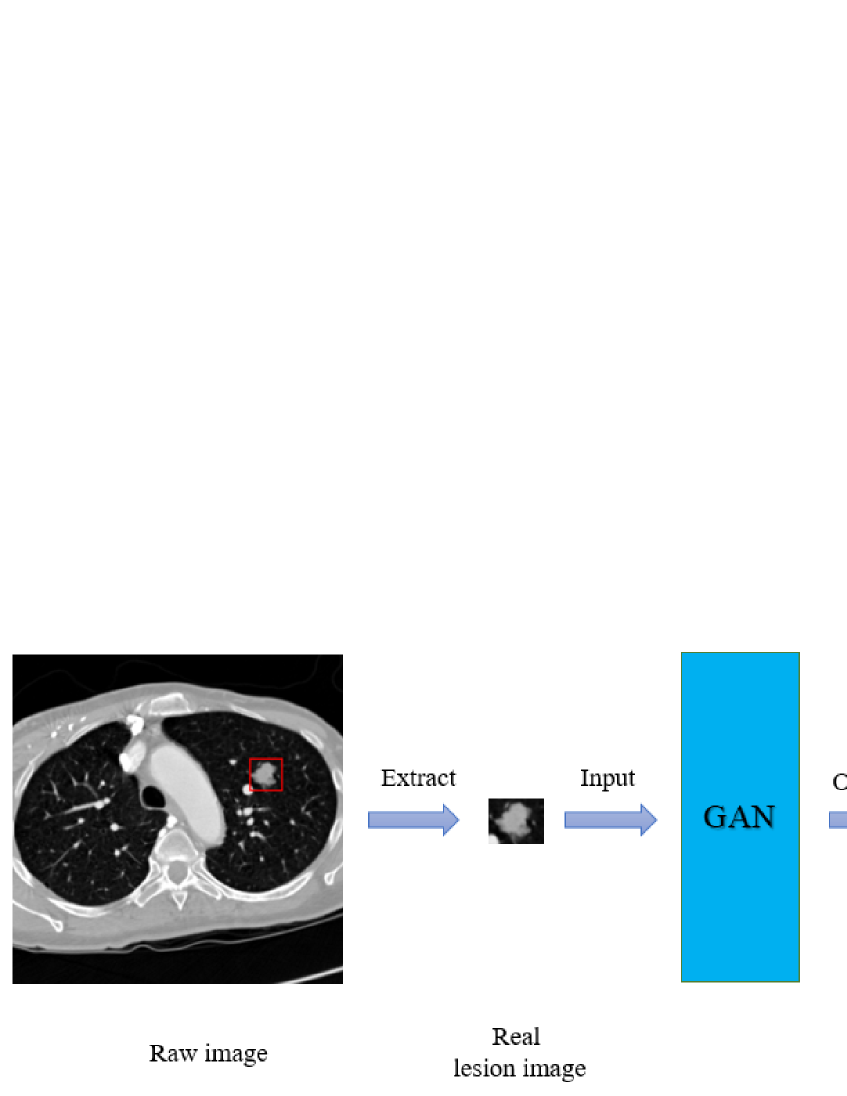
Generativeadversarialnetwork(GAN)framework[goodfellow2014]isacommonlyusedgenerationmodel,ithastheadvantageofsimulatingthedistributionofdata,Inthissection,GANisusedtogeneratelungnoduledatatoincreasethediversityofsamples,andthismethodcandirectlyevaluatethequalityofgeneratedimages.TheprocessisshowninFigure4.
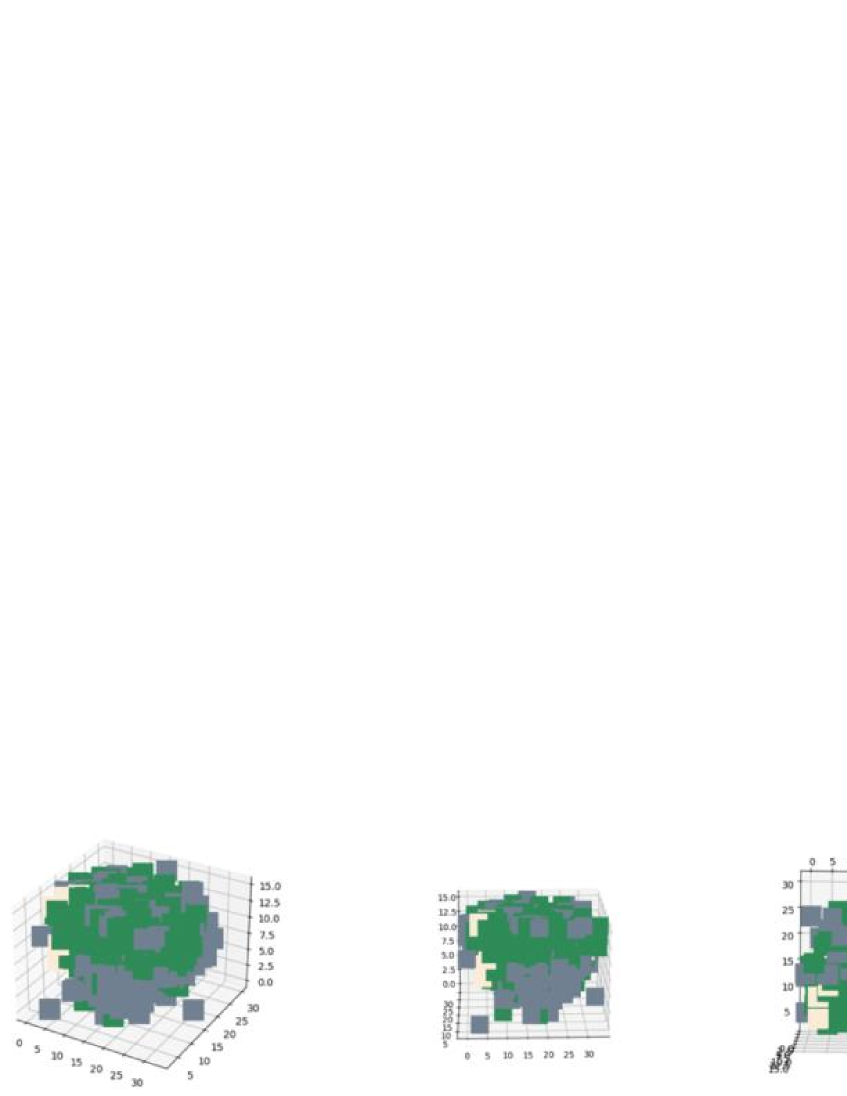
5showsathree-dimensionalviewofdifferentpulmonarynodulesgeneratedbyGANframework.
2.5 PulmonaryNoduleSmplesAugmentation
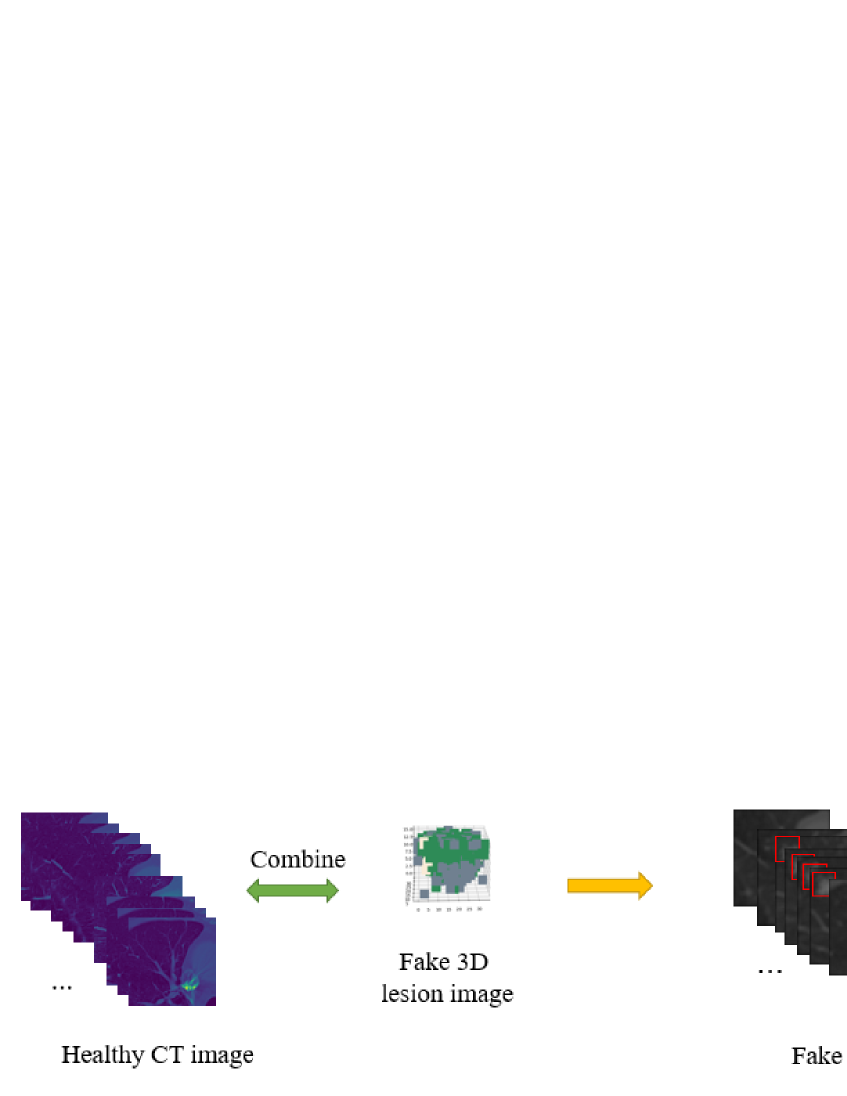
Anewdataaugmentationmethodforgeneratingpulmonarynoduleswasproposed.Thegenerated3DpulmonarynodulesarefusedwithnormallungCTimagestoobtainthenewpulmonarynodulesamples,andtheprocessshowninFigure6.Thecoordinateofapointgeneratingpulmonarynodulesis(x1,y1,z1)andthegrayvaluecorrespondingtothecoordinateofthispointisv1.Then,thegrayvaluev2correspondingtothesamecoordinate(x1,y1,z1)inthelungsectionwithoutnodulesisreplacedwithv1,andthegrayvaluecorrespondingtoallcoordinatepointsinthethree-dimensionaldatageneratingpulmonarynodulesisreplacedbythesamemethod.Allcoordinatepointsinthethree-dimensionaldatageneratedbypulmonarynoduleswereselectedtogeneratethecorrespondingMaskmaptoprovidetrainingsamplesforsubsequentpulmonarynodulesdetection.
3 methods
3.1 PulmonaryNoduleDetection
Thewholeprocessofpulmonarynodulesdetectionalgorithmisdividedintothefollowingsteps:firstly,aMaskforpulmonarynodulesisgeneratedaccordingtothecoordinatesanddiametersofnodulesgivenbytheLuna16database;then,theCTimageisdenoised,CTscan(windowwidth,600H;windowlevel,-