Multi-Modal Bias: Introducing a Framework for Stereotypical Bias Assessment beyond Gender and Race in Vision–Language Models
Abstract
Recent breakthroughs in self-supervised training have led to a new class of pretrained vision–language models. While there have been investigations of bias in multimodal models, they have mostly focused on gender and racial bias, giving much less attention to other relevant groups, such as minorities with regard to religion, nationality, sexual orientation, or disabilities. This is mainly due to lack of suitable benchmarks for such groups. We seek to address this gap by providing a visual and textual bias benchmark called MMBias, consisting of around 3,800 images and phrases covering 14 population subgroups. We utilize this dataset to assess bias in several prominent self-supervised multimodal models, including CLIP, ALBEF, and ViLT. Our results show that these models demonstrate meaningful bias favoring certain groups. Finally, we introduce a debiasing method designed specifically for such large pretrained models that can be applied as a post-processing step to mitigate bias, while preserving the remaining accuracy of the model.
1 Introduction
The recent emergence of large pretrained vision–language models has revolutionized many multimodal tasks previously considered impractical to solve. Although architectures capable of jointly addressing computer vision and NLP tasks using a single unified model have been around for a while Lu et al. (2019); Tan and Bansal (2019); Li et al. (2019), recent advances in self-supervised training methods have amplified the significance and applicability of such models. The sheer power of these methods is highly dependent on the scale of the model and the diversity and distributional properties of the dataset on which they are trained. Due to their wide range of diverse applications Eslami et al. (2021), it is of utmost importance to be aware of the shortcomings of vision–language pretrained (VLP) models as well as their capabilities.
One such limitation is that, like any other machine learning system, multimodal models may be prone to exhibiting human-like stereotypical biases such as gender or race-related stereotypes Nadeem et al. (2020); Garrido-Muñoz et al. (2021). For instance, pretrained language models have been shown to associate male-gendered phrases and sentences to a greater extent with certain high-paying professions and even with individual traits such as intelligence, in comparison to female-gendered phrases Wang et al. (2021a). Similarly, it has been found that Hispanic and African American names may be tied to words representing danger and crime more often than Caucasian names Manzini et al. (2019). Certain biases have also been identified in computer vision models as well Wang et al. (2019). Such biases are discriminatory towards affected population groups and can be extremely harmful to society the more these models are deployed in real-world applications.
While there has been some research aimed at identifying and addressing biases in vision–language models, most such studies have focused on gender and racial biases, while other notable groups such as religious minorities, national minorities, LGBTQ people, and people with disabilities have received much less attention, despite their legal status as protected groups in the US. This is alarming considering the fact that the potentially affected groups together constitute a considerable part of the global population. For instance, the US Census Bureau reported approximately 40 million people identifying as immigrants in the US and 244 million world-wide as of 2015.111www.un.org/en/development/desa/population/migration Furthermore, approximately 40 million people in the US and about 1 billion people in the world suffer from some sort of disability.222www.worldbank.org/en/topic/disability One of the main obstacles for bias analysis of these relevant population groups has been the lack of standardized benchmark datasets that specifically enable an analysis of how they may be affected. In this paper, we attempt to address this problem by gathering and releasing a visual and textual bias benchmark called MMBias, consisting of approximately 3,500 images and 350 phrases covering over 14 minority subgroups. Furthermore, we utilize the dataset to measure stereotypical bias in several prominent self-supervised multimodal VLP models that have attracted significant attention recently, namely OpenAI CLIP Radford et al. (2021), ALBEF Li et al. (2021), and ViLT Kim et al. (2021). In our experiments, we quantify the bias present in these models, including both cross-modal and intra-modal bias. Our results confirm that these models harbor meaningful biases favoring certain groups. Finally, we introduce a novel debiasing method designed for such large pretrained models that can be applied as a post-processing step to mitigate bias, and we show that this step does not adversely affect the performance in a substantial way.
2 Related Work
The majority of work on language models only focuses on gender and racial bias assessment Guo and Caliskan (2021); Bordia and Bowman (2019). However, there have been some studies that consider bias with regard to other categories such as profession, religion, and disability as well Nadeem et al. (2020); Hutchinson et al. (2020). However, these forms of bias are not just exclusive to the language domain, and image classifiers as well as multimodal models have also been shown to demonstrate such biases Srinivasan and Bisk (2021); Ross et al. (2020).
Thus far, there has been rather limited work on multimodal bias assessment of self-supervised models such as CLIP, and prior work considers only gender and racial biases. Wang et al. (2021b) measures the gender and racial bias in CLIP’s image classification module using the Fairface dataset, while Wang et al. (2021a) further show that CLIP associates male-gendered phrases to high-paying professions more than female-gendered phrases. Agarwal et al. (2021) provide insights towards potential applications of the CLIP model and further study and evaluate its gender/racial bias as well as measuring the misclassification differences between different subgroups. Bhargava and Forsyth (2019) measure and propose solutions to gender bias in several image captioning systems.
The only work that addresses other relevant groups such as religion, sexual orientation, and disability in the image space is Steed and Caliskan (2021). However, the data considered in the study is limited, consisting of only around 600 images, out of which around 500 again correspond to gender and racial biases. This leaves only around 100 for other protected groups, i.e., fewer than 20 images for each protected group study. Sirotkin et al. (2022) use this limited dataset to measure bias in several self-supervised visual models but the authors do not explore multimodal models such as CLIP. An orthogonal line of research has been pursued in Zhou et al. (2022), where several multimodal vision-language models are analyzed to measure these models’ tendency to pick stereotypical statements as captions for anti-stereotypical images in pre-trained vision-language models. With MMBias, we thus hope to enable further research on diverse forms of bias in vision–language models.
3 Methodology
Bias and Fairness.
In conventional social studies, one of the most well-established and widely-investigated forms of biases is what is known as implicit bias, or as social stereotypes, defined and investigated in Greenwald and Banaji (1995). This type of bias is usually measured using Implicit Associate Testing (IAT), introduced in the seminal work of Greenwald et al. (1998), and has so far been widely used to describe and account for a wide range of implicit prejudices Kiefer and Sekaquaptewa (2007). IAT experiments quantify human implicit bias by measuring response times differences when human subjects are asked to pair similar concepts and different concepts. In its original form, IAT was used to to measure the degree of pleasantness (a.k.a. valence in psychology), of entities such as “flowers” and “insects” by pairing them with abstract attributes such as pleasant and unpleasant Russell (2003). Caliskan et al. (2017) showed that a similar IAT testing paradigm can be applied to bias measurement in deep embeddings. In this approach, instead of subject reaction time, the proximity of embeddings of a basket of words that represent a concept is measured. Furthermore, word sentiment is usually used to represent valence, due to well-established studies linking word sentiment with the psychological concept of valence Mohammad (2016). The experimental methodology used in our study follows similar principles.
More generally, a machine learning system may be deemed unbiased or fair when its predictions do not favor members of any relevant population group or discriminate against any other Garrido-Muñoz et al. (2021). For instance, suppose that the class under consideration is religion and we are evaluating pleasantness / unpleasantness scores a system would assign to each considered religious subgroup. A machine learning system is assessed as fair if and only if the scores it assigns to different religious subgroups do not differ substantially.
More formally, in a bias study, the two subgroups under study, also known as target entities, may be represented as sets of instances and . For example, may be images corresponding to Islam and to Christianity. Furthermore, the attributes towards which the bias is being measured may be given as sets and . For example, could be a set of words representing pleasantness, while represents unpleasantness.
Similarly, many gender-bias studies consider sets for high paying vs. low paying professions as attribute sets. A machine learning model is then said to be fair towards subgroups and with respect to attributes and if and only if , where is some scoring function that scores the similarity of the sets of attributes , to a target entity or .
Scoring Functions.
There can be different choices for the scoring function above. Caliskan et al. (2017) introduced the Caliskan test shown below in Eq. 1, with capturing the difference of the mean of cosine distances between targets and attributes. This method is ideal for the analysis of models such as CLIP, since they operate directly on entity embeddings. The effect size represented by is a measure of the magnitude of the bias. Larger numbers indicate a stronger bias, while the sign reflects which target entity the attributes show a stronger bias towards.
However, for vision–language fusion models that do not provide explicit access to separate image/text embeddings, an alternative scoring function can be defined as the difference in the image–text matching probabilities, as in the last row of Eq. 1. Sets and as well as and are usually constructed to have equal number of samples.
| (1) |
Here, denotes the cosine similarity of vectors, while denotes the probability of a text and image pair being a match.
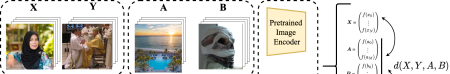
Evaluation Pipeline
Fig. 1 shows the pipeline followed in our experiments. The target and attribute stimuli are fed into the model and embeddings it emits are used to compute the bias score.
4 The MMBias Dataset
The majority of the work on societal bias analysis so far focuses on unimodal language models. Although there has been some limited work on multimodal models, these studies mainly focus on gender and racial disparities. As a result, bias with regard to other classes, including religion, nationality, sexual orientation, and disability have largely been unexplored. This has been mainly due to the lack of standardized benchmark datasets that specifically target these minority groups. To address this concern, we gather and release the first multimodal dataset of this size in this line of research that spans over a wider range of groups. We hope that this dataset can serve as a benchmark in future research.
| Target Concept | Target Values |
|---|---|
| Religion | Islam, Christianity, Judaism, |
| Buddhism, Hinduism | |
| Nationality | American, Arab, |
| Chinese, Mexican | |
| Disability | Physical disability, |
| Mental disability, No disability | |
| Sexual Orientation | Homosexual, Heterosexual |
Our dataset, referred to as MMBias, contains 3,500 target images and 350 English phrases corresponding to different target concepts. Each target category has 250 corresponding images obtained from the popular image uploading website Flickr. Our dataset also contains 20 textual phrases related to each target concept, used for bias experiments in the textual domain.
Data Compilation
For gathering the image data, we invoke the Flickr API and retrieve 1,000 most relevant images for each target concept using 10–12 search keywords for each. The keywords are chosen to be as diverse as possible to minimize any potential bias in the data gathering process to the extent possible. Then human annotators are used to filter out noisy images. Annotators were instructed to manually eliminate irrelevant or explicit content as well as images that contained private information or names/addresses. In order to balance the dataset, 250 images were randomly chosen for each concept out of the filtered images, and we only consider images with a Creative Commons license. The processing pipeline and quality control is similar to the one used for the creation of Flickr30k Young et al. (2014). Furthermore, the textual part of the dataset contains phrases such as “This is X.” replacing X with a “Muslim person", “Christian person", etc. The same aforementioned keywords were used to retrieve textual data for each concept using the RelatedWords site333relatedwords.org/ followed by a similar data cleaning and noise filtering process.
Table 1 shows the classes MMBias covers as well as the considered groups in each class. MMBias spans over 4 target classes, including religion, national origin, disability, and sexual orientation. In this study, we did not include gender and race, as there is already a large body of work focusing on them.
For religion, our dataset includes the 5 major religions in the world today: Islam, Christianity, Judaism, Buddhism, and Hinduism. As for the national origin, MMBias includes images corresponding to the four nationalities: American (USA), Chinese, Arab444Arab collectively refers to a number of Arab countries (each also having other cultural groups). We hope that more specific nationalities and cultural groups can be added in the future. (collectively), and Mexican. Furthermore, another two additional nationalities, French and Italian, are also included in the textual phrases in addition to the former. As for disability, MMBias contains images for two common forms of disability: physical disability, mental disability as well as people with no disability. In addition to these, the textual data includes phrases corresponding to visual disability and hearing disability as well. Finally, the two most common types of sexual orientations, homosexuality and heterosexuality, are included in MMBias. The selection of subgroups as well as their pairings was a result of consulting several social studies that show present bias against people with disabilities Dovidio et al. (2011), homosexuals Hebl et al. (2002), certain nationalities Park et al. (2007); Buriel and Vasquez (1982) and religions Abid et al. (2021); Rowatt et al. (2005); Rudman and Ashmore (2007). However, we plan to extend our data to a larger pool of classes and respective subgroups in the future.
Finally, in order to conduct intra-visual bias studies, MMBias also contains two sets of images corresponding to visual pleasantness and unpleasantness, called the valence dataset. These sets were constructed by following a similar method to Steed and Caliskan (2021), retrieving images corresponding to pleasant concepts such wealth, peace, babies, love, butterflies, etc. and unpleasant concepts such as death, injury, prison, fear, etc.
Analysis.
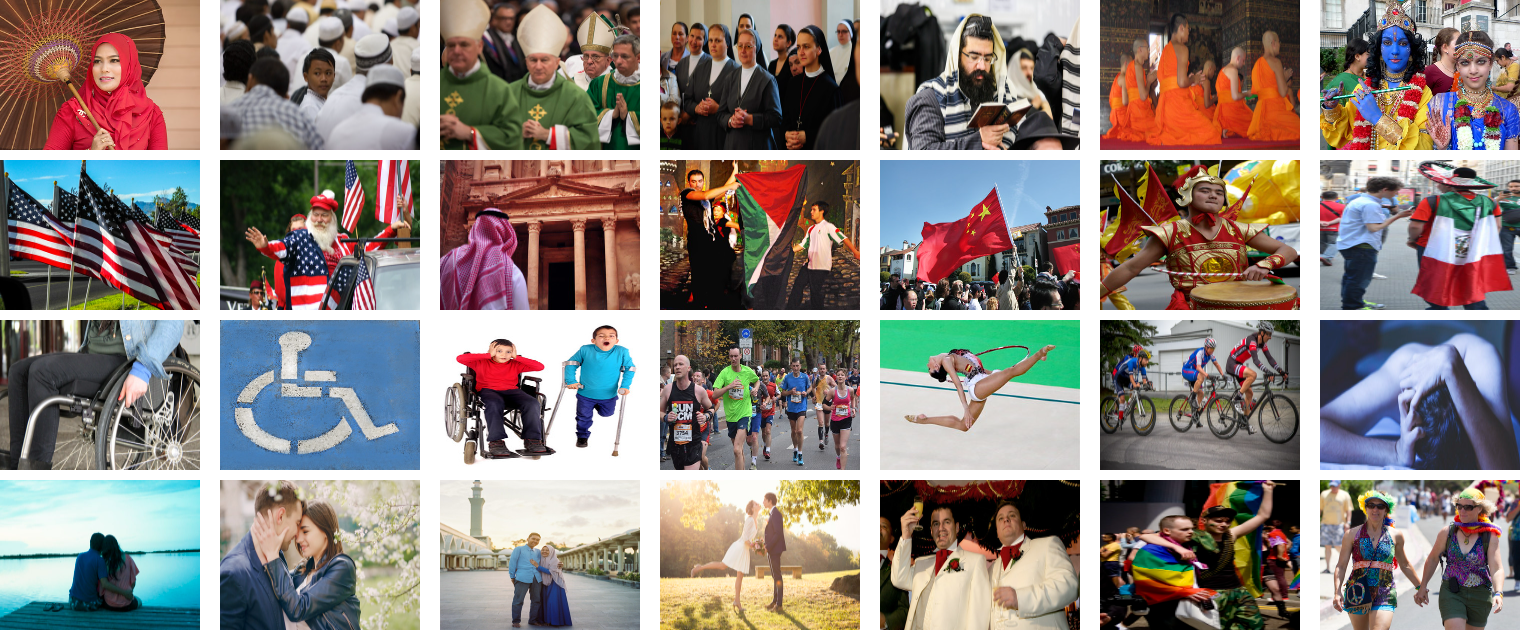
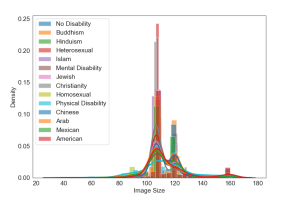
Fig. 2 provides some sample images taken from the dataset. Each row shows a different target class. Fig. 3 provides deeper insights into the sizes of the crawled images. The x-axis reflects the surface area of the image in pixels, scaled by a factor of 1,000. As can be seen, image sizes in most classes follow a normal distribution with a mean of around 110,000 pixels, translating to approximately 340x340 images, with the exception of images corresponding to the nationality class, which have a slightly higher mean of around 350x350. The height and width of images does not vary substantially across the dataset.
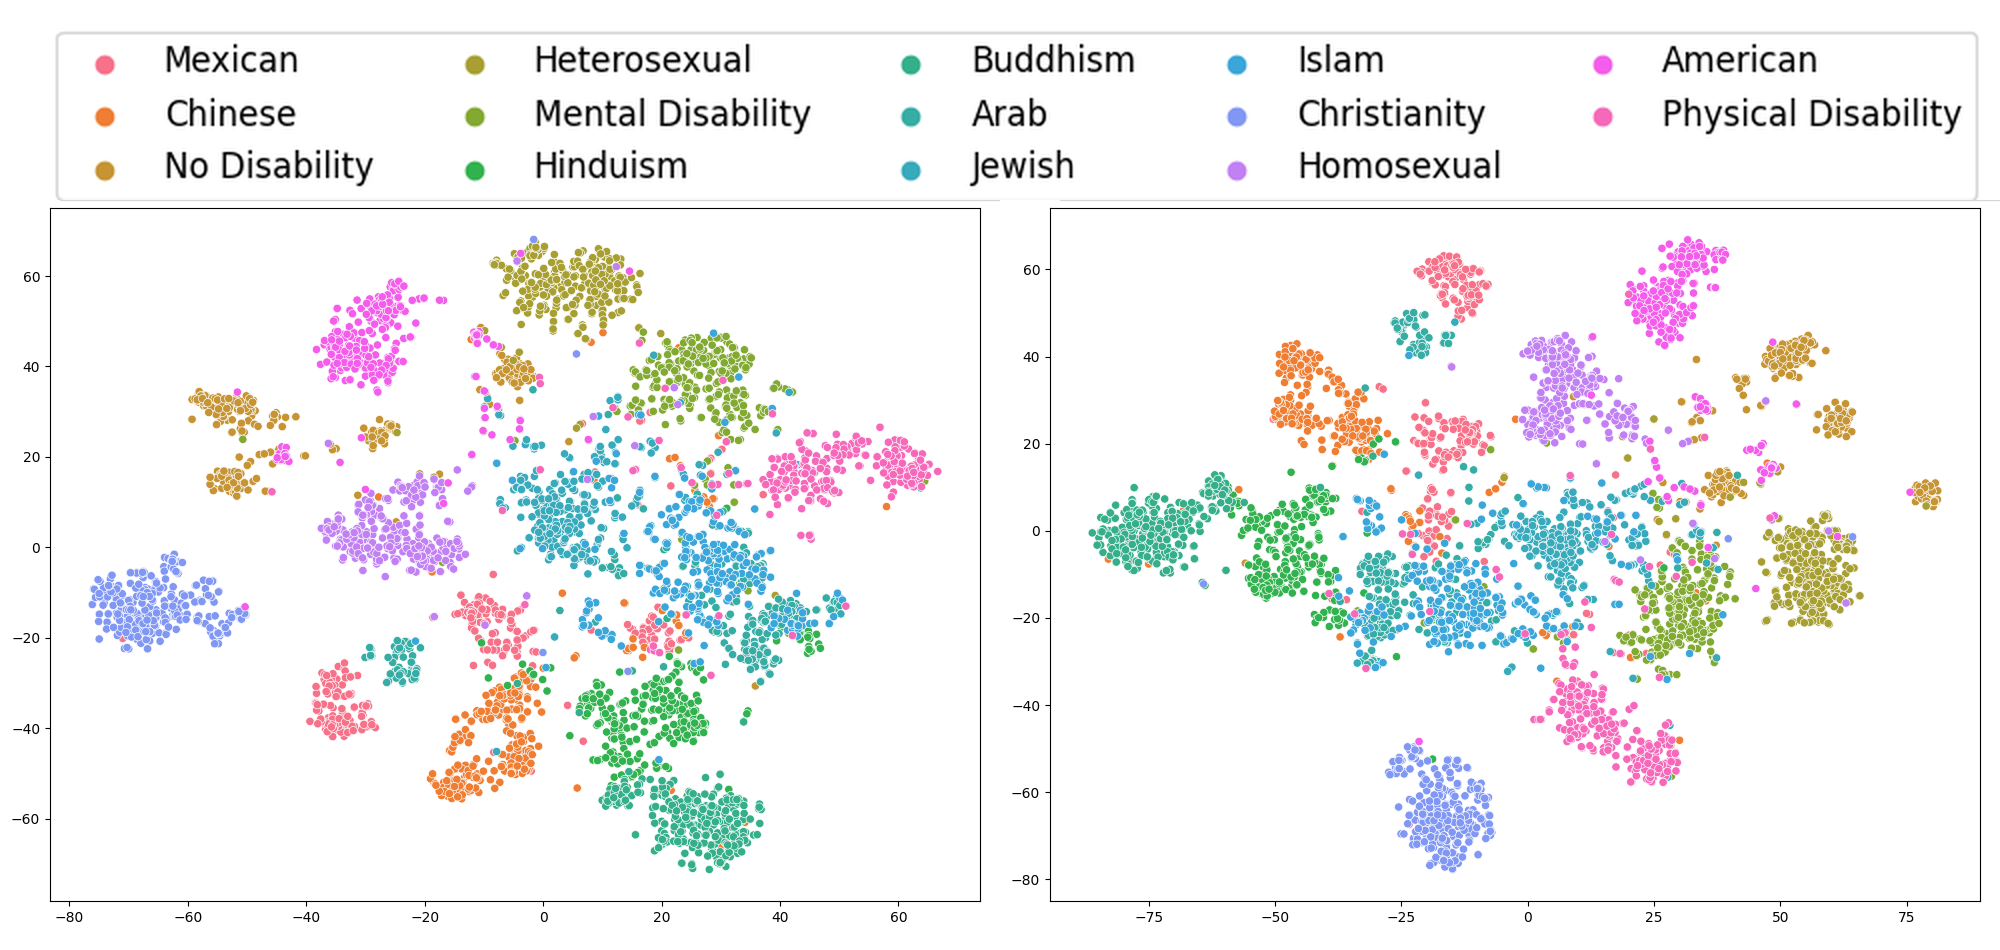
Furthermore, we analyze the separability of our dataset with regards to image classes. The images are fed into the CLIP model and the first 100 principal components are extracted from the resulting embeddings, and then t-SNE is applied. Fig. 4 shows the t-SNE representation of the images. We observe that the dataset can be well-separated forming clearly-defined clusters. For instance, we notice that different religions form well-separated clusters. Interestingly the clusters that are more intertwined correspond to correlated subjects such as the religion Islam and the Arab nationality designation. This is not surprising given Islam is particularly prevalent in Arab countries and thus many of the images share similar features.
5 Experimental Evaluation
We have conducted three sets of experiments to assess and quantify the bias in the aforementioned models: CLIP, ALBEF, and ViLT. The following sections explain the details of each setting.
5.1 OpenAI CLIP
CLIP is a multimodal vision–language embedding model originally devised for zero-shot classification of images. It utilizes a self-supervised contrastive loss to learn a joint embedding space for both images and text. The model is jointly trained on the WebImageText dataset, a set of 400 million paired image–text pairs crawled form the web. Although primarily designed for image classification, CLIP embeddings have been used in numerous other downstream applications, making it a prime candidate for our analysis. The architecture of CLIP has independent visual and textual encoding modules providing explicit access to each modality’s embedding. As a result, it is possible to not only analyze the bias across domains but conduct ablation studies for each module separately as well. We used the “ViT-B/32” model with the official CLIP code. Our experiments are as follows.
5.1.1 Cross-Modal Zero-Shot Classification
CLIP was originally introduced as a means for zero-shot image classification. In this experiment, we measure bias for this task across different modalities. Given a set of target concept images and , and a set of textual attribute phrases and , we use CLIP to perform zero-shot classification of target images to attribute words. For each image group, the top 15 classified words are returned. The attributes are two sets of 60 words conveying positive555ptrckprry.com/course/ssd/data/positive-words.txt or negative666ptrckprry.com/course/ssd/data/negative-words.txt sentiment, many of which were also included in the original IAT studies Bellezza et al. (1986).
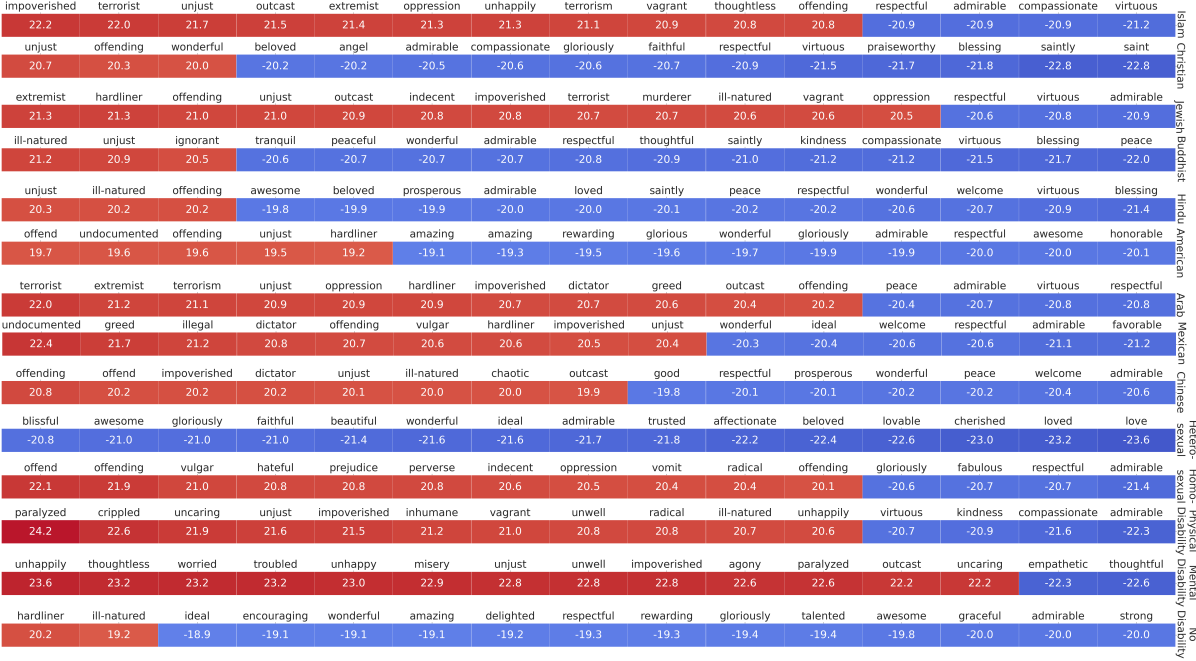
The resulting correlation scores are provided in Fig. 5. Each row shows the top 15 words returned by the model for each of the target classes. Words with positive sentiment are blue-colored while adjectives with negative sentiment are given in red. The number inside each bar as well as the color intensity represent the degree to which the model associates that target class with that word. Fig. 5 shows stereotypical patterns emerging, e.g., the most associated attributes to Islam and Judaism are words related to poverty, terror, and extremism such as: “impoverished”, “vagrant”, ”terrorist“, ”oppression“, “outcast”, “extremist”, etc., which carry a highly negative sentiment.
However, unlike Islam and Judaism, in the case of Buddhism and Christianity, 12 of the 15 top attributes have positive sentiment. The most associated attributes are words resembling peace and happiness such as: “peace”, “blessing”, “compassionate”, “admirable”, etc., carrying a highly positive sentiment. This is aligned with societal stereotypes that certain religions are looked upon less favorably than others. Similar patterns can be observed for other classes such as nationality as well. Certain nationalities such as Americans are viewed as more favorably by the model compared to Arab, Mexican, and Chinese people. Interestingly, biases against the Arab category are very similar to biases against Islam, e.g., both obtaining high scores for “terrorism”, “extremist”, and “impoverished”. This likely stems from the the fact that most Arab countries are predominantly Muslim and the model may have acquired latent correlations among the two. For the target class “Mexican”, the highest-scoring words are “undocumented”, “greed”, and “illegal”, followed by “impoverished”, which reflects the typical right-wing media portrayal of this group in the US. Similarly, Chinese nationals are associated with negative attributes relating to poverty and dictatorship. The next category that exhibits a bias is sexual orientation, where the LGBTQ community is mostly associated with words such as “offending”,“vulgar”, “hateful”, “perverse”, etc. Finally, we can see the large negative sentiment the model exhibits towards people with disabilities.
5.1.2 Cross-Modal Bias Assessment
This experiment quantifies the bias in CLIP using Caliskan cosine similarity metric in Eq. 1. Given a set of target concept images and and a set of textual attribute phrases and , the goal is to measure the effect size, , distance between image target concepts , and textual pleasantness attributes. The results are provided in the first column of Table 2. Positive numbers reflect a negative bias towards the first target , while negative numbers indicate a positive bias towards . The magnitude represents the intensity to which the bias is present in the model with regard to test data. The results in Table 2 are consistent with the results in the zero-shot classification experiment, confirming certain societal stereotypes. For instance, in the case of religion, we have already observed that Islam and Judaism are tied to negative words much more frequently, compared to Christianity and Buddhism. Similarly, here, we observe that bias scores for “Islam vs. Christianity” and “Judaism vs. Christianity” are fairly high as well. In the case of “Islam vs. Judaism”, Islam is viewed more unfavorably, reflecting the surge of Islamophobic tendencies in recent decades. In this regard, the most favorably assessed religions are Christianity and Buddhism. Similar trends can be seen when considering nationality as well. The model shows a negative bias towards Arab, Chinese, and Mexican people compared to Americans. This is again consistent with previous observations in the zero-shot classification experiment. Finally, we find that people with disabilities as well as the LGBTQ community are viewed more negatively.
| Target | Target | CLIP | CLIP | CLIP | ALBEF | ViLT | |
| Cross | Textual | Visual | |||||
| Religion | Muslim | Christian | 1.72 | 1.48 | 1.61 | 0.37 | 0.45 |
| Jewish | Christian | 1.69 | 1.24 | 1.43 | 0.34 | 0.51 | |
| Muslim | Jewish | 0.47 | 0.41 | 0.75 | 0.03 | -0.04 | |
| Muslim | Buddhist | 1.62 | 0.69 | 1.53 | 0.23 | 0.26 | |
| Christian | Buddhist | -0.75 | -0.99 | -0.35 | -0.14 | -0.21 | |
| Hindu | Buddhist | -0.52 | 0.06 | -0.11 | 0.01 | 0.01 | |
| Jewish | Buddhist | 1.61 | 0.31 | 1.28 | 0.20 | 0.30 | |
| Muslim | Hindu | 1.65 | 0.64 | 1.49 | 0.24 | 0.25 | |
| Nationality | Arab | American | 1.28 | 1.79 | 1.56 | 0.11 | -0.03 |
| Arab | French | – | 1.79 | – | – | – | |
| Arab | Italian | – | 1.25 | – | – | – | |
| Mexican | Arab | -0.32 | 0.24 | -0.92 | -0.04 | 0.06 | |
| Chinese | American | 0.89 | 1.30 | 1.20 | 0.03 | -0.07 | |
| Mexican | American | 1.13 | 1.75 | 1.20 | 0.07 | 0.03 | |
| Disability | Visual | Abled | – | 1.25 | – | – | – |
| Hearing | Abled | – | 1.13 | – | – | – | |
| Mental | Abled | 1.48 | 1.04 | 1.05 | 0.37 | 0.13 | |
| Physical | Abled | 1.25 | 1.03 | 1.35 | 0.02 | -0.01 | |
|
LGBTQ |
LGBTQ | Hetero. | 1.67 | 0.93 | 1.46 | 0.07 | 0.10 |
5.1.3 Ablation: Intra-Modal Encoder Bias
Since CLIP provides explicit access to textual and visual embeddings, we can run ablation studies by measuring the bias in each module independently. In order to do so, we measure the effect size using the Caliskan formula for textual data and Image Association test for images, where unlike the cross-modal experiment, both target concepts as well as attributes have the same modality. These experiments can provide insights as to which module is more heavily responsible for the observed bias. Columns 2 and 3 in Table 2 present the findings. For the image modality, we have images with positive and negative valence, analogous to positive and negative-sentiment words. As we can see, the model demonstrates similar bias to the cross-modal case. Similarly, we notice that “Islam” and “Judaism” attract more negative bias in comparison with “Christianity” and “Buddhism”. In some cases the effect size is slightly different, which can be explained by the fact that the number of samples in the case of textual data is smaller, entailing a greater standard deviation, which in turn alters the effect size.
5.2 Fusion-based Models
We next evaluate two fusion-based models. Although these models typically have independent textual and visual encoding modules in their lower layers, their architecture is complemented by a fusion module in higher levels to combine the information in different modalities, enabling them to learn joint embeddings of the visual and textual domains. This has been shown to be essential for more complex tasks such as VQA and NLVR that require more complex reasoning. The first such model we consider is ALBEF. Similar to CLIP, ALBEF Li et al. (2021) first learns separate visual and textual embeddings using Transformer-based image and text encoders coupled with contrastive loss. However, unlike CLIP, ALBEF further combines these embeddings by adopting an attention-based fusion architecture to model more complex interactions between these modalities, and directly aims to address several vision–language objectives, including image–text matching and masked language modeling. This model is pretrained on conceptual captions and SBU captions Sharma et al. (2018); Ordonez et al. (2011). Furthermore, the model is trained using momentum distillation to facilitate learning by adding an auxiliary learning network to stabilize the leaning process.
ViLT Kim et al. (2021) is another recent VLP model that is devised as a more computationally efficient alternative to CLIP and ALBEF. Unlike large and computationally-heavy image and text encoders in CLIP and ALBEF, ViLT utilizes only shallow linear layers to process the sequence of word embeddings and image patches of the text–image input pair. Furthermore, in order to enable the model to solve complex vision–language tasks such as VQA, NLVR, and ITM, a Transformer-based architecture is employed on top to capture the complex dynamics between the modalities. This model is trained using a combination of image–text matching, word patch alignment, and masked language modelling objectives.
With regard to bias assessment, unlike CLIP, fusion-based models do not provide explicit access to separate visual and textual embeddings but rather provide a combined embedding of the pair. As a result, computing the Caliskan distance in Eq. 1 is not possible. However, interestingly one of the objectives these models optimize for is the image–text matching (ITM) objective. ITM is the problem of estimating the probability that a given image–text pair is a match. This task is directly related to our bias evaluation problem. We can argue that a model is fair if the probability of assigning pleasantness scores is similar across different concepts. In other words, the following should hold for the ITM scores:
Columns 4 and 5 in Table 2 include the results for ALBEF and ViLT. The numbers provided are probabilistic differences and are not comparable to the Caliskan scores provided for CLIP. In order to reduce irrelevant noise only the top 15 most significant matches are considered. Again, we see that these models exhibit strong biases favoring Christianity vs. Islam and Judaism, matching Christian images to positive words 45% more than Muslim and 51% more than Judaism. However, in case of nationality, these models show fewer signs of bias. Furthermore, ViLT and ALBEF show less bias towards physical disabilities compared to mental disability.
6 Bias Mitigation Algorithm
Bias mitigation methods typically fall into one of three categories: data augmentation (fair resampling), model adjustment, and embedding post processing algorithms. Each of these alternatives have their own benefits and drawbacks, but a major limitation of the first two is that they require retraining the models. This can be burdensome in many cases. In particular, we often lack access to the dataset, the model’s training procedure, or in the case of large pretrained models, retraining may also be computationally infeasible on typical hardware and cost budgets. Post-processing methods, on the other hand, may be invoked as a fast and efficient plug-and-play method to modify learned embeddings without the need for retraining. Since vision–language tasks are complex, VLP models usually have large architectures to be able to capture all the complex dynamics. However, this can cause them to learn redundant or highly correlated features, since they are not optimally compressed. These features are not only computationally wasteful but can also amplify model bias. Due to the high correlation among some features, we can remove some without affecting performance, while simultaneously reducing bias. In order to identify those features, we directly optimize for the objective in Eq. 1 by removing features in a greedy manner, pruning dimensions that cause the largest decrease in bias effect size. However, we only consider the features that exhibit a small mutual information with respect to classification labels. can be set empirically and this ensures only redundant dimensions are removed. Algorithm 1 details the steps of our technique.
| Bias | Before | After | Reduction |
| Muslim vs Christian | 1.72 | 0.57 | 66% |
| Jewish vs Christian | 1.69 | 0.75 | 55% |
| Muslim vs Buddhist | 1.62 | 0.11 | 93% |
| Jewish vs Buddhist | 1.61 | 0.30 | 82% |
| Muslim vs Hindu | 1.65 | 0.71 | 57% |
| Arab vs American | 1.28 | 0.33 | 74% |
| Mexican vs American | 1.13 | 0.85 | 26% |
| Chinese vs American | 0.89 | 0.56 | 38% |
| Mental Dis. vs No Dis. | 1.48 | 0.49 | 66% |
| LGBTQ vs Heterosexual | 1.67 | 0.92 | 45% |
The results of this debiasing method are presented in Table 3. We removed 54 dimensions (10% of all dimensions), which leads to up to 93% bias reduction in some cases. This however only minimally affects the model’s classification accuracy. We have tested the accuracy of the model on the MMbias dataset as well as the CIFAR-100 dataset. On MMbias, the accuracy dropped by only 1.1% , and on CIFAR100 by only 1.3% from 80.1% to 78.8%. Furthermore, Fig. 4b shows that even after removing the aforementioned dimensions, the embeddings still remain well-separable, confirming the redundancy of some of the embedding features.
Regarding the choice of (number of features removed) in the bias mitigation algorithm, a larger will affect the performance of the model more negatively, as previously observed in other dimensionality reduction algorithm. In order to find a reasonable we can plot the bias reduction as well as performance reduction as a function of . Inspecting this graph allows us to consider the trade-off between greater bias removal and the loss of accuracy, allowing us to choose an that decreases the bias in a meaningful way while not affecting performance significantly.
7 Conclusion
Most bias analysis studies focus on gender and racial biases, which is primarily due to a lack of suitable data to consider further important forms of bias. In this study, we have compiled a new multimodal bias assessment dataset called MMBias enabling the study of bias affecting population groups largely neglected in prior studies. Our dataset consists of around 3,500 images and hundreds of phrases covering over 14 minority subgroups. Furthermore, based on a formulation of the bias-fairness problem, we draw on this data to assess the level of bias in several prominent self-supervised multimodal models, including CLIP, ALBEF, and ViLT. Our results show that these models demonstrate meaningful bias towards certain groups. Finally, we introduce a novel bias mitigation technique designed specifically for large pretrained models that can be applied as a post-processing step to reduce bias, and show that it has negligible effects on classification performance as well as data separability. Our data and code is available at github.com/sepehrjng92/MMBias.
Limitations
This work seeks to make a contribution towards vision–language models that exhibit less biased behavior. To this end, we provide a large new dataset, new experimental results, and also investigate a bias mitigation method for pre-trained vision–language models. Yet, bias measurement data as well are prone to biases, most notably in the selection of classes and groups, but also with regard to the particular data instances. We envision that MMBias will grow to encompass further groups and additional data in the future, e.g., further ethnic minorities, sexual identities, and gender identities. We also hope that our dataset can serve as a starting point for research on additional natural languages.
Clearly, our bias mitigation algorithm can only mitigate certain fairly overt expressions of bias in vision–language models. Large pre-trained models have millions of parameters that affect the model behavior. As vision–language models necessarily need to rate ties between images and text, they will continue to prefer or disprefer certain associations, leading to remnant biases. Still, we hope that our work will enable the community to pay closer attention to these challenges and work towards models that behave in more equitable ways.
Ethics Statement
With our work, we wish to encourage further analysis of bias in machine learning models. To this end, we provide data that enables an assessment of a number of potential manifestations of bias. We acknowledge that the images harbor a multitude of different stereotypes that cannot be taken to be representative of the various groups. Moreover, we acknowledge that the pairings of classes of people adopted thus far in our work leaves out other groups of people, e.g., further forms of faith and belief, and also further pairings. We view our work as a step towards a more inclusive bias assessment resource that should keep growing in the future.
References
- Abid et al. (2021) Abubakar Abid, Maheen Farooqi, and James Zou. 2021. Large language models associate muslims with violence. Nature Machine Intelligence, 3(6):461–463.
- Agarwal et al. (2021) Sandhini Agarwal, Gretchen Krueger, Jack Clark, Alec Radford, Jong Wook Kim, and Miles Brundage. 2021. Evaluating clip: towards characterization of broader capabilities and downstream implications. arXiv preprint arXiv:2108.02818.
- Bellezza et al. (1986) Francis S Bellezza, Anthony G Greenwald, and Mahzarin R Banaji. 1986. Words high and low in pleasantness as rated by male and female college students. Behavior Research Methods, Instruments, & Computers, 18:299–303.
- Bhargava and Forsyth (2019) Shruti Bhargava and David Forsyth. 2019. Exposing and correcting the gender bias in image captioning datasets and models. arXiv preprint arXiv:1912.00578.
- Bordia and Bowman (2019) Shikha Bordia and Samuel R Bowman. 2019. Identifying and reducing gender bias in word-level language models. arXiv preprint arXiv:1904.03035.
- Buriel and Vasquez (1982) Raymond Buriel and Richard Vasquez. 1982. Stereotypes of mexican descent persons: Attitudes of three generations of mexican americans and anglo-american adolescents. Journal of Cross-Cultural Psychology, 13(1):59–70.
- Caliskan et al. (2017) Aylin Caliskan, Joanna J Bryson, and Arvind Narayanan. 2017. Semantics derived automatically from language corpora contain human-like biases. Science, 356(6334):183–186.
- Dovidio et al. (2011) John F Dovidio, Lisa Pagotto, and Michelle R Hebl. 2011. Implicit attitudes and discrimination against people with physical disabilities. Disability and aging discrimination: Perspectives in law and psychology, pages 157–183.
- Eslami et al. (2021) Sedigheh Eslami, Gerard de Melo, and Christoph Meinel. 2021. Does CLIP benefit visual question answering in the medical domain as much as it does in the general domain? CoRR, abs/2112.13906.
- Garrido-Muñoz et al. (2021) Ismael Garrido-Muñoz, Arturo Montejo-Ráez, Fernando Martínez-Santiago, and L Alfonso Ureña-López. 2021. A survey on bias in deep nlp. Applied Sciences, 11(7):3184.
- Greenwald and Banaji (1995) Anthony G Greenwald and Mahzarin R Banaji. 1995. Implicit social cognition: attitudes, self-esteem, and stereotypes. Psychological review, 102(1):4.
- Greenwald et al. (1998) Anthony G Greenwald, Debbie E McGhee, and Jordan LK Schwartz. 1998. Measuring individual differences in implicit cognition: the implicit association test. Journal of personality and social psychology, 74(6):1464.
- Guo and Caliskan (2021) Wei Guo and Aylin Caliskan. 2021. Detecting emergent intersectional biases: Contextualized word embeddings contain a distribution of human-like biases. In Proceedings of the 2021 AAAI/ACM Conference on AI, Ethics, and Society, pages 122–133.
- Hebl et al. (2002) Michelle R Hebl, Jessica Bigazzi Foster, Laura M Mannix, and John F Dovidio. 2002. Formal and interpersonal discrimination: A field study of bias toward homosexual applicants. Personality and social psychology bulletin, 28(6):815–825.
- Hutchinson et al. (2020) Ben Hutchinson, Vinodkumar Prabhakaran, Emily Denton, Kellie Webster, Yu Zhong, and Stephen Denuyl. 2020. Social biases in nlp models as barriers for persons with disabilities. arXiv preprint arXiv:2005.00813.
- Kiefer and Sekaquaptewa (2007) Amy K Kiefer and Denise Sekaquaptewa. 2007. Implicit stereotypes and women’s math performance: How implicit gender-math stereotypes influence women’s susceptibility to stereotype threat. Journal of experimental social psychology, 43(5):825–832.
- Kim et al. (2021) Wonjae Kim, Bokyung Son, and Ildoo Kim. 2021. Vilt: Vision-and-language transformer without convolution or region supervision. In International Conference on Machine Learning, pages 5583–5594. PMLR.
- Li et al. (2021) Junnan Li, Ramprasaath Selvaraju, Akhilesh Gotmare, Shafiq Joty, Caiming Xiong, and Steven Chu Hong Hoi. 2021. Align before fuse: Vision and language representation learning with momentum distillation. Advances in neural information processing systems, 34:9694–9705.
- Li et al. (2019) Liunian Harold Li, Mark Yatskar, Da Yin, Cho-Jui Hsieh, and Kai-Wei Chang. 2019. Visualbert: A simple and performant baseline for vision and language. arXiv preprint arXiv:1908.03557.
- Lu et al. (2019) Jiasen Lu, Dhruv Batra, Devi Parikh, and Stefan Lee. 2019. Vilbert: Pretraining task-agnostic visiolinguistic representations for vision-and-language tasks. Advances in neural information processing systems, 32.
- Manzini et al. (2019) Thomas Manzini, Yao Chong Lim, Yulia Tsvetkov, and Alan W Black. 2019. Black is to criminal as caucasian is to police: Detecting and removing multiclass bias in word embeddings. arXiv preprint arXiv:1904.04047.
- Mohammad (2016) Saif M Mohammad. 2016. Sentiment analysis: Detecting valence, emotions, and other affectual states from text. In Emotion measurement, pages 201–237. Elsevier.
- Nadeem et al. (2020) Moin Nadeem, Anna Bethke, and Siva Reddy. 2020. Stereoset: Measuring stereotypical bias in pretrained language models. arXiv preprint arXiv:2004.09456.
- Ordonez et al. (2011) Vicente Ordonez, Girish Kulkarni, and Tamara L. Berg. 2011. Im2text: Describing images using 1 million captioned photographs. In Neural Information Processing Systems (NIPS).
- Park et al. (2007) Jaihyun Park, Karla Felix, and Grace Lee. 2007. Implicit attitudes toward arab-muslims and the moderating effects of social information. Basic and Applied Social Psychology, 29(1):35–45.
- Radford et al. (2021) Alec Radford, Jong Wook Kim, Chris Hallacy, Aditya Ramesh, Gabriel Goh, Sandhini Agarwal, Girish Sastry, Amanda Askell, Pamela Mishkin, Jack Clark, et al. 2021. Learning transferable visual models from natural language supervision. In International Conference on Machine Learning, pages 8748–8763. PMLR.
- Ross et al. (2020) Candace Ross, Boris Katz, and Andrei Barbu. 2020. Measuring social biases in grounded vision and language embeddings. arXiv preprint arXiv:2002.08911.
- Rowatt et al. (2005) Wade C Rowatt, Lewis M Franklin, and Marla Cotton. 2005. Patterns and personality correlates of implicit and explicit attitudes toward christians and muslims. Journal for the scientific study of religion, 44(1):29–43.
- Rudman and Ashmore (2007) Laurie A Rudman and Richard D Ashmore. 2007. Discrimination and the implicit association test. Group Processes & Intergroup Relations, 10(3):359–372.
- Russell (2003) James A Russell. 2003. Core affect and the psychological construction of emotion. Psychological review, 110(1):145.
- Sharma et al. (2018) Piyush Sharma, Nan Ding, Sebastian Goodman, and Radu Soricut. 2018. Conceptual captions: A cleaned, hypernymed, image alt-text dataset for automatic image captioning. In Proceedings of ACL.
- Sirotkin et al. (2022) Kirill Sirotkin, Pablo Carballeira, and Marcos Escudero-Viñolo. 2022. A study on the distribution of social biases in self-supervised learning visual models. In Proceedings of the IEEE/CVF Conference on Computer Vision and Pattern Recognition, pages 10442–10451.
- Srinivasan and Bisk (2021) Tejas Srinivasan and Yonatan Bisk. 2021. Worst of both worlds: Biases compound in pre-trained vision-and-language models. arXiv preprint arXiv:2104.08666.
- Steed and Caliskan (2021) Ryan Steed and Aylin Caliskan. 2021. Image representations learned with unsupervised pre-training contain human-like biases. In Proceedings of the 2021 ACM Conference on Fairness, Accountability, and Transparency, pages 701–713.
- Tan and Bansal (2019) Hao Tan and Mohit Bansal. 2019. Lxmert: Learning cross-modality encoder representations from transformers. arXiv preprint arXiv:1908.07490.
- Wang et al. (2021a) Jialu Wang, Yang Liu, and Xin Eric Wang. 2021a. Are gender-neutral queries really gender-neutral? mitigating gender bias in image search. arXiv preprint arXiv:2109.05433.
- Wang et al. (2021b) Jialu Wang, Yang Liu, and Xin Eric Wang. 2021b. Assessing multilingual fairness in pre-trained multimodal representations. arXiv preprint arXiv:2106.06683.
- Wang et al. (2019) Tianlu Wang, Jieyu Zhao, Mark Yatskar, Kai-Wei Chang, and Vicente Ordonez. 2019. Balanced datasets are not enough: Estimating and mitigating gender bias in deep image representations. In Proceedings of the IEEE/CVF International Conference on Computer Vision, pages 5310–5319.
- Young et al. (2014) Peter Young, Alice Lai, Micah Hodosh, and Julia Hockenmaier. 2014. From image descriptions to visual denotations: New similarity metrics for semantic inference over event descriptions. Transactions of the Association for Computational Linguistics, 2:67–78.
- Zhou et al. (2022) Kankan Zhou, Yibin LAI, and Jing Jiang. 2022. Vlstereoset: A study of stereotypical bias in pre-trained vision-language models. Association for Computational Linguistics.