Anharmonicity of the antiferrodistortive soft mode in barium zirconate \ceBaZrO3
Abstract
Barium zirconate (BaZrO3) is one of the very few perovskites that is claimed to retain an average cubic structure down to , while being energetically very close to an antiferrodistortive phase obtained by condensation of a soft phonon mode at the R point of the Brillouin zone boundary. In this work, we report a combined experimental and theoretical study of the temperature dependence of this soft phonon mode. Inelastic neutron and x-ray scattering measurements on single crystals show that it softens substantially from at room temperature to at . In contrast, the acoustic mode at the same R point is nearly temperature independent. The effect of the anharmonicity on the lattice dynamics is investigated non-perturbatively using direct dynamic simulations as well as a first-principles based self-consistent phonon theory, including quantum fluctuations of the atomic motion. By adding cubic and quartic anharmonic force constants, quantitative agreement with the neutron data for the temperature dependence of the antiferrodistortive mode is obtained. The quantum fluctuations of the atomic motion are found to be important to obtain the proper temperature dependence at low temperatures. The mean squared displacements of the different atoms are determined as function of temperature and are shown to be consistent with available experimental data. Adding anharmonicity to the computed fluctuations of the Ba-O distances also improves the comparison with available EXAFS data at .
I Introduction
Perovskite oxides constitute a prominent class of materials with a wide range of different properties such as ferroelectricity, colossal magnetoresistance, electronic and/or ionic conductivity, piezoelectricity, superconductivity, metal-insulator transition, luminescence, and much more [1]. The ideal perovskite structure is cubic, with the general chemical formula ABO3, where the A and B sites can accommodate a wide variety of elements from the periodic table. Many perovskites are cubic at high temperatures but upon cooling most undergo one or several structural phase transitions, which depend sensitively on the choice of A and B [2, 3]. This variety of compositions and structural phases yields the wide range of properties observed in these materials. The two most important structural distortions are the off-centering of the B-site cation, giving rise to ferroelectricity, and the tilts or rotations of the BO6 octahedra [4]. The former is detectable as an instability at the point in the Brillouin zone, while the latter are related to instabilities at the R and/or M points of the Brillouin zone boundary. To understand, predict and control these structural distortions is a key issue in the research on perovskite oxides.
Barium zirconate BaZrO3 (BZO) is a simple perovskite that has attracted considerable interest due to its excellent thermal stability, high melting temperature, low thermal expansion coefficient, low dielectric loss, and low thermal conductivity [5]. These properties make BZO highly attractive for a range of technological applications such as wireless communication [6], thermal barrier coatings for gas turbines [7], protonic fuel cell applications [8] and ceramic reactors [9], as well as substrates in thin film deposition [10].
Barium zirconate (BZO) is also one of the very few perovskites that is claimed to remain cubic down to 0 K, but its tendency towards an antiferrodistortive instability has fueled a lot of studies and debates about its ground state, its average structure, and the possibility for local disorder. Several first-principles calculations, based on the density functional theory (DFT), predict the cubic structure to be unstable at , due to a soft phonon mode at the R point of the Brillouin zone corresponding to antiphase tilts of sequential oxygen octahedra, i.e. an antiferrodistortive mode [11, 12, 13, 14, 15, 16]. However, the DFT results are sensitive to the exchange-correlation functional [17] and by using hybrid functionals a stable cubic structure is obtained at [18, 17]. It has been suggested that, in cases where the instability, as observed in the DFT calculations, is weak, quantum fluctuations may suppress the phase transition in BZO and the material therefore stays cubic all the way down to [11, 13, 15]. Experimentally, both X-ray and neutron diffraction data on a powder sample, suggest a cubic structure down to T = 2 K [13], which is further supported by Raman spectroscopy on a single crystal [19]. On the other hand, a recent study combining electron diffraction with total neutron scattering measured on ceramic samples claimed that the material underwent a structural change below 80 K associated with the onset of correlated tilts of ZrO6 octahedra [20].
Clearly, direct measurements and theoretical modeling of the tilt mode frequency and its temperature dependence are essential for a good understanding of BZO. Experimentally, direct lattice dynamical studies have been limited by the scarcity of suitable large and high-quality single crystals, as their synthesis is made difficult by the very high melting point of BZO. As a result, the only experimental study of the temperature dependence of the R-tilt mode of BZO has been attempted on a polycrystalline sample [17]; it concluded that the tilt mode lies at 5.9 meV at low temperatures and does not exhibit any significant temperature dependence between 5 and . Recently high-quality BZO single crystals have been synthesized using the floating zone technique [21]. Here we take advantage of those single crystals to investigate directly the low-frequency lattice dynamics.
Quantitative theoretical modelling of the temperature dependence of the low frequency vibrational motion of BZO is challenging. In recent years several methods have been developed to treat vibrational anharmonicities for solids, such as the self-consistent ab-initio lattice dynamics (SCAILD) technique [22], the temperature dependent effective potential (TDEP) method [23], and the stochastic self-consistent harmonic approximation (SSCHA) [24]. Methods based on the self-consistent phonon approach [25] have also been developed by Tadano et al. [26], which implements the Green’s function technique to derive the anharmonic contributions. Recently, this latter technique was used to study anharmonicity-induced phonon hardening and thermal transport in BZO in the temperature range - [27].
Here, a force constant potential (FCP), expanded up to fourth order, is derived based on training structures from density functional theory (DFT) calculations and by making use of regression techniques [28]. The FCP takes anharmonicity into account and it is used in molecular dynamics (MD) simulations [29, 30] to capture the full dynamical structure factor and its temperature dependence [31]. A self-consistent phonon (SCP) approach is then implemented [28] to, in addition to anharmonicity, also include the quantum fluctuations of the atomic motion, known to be significant at low temperatures [13].
The paper is organized as follows. In Sec. II the theoretical methods used to treat the anharmonic lattice vibrations are introduced, including the effect of the quantum fluctuations of the atomic motions at low temperatures. Sec. III presents the experimental data obtained by inelastic neutron and x-ray scattering that reveal the strong softening of the tilt mode and the comparatively temperature independent behaviour of the acoustic mode. In Sec. IV, the theoretical results are presented and compared with our experimental data. The strong temperature dependence of the soft tilt mode is found to be in quantitative agreement with our theoretical predictions and the obtained essentially temperature independent acoustic mode also agree with the theoretical predictions. In Sec. V it is shown that our theoretical results for the atomic displacements agree favourably with available experimental data for the mean squared displacements as well as with the more local information obtained in extended X-ray absorption fine structure (EXAFS) spectroscopy. Finally, Sec. VI discusses our present theoretical results and put them into a broader context and Sec. VII summarizes our main conclusions.
II Theoretical methods
II.1 Density functional theory
The potential energy surface (PES) for the R-tilt mode depends quite sensitively on the exchange–correlation functional [17]. The local density approximation (LDA), two generalized gradient approximations (PBE [34] and PBEsol [35] ) as well as a functional including non-local correlation effects (CX [36, 37]) all give a double minimum PES for the R-tilt mode coordinate using the experimental value for the lattice constant. Using the corresponding theoretical lattice constants, LDA gives deeper potential minima, while for PBE the double minimum feature disappears. Two hybrid functionals (HSE [38, 39] and CX0p [40]) show in general better agreement for the various vibrational frequencies and both show an anharmonic PES for the R-tilt mode, quite similar to PBE at its theoretical lattice constant. The computational cost for the hybrid functionals is substantial compared with generalized gradient approximations and as a compromise between accuracy and computational cost we have therefore chosen to base this study on PBE using its theoretical lattice constant. For comparison, PBEsol has also been used, and the corresponding results are presented in Sect. VI.
The included projector-augmented wave (PAW) [41, 42] potentials are used with energy cut-off . The considered valence configurations for Ba, Zr and O are , and respectively. The Brillouin zone of the primitive cell is sampled with an 8x8x8 Monkhorst-Pack -point mesh and scaled accordingly for larger cells. The obtained lattice constants for PBE and PBEsol are = and = , respectively.
The non-analytic part of the dynamical matrix, which is due to the long-range dipole-dipole interaction [43, 44], is evaluated and applied in calculating the phonon dispersion relations using phonopy [45]. The values for the dielectric tensor, , and Born effective charges, , are computed to be , , , and and for the two different displacement directions of the oxygen ion.
II.2 Force constant potential
The force constant potential is based on an expansion of the potential energy in terms of atomic displacements from their equilibrium positions, . We consider an expansion up to fourth order
| (1) | ||||
where the s are referred to as force constants (FCs). Latin indices run over atomic labels, Greek over Cartesian coordinates and Einstein summation applies.
First, an initial phonon calculation is carried out for a 3x3x3 supercell (135 atoms) using DFT. These phonons are used to construct a set of training structures with displacements generated via populating the normal modes with different temperatures. These structures are used to construct an initial fourth order force constant potential (FCP) using hiphive [28].
Next, the size of the system is increased to a 4x4x4 supercell (320 atoms). The initial fourth order FC model is used to run molecular dynamics (MD) simulations carried out at 10, 150, 300 and . Snapshots from these simulations together with some small amplitude structures along the R-tilt mode are used as training structures for the final model. For the final model, we considered two and three body interactions up to, and including the fourth order. We used a maximum interaction length of for the harmonic force constants. Whereas, for the anharmonic interactions, that is, the third and fourth order interaction, we set a maximum interaction length for the force constants to . The training was carried out using the recursive feature elimination method [46]. We denote this final model as the force constant potential (FCP) model. The accuracy of the FCP is evaluated using cross-validation (CV), and an average root-mean-square error (RMSE) of is obtained over the validation set. For the CV-plot, see Fig. S1 in Supplemental Material [47].
II.3 Harmonic phonon model
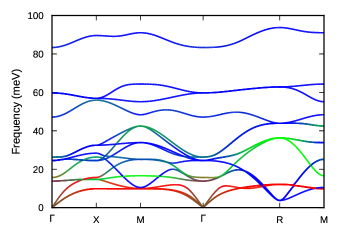
By truncating the FCP model at the second order term an harmonic approximation is obtained. We will denote this, the harmonic phonon (HP) model. Within the harmonic approximation eigenfrequencies and eigenvectors can be derived [45]. Here, is the wavevector and the band index. In Fig. 1 we show the phonon dispersion for BZO using the HP model and where the correction due to the long-range dipole-dipole interaction [43, 44] has been applied. At the R-point the lowest branch at corresponds to antiphase tilts of sequential ZrO6 octahedra. This will here be denoted the R-tilt mode. The second lowest branch located at at the R point, is the acoustic branch due to barium displacements, here denoted the R-acoustic mode.
The phonon dispersions in Fig. 1 are similar to what is obtained from the standard small displacement method (for a comparison, see Fig. S2 in Supplemental Material [47]). However, the R-tilt mode frequency is sensitive to the theoretical treatment due to anharmonicity. Here, we have developed a harmonic model based on displacements from MD simulations carried out at 10, 150, 300 and . The obtained R-tilt mode frequency is , slightly larger than , obtained using the standard small displacement method with the default displacement 0.01 (see Fig. S2 in Supplemental Material [47]).
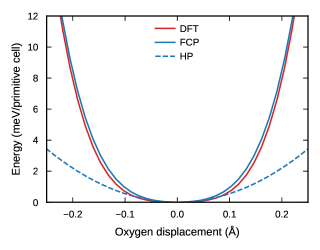
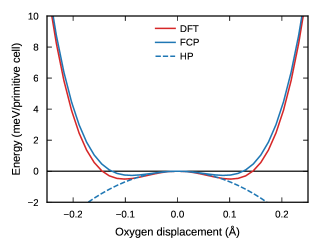
The PES along the R-tilt mode is shown in Fig. 2. The FCP model agrees very well with the DFT data. In contrast, the HP approximation deviates markedly from the DFT data, demonstrating that the R-tilt mode is strongly anharmonic.
Within the harmonic approximation the temperature dependent atomic displacement of atom in direction , , is given by a Gaussian distribution with mean value zero and variance
| (2) |
Here, denotes a thermal average, is the mass of atom , and the number of -values in the summation.
II.4 Self-consistent phonon model
In the self-consistent phonon (SCP) model, a temperature dependent effective harmonic model is constructed. We start with the harmonic model. Displacements are generated in a supercell using the Box-Muller method according to
| (3) |
where the index enumerates the points commensurate with the supercell, and and are uniform random numbers on [0,1]. The temperature dependent amplitude is given by the standard deviation of the displacements (cf. Eq. (2))
| (4) |
Using Eq. (3) a set of displacements is generated at a chosen temperature and the corresponding forces are calculated using the FCP. We generate M such reference structures. The generated displacements and forces are encoded in the fit matrix and the force vector , respectively. An effective harmonic model is obtained by solving the minimization problem
| (5) |
where are the free parameters of effective harmonic model. The procedure is iterated until convergence
| (6) |
where is a set of displacements generated with the :th effective harmonic model () and is a suitable chosen parameter to obtain efficient numerical convergence [28]. A self-consistent effective harmonic model at temperature is then obtained.
The above procedure is repeated at different temperatures and temperature dependent eigenfrequencies and eigenvectors are obtained.
III Experimental methods and results
III.1 Experimental details
BaZrO3 single crystals were grown by the optical floating zone technique as described in Ref. [21]. A single crystal was extracted from the boule for inelastic neutron scattering (INS) measurements with irregular shape and some natural facets suitable for sample orientation, with a total mass of approximately and a size of a few millimetres. The sample for inelastic x-ray scattering (IXS) was cut from another smaller piece and thinned down to a lamella of approximately in thickness.
INS spectra were measured on the IN8 high-flux thermal neutron triple-axis spectrometer [48] at Institut Laue Langevin (ILL) [49]. The initial and final neutron energies were selected using a doubly focused Cu (200) monochromator and analyzer, which resulted in an energy resolution of as measured at the elastic peak. A pyrolytic graphite filter was placed in front of the analyzer to suppress higher-order neutrons. Measurements were performed at a fixed scattered wave vector . Due to the reduced size of the crystal, no collimation could be installed without excessive loss in intensity. A preliminary test experiment was also previously carried out on the triple-axis spectrometer IN22 at the ILL with similar but more limited results [50].
III.2 R-point data from INS
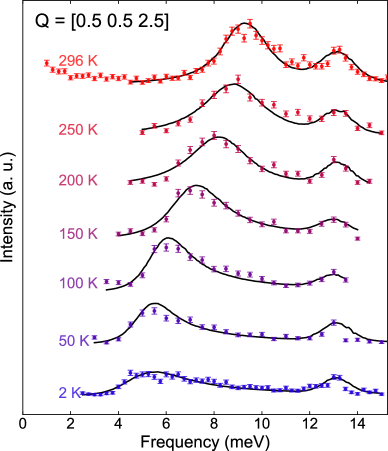
Phonon spectra at the R-point (0.5 0.5 2.5) were measured by INS at different temperatures and the results are presented in Fig. 3. The spectra display two peaks at every temperature between to . The low-frequency peak shows a clear softening accompanied by an increase of the asymmetry of the peak, while the higher-frequency peak is essentially temperature independent in the considered temperature interval.
By comparing with DFT calculations and the calculated phonon dispersions in Fig. 1 the low-frequency peak can be attributed to the antiphase oxygen tilt oscillations, the R-tilt mode, while the higher-frequency peak corresponds to the acoustic branch and is connected to barium displacements, the R-acoustic mode. We also checked that the R-tilt mode vanishes at the R point (1.5 1.5 1.5) while the R-acoustic mode is still present, which is consistent with the neutron selection rules expected for modes of et symmetry, respectively [49].
INS spectra of BaZrO3 are proportional to the neutron coherent cross-section: , where is the nuclear scattering length, (respectively ) the wave vector of the incident (respectively scattered) neutron beam and the neutron scattering function. For oxygen and barium, the coherent scattering lengths are quite similar ( fm and fm) while zirconium has a higher one ( fm) [53]. Hence, for given and and with the proper selection rules, neutron intensity should be of the same order of magnitude for the oxygen-dependent R-tilt and the barium-dependent R-acoustic modes.
Besides the pronounced softening, the R-tilt mode shows a strong asymmetric shape. We assume that this is due to the strong dispersion of the phonon branch close to the R-point. The increase of the phonon frequency away from the R-point implies that the measured peak may obtain an asymmetric shape towards higher frequencies. Anharmonicity also contributes to the broadening of the R-tilt mode but that broadening is more symmetric in frequency and increases with temperature (cf. Fig. 6). Nanodomains, proposed in Ref [20], could arguably affect the mode damping and the spectrum in general, although in the present state, our data do not really provide evidence for or against the presence of these domains.
The neutron scattering data were then fitted with a sum of damped harmonic oscillators using the Takin [54, 55, 56] software, taking into account the instrumental resolution (see Fig. S4 in Supplemental Material [47]). In order to account for the asymmetric shape of the R-tilt mode, a first fitting was attempted by assuming a parabolic dispersion. This however did not allow us to obtain a satisfactory fit. We therefore introduced a more ad hoc mathematical asymmetry to the lineshape. This allows us to extract values for the mode energy, but does not allow to deconvolute fully the spectrum and get access to the intrinsic widths. With this data treatment, we observe a softening of the R-tilt mode from at to at . The R-acoustic mode stays essentially constant around an average value of .
The strong temperature dependence of the R-tilt mode contrasts with the inelastic scattering data previously reported by Perrichon et al. [17] on a powder sample. At low temperatures, , they obtained the frequency , in very good agreement with our result. However, essentially no temperature dependence could be seen in the interval from to . The present single crystal study allows us to observe and quantify the temperature dependence more accurately.
III.3 R-point data from IXS
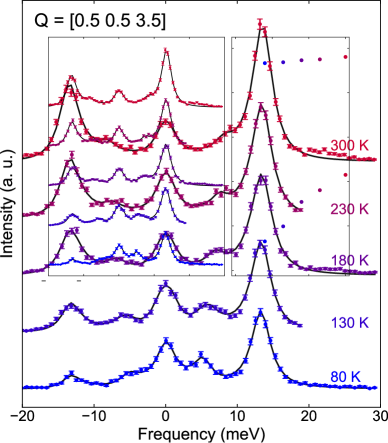
The phonon spectra at the R-point were also measured by IXS at different temperatures and the result is presented in Fig. 4. At each temperature between to the spectrum displays a central quasi-elastic peak and two peaks respectively linked to the R-tilt mode and the R-acoustic mode, which can be both seen at positive and negative frequencies, due to Stokes and anti-Stokes scattering processes. Here, in contrast to the INS measurement, the R-tilt mode involving oxygen motion appears much weaker than the acoustic mode that is dominated by barium displacements. The IXS spectra were fitted by the sum of two damped harmonic oscillators and a Lorentzian for the pseudo-elastic contribution. The R-tilt mode frequencies softens from at to at . The R-acoustic mode stays essentially constant around an average value . The widths of the modes are in all cases resolution limited and do not show any physically insightful trend.
III.4 Dispersion data from INS and IXS
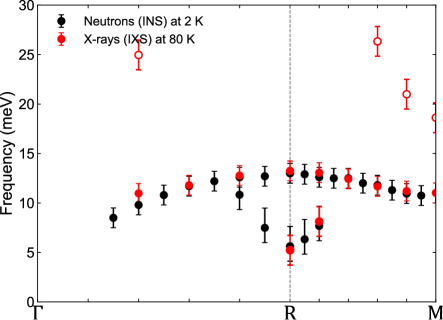
To reconstruct phonon dispersions, we have also measured spectra away from the R-point, in the directions R(0.5 0.5 2.5)–M(0.5 0.5 2) and R(0.5 0.5 2.5)–(1 1 2) at for INS. For IXS, we measured in the directions R(0.5 0.5 3.5)–M(0.5 0.5 4) and R(0.5 0.5 3.5)–(1 1 4) at . When both R-tilt and R-acoustic modes were resolved, INS spectra were fitted as previously. However, further from R, it becomes very difficult to resolve two peaks as the R-tilt mode broadens and crosses the R-acoustic mode. Then, spectra were fitted by a single-damped harmonic oscillator to extract the frequency of the R-acoustic mode. For the IXS experiments, spectra were fitted as previously by a sum of damped harmonic oscillators for the R-tilt mode and R-acoustic mode, and by a Lorentzian lineshape for the pseudo-elastic peak centered around . In some spectra, higher frequencies features appear above and up to the edge of the frequency range ( ). When these features are present, they have been fitted by additional damped harmonic oscillators.
Frequencies extracted from the fits of INS and IXS spectra are represented in Fig. 5. The spectra and their fits are given in Figs S5 and S6 in Supplemental Material [47]. We can first observe that the frequency of the R-acoustic mode is very consistent between the INS and IXS measurements, the difference in temperature for the two measurements being here negligible. The R-acoustic mode reaches its maximum frequency of around at the R-point. This frequency then decreases towards and tends towards a value of around at the M-point.
The R-point soft-mode is at its lowest energy at R (in INS , in IXS ) and rises quickly in energy as we probe further from R. While the spectra are particularly unambiguous at the R point itself, the picture becomes much less clear as we move away from the zone boundary. Along the R-M direction, we observe a single branch attributed to oxygen, whereas phonon band calculations and symmetry considerations predict a splitting into two oxygen branches, see Fig. 1. The tilt modes at M also could not be identified with certainty. This is because the lowest tilt mode at M (with M symmetry) as well as the branch (T4) connecting that mode to the tilt mode at R are indeed forbidden by symmetry for our measurement configuration with from (0.5 0.5 2.5) to (0.5 0.5 2.0). Further experiments in a less symmetric configuration assisted with accurate calculations of scattering cross sections will be needed to clarify the modes at M and the dispersion along the R-M direction.
In addition, in the IXS data we observe extra modes at higher frequencies (above , shown in open symbols on Fig. 5) both in the middle of the R- direction and in the R-M direction. The energies of the modes on the R-M direction agree very well with the Zr-dominated (green) phonon branch seen in Fig. 1, and the high intensity of the IXS peaks also points to a mode involving a heavy atom. The mode along on the other hand is much weaker (see Fig. S6 in Supplemental Material [47]) and difficult to assign conclusively. This mode might be of spurious origin and further studies will be necessary to clarify its assignment. This is inconsequential for our low-frequency study of the R-tilt mode and acoustic mode.
IV Theoretical results and comparison
IV.1 Dynamical structure factor
The FCP potential can be used to perform MD simulations. The full anharmonicity in Eq. (1) is taken into account but the motion is restricted to classical dynamics.
We consider an 8x8x8 supercell (=2560 atoms) with periodic boundary conditions and the MD simulations are carried out using the GPUMD [30] package with the FCP [57]. The system is equilibrated in the NVT ensemble using the Langevin thermostat and the positions are then sampled in the NVE ensemble using the velocity Verlet algorithm. The total simulation time is set to with a time step of .
The intermediate scattering function
| (7) |
is determined at the R point, for the wavevector , as a time average using dynasor [31]. The nuclear scattering lengths are given in Sec. III. The dynamic structure factor
| (8) |
is then obtained by a Fourier transformation and is averaged over 50 independent MD simulations with different initial velocities.
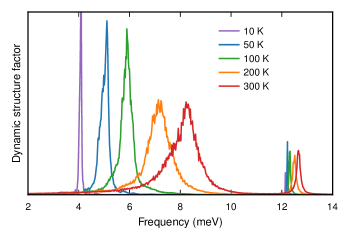
The resulting dynamical structure factor, as function of temperature, is shown in Fig. 6. Two set of peaks are seen. One at lower frequencies, from 4 to , and one at higher frequencies, between 12 and . The lower frequency mode corresponds to oxygen motion, the R-tilt mode. It shows a strong temperature dependence, and the peak broadens as temperature increases. The peaks at higher frequencies correspond to motion of barium, the R-acoustic mode. A weak temperature dependence is observed, indicating that this vibrational motion of barium is associated with a weak anharmonicity. In order to extract the frequencies, we fit the spectra to a damped harmonic oscillator model (see Supplemental Material [47]). The obtained theoretical frequencies are compared with our experimental data points in Fig. 8.
IV.2 Dispersion relation
Next, we consider the self-consistent phonon (SCP) method. The model is based on a 6x6x6 supercell, and we use M=80 structures in each iteration. The minimization in Eq. (5) is solved by ordinary least squares (OLS) and the iteration in Eq. (6) is stopped once the free energy for the effective harmonic system is smaller than per atom for two successive iterations.
In Fig. 7 part of the resulting phonon dispersion for five different temperatures is shown. The oxygen related R-tilt mode is clearly temperature dependent, and the barium related R-acoustic mode shows only a weak temperature dependence.
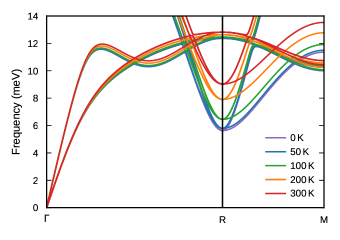
At the R-point we observe a softening of the R-tilt mode from at to at . Also at the M-point the softening is substantial, from to in the same temperature range. The R-acoustic mode is nearly constant with temperature. At the R-point the frequency decreases slightly, from to in the temperature range to . The obtained theoretical frequencies are compared with our experimental data points in Fig. 8 and Fig. 9
IV.3 Comparison between theory and experiments
Our key result is the temperature dependence of the antiferrodistortive phonon mode, the R-tilt mode. In Fig. 8 we compare our experimental and theoretical results for both the R-tilt mode and the R-acoustic mode.
The R-tilt mode shows a strong temperature dependence. From the INS data we obtain a softening from at to at , while the IXS data decrease from at to at . The INS frequencies are therefore consistently higher by about , compared with the IXS frequencies. The two data set agree within experimental uncertainties, but we consider the INS data to be more reliable since the R-tilt mode is weak in the IXS spectra. Our theoretical results, the data based on the self-consistent phonon (SCP) method and the result obtained using the dynamic simulation technique (MD), agree nicely with the experimental data.
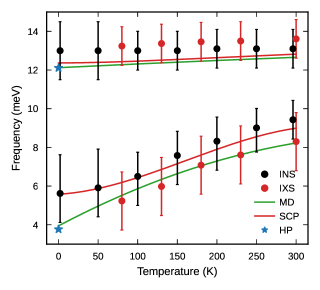
Theory predicts that below about the quantum fluctuations of the atomic motion become important in sampling the configuration space (cf. Fig. 12). It implies that the change of the frequency, the slope, decreases when approaching from above. This is seen in the experimental INS data, while the IXS measurements do not reach sufficiently low temperatures to observe this effect. The quantum fluctuations are included in the SCP method and the corresponding data show a clear decrease of the slope. In the MD method, the dynamics is treated classically (does not contain the quantum fluctuations) and the corresponding data show an increase of the slope when approaching 0 K from above, in contrast to the SCP data.
At higher temperatures, above , the R-tilt mode is well described by classical sampling and thus the difference between MD and SCP seen in Fig. 8 comes from the differences between these two computational techniques. In the MD technique all anharmonicities within the given FCP are included while in the SCP method the configuration space is sampled by independent normal modes, based on an effective harmonic model which has been computed using the same FCP as in MD. It has been argued that, using non-interacting normal modes, could potentially lead to sampling of higher-energy structures by the SCP method. This would then result in higher effective vibrational frequencies [58]. Therefore, we expect the MD method to be more accurate compared with the SCP method at higher temperatures.
For comparison, the results using the effective harmonic model introduced by Hellman et al. [23] have also been computed. This model is based on samples from a classical MD trajectory and thus lacks the quantum fluctuations of the atomic motion. In the present case, it gives very similar results as the MD model for the temperature dependence of the R-tilt mode. For more details, see Fig. S8 in Supplemental Material [47].
In Fig. 8 we also show the temperature dependence of the R-acoustic mode, located at about . It shows a very weak temperature dependence. The IXS data decreases with about when reducing the temperature from down to , while the INS data are essentially temperature independent. A small decrease is also obtained using the SCP and MD methods, about . In this case the two theoretical methods give very similar results for the frequencies. The theoretical data are based on PBE and are about lower than the experimental result. However, it is known that the more accurate hybrid functionals HSE and CX0p give about higher values for the R-acoustic mode, compared with PBE [59].
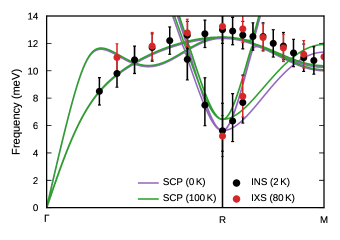
Finally, we compare the experimental data for the dispersion of the two R-modes with the theoretical predictions based on the SCP method in Fig. 9. The INS data for the R-tilt mode compare very well with the theoretical data, while in the IXS measurement only one extra data point could be resolved. In the direction R–M theory predicts two branches but both the INS and the IXS measurements could only resolve one branch, as discussed earlier. The R-acoustic mode is also very well reproduced by both the INS and IXS data. A systematic offset is visible, but as discussed above this is most likely due to the use of PBE in the theoretical calculations.
V Theoretical results - atomic displacements
V.1 Mean squared displacements
The mean squared displacement (MSD) can be obtained within the HP and SCP models using Eq. 2. It can also be obtained directly from MD simulations making a time-average along the MD trajectory
| (9) |
where is the displacement of atom from its equilibrium position , i.e. . The obtained results for the mean squared displacements (MSDs) are shown as function of temperature in Fig. 10. In the same figure we also show experimental data for BZO from Refs [17, 5, 20].
We notice that for barium and zirconium all directions are symmetrically equivalent. Barium has a larger displacement compared with zirconium due to its considerably weaker interaction with its surroundings. On the other hand, the displacement for oxygen is strongly anisotropic, with larger displacements perpendicular to the Zr-O bond.
Consider first the HP model. At zero Kelvin the MSD is given by its zero point motion value. It increases with temperature and at high temperatures it approaches its classical behavior, i.e. linear in temperature.
In the SCP model anharmonicity is included. There is a clear difference between SCP and HP at higher temperatures for the oxygen motion perpendicular to the Zr-O bond. The FCP based SCP potential energy landscape is stiffer than the harmonic (HP) one (cf. Fig. 2) and thus leading to smaller displacements. The displacements for barium show a similar effect but less pronounced.
In the MD model the motion is treated classically. Therefore, at low temperatures the displacements approaches zero. This is seen in Fig. 10. Furthermore, if the system is harmonic the MSD increases linearly with temperature. This is obtained for the zirconium motion and the motion of oxygen parallel to the Zr-O bond. However, for the motion of oxygen perpendicular to the Zr-O bond the slope of the MSD decreases when the temperature increases, due to the motion being anharmonic. The same behavior is observed for the barium motion but less pronounced.
The difference between the MD and the SCP models is that the latter includes the quantum fluctuations of the atomic motion, while MD does not take those into account. On the other hand, MD includes the full anharmonicity in Eq. 1, while SCP does that in an approximate way. From Fig. 10 we note that MD and SCP agree quite well at for all atomic motions except for the oxygen motion parallel to the Zr-O bond. For this high frequency motion, quantum effects are sizeable even at .
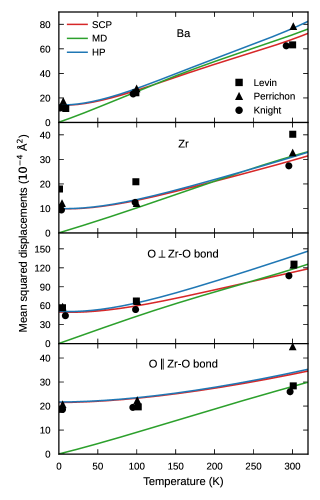
We can also compare with available experimental data. In Fig. 10 data at , and from Perrichon et al. [17], Knight [5] and Levin et al. [20] are added. The mean square static disorder has been subtracted from the raw data by Knight [5]. We notice that theory and experiments compare quite well. However, the data by Levin el al. [20] for Zr are systematically larger and the data point for oxygen parallel to the Zr-O bond by Perrichon et al. [17] deviates significantly from the rest of the experimental data.
V.2 Mean squared relative displacements
The fluctuations in the distance between two atoms in a crystal can be measured using extended X-ray absorption fine structure (EXAFS) spectroscopy [60]. This technique gives a more local information about the fluctuations of the atomic positions compared with the mean squared displacement (MSD), measured by X-ray and neutron scattering.
The R-tilt mode with its essentially rigid antiphase tilts of the ZrO6 octahedra should be visible as large fluctuations of the nearest-neighbor Ba-O atomic distance. Indeed, Lebedev and Sluchinskaya [61] found large values of the Debye Waller factor for the Ba-O atomic pairs using EXAFS at . Usually the Debye-Waller factor in EXAFS monotonically increases with increasing inter-atomic distances, but Lebedev and Sluchinskaya [61] found a significantly larger value for the first shell (Ba-O) compared with the second (Ba-Zr) and third (Ba-Ba) shells (cf. Table 1). They attributed this to the appearance of a structural instability and speculated in the possible formation of a structural glass state in BZO as the temperature is lowered.
Granhed et al. [59] showed, using DFT calculations, that the low frequency of the R-tilt mode gives rise to an ”anomalously” large value of the Debye-Waller factor for the Ba-O atomic pairs. The study by Granhed et al. [59] was based on the harmonic approximation for the lattice vibrations and several exchange-correlation functionals within DFT were used.
Here, we consider the effect of the anharmonicity which was neglected in Ref. [59]. The parallel mean squared relative displacement (MSRD) between neighboring atoms and can be obtained from the phonon eigenvectors and frequencies according to [60],
| (10) |
where
| (11) |
and is the reduced mass, is the vector connecting the equilibrium positions of neighboring atoms and and is the corresponding vector of unit length. Eqs. (10) and (11) can be used to obtain the parallel MSRD within the HP and SCP approximations. The parallel MSRD can also be directly computed from MD simulations by making a time average of the expression
| (12) |
along the MD trajectory [60].
Our resulting parallel MSRDs are presented in Table 1 using PBE. In the harmonic approximation (HP) we indeed get a large value for the nearest-neighbor Ba-O atomic distance at , considerably larger than the experimental value. That was also noticed in Ref. [59] and explained by the underestimation of vibrational frequencies in PBE. If we add anharmonicity and evaluate the MSRD within the SCP and MD approximations the value is reduced but still larger compared with experiments. This reduction is due to the stiffer potential energy surface (PES) when anharmonicity is included, and hence smaller displacements. Similar trends, but much less pronounced, are obtained for the nearest-neighbor Ba-Zr and Ba-Ba atomic distances.
Still, the values including anharmonicity, the SCP and MD values, are larger than the experimental values. However, using improved approximations for the exchange-correlation approximations within DFT we expect the agreement to be improved. It was shown in Ref. [59] that inclusion of Fock exchange as implemented in the two hybrid functionals, HSE [38, 39] and CX0p [40], stiffens the atomic bonds and thus increases the vibrational frequencies. It then follows that the MSRD will decrease.
| T (K) | Exp | MD | SCP | HP | |
|---|---|---|---|---|---|
| 0 | - | - | 6.4 | 6.8 | |
| 300 | 14.5 | 18.2 | 17.5 | 22.5 | |
| 0 | - | - | 2.1 | 2.2 | |
| 300 | 6.8 | 7.5 | 7.2 | 8.2 | |
| 0 | - | - | 2.7 | 2.7 | |
| 300 | 8.7 | 12.3 | 12.0 | 13.5 |
VI Discussion
VI.1 Exchange-correlation functional
As a compromise between accuracy and computational cost we have based our computations on the PBE functional (see Sec. II.1). The vibrational properties at the R point are quite sensitive to the exchange-correlation approximation used in the DFT calculations [17]. To test this sensitivity, we have also computed the temperature dependent vibrational spectra using the PBEsol functional.
A 4th order FCP is constructed based on the PBEsol functional (for details, see Supplemental Material [47]). In Fig. 11 we show the FCP result for the PES along the R-tilt mode FCP model together with the DFT data. In contrast to PBE, the PBEsol functional shows a weak double-well landscape for the R-tilt mode potential. This means that the R-tilt mode is unstable in the harmonic approximation with an imaginary frequency, in this case, equal to 4.2i . This implies that, in a classical description and using PBEsol, the cubic phase for BZO is unstable close to zero Kelvin.
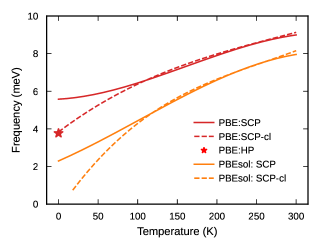
The FCP based on PBEsol is used in the same way as described for PBE to obtain the temperature dependent phonon frequencies. In Fig. 12 we compare our theoretical results using the two different functionals, PBE and PBEsol. The frequencies based on the PBEsol functional is about lower compared with the PBE frequencies and PBEsol gives a somewhat stronger temperature dependence. Both functionals give rise to a finite frequency at T=. For PBEsol, which has a double-well landscape for the R-tilt mode potential (see Fig. 11), it is worth noting that quantum fluctuations at T= stabilizes the cubic structure using the SCP model.
VI.2 Effect of quantum fluctuations
To demonstrate the effect of the quantum fluctuations of the atomic motion on the R-tilt mode we can now compare the result for the SCP model using the amplitude in Eq. 4, which contains the proper quantum fluctuations, with the results obtained by using the classical limit of the amplitude, i.e.,
| (13) |
The latter model is here denoted SCP-cl and neglects the quantum fluctuations. When lowering the temperature SCP-cl starts to deviate from SCP around , as seen in Fig. 12. The frequencies decrease more rapidly compared with the SCP model and for PBE the frequency approaches the PBE harmonic frequency value of , the HP value. However, the SCP-cl value for PBEsol approaches zero at a finite temperature. Hence, by neglecting quantum fluctuations, PBEsol predicts an unstable cubic structure at .
VI.3 Thermal expansion
We have neglected thermal expansion in our theoretical analysis. In Ref. [17] thermal expansion within the quasi-harmonic approximation was taken into account for the frequency of the R-tilt mode. The PBE value for the frequency increased by in the temperature interval 0 to 300 K, while the increase for the two hybrid functional HSE and CX0p was less, about , in the same interval. Therefore, the temperature dependence derived here, may increase slightly if thermal expansion is taken into account.
VI.4 Comparison with other work
Recently Zheng et al. [27] considered anharmonic lattice dynamics in BZO with focus on thermal transport in the temperature range 300- using the PBE functional. They used a non-perturbative self-consistent phonon method as implemented in ALAMODE [63, 26]. They also investigated the R-tilt mode and they obtained a frequency increase from to in the temperature range 0 to (see their FIG. S4.). This can be compared with our present SCP results using a similar theoretical approach. We find an increase from to in the same temperature range. This difference can likely be attributed to the difference in the FCP s used in the two different works (cf. the discussion in Ref. [64]).
Here a 4x4x4 supercell was used to train the FCP, whereas Zheng et al. used a 3x3x3 supercell incommensurate with the R-tilt mode. Furthermore, Zheng et al. constructed the harmonic force-constants separately from the anharmonic force-constants. These differences in the FCP construction likely explains the observed difference in calculated frequencies.
VII Conclusions
We have presented a combined experimental and theoretical study of the temperature dependence of the antiferrodistortive R-tilt mode in barium zirconate (BZO).
Our inelastic neutron and x-ray scattering measurements on a single crystal clearly show that the antiferrodistortive phonon mode at the R point softens substantially, from at room temperature to at . In contrast, the barium associated acoustic mode at the same R point is found to be nearly temperature independent.
We use a first-principles computational approach to study the lattice dynamics. A force constant potential (FCP) including cubic and quartic anharmonic terms is derived using training structures from density functional theory (DFT) calculations. The PBE functional is employed for the exchange-correlation functional and to gauge the sensitivity with respect to the exchange-correlation functional, the PBEsol functional is also used in some calculations. The vibrational motion is investigated by direct molecular dynamics (MD) simulations as well as by using a self-consistent phonon approach. The effect of the anharmonicity on the lattice dynamics is hence taken into account non-perturbatively.
Our theoretical approach, based on a self-consistent phonon approach, predicts a soft phonon mode at the R point, associated with antiphase tilt oscillations of sequential oxygen ZrO6 octahedra, with a strong temperature dependence, from at to at , in great agreement with the present measurements. The quantum fluctuations of the atomic motion are found to be important to obtain the proper temperature dependence at low temperature. To accurately describe the vibrational motion at low temperatures it is thus important to include both anharmonicity and quantum fluctuations of the atomic motion in a consistent way.
The mean squared displacements of the different atoms are determined as function of temperature and are shown to be consistent with available experimental data. The mean squared relative displacements have also been computed. These displacements are measured in EXAFS and the fluctuations of the Ba-O distance are a sensitive local measure of the antiphase tilt oscillations of the oxygen octahedra. We compare our computed values for the fluctuation of the Ba-O distance with available EXAFS data at 300 K and the agreement with the EXAFS data is improved when anharmonicity is taken into account in our theoretical modeling.
Altogether, our work provides a robust description of the lattice dynamics and its temperature dependence at the R point, but future work will be needed to clarify open questions on the lattice dynamics away from R. This includes the exact position and temperature dependence of the tilt branch along the R-M direction, as well as a proper deconvolution of the inelastic spectrum. The temperature evolution of the lineshape in INS spectra still needs to be understood and the importance of different ingredients evaluated (resolution effects, anharmonicity, potential presence of nano-domains, etc.). We anticipate that further inelastic scattering experiments or diffuse scattering will help to address this issue and that extended computational modeling may uncover the presence or absence of the proposed nano-domains.
VIII Acknowledgements
Raphaël Haumont and Romuald Saint-Martin from the ICMMO - UMR 8182, Université Paris Saclay, are acknowledged for their help in the preparation of the single crystals used for the INS experiments. Fredrik Eriksson and Paul Erhart are thanked for useful discussions in connection to the software hiphive. Funding from the Swedish Energy Agency (grant No. 45410-1), the Swedish Research Council (2018-06482 and 2020-04935) and the Excellence Initiative Nano at Chalmers is gratefully acknowledged. The computations were performed by resources provided by the Swedish National Infrastructure for Computing (SNIC), partially funded by the Swedish Research Council through grant agreement no. 2018-05973. Cosme Milesi-Brault was supported by the Operational Programme Research, Development, and Education (financed by European Structural and Investment Funds and by the Czech Ministry of Education, Youth, and Sports), Project No. SOLID21-CZ.02.1.01/0.0/0.0/16_019/0000760.
References
- Bhalla et al. [2000] A. S. Bhalla, R. Guo, and R. Roy, The perovskite structure – a review of its role in ceramic science and technology, Mater. Res. Innov. 4, 3 (2000).
- Glazer [2011] A. Glazer, A brief history of tilts, Phase Transit. 84, 405 (2011).
- Howard and Stokes [2005] C. J. Howard and H. T. Stokes, Structures and phase transitions in perovskites – a group-theoretical approach, Acta Crystallogr. A 61, 93 (2005).
- Sai and Vanderbilt [2000] N. Sai and D. Vanderbilt, First-principles study of ferroelectric and antiferrodistortive instabilities in tetragonal SrTiO3, Phys. Rev. B 62, 13942 (2000).
- Knight [2020] K. S. Knight, Low-temperature thermophysical and crystallographic properties of BaZrO3 perovskite, J. Mater. Sci. 55, 6417 (2020).
- Sebastian [2010] M. Sebastian, Dielectric Materials for Wireless Communication (Elsevier Science, 2010).
- Vassen et al. [2000] R. Vassen, X. Cao, F. Tietz, D. Basu, and D. Stöver, Zirconates as New Materials for Thermal Barrier Coatings, J. Am. Ceram. Soc. 83, 2023 (2000).
- Kreuer [2003] K. Kreuer, Proton-conducting oxides, Annu. Rev. Mater. Sci. 33, 333 (2003).
- Clark et al. [2022] D. Clark, H. Malerød-Fjeld, M. Budd, I. Yuste-Tirados, D. Beeaff, S. Aamodt, K. Nguyen, L. Ansaloni, T. Peters, P. K. Vestre, D. K. Pappas, M. I. Valls, S. Remiro-Buenamañana, T. Norby, T. S. Bjørheim, J. M. Serra, and C. Kjølseth, Single-step hydrogen production from NH3, CH4, and biogas in stacked proton ceramic reactors, Science 376, 390 (2022).
- Dobal et al. [2001] P. S. Dobal, A. Dixit, R. S. Katiyar, Z. Yu, R. Guo, and A. S. Bhalla, Micro-Raman scattering and dielectric investigations of phase transition behavior in the BaTiO3–BaZrO3 system, J. Appl. Phys. 89, 8085 (2001).
- Zhong and Vanderbilt [1995] W. Zhong and D. Vanderbilt, Competing Structural Instabilities in Cubic Perovskites, Phys. Rev. Lett. 74, 2587 (1995).
- Bennett et al. [2006] J. W. Bennett, I. Grinberg, and A. M. Rappe, Effect of symmetry lowering on the dielectric response of , Phys. Rev. B 73, 180102(R) (2006).
- Akbarzadeh et al. [2005] A. R. Akbarzadeh, I. Kornev, C. Malibert, L. Bellaiche, and J. M. Kiat, Combined theoretical and experimental study of the low-temperature properties of BaZrO3, Phys. Rev. B 72, 205104 (2005).
- Bilić and Gale [2009] A. Bilić and J. D. Gale, Ground state structure of BaZrO3: A comparative first-principles study, Phys. Rev. B 79, 174107 (2009).
- Chen et al. [2018] P. Chen, M. N. Grisolia, H. J. Zhao, O. E. González-Vázquez, L. Bellaiche, M. Bibes, B.-G. Liu, and J. Íñiguez, Energetics of oxygen-octahedra rotations in perovskite oxides from first principles, Phys. Rev. B 97, 024113 (2018).
- Amoroso et al. [2018] D. Amoroso, A. Cano, and P. Ghosez, First-principles study of and solid solutions, Phys. Rev. B 97, 174108 (2018).
- Perrichon et al. [2020] A. Perrichon, E. Jedvik Granhed, G. Romanelli, A. Piovano, A. Lindman, P. Hyldgaard, G. Wahnström, and M. Karlsson, Unraveling the Ground-State Structure of BaZrO3 by Neutron Scattering Experiments and First-Principles Calculations, Chem. Mater. 32, 2824 (2020).
- Evarestov [2011] R. A. Evarestov, Hybrid density functional theory LCAO calculations on phonons in Ba(Ti,Zr,Hf)O3, Phys. Rev. B 83, 014105 (2011).
- Toulouse et al. [2019] C. Toulouse, D. Amoroso, C. Xin, P. Veber, M. C. Hatnean, G. Balakrishnan, M. Maglione, P. Ghosez, J. Kreisel, and M. Guennou, Lattice dynamics and raman spectrum of BaZrO3 single crystals, Phys. Rev. B 100, 134102 (2019).
- Levin et al. [2021] I. Levin, M. G. Han, H. Y. Playford, V. Krayzman, Y. Zhu, and R. A. Maier, Nanoscale-correlated octahedral rotations in BaZrO3, Phys. Rev. B 104, 214109 (2021).
- Xin et al. [2019] C. Xin, P. Veber, M. Guennou, C. Toulouse, N. Valle, M. Ciomaga Hatnean, G. Balakrishnan, R. Haumont, R. Saint Martin, M. Velazquez, A. Maillard, D. Rytz, M. Josse, M. Maglione, and J. Kreisel, Single crystal growth of from the melt at 2700 using optical floating zone technique and growth prospects from flux at 1350, CrystEngComm 21, 502 (2019).
- Souvatzis et al. [2008] P. Souvatzis, O. Eriksson, M. I. Katsnelson, and S. P. Rudin, Entropy Driven Stabilization of Energetically Unstable Crystal Structures Explained from First Principles Theory, Phys. Rev. Lett. 100, 095901 (2008).
- Hellman et al. [2011] O. Hellman, I. A. Abrikosov, and S. I. Simak, Lattice dynamics of anharmonic solids from first principles, Phys. Rev. B 84, 180301(R) (2011).
- Monacelli et al. [2021] L. Monacelli, R. Bianco, M. Cherubini, M. Calandra, I. Errea, and F. Mauri, The stochastic self-consistent harmonic approximation: Calculating vibrational properties of materials with full quantum and anharmonic effects, J. Phys. Condens. Matter 33, 363001 (2021).
- Esfarjani and Liang [2020] K. Esfarjani and Y. Liang, Thermodynamics of anharmonic lattices from first principles, in Nanoscale Energy Transport, edited by B. Liao (IOP Publishing, 2020) Chap. 7.
- Tadano and Tsuneyuki [2015] T. Tadano and S. Tsuneyuki, Self-consistent phonon calculations of lattice dynamical properties in cubic SrTiO3 with first-principles anharmonic force constants, Phys. Rev. B 92, 054301 (2015).
- Zheng et al. [2022] J. Zheng, D. Shi, Y. Yang, C. Lin, H. Huang, R. Guo, and B. Huang, Anharmonicity-induced phonon hardening and phonon transport enhancement in crystalline perovskite BaZrO3, Phys. Rev. B 105, 224303 (2022).
- Eriksson et al. [2019] F. Eriksson, E. Fransson, and P. Erhart, The Hiphive Package for the Extraction of High-Order Force Constants by Machine Learning, Adv. Theory Simul. 2, 1800184 (2019).
- Larsen et al. [2017] A. H. Larsen, J. J. Mortensen, J. Blomqvist, I. E. Castelli, R. Christensen, M. Dułak, J. Friis, M. N. Groves, B. Hammer, C. Hargus, E. D. Hermes, P. C. Jennings, P. B. Jensen, J. Kermode, J. R. Kitchin, E. L. Kolsbjerg, J. Kubal, K. Kaasbjerg, S. Lysgaard, J. B. Maronsson, T. Maxson, T. Olsen, L. Pastewka, A. Peterson, C. Rostgaard, J. Schiøtz, O. Schütt, M. Strange, K. S. Thygesen, T. Vegge, L. Vilhelmsen, M. Walter, Z. Zeng, and K. W. Jacobsen, The atomic simulation environment—a Python library for working with atoms, J. Phys. Condens. Matter 29, 273002 (2017).
- Fan et al. [2017] Z. Fan, W. Chen, V. Vierimaa, and A. Harju, Efficient molecular dynamics simulations with many-body potentials on graphics processing units, Comput. Phys. Commun. 218, 10 (2017).
- Fransson et al. [2021] E. Fransson, M. Slabanja, P. Erhart, and G. Wahnström, dynasor —a tool for extracting dynamical structure factors and current correlation functions from molecular dynamics simulations, Adv. Theory Simul. 4, 2000240 (2021).
- Kresse and Furthmüller [1996a] G. Kresse and J. Furthmüller, Efficient iterative schemes for ab initio total-energy calculations using a plane-wave basis set, Phys. Rev. B 54, 11169 (1996a).
- Kresse and Furthmüller [1996b] G. Kresse and J. Furthmüller, Efficiency of ab-initio total energy calculations for metals and semiconductors using a plane-wave basis set, Comp. Mater. Sci. 6, 15 (1996b).
- Perdew et al. [1996] J. P. Perdew, K. Burke, and M. Ernzerhof, Generalized gradient approximation made simple, Phys. Rev. Lett. 77, 3865 (1996).
- Perdew et al. [2008] J. P. Perdew, A. Ruzsinszky, G. I. Csonka, O. A. Vydrov, G. E. Scuseria, L. A. Constantin, X. Zhou, and K. Burke, Restoring the Density-Gradient Expansion for Exchange in Solids and Surfaces, Phys. Rev. Lett. 100, 136406 (2008).
- Berland and Hyldgaard [2014] K. Berland and P. Hyldgaard, Exchange functional that tests the robustness of the plasmon description of the van der Waals density functional, Physical Review B 89, 035412 (2014).
- Dion et al. [2004] M. Dion, H. Rydberg, E. Schröder, D. C. Langreth, and B. I. Lundqvist, Van der Waals Density Functional for General Geometries, Phys. Rev. Lett. 92, 246401 (2004).
- Heyd et al. [2003] J. Heyd, G. E. Scuseria, and M. Ernzerhof, Hybrid functionals based on a screened coulomb potential, The Journal of Chemical Physics 118, 8207–8215 (2003).
- Heyd et al. [2006] J. Heyd, G. E. Scuseria, and M. Ernzerhof, Erratum: “Hybrid functionals based on a screened Coulomb potential” [J. Chem. Phys. 118, 8207 (2003)], The Journal of Chemical Physics 124, 219906 (2006).
- Jiao et al. [2018a] Y. Jiao, E. Schröder, and P. Hyldgaard, Extent of Fock-exchange mixing for a hybrid van der Waals density functional?, The Journal of Chemical Physics 148, 194115 (2018a).
- Blöchl [1994] P. E. Blöchl, Projector augmented-wave method, Phys. Rev. B 50, 17953 (1994).
- Kresse and Joubert [1999] G. Kresse and D. Joubert, From ultrasoft pseudopotentials to the projector augmented-wave method, Phys. Rev. B 59, 1758 (1999).
- Gonze et al. [1994] X. Gonze, J. C. Charlier, D. C. Allan, and M. P. Teter, Interatomic force constants from first principles: The case of -quartz, Phys. Rev. B 50, 13035 (1994).
- Gonze and Lee [1997] X. Gonze and C. Lee, Dynamical matrices, Born effective charges, dielectric permittivity tensors, and interatomic force constants from density-functional perturbation theory, Phys. Rev. B 55, 10355 (1997).
- Togo and Tanaka [2015] A. Togo and I. Tanaka, First principles phonon calculations in materials science, Scr. Mater. 108, 1 (2015).
- Pedregosa et al. [2011] F. Pedregosa, G. Varoquaux, A. Gramfort, V. Michel, B. Thirion, O. Grisel, M. Blondel, P. Prettenhofer, R. Weiss, V. Dubourg, J. Vanderplas, A. Passos, D. Cournapeau, M. Brucher, M. Perrot, and E. Duchesnay, Scikit-learn: Machine learning in Python, J. Mach. Learn. Res. 12, 2825 (2011).
- [47] See Supplemental Material for details about the force constant potential, phonon dispersions, fitting of the INS and IXS data, fitting of the dynamical structure factor, comparison between the self-consistent phonon model and the effective harmonic model. The supplemental Material also contains Refs. [65, 66].
- Piovano et al. [2020] A. Piovano, A. Ivanov, S. Roux, and F. Charpenay, The science division projects in8 monochromator and thermes secondary spectrometer: enhancing the performance of the thermal neutron TAS-IN8, ILL Annual report 2020 , 76 (2020).
- Guennou et al. [2021] M. Guennou, R. Haumont, M. Maglione, and A. Piovano, Experimental report on proposal 7-02-190, Institut Laue-Langevin (ILL) (2021), unpublished. Dataset: 10.5291/ILL-DATA.7-02-190.
- Guennou et al. [2019] M. Guennou, F. Bourdarot, M. Maglione, C. Toulouse, and C. Xin, Experimental report on proposal 7-02-180,0 Institut Laue-Langevin (ILL) (2019), unpublished. Dataset: 10.5291/ILL-DATA.7-02-180.
- Krisch and Sette [2007] M. Krisch and F. Sette, Inelastic x-ray scattering from phonons, in Light Scattering in Solid IX, edited by M. Cardona and R. Merlin (Springer Berlin Heidelberg, Berlin, Heidelberg, 2007) Chap. 5, pp. 317–370.
- Girard et al. [2019] A. Girard, T. Nguyen-Thanh, S. M. Souliou, M. Stekiel, W. Morgenroth, L. Paolasini, A. Minelli, D. Gambetti, B. Winkler, and A. Bosak, A new diffractometer for diffuse scattering studies on the ID28 beamline at the ESRF, J. Synchrotron Radiat. 26, 272 (2019).
- Sears [1992] V. F. Sears, Neutron scattering lengths and cross sections, Neutron News 3, 26 (1992).
- Weber et al. [2016] T. Weber, R. Georgii, and P. Böni, Takin: An open-source software for experiment planning, visualisation, and data analysis, SoftwareX 5, 121 (2016).
- Weber [2017] T. Weber, Update 1.5 to “takin: An open-source software for experiment planning, visualisation, and data analysis”, (pii: S2352711016300152), SoftwareX 6, 148 (2017).
- Weber [2021] T. Weber, Update 2.0 to “takin: An open-source software for experiment planning, visualisation, and data analysis”, (pii: S2352711016300152), SoftwareX 14, 100667 (2021).
- Brorsson et al. [2022] J. Brorsson, A. Hashemi, Z. Fan, E. Fransson, F. Eriksson, T. Ala-Nissila, A. V. Krasheninnikov, H.-P. Komsa, and P. Erhart, Efficient Calculation of the Lattice Thermal Conductivity by Atomistic Simulations with Ab Initio Accuracy, Adv. Theory Simul. 5, 2100217 (2022).
- Metsanurk and Klintenberg [2019] E. Metsanurk and M. Klintenberg, Sampling-dependent systematic errors in effective harmonic models, Phys. Rev. B 99, 184304 (2019).
- Granhed et al. [2020] E. J. Granhed, G. Wahnström, and P. Hyldgaard, BaZrO3 stability under pressure: The role of nonlocal exchange and correlation, Phys. Rev. B 101, 224105 (2020).
- Fornasini and Grisenti [2015] P. Fornasini and R. Grisenti, On EXAFS Debye-Waller factor and recent advances, J. Synchrotron Radiat. 22, 1242 (2015).
- Lebedev and Sluchinskaya [2013] A. I. Lebedev and I. A. Sluchinskaya, Structural instability in BaZrO3 crystals: Calculations and experiment, Phys. Solid State 55, 1941 (2013).
- Jiao et al. [2018b] Y. Jiao, E. Schröder, and P. Hyldgaard, Extent of Fock-exchange Mixing for a hybrid van der Waals density functional?, The Journal of Chemical Physics 148, 194115 (2018b).
- Tadano et al. [2014] T. Tadano, Y. Gohda, and S. Tsuneyuki, Anharmonic force constants extracted from first-principles molecular dynamics: applications to heat transfer simulations, J. Phys. Condens. Matter 26, 225402 (2014).
- Fransson et al. [2022] E. Fransson, P. Rosander, F. Eriksson, J. M. Rahm, T. Tadano, and P. Erhart, Probing the limits of the phonon quasi-particle picture: The transition from underdamped to overdamped dynamics in CsPbBr3 (2022), arXiv:2211.08197 [cond-mat] .
- Korotaev et al. [2018] P. Korotaev, M. Belov, and A. Yanilkin, Reproducibility of vibrational free energy by different methods, Computational Materials Science 150, 47 (2018).
- Castellano et al. [2022] A. Castellano, F. Bottin, J. Bouchet, A. Levitt, and G. Stoltz, Ab Initio canonical sampling based on variational inference, Phys. Rev. B 106, L161110 (2022).