Machine learning-informed structuro-elastoplasticity predicts ductility of disordered solids
All solids yield under sufficiently high mechanical loads. Below yield, the mechanical responses of all disordered solids are nearly alike, but above yield every different disordered solid responds in its own way. Brittle systems can shatter without warning, like ordinary window glass, or exhibit strain localization prior to fracture, like metallic or polymeric glasses. Ductile systems, e.g. foams like shaving cream or emulsions like mayonnaise, can flow indefinitely with no strain localization. While there are empirical strategies for tuning the degree of strain localization, there is no framework that explains their effectiveness or limitations. We show that Structuro-Elastoplastic (StEP) models provide microscopic understanding of how strain localization depends on the interplay of structure, plasticity and elasticity.
Disordered solids, such as metallic, molecular, polymeric, nanoparticle or colloidal glasses or granular packings, exhibit plastic behaviors distinct from those of crystalline solids (?, ?, ?, ?). Below yield, these behaviors are surprisingly universal with a consistent value of yield strain (?). Beyond yield, however, some disordered solids, such as foams and certain polymer glasses, are ductile with little or no strain localization, while others, like molecular and metallic glasses, typically exhibit sharp strain localization in shear bands as precursors to brittle failure.
Several empirical strategies have been discovered for tuning strain localization. Reducing the range of inter-particle attractions (?, ?, ?, ?, ?), equilibrating better (?), annealing at slower cooling rates (?) or cooling while loading (?, ?) all enhance strain localization. Friction (?), composite constituents (?), particle shape (?) and degree of crystallinity (?) also influence ductility. However, we do not understand why or how these factors influence strain localization.
At the microscopic scale, plasticity in solids is accomplished by rearrangements in which constituent particles change neighbors. While other approaches exist (?, ?, ?, ?), elastoplasticity (EP) models (?) update and record yield strain and strain at each lattice site, corresponding to a coarse-grained region. Such models typically assume an underlying distribution of local yield strains that controls the degree of strain localization (?) and is put in by hand (?, ?).
Here we follow a different path. A particle’s local yield strain–and hence its probability to rearrange–depends on its local structural environment (?, ?, ?, ?). We extract a structural predictor of local yield strain, called softness, (?, ?), using neural networks or support-vector machines, demonstrating that our framework can support any local structural measure that predicts rearrangements or local yield stress (e.g. (?, ?, ?, ?, ?, ?, ?)). Following Zhang et al. (?, ?), we unravel the interplay between strain, rearrangements and softness, to incorporate softness into structuro-elasto-plasticity (StEP) models. In contrast to EP models, here the local yield strain distribution emerges as a collective property.
We develop StEP models for three vastly different systems that each can each be tuned in different ways to exhibit different degrees of strain localization. We demonstrate that the models can be used to gain microscopic insight, opening the door to a quantitative, particle-level approach to engineer advanced structure-property relations in disordered solids.
Systems studied
We examine three systems that differ in dimensionality, temperature, loading condition, and/or interaction potential (?). System I is made of 2D simulated polydisperse circular disks with pairwise repulsions, where is the separation, equilibrated using Monte Carlo swap methods (?). Realizations are initially equilibrated at a high temperature (System IA) or at a very low temperature of (System IB); IA is ductile while IB exhibits strong strain localization and is brittle (?). System II is an experimental granular raft of polydisperse spheres floating at an air-oil interface (?). The gravitational capillary length controls the attractive interaction range; in System IIA the particle diameter mm is smaller than the capillary length while in IIB the particle diameter mm exceeds the capillary length. IIB exhibits more strain localization than IIA under tensile strain. Finally, System III is a three-dimensional polymer nanopillar with chains of coarse-grained particles. The system is simulated at two different temperatures below the glass transition temperature (?, ?), (System IIIA) and (IIIB); IIIB exhibits more strain localization under tensile strain than IIIA. For details of all three systems see (?).
Softness and yield strain
For Systems II and III, softness is a weighted sum of local pair and three-body correlation functions obtained using a support vector machine (?, ?). Particles with higher softness tend to have lower yield strains and are therefore more susceptible to rearrangement (Fig. S1). For details of the definition of softness see (?). The local yield strain in poorly annealed jammed packings depends on softness (?), following a Weibull distribution:
| (1) |
where and characterize the distribution at each softness (Figs. S4, S5). For System III, we allow rearrangements to be triggered also by thermal fluctuations (?).
For System IB, the standard definition of softness is not nearly as predictive of rearrangements as local yield stress (?). We therefore use ResNet to obtain a structural prediction of local yield stress, which we call , see (?) for details (Figs. S2, S3). Softness for this model is simply
| (2) |
where is the mean value of for the system initially equilibrated at the higher temperature (System IA), , before quenching to . Because local yield strain is a predictor of rearrangements, serves as a structural predictor of rearrangements (?). The initial value of the mean, , and the standard deviation, , of the softness distribution for each system is shown in Fig. 1.
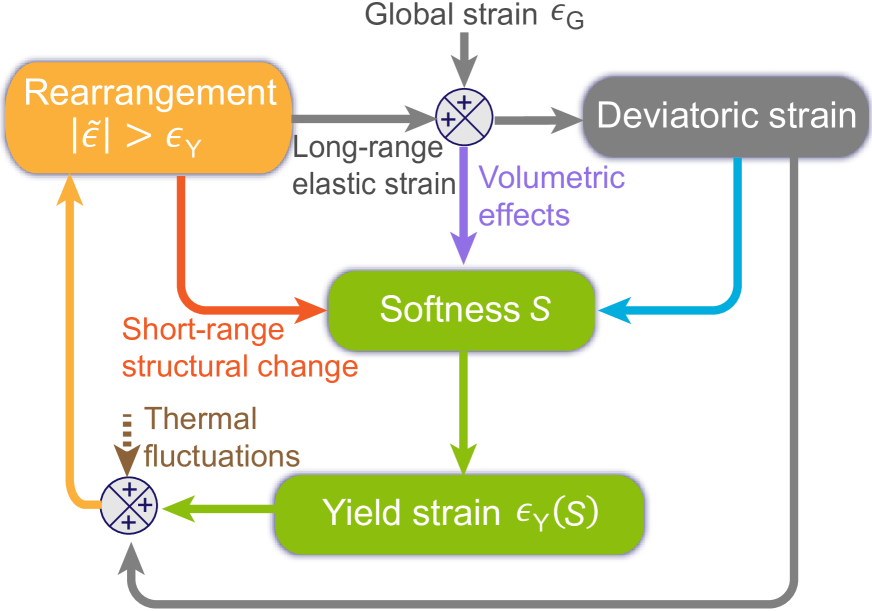
Structuro-elastoplastic (StEP) models
We extend the recently-developed 2D and athermal StEP framework (?) to the lattice model depicted in Fig. 1. We neglect variations of local elastic constants so stress is proportional to elastic strain at the block and system level. For System I, the softness of site directly determines the neural-network-predicted local yield stress with from Eq. 2 with a distribution determined by that of the actual local yield strain (?). For Systems II and III, we assign a yield strain ranking to each site to determine the yield strain from the -dependent distribution of Eq. 1. This ranking is reassigned after each plastic event at the site (?). Each block’s softness is randomly initialized according to the distribution measured in Systems I-IIIAB.
In addition to softness, each block stores a local deviatoric strain tensor, . Each system is driven by a global strain, , uniformly added to all blocks at each time step in the form of simple shear (System I) or tensile strain (Systems II and III). This uniform strain deforms local structural environments and therefore changes softness. For all of our systems, the change of softness with each strain step is given by (?), where is the increment of in each strain step.
Block rearranges (undergoes a plastic event) if its strain , the local yield strain. Because StEP models include not only coupling between plasticity and elasticity, but also with structure, a rearrangement at site affects other sites via not only an elastic but also a softness kernel. The elastic kernel is described in the supplementary material (?); it is similar to the one commonly used for the -strain (?), but includes more strain components. For block itself, the elastic strain is converted to plastic strain .
| Parameters | System IA | System IB | System IIA | System IIB | System IIIA | System IIIB |
| 0.00 | -2.73 | -0.09 | -0.04 | 0.575 | 0.085 | |
| 3.18 | 2.28 | 0.78 | 0.70 | 0.70 | 0.72 | |
| distribution | Gaussian with | Gaussian with | Weibull with | Weibull with | Weibull with | Weibull with |
| -0.325 | -0.325 | 0.08 | 1.20 | 0 | 0 | |
| 244 | 226 | 2.37 | 1.74 | 9.17 | 16.60 | |
| 411 | 411 | 139 | 339 | 13.50 | 11.05 | |
The softness kernel consists of two main pieces. The first contribution, , is a near-field effect from the change of local structure near a rearrangement, which alters softness of nearby particles directly. For all three systems, we find that this contribution tends to restore to a value close to the local angular average softness, consistent with Ref. (?). The far-field term, , arises from treating a rearrangement as an Eshelby inclusion that exerts a far-field strain that decays as a power law in (?, ?, ?). This “elastic facilitation” distorts local structural environments via the volumetric strain, (?, ?). Fluctuations around this average behavior are approximated with a Gaussian noise term, . Altogether, the softness kernel at distance from a rearrangement is
| (3) |
where the parameters , and are measured from the corresponding simulations or experiments for each of our systems (?). Here is a lattice artifact defined as the average of over all sites; it vanishes in the continuum limit. These parameters for all three systems are extracted from particle simulations or experiments (Figs. S6-S8 (?)).
In standard EP models, the lattice size is the rearrangement size. However, the softness kernel in Eq. 3 uses in units of particle size. To avoid rescaling the kernel, we allow rearrangements in the StEP model to span several blocks (?). The rearrangement size is characterized by the decay length, , of the correlation function of particle non-affine displacement (?), , measured for Systems I-III (?), so we allow blocks at distance from the rearranging block to release their elastic strain with a probability, (See Figs. S9-S10 (?)).
In summary, there are no manually-adjustable parameters in the StEP model. The parameters that appear in the softness kernel, the mean and variance of the softness distribution and the rearrangement size, are all extracted directly from the particle simulations or experiment and are listed in Fig. 1 for Systems I-III A-B.
StEP model predictions
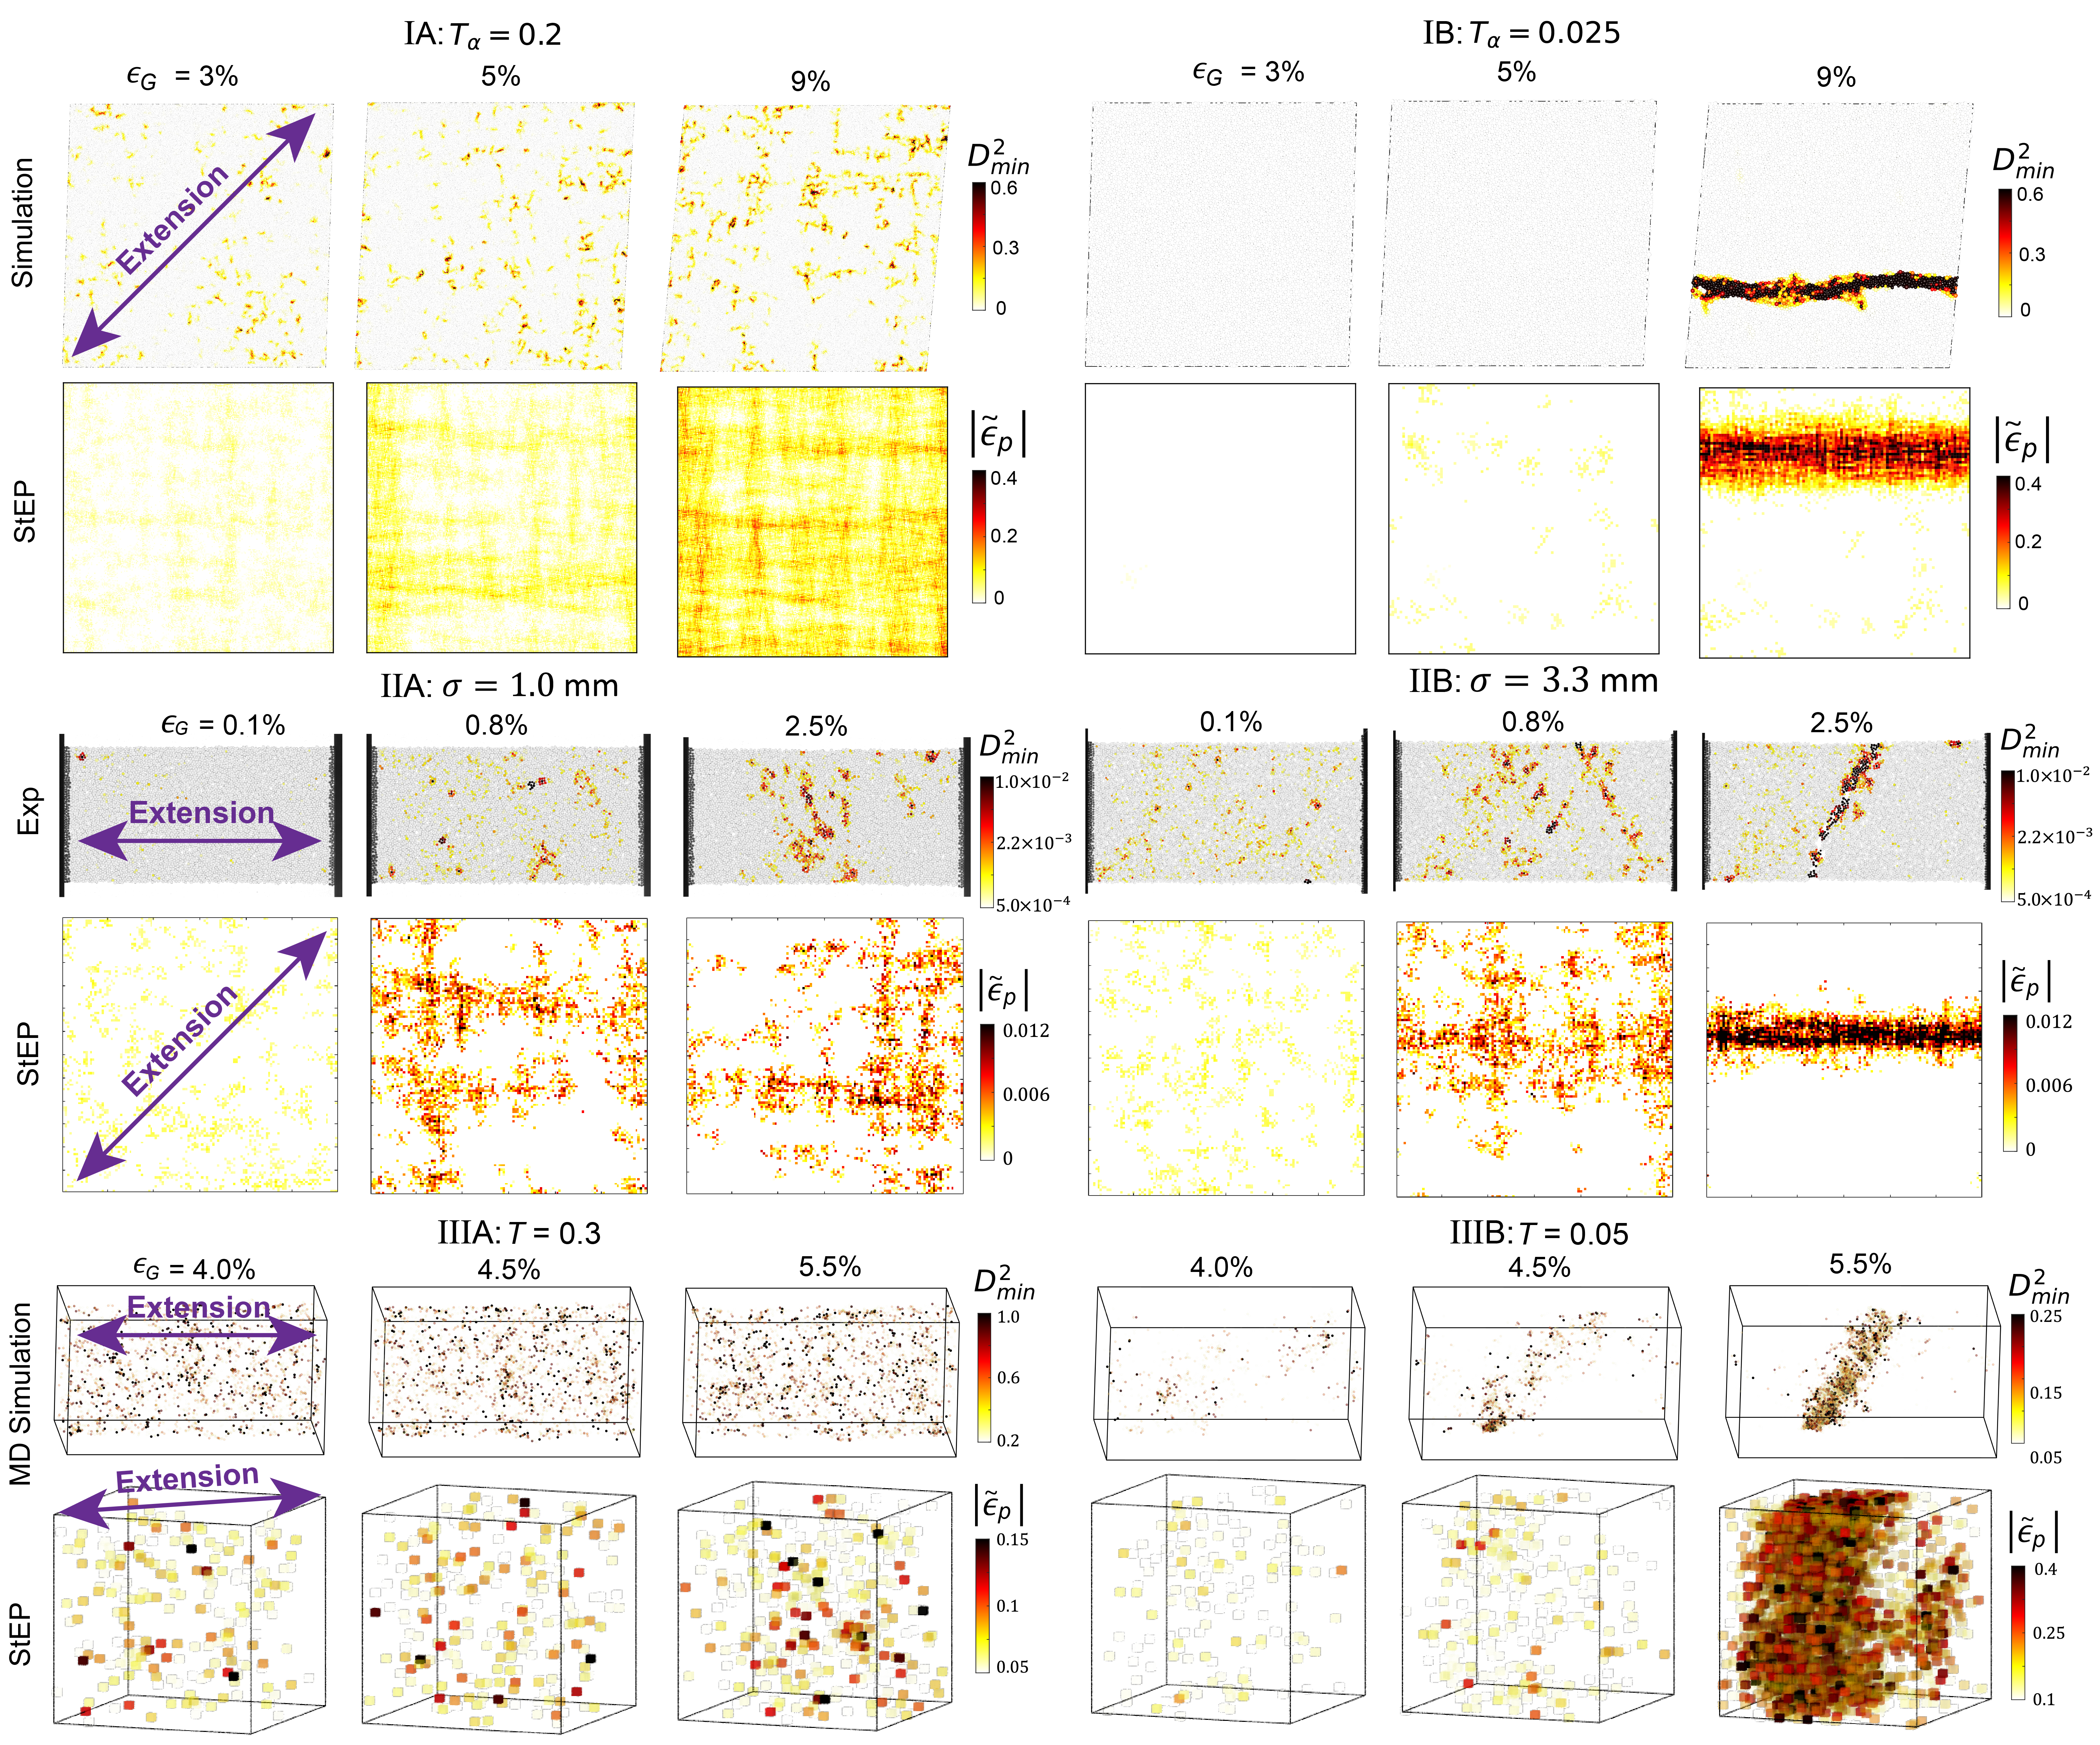
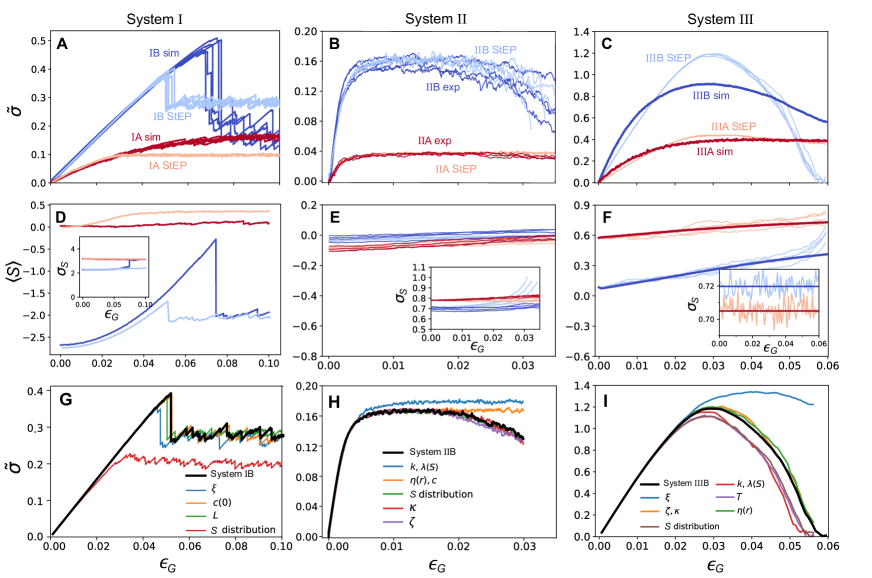
The softness kernel, Eq. 3, successfully captures the difference in ductility in all three model systems. We demonstrate this qualitatively in Fig. 2 and quantitatively in Fig. 3, which shows the stress-strain curve as well as the mean and the standard deviation of the softness field for all systems. In the particle systems, plasticity is quantified by the non-affine displacement (?), in units of , during a short small applied strain interval , while in the StEP models, it is the plastic strain during the same strain interval. The spatial distribution of the accumulated plasticity is shown at different applied global strains in Fig. 2. For each system, the difference in strain localization in cases A and B is captured well by the StEP models.
For poorly soft repulsive disks quenched from to , (System IA), there is no strain localization and the stress-strain curve shows a smooth yielding process with no stress drops in both StEP-model and particle simulations (Fig. 3A). Spatially correlated rearrangements appear at larger , but there is no system-spanning shear band. For the well-annealed (?, ?, ?) case quenched from to (IB), the StEP model captures the sharp shear band that emerges at higher strain, along with accompanying the sharp stress drop (Fig. 3A). Features in the stress-strain curves and the softness statistics (Fig. 3A and D) are captured reasonably well by the StEP models, although the StEP models yield at a lower strain than the particle simulations in the brittle case and the stress drop is less pronounced.
For the experimental granular raft pillars (System II) in the elastic regime with , small plastic events are distributed throughout the system; this can be seen in both the StEP model and the experiment for Systems IIA and IIB. As increases to 0.8%, transient shear bands at 45∘ to the principal extension direction are apparent in both the StEP and experimental results. At , system-spanning shear bands appear in both pillars but with a different morphology. For System IIA, where the particle interaction range exceeds the particle size, the shear bands are composed of rather sparse rearrangements and are transient in the StEP model; in the experiment the shear bands are locked in the same location due to necking of the pillar. For System IIB, where the interaction range is smaller than the particle size, the shear band is sharper with much more concentrated plastic events than for IIA, indicating greater strain localization and the location of the shear band is fixed in both the StEP model and experiments. The stress-strain curves, and the evolution of the mean and standard deviation of with strain are captured remarkably well by the StEP models (Fig. 3B and E). The one exception is the standard deviation of softness after the long-lasting shear band forms in the 3.3 mm particle pillar (System IIB). This is expected since is not trained for large fractures in the particle packing.
For the thermal and 3D polymer nanopillar systems (Fig. 2), the StEP model still captures the transition from ductile to brittle behaviors. At large , isolated rearrangements are seen for the higher temperature system at (IIIA), while strain localization and shear banding occur for the lower temperature case at (IIIB) for both the StEP model and simulations. Quantitative comparisons (Fig. 3C and F) show that stress reaches a higher value in the StEP model, but differences between IIIA and IIIB are captured well.
Systems I-III differ in the size of the constituent particles (and hence importance of temperature), inter-particle interactions, system dimension, importance of friction, and preparation history. Yet in all 6 cases, the StEP models describe the simulations or experiments quantitatively, indicating that they capture the salient microscopic differences in the interplay between elasticity, plasticity and the disordered structure.
Elucidating how microscopic mechanisms control ductility
Although preparation history, interaction range and temperature are known to affect strain localization, it is not understood why these factors are important. Unlike EP models, StEP models allow us to gain insight by transmuting these factors into the softness kernel and the softness distribution. In particular, the softness kernel is characterized by near-field and far-field contributions in Eq. 3. By exploring how these two terms, the elastic kernel, the softness distribution and rearrangement size vary between the A and B variations within each system, as well as among our three model systems, we can gain insight into the underlying microscopic mechanisms that control ductility.
For System I, we see from the table in Fig. 1 that Eq. 3 is identical for IA and IB. The only striking difference is in the initial mean softness, . The initial standard deviation of the softness distribution, the relation between and the yield strain , and the size of rearrangements are also slightly different. To determine the significance of each of these factors, we start with System IB (bold black curve in Fig. 3G) and systematically vary each of these parameters (colored curves) one at a time from its value in IB (brittle) to its value in IA (ductile) and assess the effect on the stress-strain curve to see which parameter has the strongest influence. Fig. 3G shows that the only factor that qualitatively affects the stress-strain curve is the initial distribution of . Switching the initial distribution to its value in the ductile case of System IA removes the large stress drop in the stress-strain curve, rendering the system ductile. This implies that the only significant difference between Systems IA and IB is the initial softness. This makes sense; the only difference between Systems IA and IB is in the preparation history, which affects the initial value of . Brittle systems obtained by annealing at lower temperature are more stable (?, ?, ?), leading to lower and hence higher values of the local yield strain from Eq. 2. System I shows that extracting StEP models from particle-level data can lead to correct identification of the microscopic factors controlling strain localization.
For the granular pillars, System II, the values of nearly all of the parameters differ from System IIA to IIB. However, by changing them individually (Fig. 3H) from their values for System IIB (bold black curve) to those for System IIA, we can see that only two sets of parameters make a significant difference to the stress-strain curve. First, one can flatten the curve by reducing the dependence of the yield strain on softness, characterized by the Weibull exponent and mode . Second, the near-field softness change caused by rearrangement, i.e., the first term in Eq. (3), is important. This near-field effect is characterized by the range and offset . System IIA has a larger decay length of and a smaller value of . In other words, rearrangements in System IIB, which has a shorter particle interaction range, alter local yield strain more strongly over a shorter distance. The range of the near-field softness change is comparable to the interaction range.
The values of most of the parameters for the polymer nanopillar StEP models differ from System IIIA to IIIB (table in Fig. 1), but we change them one by one from their values for System IIIB to their values for System IIIA in Fig. 3I. None of them affect the stress-strain curve appreciably except rearrangement size, . The rearrangements in the low temperature system, System IIIB, have a larger size , allowing for more facilitation.
Discussion
For three systems, we have shown that structuro-elasto-plasticity models provide physical insight into the microscopic mechanisms that govern their ductility. The systems were designed to be very different, and we find that the microscopic mechanisms underlying the degree of strain localization are also different. For simulated glasses with different preparation histories, we find that it is the initial distribution of softness, and hence of local yield stress, that controls ductility. For experimental granular pillars with different interaction ranges, it is the sensitivity of local yield strain on local structure and the near-field change of softness due to rearrangements that change, with a larger change of local yield stress occurring over a shorter range in systems with higher strain localization. Finally, for the simulated polymer glass nanopillars, we find that the rearrangement size is larger in cooler systems, allowing for more facilitation and leading to greater strain localization. These insights would not be possible if we had not been able to connect local structure with rearrangement propensity. The introduction of the softness field is critical.
Our results raise the possibility that StEP models could be used to design materials with desired ductility by optimizing over multiple controllable factors. This would be a substantial improvement over empirical approaches. This hope does not seem unrealistic; softness has been proved to be highly predictive of rearrangements in a wide range of disordered solids (?, ?). Moreover, the StEP model framework is highly adaptable, accommodating any structural predictor of rearrangements, as we have shown by introducing a structural predictor of local yield stress obtained using image classification methods instead of the more standard predictor of rearrangements based on a weighted average of two- and three-point structure functions.
It is straightforward to extend StEP models to include dynamics by using time-dependent softness and elastic kernels (?), in order to capture rheology. Like EP models, StEP models can also readily be extended to include local elastic moduli and other effects (?).
Acknowledgements
We thank Misaki Ozawa for providing the initial soft-disk configurations used in this study. Funding: This work was supported by the National Science Foundation through grant MRSEC/DMR-1720530 (D.J.D., R.A.R., H.X., E.Y., G.Z.), and the Simons Foundation via the “Cracking the glass problem” collaboration #45945 (S.A.R., A.J.L.) and Investigator Award #327939 (A.J.L.). The Extreme Science and Engineering Discovery Environment (XSEDE), supported by National Science Foundation grant number ACI-1548562. This work used the XSEDE Stampede2 at the Texas Advanced Computing Center through allocation TG-DMR150034 (E.Y., R.J.S.I, R.A.R.). Author contributions: G.Z. performed simulations for System I, H.X. performed experiments for System II, R.J.S.I. performed simulations for System III, G.Z., H.X., E.Y., R.J.S.I., S.A.R. performed analysis to data and developed the StEP model predictions. G.Z., H.X., R.J.S.I, E.Y. drafted the original manuscript, all participated in reviewing and editing, A.J.L, D.J.D, R.A.R. were responsible for conceptualization, funding acquisition, and supervision. Competing interests: the authors have no competing interests. Materials availability: Materials are available upon request to ajliu@physics.upenn.edu.
References and Notes
- 1. M. L. Falk, J. S. Langer, Deformation and failure of amorphous, solidlike materials, Annu. Rev. Condens. Matter Phys. 2, 353–373 (2011).
- 2. A. Greer, Y. Cheng, E. Ma, Shear bands in metallic glasses, Mater. Sci. Eng. R Rep 74, 71-132 (2013).
- 3. D. Bonn, M. M. Denn, L. Berthier, T. Divoux, S. Manneville, Yield stress materials in soft condensed matter, Rev. Mod. Phys. 89, 035005 (2017).
- 4. A. Tanguy, Elasto-plastic behavior of amorphous materials: a brief review, C. R. Phys. 22, 1–17 (2021).
- 5. E. D. Cubuk, et al., Structure-property relationships from universal signatures of plasticity in disordered solids, Science 358, 1033–1037 (2017).
- 6. M. Falk, Molecular-dynamics study of ductile and brittle fracture in model noncrystalline solids, Phys. Rev. B 60, 7062 (1999).
- 7. O. Dauchot, S. Karmakar, I. Procaccia, J. Zylberg, Athermal brittle-to-ductile transition in amorphous solids, Phys. Rev. E 84, 046105 (2011).
- 8. E. Y. Lin, R. A. Riggleman, Distinguishing failure modes in oligomeric polymer nanopillars, Soft Matter 15, 6589–6595 (2019).
- 9. H. Xiao, R. J. Ivancic, D. J. Durian, Strain localization and failure of disordered particle rafts with tunable ductility during tensile deformation, Soft Matter 16, 8226–8236 (2020).
- 10. S. Karmakar, E. Lerner, I. Procaccia, J. Zylberg, Effect of the interparticle potential on the yield stress of amorphous solids, Phys. Rev. E 83, 046106 (2011).
- 11. M. Ozawa, L. Berthier, G. Biroli, A. Rosso, G. Tarjus, Random critical point separates brittle and ductile yielding transitions in amorphous materials, Proc. Natl. Acad. Sci. U.S.A. 115, 6656–6661 (2018).
- 12. A. Shavit, R. A. Riggleman, Strain localization in glassy polymers under cylindrical confinement, Phys. Chem. Chem. Phys. 16, 10301–10309 (2014).
- 13. K. Matsushige, S. Radcliffe, E. Baer, The pressure and temperature effects on brittle-to-ductile transition in ps and pmma, J. Appl. Polym. Sci. 20, 1853–1866 (1976).
- 14. K. Karimi, D. Amitrano, J. Weiss, From plastic flow to brittle fracture: Role of microscopic friction in amorphous solids, Phys. Rev. E 100, 012908 (2019).
- 15. Z. Wang, et al., Stretchable materials of high toughness and low hysteresis, Proc. Natl. Acad. Sci. U.S.A. 116, 5967–5972 (2019).
- 16. L. Zhang, et al., Using shape anisotropy to toughen disordered nanoparticle assemblies, ACS Nano 7, 8043–8050 (2013).
- 17. P. Sollich, F. Lequeux, P. Hébraud, M. E. Cates, Rheology of soft glassy materials, Phys. Rev. Lett. 78, 2020 (1997).
- 18. H. J. Barlow, J. O. Cochran, S. M. Fielding, Ductile and brittle yielding in thermal and athermal amorphous materials, Phys. Rev. Lett. 125, 168003 (2020).
- 19. M. L. Falk, J. S. Langer, Dynamics of viscoplastic deformation in amorphous solids, Phys. Rev. E 57, 7192 (1998).
- 20. A. R. Hinkle, C. H. Rycroft, M. D. Shields, M. L. Falk, Coarse graining atomistic simulations of plastically deforming amorphous solids, Phys, Rev. E 95, 053001 (2017).
- 21. A. Nicolas, E. E. Ferrero, K. Martens, J.-L. Barrat, Deformation and flow of amorphous solids: Insights from elastoplastic models, Rev. Mod. Phys. 90, 045006 (2018).
- 22. M. Popović, T. W. de Geus, M. Wyart, Elastoplastic description of sudden failure in athermal amorphous materials during quasistatic loading, Phys. Rev. E 98, 040901 (2018).
- 23. A. Barbot, et al., Local yield stress statistics in model amorphous solids, Phys. Rev. E 97, 033001 (2018).
- 24. C. Liu, S. Dutta, P. Chaudhuri, K. Martens, Elastoplastic approach based on microscopic insights for the steady state and transient dynamics of sheared disordered solids, Phys. Rev. Lett. 126, 138005 (2021).
- 25. D. F. Castellanos, S. Roux, S. Patinet, Insights from the quantitative calibration of an elasto-plastic model from a lennard-jones atomic glass, C. R. Phys. 22, 1–28 (2021).
- 26. D. F. Castellanos, S. Roux, S. Patinet, History dependent plasticity of glass: a mapping between atomistic and elasto-plastic models, Acta Mater. p. 118405 (2022).
- 27. E. D. Cubuk, et al., Identifying structural flow defects in disordered solids using machine-learning methods, Phys. Rev. Lett. 114, 108001 (2015).
- 28. S. S. Schoenholz, E. D. Cubuk, D. M. Sussman, E. Kaxiras, A. J. Liu, A structural approach to relaxation in glassy liquids, Nat. Phys. 12, 469–472 (2016).
- 29. D. Richard, et al., Predicting plasticity in disordered solids from structural indicators, Phys. Rev. Mater. 4, 113609 (2020).
- 30. V. Bapst, et al., Unveiling the predictive power of static structure in glassy systems, Nat. Phys. 16, 448–454 (2020).
- 31. J. Paret, R. L. Jack, D. Coslovich, Assessing the structural heterogeneity of supercooled liquids through community inference, J. Chem. Phys. 152, 144502 (2020).
- 32. E. Boattini, F. Smallenburg, L. Filion, Averaging local structure to predict the dynamic propensity in supercooled liquids, Phys. Rev. Lett. 127, 088007 (2021).
- 33. Z. Fan, E. Ma, Predicting orientation-dependent plastic susceptibility from static structure in amorphous solids via deep learning, Nature Commun. 12, 1506 (2021).
- 34. F. Font-Clos, et al., Predicting the failure of two-dimensional silica glasses, Nat. Commun. 13, 2820 (2022).
- 35. G. Jung, G. Biroli, L. Berthier, Predicting dynamic heterogeneity in glass-forming liquids by physics-informed machine learning, arXiv preprint arXiv:2210.16623 (2022).
- 36. G. Zhang, S. A. Ridout, A. J. Liu, Interplay of rearrangements, strain, and local structure during avalanche propagation, Phys. Rev. X 11, 041019 (2021).
- 37. G. Zhang, et al., Structuro-elasto-plasticity model for large deformation of disordered solids, Phys. Rev. Res. 4, 043026 (2022).
- 38. See Supplemental Material at [URL will be inserted by publisher].
- 39. R. J. S. Ivancic, R. A. Riggleman, Identifying structural signatures of shear banding in model polymer nanopillars, Soft Matter 15, 4548–4561 (2019).
- 40. Z. Budrikis, S. Zapperi, Avalanche localization and crossover scaling in amorphous plasticity, Phys. Rev. E 88, 062403 (2013).
- 41. C. E. Maloney, A. Lemaitre, Amorphous systems in athermal, quasistatic shear, Phys. Rev. E 74, 016118 (2006).
- 42. G. Picard, A. Ajdari, F. Lequeux, L. Bocquet, Elastic consequences of a single plastic event: A step towards the microscopic modeling of the flow of yield stress fluids, Eur. Phys. J. E 15, 371–381 (2004).
- 43. T. Albaret, A. Tanguy, F. Boioli, D. Rodney, Mapping between atomistic simulations and eshelby inclusions in the shear deformation of an amorphous silicon model, Phys. Rev. E 93, 053002 (2016).
- 44. L. Berthier, P. Charbonneau, A. Ninarello, M. Ozawa, S. Yaida, Zero-temperature glass transition in two dimensions, Nat. Commun. 10, 1–7 (2019).
- 45. M. Singh, M. Ozawa, L. Berthier, Brittle yielding of amorphous solids at finite shear rates, Phys. Rev. Mater. 4, 025603 (2020).
- 46. E. Yang, et al., Understanding creep suppression mechanism in polymer nanocomposites through machine learning, arXiv preprint arXiv:2204.11996 (2022).
- 47. M. Ozawa, L. Berthier, G. Biroli, G. Tarjus, Role of fluctuations in the yielding transition of two-dimensional glasses, Phys. Rev. Res. 2, 023203 (2020).
- 48. S. Zagoruyko, N. Komodakis, Wide residual networks, arXiv preprint arXiv:1605.07146 (2016).
- 49. A. Nicolas, J.-L. Barrat, A mesoscopic model for the rheology of soft amorphous solids, with application to microchannel flows, Faraday Discuss. 167, 567–600 (2013).
- 50. E. Yang, R. A. Riggleman, Role of local structure in the enhanced dynamics of deformed glasses, Phys. Rev. Lett. 128, 097801 (2022).