Ultrasonic Study of Water Adsorbed in Nanoporous Glasses
Abstract
Thermodynamic properties of fluids confined in nanopores differ from those observed in the bulk. To investigate the effect of nanoconfinement on water compressibility, we performed water sorption experiments on two nanoporous glass samples while concomitantly measuring the speed of longitudinal and shear ultrasonic waves in these samples. These measurements yield the longitudinal and shear moduli of the water laden nanoporous glass as a function of relative humidity that we utilized in the Gassmann theory to infer the bulk modulus of the confined water. This analysis shows that the bulk modulus (inverse of compressibility) of confined water is noticeably higher than that of the bulk water at the same temperature. Moreover, the modulus exhibits a linear dependence on the Laplace pressure. The results for water, which is a polar fluid, agree with previous experimental and numerical data reported for non-polar fluids. This similarity suggests that irrespective of intermolecular forces, confined fluids are stiffer than bulk fluids. Accounting for fluid stiffening in nanopores may be important for accurate interpretation of wave propagation measurements in fluid-filled nanoporous media, including in petrophysics, catalysis, and other applications, such as in porous materials characterization.
I Introduction
Since the time of Lord Kelvin [1] and Derjaguin [2, 3], numerous works have demonstrated that confinement affects fluid behavior, such as: evaporation/condensation and freezing/melting phase transitions [4, 5, 6], transport properties [7, 8], and derivative thermodynamic properties, such as the thermal expansion coefficient [9, 10] and compressibility [11, 12].
Over the past two decades an additional motivation for studying confined fluids emerged from the shale revolution. Extended reach horizontal drilling and hydraulic fracturing unlocked the potential of unconventional oil and gas assets commonly referred to as oil and gas shale. This industrial paradigm shift motivated interest in developing petrophysical techniques to characterize these assets. Conventional petrophysics is primarily concerned with mechanisms active on a length scale greater than one micron [13]. In contrast, unconventional oil and gas reservoirs primarily consist of oil and gas confined in nanoporous mudstones [14].
The seminal works of Gassmann [15] and Biot [16, 17] showed how the elastic properties (compressibility, or, the reciprocal property, bulk modulus) of a pore fluid contribute to the effective mechanical and elastodynamic response of a saturated porous medium. A number of petrophysical sonic logging techniques exploit this poromechanical response to infer the pore fluid properties. Elastic properties of a porous medium (be it dry or saturated with a fluid) can be inferred by measuring the speed of various stress waves. Utilizing several fluids, previous experimental studies explored the relationship between sound speed and relative saturation of nanoporous media [18, 19]. All previous work indicates that fluids confined to nanopores exhibit elastic properties that deviate from those in the bulk [20, 21, 22, 11, 23, 24, 25, 26]. Recent density functional theory calculations [27, 28] and molecular simulations [29, 30, 31] confirm these observations.
While natural geological materials are of primary practical interest, these materials are characterized by a great deal of complexity such as a broad pore size distribution, and the presence of multiple components with disparate chemical makeup. To understand how confinement affects the elasticity of the fluid, it is more convenient to use a simpler porous medium with a single solid phase and a microstructure characterized by a large surface area and narrow pore size distribution. Since we use sound to probe the mechanical properties, it is also preferable to work with a monolithic porous sample as opposed to granular media, which are known to exhibit large sound speed variations as a function of sample preparation (e.g., leading to different packing densities between samples or even inhomogeneities within the same sample). Vycor glass is a suitable model nanoporous medium that adheres to the constraints listed above, and the solid skeleton is silica, a primary component in many rocks, including mudstones. Moreover Vycor has been utilized in the adsorption-ultrasonic studies mentioned above, focused on confined liquid nitrogen [20, 26], argon [22, 11, 24, 25] and linear alkanes [21, 23]. In addition, there are numerous experiments concerned with water confined in Vycor glass that explored adsorption-induced deformation [32, 33], freezing [34, 35], imbibition [36, 37, 38], the temperature of maximum density [39], and the structure and fluid dynamics of water in the pores [40, 41, 42, 43]. Note that Murphy [44] carried out an adsorption-acoustic study of water in Vycor glass, but focused on the attenuation of low-frequency acoustic waves, and did not probe the elasticity of water in the pores. Cucini et al. also studied sound propagation in water-saturated Vycor glass, focusing on the dynamics of water in nanopores, but not the elasticity [45]. Thus, there are no experiments focused on the effect of nanoporous confinement on the compressibility of water via adsorption-acoustic methods. Here we present the first experimental study of water vapor adsorption on nanoporous glass samples accompanied with in situ ultrasonic measurements, probing the elasticity of water-laden porous glass. Contrary to similar previous experimental work [20, 21, 22, 11, 24, 25, 26] that utilize non-polar fluids, water is polar so it may interact differently with the glass surface. Furthermore, water is a substance ubiquitous in nature and is relevant to the geological context discussed previously.
We performed water sorption experiments on two nanoporous glass samples while concomitantly measuring the speed of longitudinal and shear ultrasonic waves in these samples. This includes both the adsorption and desorption branches of the isotherm. Using these measurements, we calculated the longitudinal and shear moduli of the samples as a function of relative humidity (RH). These moduli are then used to compute the bulk modulus, which shows a sharp increase for both samples when the pores become completely filled with the liquid water. These elevated bulk moduli of fully saturated samples are then used to infer the bulk modulus of the confined water using the Gassmann theory. Our observations also show a significant hysteresis effect, in which the moduli remain elevated until capillary evaporation of the pore fluid occurs. The bulk modulus of confined water estimated with the Gassmann model is higher than the modulus of the bulk water obtained from an equation of state. Our observations are consistent with previous experimental and computational studies on non-polar liquids, which suggests that confinement enhances liquid modulus irrespective of molecular characteristics like polarizability.
II Methods
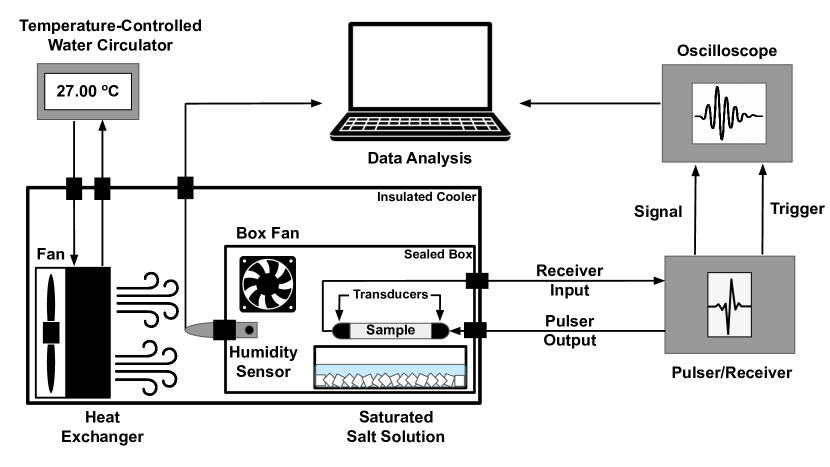
In general, our approach consists of measuring the speed of stress waves through a nanoporous medium as the porosity is gradually filled with liquid water. The water saturation is controlled by varying the relative humidity around the two nanoporous samples. Since we can not measure the time of flight and weight of the sample at the same time, after the RH equilibrates, the time of flight is recorded on one sample, and the other sample is weighed, then the RH is adjusted to a new value. These steps are repeated until both the adsorption and desorption isotherms are complete. Then the samples are swapped and the entire set of measurements is repeated. A schematic of the adsorption-ultrasound system is shown in Figure 1, and the measurements are described in greater detail below.
II.1 Porous Glass
This study was conducted on two nanoporous glass rods of similar composition and pore structure, which will be referred to as samples “V” and “C”. Sample V was Corning Vycor glass (No. 7930) with diameter 0.635 cm and length 2.540 cm. Vycor is an optically transparent porous glass, which is mostly silica. Its structure is comprised of worm-like channel pores with a mean diameter of 7-8 nm. Due to its accessible and well-defined pore space, optical transparency, and ability to be manufactured in a variety of shapes, Vycor has been utilized as a model porous medium for studying the physics of confined phases for several decades [32, 44, 20, 21, 41, 35, 36, 37, 11, 24, 42, 43, 26]. Sample C was a controlled-pore glass with diameter 0.622 cm and length 3.544 cm. The physical properties of both samples are listed in Table 1. All dimensional measurements have an uncertainty of 0.002 cm. The apparent density is the mass of the dry sample divided by the measured volume, which includes pore volume. The solid density is calculated as the dry mass divided by the solid volume [measured volume multiplied by ].
Both samples were characterized by nitrogen adsorption porosimetry to determine the porosity and pore size distributions. Adsorption isotherms of nitrogen at 77 K were measured with the volumetric adsorption instrument Autosorb-1C (Anton Paar). The samples were out-gassed using a turbomolecular pump to residual pressure below at for 16 hours prior to running the isotherms. The entire monolithic glass rods (with mass exceeding 1 g in both cases) were used for the measurements. Due to the large size, the measurements took four days, over which the Dewar was carefully refilled with nitrogen when the pressure was greater than that corresponding to capillary condensation. The pore-size distributions (PSD) was calculated using the non-local density functional theory (NLDFT) model for cylindrical pores. The adsorption branch was used to determine the PSD along with the model for metastable adsorption, as in Ref. 46. The PSD of Vycor glass is in good agreement with previously reported measurements [47].
The samples used in this study were exposed to ambient air before and during the experiments detailed herein. At the end of adsorption-ultrasonic experiments the samples were vacuumed and heated. As a result of heating the samples became yellow in color (Figure A3). The color was likely caused by products of thermal decomposition of trace organic molecules adsorbed from air.
| Property | Sample V | Sample C |
|---|---|---|
| Dry mass (g) | 1.1363 0.0001 | 1.6161 0.0001 |
| Porosity, | 0.330 0.001 | 0.332 0.001 |
| Apparent density () | 1.412 0.009 | 1.486 0.009 |
| Solid density () | 2.108 0.007 | 2.247 0.008 |
| Mean pore diameter (nm) | 7.5 | 7.2 |
| Specific surface area () | 145 | 158 |
| Specific pore volume () | 0.220 | 0.225 |
II.2 Humidity Control
Water sorption experiments were carried out in humid air. The RH , is the ratio of the partial vapor pressure, , to the saturation vapor pressure of water, . The RH is controlled by placing various salt solutions (following Yurikov et al. [48]) in a hermetically sealed 2.5 L anaerobic box (AnaeroPackTM rectangular jar, Thermo ScientificTM R681001). Each solution contained enough excess salt to yield precipitate so the water activity remained constant. A list of salt solutions and the corresponding RH at room temperature is shown in Table 2. We added multiple wire feed-throughs to the box that permitted continuous monitoring of the relative humidity in the chamber using a VernierTM sensor with accuracy of 2% RH, a resolution of 0.01% RH, and a response time (time for a 90% change in reading) of 40 seconds in well-mixed air. A 40 mm, 12V DC box fan continuously mixed the air in the box. Finally the box was placed in a Coleman 48 quart beverage cooler equipped with a finned shell-and-tube heat exchanger and a 120 mm 24V DC box fan. Temperature-controlled water was pumped through the heat-exchanger by a FisherbrandTM IsotempTM bath circulator, model 6200 R20, with the temperature set to ∘C.
| Salt name | Formula | RH (%) |
|---|---|---|
| Lithium chloride | 12 | |
| Potassium acetate111The data for potassium acetate is not included in the results, it is addressed in the Appendix. | 24 | |
| Calcium chloride | 30 | |
| Potassium carbonate | 45 | |
| Magnesium nitrate | 53 | |
| Sodium bromide | 58 | |
| Sodium chlorate | 75 | |
| Sodium chloride | 77 | |
| Ammonium sulfate | 81 | |
| Potassium bromide | 84 | |
| Potassium bisulfate | 86 | |
| Potassium chloride | 88 | |
| Sodium sulfate | 93 | |
| Potassium sulfate | 98 |
II.3 Ultrasonic Measurements
The sample was held between two transducers, using 0.172-mm-thick nitrile rubber as a couplant, with a custom-built clamp assembly. The assembly contains three springs to press the transducers against the ends of the sample (see Appendix, Fig. A3). We used longitudinal and transverse contact transducer pairs (Olympus, part numbers V1091 and V157-RM, respectively) with fundamental frequency and diameter . The source transducer was connected to a Pulser/Receiver (JSR Ultrasonics brand DPR300), which generates negative spike pulses 10 – 70 ns in duration. The receiving transducer was used to record the transmitted signal. The pulse repetition rate was set to 100 pulses per second at 100 – 250 V output. The pulser simultaneously sends a square wave trigger to the oscilloscope (Tekronix DPO2000B, 200 MHz, 1 GS/s, 1M record length) used to monitor the receiving transducer. Once the oscilloscope is triggered, defining , the transmitted waveform was logged at a rate of 250 MHz. The oscilloscope was set to trigger at an amplitude of 1.4 V on the rising edge of the square trigger wave. The exact triggering amplitude had no effect on the time of flight. A single measurement consisted of averaging 512 transmitted waveforms to improve the signal to noise ratio.
II.4 Gravimetric Measurements
While the ultrasonic measurements were performed on sample clamped between the transducers, the mass of the companion sample was concurrently monitored to determine the mass of water adsorbed. The companion sample sat on a watch glass adjacent to the mounted sample. After the relative humidity stabilized, and the time of flight was measured, the box was opened momentarily to remove the companion sample for weighing. The mass was measured on a Mettler AT261 DeltaRange analytical balance (weighing capacity 205 g), with a linearity of 0.15 mg. The time necessary to accurately measure the mass (seconds) was very short relative to the characteristic time for water vapor equilibration within the sample (hours). Initially, water uptake in sample C was monitored while measuring the sound speeds on sample V. After completing the adsorption and desorption branches, the samples were swapped and the experiments were repeated to obtain a complete data set.

II.5 Data Analysis
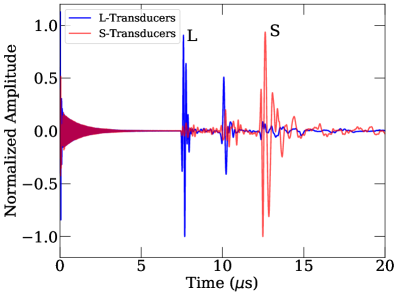
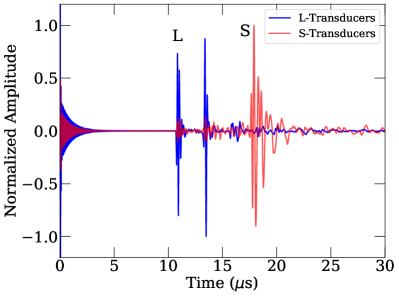
Typical waveforms recorded in this study are given in Fig. 2, which shows the signals produced by longitudinal and shear transducers. The time of flight is determined using a standard cross-correlation technique where the transmitted waves are correlated with a reference waveform. The latter is given by measuring the signal across two transducers clamped together, but separated by the nitrile couplant. Figure 3 shows a comparison of the waveform measured through a porous glass sample, and the waveform observed with the transducers clamped together after, which was shifted to maximize the correlation coefficient. The vertical dashed line indicates the time of flight determined from the cross correlation. The cross correlations were performed using the Python library “scipy.signal.correlate”, which follows a standard approach used in signal processing [50]. The wave features between the longitudinal and shear waves seen in Fig. 2 appear for samples which are smaller in diameter than the transducers, which is the case for the both samples considered here. This was additionally confirmed by performing the measurements on non-porous borosilicate glass samples of different diameters and lengths.
Another method to determine time of flight involved fitting the initial descent of the waveform to a linear function. The intersection of that line with the x-axis was defined as the arrival time. The two methods differed by , corresponding to less then 0.3%. For consistency, the results presented here rely on the cross correlation method.
The time of flight for the independent longitudinal and shear arrival are used to determine the corresponding sound speed given the sample length ( and , respectively). The sound speed is then combined with the sample density, , to determine the longitudinal and shear moduli ( and , respectively):
| (1) |
These moduli are then used to calculate the bulk modulus, by the relation:
| (2) |
This quantity represents the bulk modulus of the composite (nanoporous glass + adsorbed water). When the pores are completely filled with fluid, can be related to the bulk moduli of the constituents by the Gassmann equation [15, 30],
| (3) |
where is the sample porosity, is the bulk modulus, and the subscripts , , and correspond to that of dry porous body, the solid phase, and the pore fluid, respectively. It is convenient to rearrange Eq. 3 to solve for the quantity of interest, the bulk modulus of the confined fluid:
| (4) |
The parameter is estimated using the modified Kuster and Toksöz (KT) effective medium theory [51, 52, 53], which gives and when , , and are known. A summary of the KT theory used to determine is in the Appendix. This theory is written for cylindrical pores, which is a reasonable approximation of the worm-like pores in the samples studied in this work.
To measure the dry elastic properties, both samples were out-gassed at for 24 hours before being transferred to a glove bag purged of ambient air and refilled with nitrogen. The ultrasound speed was measured using a combination of longitudinal and shear transducers, after which the samples were removed from the bag to measure their mass. Following these measurements, to drive off chemically adsorbed water from the pore surface, the samples were heated to at . At these conditions, the samples were allowed to out-gas for 24 hours before cooling to room temperature. Ultrasonic and gravimetric measurements were then taken in the same manner as described above.
Following the aforementioned measurements, the samples were washed in a 30% solution of hydrogen peroxide at to oxidize and remove trace organics from the pore surface. During washing, the samples lost their yellow tint and became clear. The samples were then transferred into deionized water to remove the peroxide solution. The above described vacuum measurements were repeated on the cleaned samples. We note here that the elastic properties of Vycor glass are sensitive to temperature. In particular, Scherer [54] has shown that heat can irreversibly stiffen nanoporous glass. For this reason, we estimate the fluid bulk modulus using the dry mechanical properties obtained from the vacuum measurements described above, before the first heating cycle. The results of later measurements are provided in the Appendix.
III Results
III.1 Nitrogen Gas Adsorption
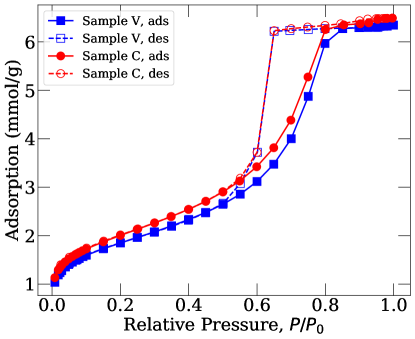
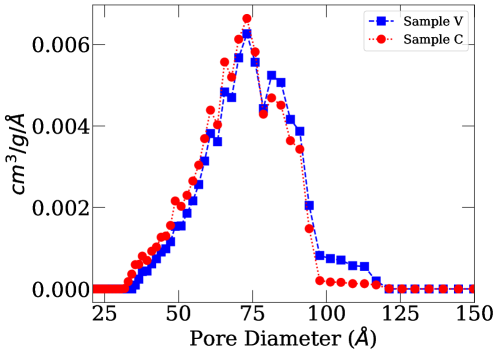
The nitrogen adsorption isotherms are shown in Figure 4, which indicates the responses are nearly indistinguishable between the samples. Prior to the capillary condensation, sample C adsorbs slightly more nitrogen than sample V, whereas the plateaus and the capillary evaporation regions are practically identical for the two samples. Abrupt, and nearly complete capillary evaporation occurs at the same relative pressure, , indicating that access to the porosity occurs through pores of a similar size. Figure 5 shows the pore size distribution (PSD) determined from the adsorption branch of the isotherm. Again, the pore size distributions of the samples are very similar, with the small difference observed near the tail corresponding to the largest pore diameters.
III.2 Water Adsorption Isotherms
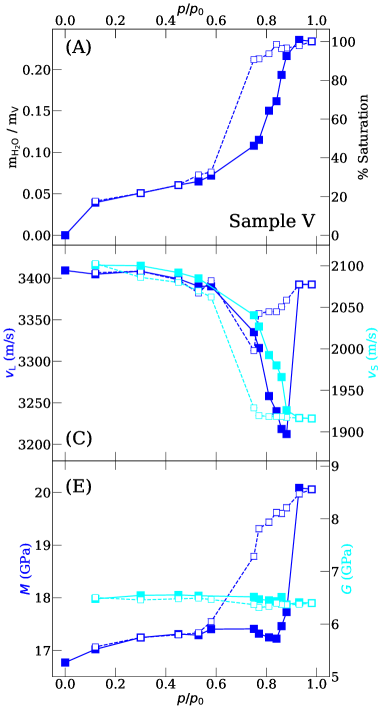
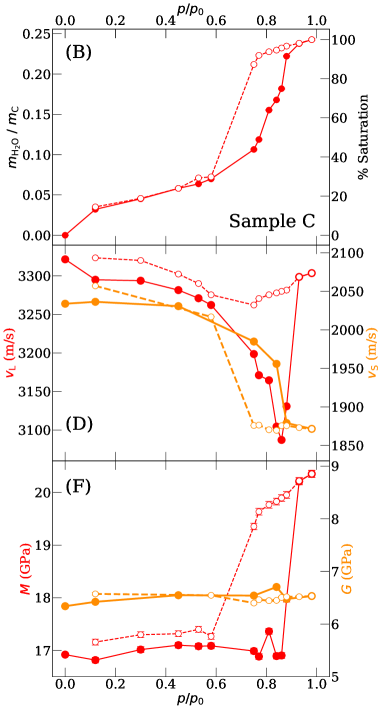
The relative mass of adsorbed water and saturation determined from the gravimetric measurements are shown in Fig. 6(A,B). Saturation is estimated as , where is the change in sample mass at a given relative humidity, and is the change in sample mass at RH 98%. Since the mass uptake is largely complete above RH=0.9, is a measure of the relative pore volume filled with water.
The isotherms are type IV, in agreement with the well-established adsorption data for water in Vycor glass [32, 55]. Vertical error bars represent the precision of the dry mass of both samples and of the balance used to measure the mass at subsequent relative pressures. The point at the origin is not measured, but it is reasonable to assume there is no adsorbed fluid at a relative pressure of zero. As humidity rises, the amount of water adsorbed gradually increases. In the region below the knee in the curve (e.g. 0.2), a monolayer of water forms on the internal surface. Capillary condensation begins near a relative pressure of 0.75, where the water bridges the gap between the pore walls and fills the pores.
III.3 Longitudinal and Shear Wave Speeds
The longitudinal and shear wave speeds are shown in Fig. 6(C,D) for both samples (using the same vertical scale for both speeds). Each data point represents the average of up to 10 time of flight measurements taken several hours after the RH stabilized. As previously indicated, the speeds were determined from time of flight by cross-correlation with the waveform measured with no sample. The time of flight varied by no more than 0.1% over several hours after the RH stabilized. The error bars account for this variation, and the error associated with measuring the sample length. In most cases the range of the error is smaller than the markers on the plot.
Both samples exhibit similar behavior with respect to sound propagation throughout the adsorption and desorption processes. As RH increases, the sound speeds (both longitudinal and shear) gradually decrease, followed by a steeper decline with the onset of capillary condensation. The minimum in is observed around 0.85, where the adsorbed fluid almost completely fills the pores. For longitudinal waves, this is followed by a marked increase in speed. In contrast, levels off and continues gradually decreasing as maximum saturation is reached. At the beginning of desorption, gradually decreases while increases, following the same slope observed during the end of adsorption. As the hysteresis in mass adsorption closes, both speeds rise back toward the values observed at the lowest relative humidity. The increase in is more dramatic than in , resembling the hysteresis loop observed in the adsorption isotherms.
The longitudinal and shear wave speeds in sample C exhibit a hysteresis gap (30 and 20 , respectively) that remains open below 0.6. To ensure that this is not an artifact of the cross-correlation technique (e.g. caused by a difference in the shape of the waveforms), the sound speed was also determined by comparing only the initial descent of each waveform. With this method, the difference between adsorption and desorption decreased but remained noticeable (20 ). We note that prior to the experimental results presented in this work, sample V was used for initial adsorption and ultrasonic testing. During these tests, sample V was exposed to humidity swings between 12% and 98%. It is plausible that sample V had already undergone its adsorption-induced hysteresis.
III.4 Elastic Moduli
Figs. 6E and 6F show the longitudinal and shear moduli of both samples using the same vertical scale for both moduli. The moduli were calculated using Eq. 1, where we account for changes in sample density associated with water vapor sorption. In contrast to observations concerning the sorption of hexane [21] and argon [24] in Vycor, the longitudinal modulus of the glass sample with water slightly increases at low relative pressures. The increase levels off near 0.6, followed by a decrease until 0.85. After capillary condensation, increases sharply, mimicking . On desorption, remains elevated until the sorption hysteresis loop closes, indicating evaporation of the pore fluid. This is the case for longitudinal modulus of both samples. In contrast, the shear modulus remains constant throughout the vapor sorption cycle. The bulk modulus , calculated from Eq. 2 and shown in Fig. 7, exhibits similar behavior for both samples.
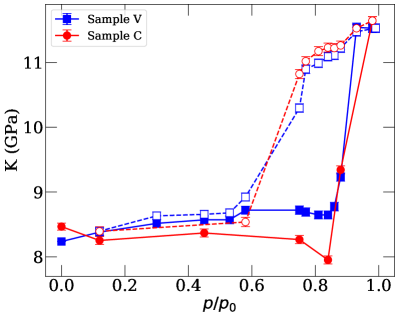
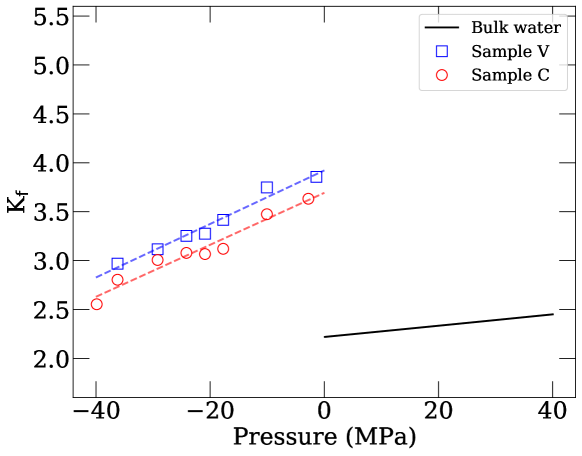
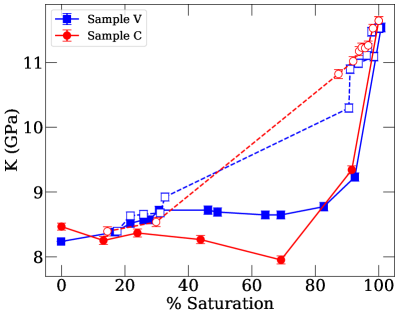
The values of observed while water fully occupies the pore volume (RH during the adsorption, and RH during desorption) are used to calculate the isothermal bulk modulus of confined liquid water using Eq. 4. The resulting fluid bulk modulus is shown in Fig. 8. We refer to this quantity as “isothermal” but note that the heat capacity ratio of liquid water at 1 and 300 is 1.012 [56], making the difference between isothermal and adiabatic bulk modulus negligible. Previous studies [11, 21, 12] report a linear relation between a fluid’s bulk modulus and the Laplace pressure, :
| (5) |
where is the ideal gas constant, is the absolute temperature, and is the molar volume of the fluid. Figure 8 shows the values of determined in this work along with the isothermal bulk modulus of water in the bulk as a function of or the bulk pressure, respectively. is calculated from Eq. 4 using the values of and listed in Table 3. The isothermal bulk modulus data for liquid water at 27 oC is calculated using the CoolProp Python library [56], which utilizes the equation of state by Wagner and Pruß [57]. It is worth noting that at relative pressures below 1.0, is negative indicating the confined water is under suction. The data corresponding to positive pressure represents the isothermal bulk modulus of bulk water.
| () | () | () | () | ||
|---|---|---|---|---|---|
| Sample V | 16.77 0.06 | 6.40 0.02 | 8.24 0.06 | 0.192 0.002 | 18.12 |
| Sample C | 16.92 0.06 | 6.34 0.03 | 8.46 0.06 | 0.200 0.003 | 19.13 |
| Sonic Resonance [54] | 15.64 111Scherer et al. report the Young’s modulus, , of their porous sample. Along with their reported shear modulus and Poisson’s ratio, it is possible to calculate the longitudinal and bulk moduli. | 6.34 | 7.19 111Scherer et al. report the Young’s modulus, , of their porous sample. Along with their reported shear modulus and Poisson’s ratio, it is possible to calculate the longitudinal and bulk moduli. | 0.15 | 15.37 |
| Beam-bending [58] | 15.9 | 6.08 | 7.8 | 0.16 | 14.3 |
| Pulse-Echo [11] | 16.88 | 6.86 | 7.73 | 0.23 | 10.48 |
IV Discussion
IV.1 Comparison of Water Adsorption Isotherms
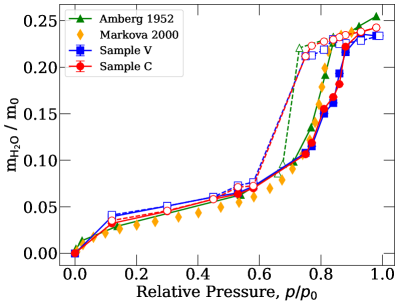
Figure 9 includes data from previous works concerning water adsorption in Vycor. Overall, there is fairly good agreement along the adsorption branches. While Amberg and McIntosh observe a smaller hysteresis loop during desorption, we are unable to reproduce this in our samples due to the lack of an appropriate desiccant between 58 and 75% RH. Furthermore, we observe good agreement between samples V and C, reflecting their similar composition and pore size distribution.
IV.2 Applicability of the Gassmann Theory
The Gassmann equation, which is used here to relate the measured modulus of the solid-fluid composite to the moduli of constituents, was originally derived for quasi-static deformations (e.g., the elastic properties must be probed by small perturbations). Therefore, we must consider the relevance of this theory to moduli inferred from the transmission of ultrasound. One constraint in the Gassmann theory is the average pore radius must be much smaller than the viscous skin depth of the fluid , where and are the dynamic viscosity and density of the pore fluid, respectively, and is the frequency of the propagating wave. The transducers used in this work have a nominal frequency of 5 MHz. We estimate the density of water in the pores at 100% saturation as . Assuming the dynamic viscosity of liquid water, at 27 is unaffected by confinement, the viscous skin depth can be estimated as . For a more conservative estimate, we consider the maximum exhibited frequency of the transducers, 10 MHz, resulting in a viscous skin depth of . The pores in either sample are 7 nm, which is at least an order of magnitude smaller than the minimum viscous skin depth .
Another stipulation of the Gassmann theory is that the constituent fluid has a shear modulus of zero, so that the shear modulus of the composite is not affected by fluid adsorption. In our case, the shear moduli of both samples are constant throughout sorption cycle. The Gassmann theory also requires the frequency to be sufficiently low for the fluid pressure to equilibrate throughout the pore space within one wave period. This requires that the frequency be much lower than the characteristic frequency of the squirt-flow relaxation, which is on the order of , where is the (smallest) pore aspect ratio in the system (see, e.g., [59], Chapter 6). For frequencies higher than , the shear modulus of the fully-saturated sample should be significantly higher than for the dry sample [60, 59]. The fact that our measurements (as well as ultrasonic measurements on Vycor during adsorption of nitrogen [20] and argon [11]) show a constant shear modulus in the entire range of liquid saturation from 0 to 100% confirms that Vycor has no pores with very small aspect ratios (cracks). Finally, we note that the Gassmann theory requires that the wavelength of the probing ultrasound be much smaller than the diameter of the porous sample. In our experiments, the wavelength never exceeds , which is more than nine times smaller than the diameter of either sample.
IV.3 Comparison of Samples V and C
The water adsorption isotherms in Fig. 6 are plotted as the mass of water adsorbed divided by the dry mass of each sample, so that the isotherms can be objectively compared. The samples exhibit close agreement until the end of capillary condensation on the adsorption branch ( 0.85), after which the relative mass adsorbed in sample C is greater than that observed in sample V. On the desorption branch, this difference persists until the beginning of capillary evaporation ( 0.75), where the hysteresis loop begins to close.
Qualitative agreement between the samples is also observed for the sound speeds, and the inferred moduli. Subtle quantitative differences can be attributed to the initial properties of both samples. For instance, the longitudinal and shear moduli are similar but and differ between each sample by more than 100 due to the samples having different solid densities (see Table 1).
IV.4 Mechanical Properties of Dry Samples and Confined Water
In Table 3, the calculated mechanical properties of samples V and C are presented alongside those reported by Scherer et al. for the same material via sonic resonance [54] and by a beam-bending method [58], as well as Schappert and Pelster who used pulse-echo ultrasound measurements [11]. While the shear modulus of both samples agrees with the literature sources, we observed longitudinal moduli higher than any of the listed values. This leads to higher values for and . Table 3 also shows the Poisson’s ratio of the dry samples:
| (6) |
Note that the bulk modulus of the fluid from Eq. 4 is sensitive to the values of and , where the latter is the main source of potential uncertainties. If the dry elastic constants reported by Scherer et al. and Schappert and Pelster are used to calculate of Vycor glass via the modified KT theory, inferred from the Gassmann theory will differ from the results in Figure 8, as discussed in Ref. [30]. We find that a hypothetical underestimate of by 10% or 20% causes an overestimate of by 20% and 50%, respectively.
Irrespective of the values for the and , the fluid bulk modulus is linearly dependent on the pressure of the fluid in the pores (represented here by the Laplace pressure for simplicity) [61, 27], which is consistent with the Tait-Murnaghan equation [62, 63]:
| (7) |
where . Previous molecular simulation studies suggested that for argon or nitrogen in silica pores is similar to that for bulk liquid argon [64, 65, 29], or liquid nitrogen [31], respectively. However, Figure 8 indicates confined water exhibits a different than that exhibited by bulk water (). In particular, for sample V and for sample C. These deviations are too high to be explained by uncertainties in the modulus used for calculation of from the experimental data.
Molecular simulation parametric studies of confined argon showed that when the solid-fluid interactions are stronger, the parameter increases [65]. It could be that confinement affects the parameter for water differently than for simple fluids, such as nitrogen or argon. More insight into of confined water can be obtained from experiments and simulations of water in nanopores of various compositions.
V Conclusion
To investigate the compressibility of confined water, we performed water vapor sorption experiments on two nanoporous glass samples and concomitantly monitored the effect on longitudinal and shear sound speed. Using the measured density of the water laden glass, we infer the longitudinal and shear moduli as a function of relative humidity. The longitudinal modulus varied with relative humidity, while the shear modulus did not change. Therefore, we utilized the Gassmann theory to infer the bulk modulus of water confined in the saturated glass. For both of the porous samples, we find that the modulus of confined water is consistently greater than that of bulk liquid water at the same temperature. Furthermore, the modulus of the confined water exhibited a linear dependence on Laplace pressure. Altogether these observations are consistent with previously reported data on non-polar fluids, such as nitrogen or argon, suggesting that confinement causes significant stiffening for any fluid. Note, modulus increase reported here is more pronounced than that reported for the noted non-polar fluids confined to the same nanoporous glass.
This work should assist with the progression towards borehole based ultrasonic measurements to probe natural nanoporous media, such as shale and coal, in order to detect specific confined fluids. While we investigated the effects of confinement on one fluid found in subsurface reservoirs, additional work is necessary to yield a useful measurement technique. In particular, similar studies using other relevant fluids, like hydrocarbons or salt solutions, or nanoporous media with a range of physical properties would aid in assessing the utility of ultrasound to excite a characteristic response.
VI Data Accessibility
The raw data for Figures 4-9 and A2 are available as a GitHub repository [66]. Each file is written in plain text (.txt) or comma-separated values (.csv), and named for each respective figure.
Acknowledgements.
G.Y.G., A.K. and A.F.K. thank the support from New Jersey Institute of Technology Seed Grant, and NSF CBET-2128679 grant. J.O. thanks the NJIT Provost URI Summer Research Fellowship and the McNair Postbaccalaureate Achievement Program. We thank George Scherer for providing a number of comments that helped improve the manuscript.Appendix A Additional Experimental Details
A.1 Estimates of Dry Properties After Vacuum Out-Gassing
The following tables show the results of ultrasound speed measurements to calculate the elastic properties of samples V and C after out-gassing at a pressure of , as outlined in the methods section of the main text. The samples were first out-gassed at room temperature, then at . Since darkening of the samples was observed after heating, the samples were then washed, and the above measurements were repeated. The tables also show the resultant bulk modulus of water from Eq. 4, using the corresponding dry and solid bulk moduli. The values obtained from the “pre-wash, ambient” (not heated, not washed) measurements are used for calculating .
After the experiments presented in the main text, one of the shear ultrasonic transducers became inoperable. For this reason, the travel time of shear waves needed to be recorded using the pulse echo method. In sample V, this proved difficult due to its shorter length and the presence of noise in the signal, but the travel time of both longitudinal and shear waves could be measured successfully in sample C. Further, during the second ambient vacuum cycle, sample V developed a fracture along the axial direction near the center of the sample. Attempts at ultrasonic measurements on this sample were unsuccessful. To prevent additional damage, sample V was not heated for a second time. Throughout these experiments, sample C remained intact and permissive to ultrasonic testing.
For the reasons explained above, in Table A1, the shear modulus of sample V for the pre- and post-wash measurements is estimated based on the relative change in the shear modulus of sample C. The same estimation is made for the longitudinal modulus of the post-wash measurements. Both samples exhibited quantitatively similar relative changes of these properties during water adsorption.
| () | () | () | () | () | ||
|---|---|---|---|---|---|---|
| 12% RH | 17.02 | 6.48 | 8.38 | 0.193 | 18.46 | 3.635 |
| Pre-wash, ambient | 16.77 | 6.40 | 8.24 | 0.192 | 18.12 | 3.855 |
| Pre-wash, | 17.54 | 6.95 | 8.27 | 0.172 | 17.42 | 4.114 |
| Post-wash, ambient | 16.45 | 6.40 | 7.91 | 0.181 | 16.98 | 4.561 |
| Post-wash, | 17.72 | 6.90 | 8.51 | 0.181 | 18.26 | 3.609 |
| () | () | () | () | () | ||
|---|---|---|---|---|---|---|
| 12% RH | 16.82 | 6.42 | 8.25 | 0.191 | 18.24 | 4.074 |
| Pre-wash, ambient | 16.92 | 6.34 | 8.46 | 0.200 | 19.13 | 3.621 |
| Pre-wash, | 18.05 | 6.89 | 8.87 | 0.192 | 19.79 | 3.127 |
| Post-wash, ambient | 16.93 | 6.35 | 8.47 | 0.200 | 19.13 | 3.616 |
| Post-wash, | 18.24 | 6.84 | 9.11 | 0.200 | 19.13 | 3.116 |
A.2 Ultrasonic Attenuation
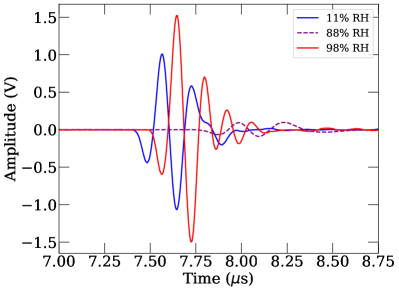
In certain regions of , the amplitude of measured ultrasound waves dropped precipitously, followed by recovery. In both samples, this occurred at 0.84 – 0.88 on adsorption and 0.88 – 0.75 on desorption, with the former being more prominent than the latter. During desorption, attenuation began at , gradually increased and peaked at 0.75, just before the pores emptied. Figure A1 exemplifies the waveforms at three distinct values of humidity. The attenuation was observed qualitatively for both longitudinal and shear waves. On desorption, at the same time as attenuation was observed, the samples became white and opaque to light.
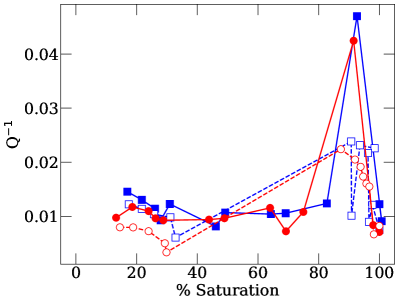
During capillary condensation (, adsorption) and emptying (, desorption), the amplitude of ultrasound waves shows a significant decrease in both samples. Fig. A2 (a) shows the dimensionless attenuation () computed using the spectral ratio method [67] as a function of water saturation. is a dimensionless measure of attenuation commonly used in the theory of viscoelasticity and geophysics, and corresponds to the energy loss per one wave period (as opposed to dimensional measures such as the attenuation coefficient, which represents energy loss per meter) [68, 69, 70]. On adsorption, shows a sharp peak around water saturation of 90%. This behavior of attenuation is similar to that during hexane adsorption in Vycor glass [21]. While water and hexane are significantly different fluids, the results of this work are qualitatively similar to those observed by Page et al., and it is reasonable to consider that the causes are the same as well. Moreover, this behavior is very similar to the behavior of elastic-wave attenuation in macro-porous media partially saturated with water [71] at relatively low frequencies. This attenuation is usually attributed to the relaxation of fluid pressure between portions of the sample with different levels of liquid saturation [72] and indicates that, even on adsorption, the saturation within the sample shows slight spatial variations. These variations cause spatial variations in compressibility, and thus also variations in fluid pressure in the passing wave. Fluid pressure gradients, in turn, cause local fluid flow through pore channels, resulting in viscous dissipation [73, 74, 72, 59]. Note that this behavior of attenuation is also consistent with the behavior of the bulk modulus during adsorption [Fig. A2 (b)]: is almost constant until the liquid saturation reaches about 80%, but then increases sharply to the value given by Gassmann’s equation. In a remarkable similarity to macroporous media ([71], Fig. 1), this increase is quite sharp, but not instant.
This behavior of both bulk modulus and attenuation is characteristic of near-uniform liquid saturation, which is attained when the characteristic linear scale of saturation heterogeneity is smaller than the so-called fluid diffusion length , where is the hydraulic permeability of the sample and the dynamic viscosity of the fluid, see [59], Chapter 4 and references therein. Hydraulic permeability scales with the pore size squared, and for a carbonate rock corresponding to Figs. 1 and 2 of [71] is on the order of m2, which for Hz gives on the order of 1 cm. That is, the length scale of fluid saturation patches is below 1 cm. In contrast, due its nano-porous structure, the Vycor glass has a permeability of m2 [58], which for Hz gives of about 100 nm. The behavior of both bulk modulus and attenuation corresponding to near-uniform saturation indicates that the water saturation on adsorption is slightly heterogeneous on the length scale below 100 nm, or several pore sizes, but is uniform on larger scales (consistent with the fact that, on adsorption, the samples remain optically transparent for the entire range of vapor pressures). The sharp attenuation peak at the saturation of 90% suggests that this attenuation only occurs when some portions of the pore space experience capillary condensation. This sharply increases the stiffness of these portions of the sample, and hence the contrast in elastic moduli between adjacent areas (some of which are still saturated only partially), which is essential for such attenuation to occur; see [59], Chapters 3 and 4.
On desorption, both the bulk modulus and attenuation shown in Fig. A2 exhibit much more gradual saturation dependence, which is typical of so-called patchy saturation, where the scale of saturation heterogeneity is larger than . This is consistent with the observed change in the optical properties of both samples during desorption when the hysteresis loop closed (). At this point, the samples became white and opaque starting from the outer edge and spreading towards the center. The opacity reverted to translucency with the same radial progression between and . This phenomenon was also observed by Page et al., who used light scattering measurements to show the formation of large-scale inhomogeneities in the pore network as the fluid drains. These inhomogeneities are large enough to scatter light, causing the samples to become opaque. The different saturation regions permit different ultrasound speeds, which arrive out of phase at the receiving transducer to affect the shape and apparent travel time of measured ultrasonic waves. This both contributes to attenuation and causes a dip in just as the hysteresis loop is closing.
A.3 Sample-Transducer Assembly
Figure A3 shows the photo of the sample holder used in the experiments. The transducer surface is covered by a layer of nitrile, which acts as a couplant. The sample is held between the transducers by two 3D-printed plates of extruded polyethylene terephthalate glycol (PETG). The plate on the left is fixed in place. The plate on the right is movable. By rotating the wingnuts, pressure is applied to the sample via springs to ensure coupling across the transducer-sample interfaces.
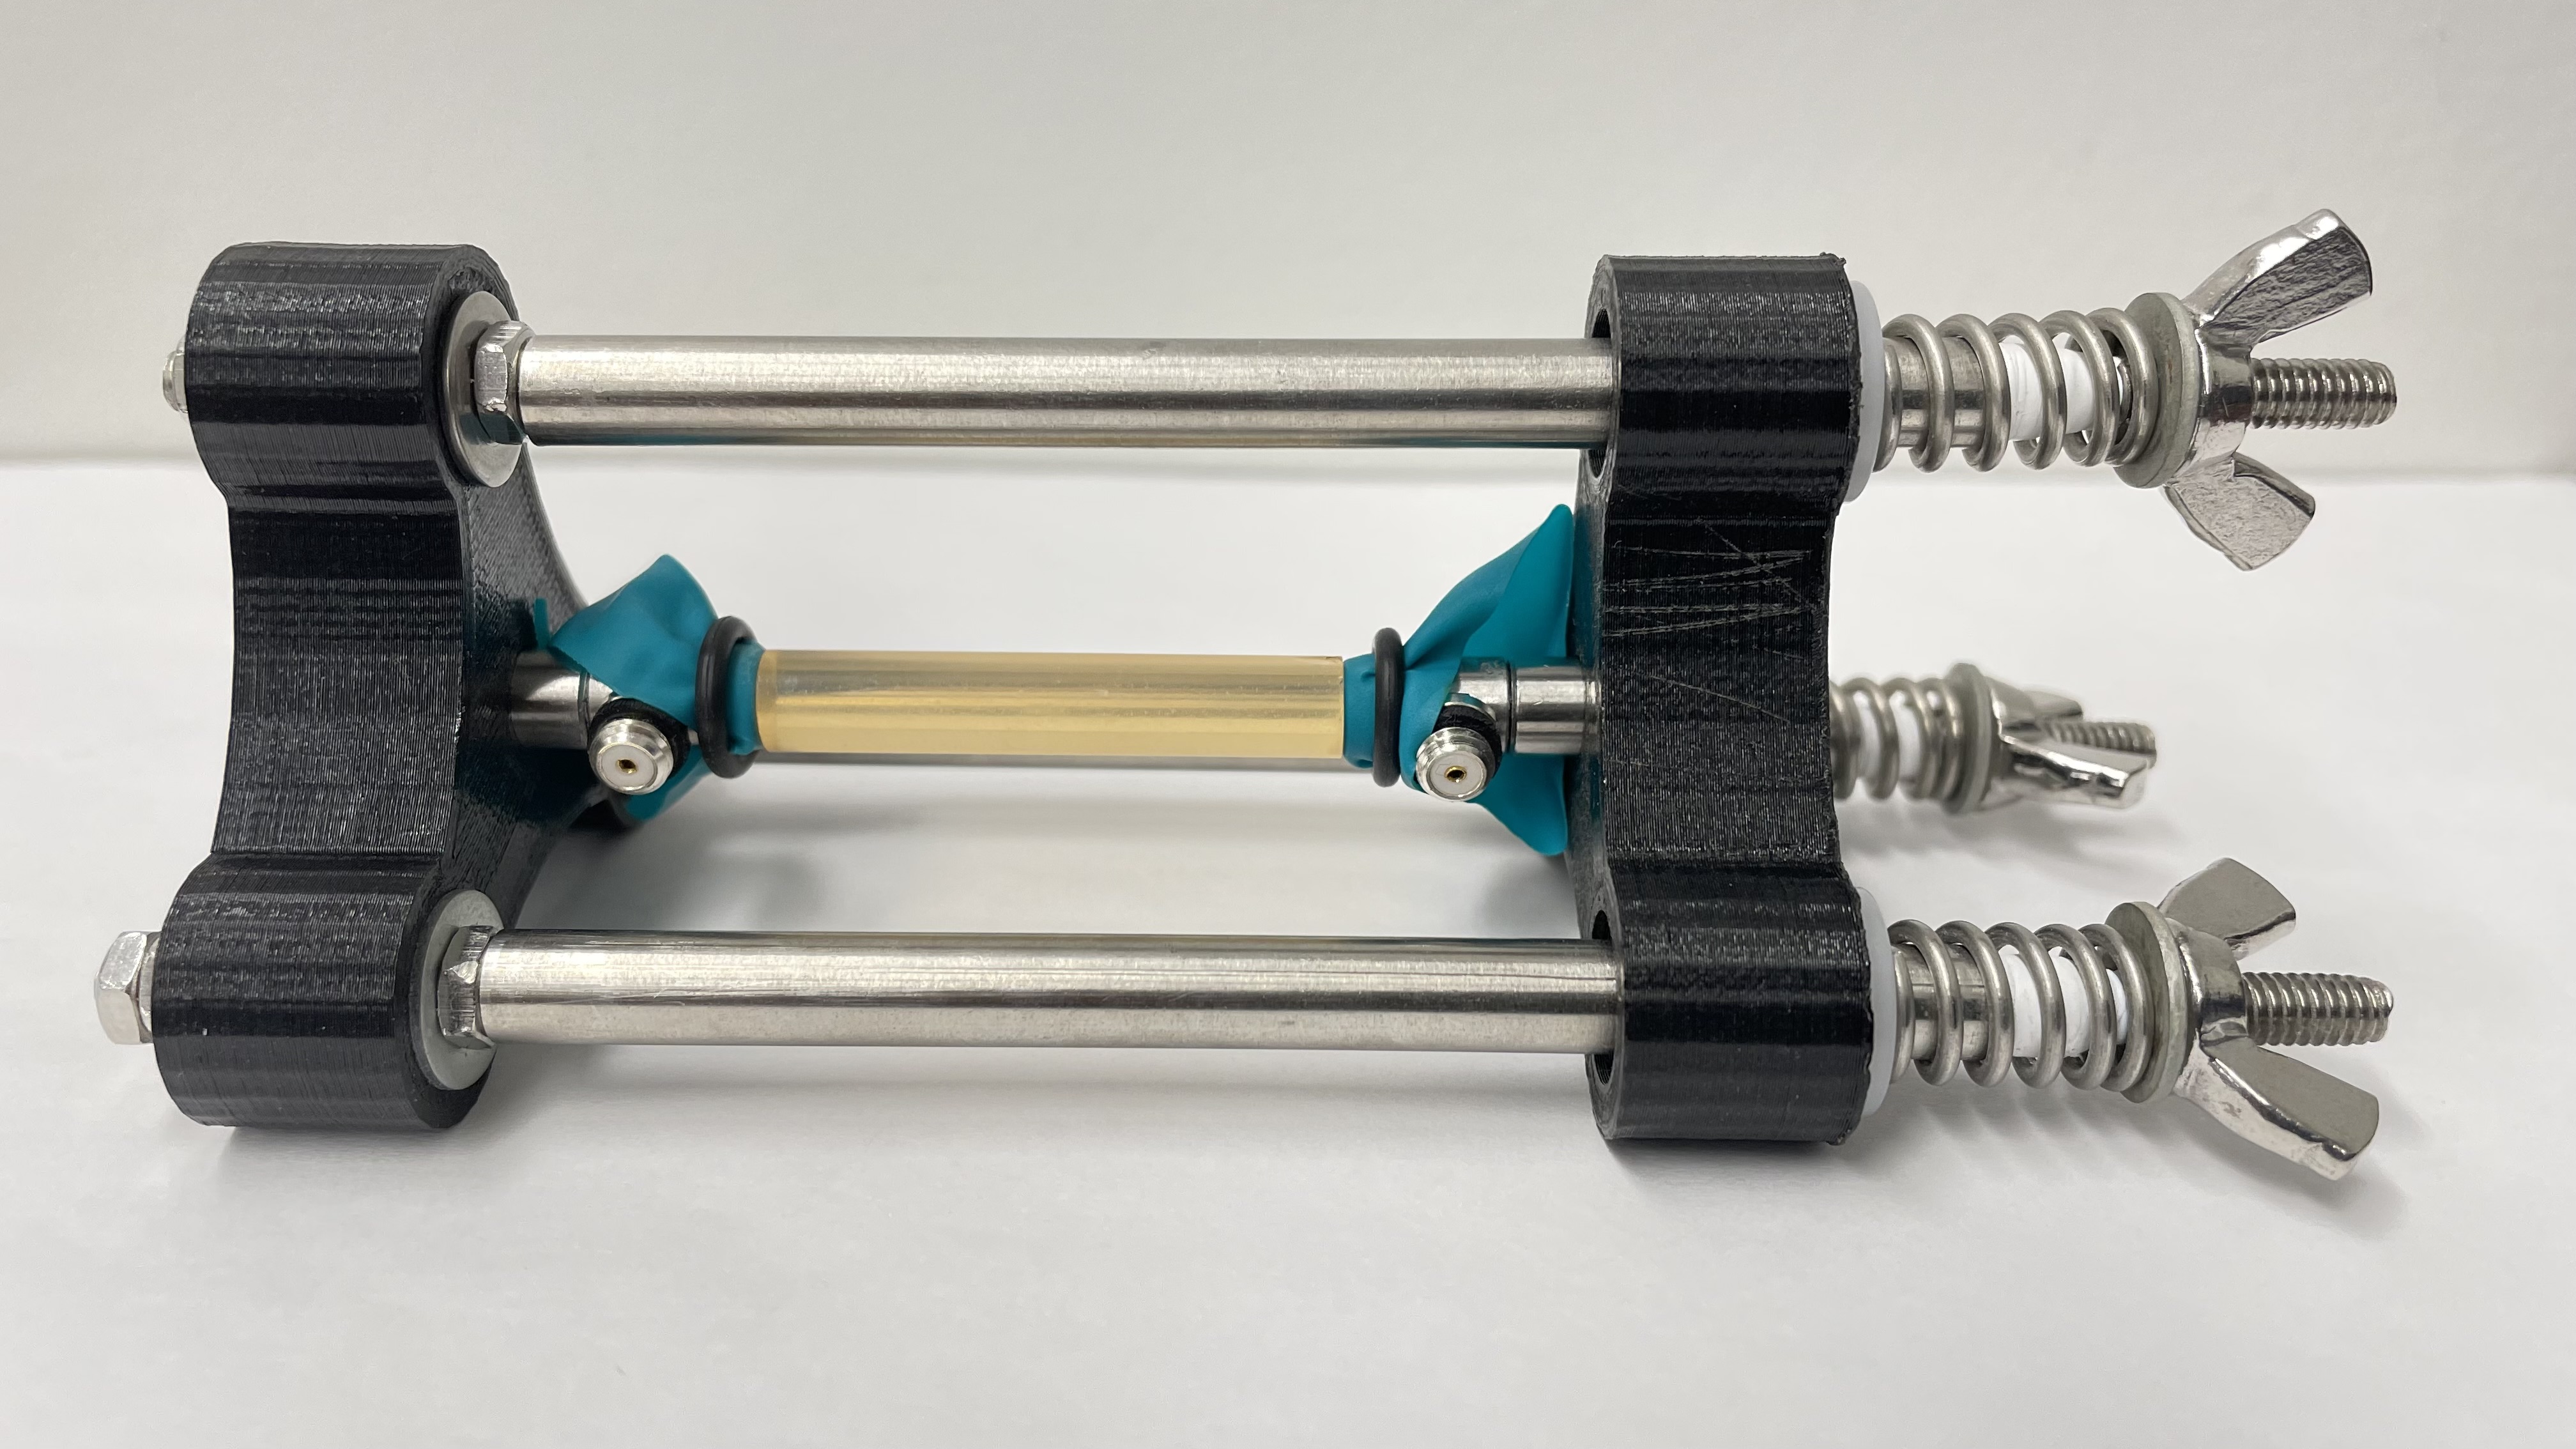
Between the lowest and the highest humidities considered in this work, we observed a 14% increase in the mass of the nitrile couplant due to water absorption. Despite this, there was no effect on the travel time of ultrasonic waves through the couplant alone because its thickness was more than three times smaller than the wavelength ( ) of ultrasonic waves. Further, since the length of the couplant is 3 orders of magnitude less than that of the sample, any swelling upon humidification had negligible effect on the overall travel time of ultrasonic waves.
A.4 Potassium Acetate Desiccant
The results listed in this work do not include the measurements where relative humidity was controlled by potassium acetate, used recently by Yurikov et al. [48] for studies of water adsorption on a sandstone sample. In solution, this salt hydrolyzes into acetic acid, which is volatile and readily releases into the air in the chamber, thus affecting the accuracy of the humidity sensor. It may also compete with water vapor for adsorption in nanopores, thus contaminating the sample. The expected RH of air above potassium acetate is 23 - 26%. In practice, the reading on the RH probe approached the expected value (from room humidity: 30 - 40%), before parabolically increasing to 75%. After opening the chamber to ambient air, the reading increased to nearly 100% and slowly returned to normal over the course of one hour. Potassium acetate was tested again without any samples in the chamber, producing the same result described above. After purging with air, the probe reported the correct humidities for all other salts. Subsequent ultrasound measurements with previous salts showed no difference before and after the use of potassium acetate, suggesting that any contamination was minimal or was undone by subsequent water adsorption and desorption. Because of the unreliability of the probe with this desiccant, and to prevent this effect from influencing water adsorption, potassium acetate was excluded from the experiments.
A.5 Estimation of and
The bulk and shear moduli of the solid glass matrix ( and , respectively) were estimated using the modified Kuster and Toksöz (KT) theory. The results for are shown in Tables 3, A1, and A2. Assuming that the samples have empty cylindrical inclusions of volume fraction , the moduli of the solid phase can be calculated from the experimentally measured bulk and shear moduli of the dry samples ( and , respectively) using the following equations:
| (A1) |
| (A2) |
where
| (A3) |
| (A4) |
| (A5) |
and
| (A6) |
References
- Thomson [1872] W. Thomson, On the equilibrium of vapour at a curved surface of liquid, Proceedings of the Royal Society of Edinburgh 7, 63 (1872).
- Karasev et al. [1971] V. Karasev, B. Derjaguin, and E. Khromova, The thermal expansion of ordinary and heavy water in fine pores, in Collection Researches in Surface Forces, Vol. 3 (Consultants Bureau New York, 1971) pp. 25–28.
- Derjaguin et al. [1986] B. Derjaguin, V. Karasev, and E. Khromova, Thermal expansion of water in fine pores, J. Colloid Interface Sci. 109, 586 (1986).
- Huber [2015] P. Huber, Soft matter in hard confinement: phase transition thermodynamics, structure, texture, diffusion and flow in nanoporous media (topical review), J. Phys.: Condens. Matter 27, 103102 (2015).
- Gubbins et al. [2014] K. E. Gubbins, Y. Long, and M. Śliwinska-Bartkowiak, Thermodynamics of confined nano-phases, J. Chem. Thermodyn. 74, 169 (2014).
- Barsotti et al. [2016] E. Barsotti, S. P. Tan, S. Saraji, M. Piri, and J.-H. Chen, A review on capillary condensation in nanoporous media: Implications for hydrocarbon recovery from tight reservoirs, Fuel 184, 344 (2016).
- Kimmich [2002] R. Kimmich, Strange kinetics, porous media, and NMR, Chem. Phys. 284, 253 (2002).
- Xu et al. [2009a] S. Xu, G. C. Simmons, T. Mahadevan, G. W. Scherer, S. H. Garofalini, and C. Pacheco, Transport of water in small pores, Langmuir 25, 5084 (2009a).
- Xu et al. [2009b] S. Xu, G. W. Scherer, T. Mahadevan, and S. H. Garofalini, Thermal expansion of confined water, Langmuir 25, 5076 (2009b).
- Valenza II and Scherer [2005] J. J. Valenza II and G. W. Scherer, Evidence of anomalous thermal expansion of water in cement paste, Cem. Concr. Res. 35, 57 (2005).
- Schappert and Pelster [2014] K. Schappert and R. Pelster, Influence of the Laplace pressure on the elasticity of argon in nanopores, Europhys. Lett. 105, 56001 (2014).
- Dobrzanski et al. [2021] C. D. Dobrzanski, B. Gurevich, and G. Y. Gor, Elastic properties of confined fluids from molecular modeling to ultrasonic experiments on porous solids, Appl. Phys. Rev. 8, 021317 (2021).
- Müller and Gurevich [2005] T. M. Müller and B. Gurevich, Wave-induced fluid flow in random porous media: Attenuation and dispersion of elastic waves, J. Acoust. Soc. Am. 117, 2732 (2005).
- Valenza II et al. [2013] J. J. Valenza II, N. Drenzek, F. Marques, M. Pagels, and M. Mastalerz, Geochemical controls on shale microstructure, Geology 41, 611 (2013).
- Gassmann [1951] F. Gassmann, Über die Elastizität poröser Medien, Viertel. Naturforsch. Ges. Zürich 96, 1 (1951).
- Biot [1956a] M. A. Biot, Theory of propagation of elastic waves in a fluid-saturated porous solid. I. Low-frequency range, J. Acoust. Soc. Am. 28, 168 (1956a).
- Biot [1956b] M. A. Biot, Theory of propagation of elastic waves in a fluid-saturated porous solid. ii. higher frequency range, J. Acoust. Soc. Am. 28, 179 (1956b).
- Pimienta et al. [2019] L. Pimienta, C. David, J. Sarout, X. Perrot, J. Dautriat, and C. Barnes, Evolution in seismic properties during low and intermediate water saturation: Competing mechanisms during water imbibition?, Geophys. Res. Lett. 46, 4581 (2019).
- Tadavani et al. [2020] S. K. Tadavani, K. M. Poduska, A. E. Malcolm, and A. Melnikov, A non-linear elastic approach to study the effect of ambient humidity on sandstone, J. Appl. Phys. 128, 244902 (2020).
- Warner and Beamish [1988] K. L. Warner and J. R. Beamish, Ultrasonic measurement of the surface area of porous materials, J. Appl. Phys. 63, 4372 (1988).
- Page et al. [1995] J. H. Page, J. Liu, B. Abeles, E. Herbolzheimer, H. W. Deckman, and D. A. Weitz, Adsorption and desorption of a wetting fluid in Vycor studied by acoustic and optical techniques, Phys. Rev. E 52, 2763 (1995).
- Schappert and Pelster [2013] K. Schappert and R. Pelster, Elastic properties of liquid and solid argon in nanopores, J. Phys.: Condens. Matter 25, 415302 (2013).
- Schappert et al. [2015] K. Schappert, L. Gemmel, D. Meisberger, and R. Pelster, Elasticity and phase behaviour of n-heptane and n-nonane in nanopores, Europhys. Lett. 111, 56003 (2015).
- Schappert and Pelster [2018a] K. Schappert and R. Pelster, Temperature dependence of the longitudinal modulus of liquid argon in nanopores, J. Phys. Chem. C 122, 5537 (2018a).
- Schappert and Pelster [2018b] K. Schappert and R. Pelster, Liquid argon in nanopores: The impact of confinement on the pressure dependence of the adiabatic longitudinal modulus, J. Phys. Chem. C 122, 27425 (2018b).
- Schappert and Pelster [2022] K. Schappert and R. Pelster, Distinct Enhancement of the Longitudinal Modulus of Liquid Nitrogen in Nanoporous Vycor Glass, J. Phys. Chem. C 126, 21745 (2022).
- Gor [2014] G. Y. Gor, Adsorption stress changes the elasticity of liquid argon confined in a nanopore, Langmuir 30, 13564 (2014).
- Sun et al. [2019a] Z. Sun, Y. Kang, and Y. Kang, Density functional study on enhancement of modulus of confined fluid in nanopores, Ind. Eng. Chem. Res. 58, 15637 (2019a).
- Dobrzanski et al. [2018] C. D. Dobrzanski, M. A. Maximov, and G. Y. Gor, Effect of pore geometry on the compressibility of a confined simple fluid, J. Chem. Phys. 148, 054503 (2018).
- Gor and Gurevich [2018] G. Y. Gor and B. Gurevich, Gassmann theory applies to nanoporous media, Geophys. Res. Lett. 45, 146 (2018).
- Maximov and Gor [2018] M. A. Maximov and G. Y. Gor, Molecular simulations shed light on potential uses of ultrasound in nitrogen adsorption experiments, Langmuir 34, 15650 (2018).
- Amberg and McIntosh [1952] C. H. Amberg and R. McIntosh, A study of adsorption hysteresis by means of length changes of a rod of porous glass, Can. J. Chem. 30, 1012 (1952).
- Hiller [1964] K. Hiller, Strength reduction and length changes in porous glass caused by water vapor adsorption, J. Appl. Phys. 35, 1622 (1964).
- Hodgson and McIntosh [1960] C. Hodgson and R. McIntosh, The freezing of water and benzene in porous Vycor glass, Can. J. Chem. 38, 958 (1960).
- Petrov and Furó [2011] O. Petrov and I. Furó, A study of freezing–melting hysteresis of water in different porous materials. part i: Porous silica glasses, Microporous Mesoporous Mater. 138, 221 (2011).
- Gruener et al. [2012] S. Gruener, Z. Sadjadi, H. E. Hermes, A. V. Kityk, K. Knorr, S. U. Egelhaaf, H. Rieger, and P. Huber, Anomalous front broadening during spontaneous imbibition in a matrix with elongated pores, Proc. Natl. Acad. Sci. U.S.A. 109, 10245 (2012).
- Kiepsch and Pelster [2016] S. Kiepsch and R. Pelster, Interplay of vapor adsorption and liquid imbibition in nanoporous vycor glass, Phys. Rev. E 93, 043128 (2016).
- Gruener et al. [2016] S. Gruener, D. Wallacher, S. Greulich, M. Busch, and P. Huber, Hydraulic transport across hydrophilic and hydrophobic nanopores: Flow experiments with water and n-hexane, Phys. Rev. E 93, 013102 (2016).
- Taschin et al. [2010] A. Taschin, R. Cucini, P. Bartolini, and R. Torre, Temperature of maximum density of water in hydrophilic confinement measured by transient grating spectroscopy, Europhys. Lett. 29, 26005 (2010).
- Bellissent-Funel [2001] M.-C. Bellissent-Funel, Structure of confined water, J. Phys.: Condens. Matter 13, 9165 (2001).
- Thompson et al. [2007] H. Thompson, A. K. Soper, M. A. Ricci, F. Bruni, and N. T. Skipper, The three-dimensional structure of water confined in nanoporous Vycor glass, J. Phys. Chem. B 111, 5610 (2007).
- Borman et al. [2016] V. Borman, A. Belogorlov, and V. Tronin, Anomalously slow relaxation of interacting liquid nanoclusters confined in a porous medium, Phys. Rev. E 93, 022142 (2016).
- Levitz [2019] P. Levitz, Probing interfacial dynamics of water in confined nanoporous systems by NMRD, Mol. Phys. 117, 952 (2019).
- Murphy [1982] W. F. Murphy, Effects of partial water saturation on attenuation in Massilon sandstone and Vycor porous glass, J. Acoust. Soc. Am. 71, 1458 (1982).
- Cucini et al. [2010] R. Cucini, A. Taschin, P. Bartolini, and R. Torre, Acoustic, thermal and flow processes in a water filled nanoporous glass by time-resolved optical spectroscopy, J. Mech. Phys. Solids 58, 1302 (2010).
- Ravikovitch and Neimark [2001] P. I. Ravikovitch and A. V. Neimark, Characterization of nanoporous materials from adsorption and desorption isotherms, Colloids Surf., A 187, 11 (2001).
- Thommes et al. [2006] M. Thommes, B. Smarsly, M. Groenewolt, P. I. Ravikovitch, and A. V. Neimark, Adsorption hysteresis of nitrogen and argon in pore networks and characterization of novel micro- and mesoporous silicas, Langmuir 22, 756 (2006).
- Yurikov et al. [2018] A. Yurikov, M. Lebedev, G. Y. Gor, and B. Gurevich, Sorption-induced deformation and elastic weakening of bentheim sandstone, J. Geophys. Res. Solid Earth 123, 8589 (2018).
- Weast [1976] R. Weast, CRC Handbook of Chemistry and Physics 1976-1977: A Ready-Reference Book of Chemical and Physical Data, 57th ed. (CRC Press, 1976).
- Lyons [2010] R. G. Lyons, Understanding Digital Signal Processing, 3rd Edition (Pearson Education Canada, 2010).
- Kuster and Toksöz [1974] G. T. Kuster and M. N. Toksöz, Velocity and attenuation of seismic waves in two-phase media: Part I. Theoretical formulations, Geophysics 39, 587 (1974).
- Berryman [1980] J. G. Berryman, Long-wavelength propagation in composite elastic media II. Ellipsoidal inclusions, J. Acoust. Soc. Am. 68, 1820 (1980).
- Sun et al. [2019b] Y. Sun, B. Gurevich, and G. Y. Gor, Modeling elastic properties of Vycor glass saturated with liquid and solid adsorbates, Adsorption 25, 973 (2019b).
- Scherer [1986] G. W. Scherer, Dilatation of porous glass, J. Am. Ceram. Soc. 69, 473 (1986).
- Markova et al. [2000] N. Markova, E. Sparr, and L. Wadso, On application of an isothermal sorption microcalorimeter, Thermochim. Acta 374, 93 (2000).
- Bell et al. [2014] I. H. Bell, J. Wronski, S. Quoilin, and V. Lemort, Pure and Pseudo-pure Fluid Thermophysical Property Evaluation and the Open-Source Thermophysical Property Library CoolProp, Ind. Eng. Chem. Res. 53, 2498 (2014).
- Wagner and Pruß [2002] W. Wagner and A. Pruß, The IAPWS formulation 1995 for the thermodynamic properties of ordinary water substance for general and scientific use, J. Phys. Chem. Ref. Data 31, 387 (2002).
- Vichit-Vadakan and Scherer [2000] W. Vichit-Vadakan and G. W. Scherer, Measuring Permeability of Rigid Materials by a Beam-Bending Method: II, Porous Glass, J. Am. Ceram. Soc. 83, 2240 (2000).
- Gurevich and Carcione [2022] B. Gurevich and J. M. Carcione, Attenuation and Dispersion of Elastic Waves in Porous Rocks: Mechanisms and models (Society of Exploration Geophysicists, 2022) p. 536.
- Mavko and Jizba [1991] G. Mavko and D. Jizba, Estimating grain-scale fluid effects on velocity dispersion in rocks, Geophysics 56, 1940 (1991).
- Gor and Neimark [2010] G. Y. Gor and A. V. Neimark, Adsorption-induced deformation of mesoporous solids, Langmuir 26, 13021 (2010).
- Murnaghan [1944] F. D. Murnaghan, The compressibility of media under extreme pressures, Proc. Natl. Acad. Sci. U.S.A. 30, 244 (1944).
- Birch [1952] F. Birch, Elasticity and constitution of the Earth’s interior, J. Geophys. Res. 57, 227 (1952).
- Gor et al. [2015] G. Y. Gor, D. W. Siderius, C. J. Rasmussen, W. P. Krekelberg, V. K. Shen, and N. Bernstein, Relation between pore size and the compressibility of a confined fluid, J. Chem. Phys. 143, 194506 (2015).
- Gor et al. [2016] G. Y. Gor, D. W. Siderius, V. K. Shen, and N. Bernstein, Modulus–pressure equation for confined fluids, J. Chem. Phys. 145, 164505 (2016).
- [66] Files of tabulated data for the figures are available at https://github.com/ChemicalMD/Ultrasonic-Study-of-Water-Adsorbed-in-Nanoporous-Glasses.
- Sears and Bonner [1981] F. M. Sears and B. P. Bonner, Ultrasonic attenuation measurement by spectral ratios utilizing signal processing techniques, IEEE Trans. Geosci. Remote GE-19, 95 (1981).
- Knopoff [1964] L. Knopoff, Q, Rev. Geophys. 2, 625 (1964).
- Winkler and Plona [1982] K. W. Winkler and T. J. Plona, Technique for measuring ultrasonic velocity and attenuation spectra in rocks under pressure, J. Geophys. Res. Solid Earth 87, 10776 (1982).
- McCann and Sothcott [2009] C. McCann and J. Sothcott, Sonic to ultrasonic Q of sandstones and limestones: Laboratory measurements at in situ pressures, Geophysics 74, WA93 (2009).
- Cadoret et al. [1998] T. Cadoret, G. Mavko, and B. Zinszner, Fluid distribution effect on sonic attenuation in partially saturated limestones, Geophysics 63, 154 (1998).
- Kobayashi and Mavko [2016] Y. Kobayashi and G. Mavko, Variation in P-wave modulus with frequency and water saturation: extension of dynamic-equivalent-medium approach, Geophysics 81, D479 (2016).
- White [1975] J. E. White, Computed seismic speeds and attenuation in rocks with partial gas saturation, Geophysics 40, 224 (1975).
- Johnson [2001] D. L. Johnson, Theory of frequency dependent acoustics in patchy-saturated porous media, J. Acoust. Soc. Am 110, 682 (2001).