Optical Counterparts of Two Candidate Ultraluminous X-ray Sources in NGC 4536
Abstract
Archival XMM-Newton, Chandra and Hubble Space Telescope (HST) data have been used to study the X-ray and optical properties of two candidate ultraluminous X-ray sources (ULXs) in NGC 4536. In order to search for potential optical counterparts, relative astrometry between Chandra and HST was improved, and as a result, optical counterparts were detected for both X-ray sources. To complement our findings (based on the archival data), ground-based optical spectra of the counterparts were obtained with the 6m BTA Telescope located at the Special Astrophysical Observatory (SAO). The calculated redshift (z = 0.43910.0010) for one of the sources (X-3) indicates that the source is, in fact, a background active galactic nucleus (AGN). Two possible optical counterparts (s1 and s2) were found for X-2. Whether s1 is point-like or an extended source is unclear: If it is point-like and the emission is dominated by the donor its spectral type indicates O-B star. The second source (s2) is point-like and is consistent with the colors and absolute magnitudes of a red supergiant.
keywords:
galaxies: individual: NGC 4536 - X-rays: binaries1 Introduction
Ultraluminous X-ray sources (ULXs, with a threshold luminosity of erg s-1), are non-nuclear sources that have been found in diverse environments, including star-forming regions of spiral galaxies, elliptical galaxies, as well as dwarf galaxies (Feng &
Soria, 2011; Kaaret
et al., 2017; Fabrika et al., 2021). Assuming isotropic emission, some of these sources can reach a luminosity well in excess of erg s-1, surpassing the Eddington limit for a 10 black hole (BH) (Colbert &
Mushotzky, 1999; Farrell et al., 2009; Sutton et al., 2012). Early studies hinted that the majority of ULXs as being binary systems powered by accretion onto a compact object where the compact object could be either an intermediate mass () or a stellar mass BH (), accreting at sub-, near or above the Eddington rate (Colbert &
Mushotzky, 1999; King et al., 2001; Begelman, 2002; Roberts, 2007; Tao
et al., 2011; Fabrika et al., 2015; Kaaret
et al., 2017). More recent studies, with detection of pulsations in a handful of sources (Bachetti
et al., 2014; Fürst
et al., 2016; Israel
et al., 2017; Carpano et al., 2018; Sathyaprakash
et al., 2019; Rodríguez Castillo et al., 2020; Quintin et al., 2021), strongly argue in favor of (at least) a fraction of these sources hosting a neutron star (NS) instead of a BH. With the current total of NS ULXs (with observed pulsations) standing at about a half-dozen, the question of the relative proportion of ULXs hosting a NS, as opposed to a stellar-mass BH, has become a highly debated topic (Middleton &
King, 2017; King &
Lasota, 2016).
ULXs appear to exhibit different spectral and timing behavior in comparison with (ordinary) galactic BHs, featuring two-component spectra with soft excess and a turnover at energies near 5 keV. As well, in contrast to galactic BH binaries, ULXs tend to be more persistent rather than transient. Moreover, ULXs found in elliptical galaxies tend to have lower levels of variability than those found in star-forming galaxies, that can vary by an order of magnitude (Feng &
Kaaret, 2006, 2009; Soria et al., 2012; Pintore
et al., 2018; Atapin
et al., 2020; Walton
et al., 2021). Indeed, Sutton
et al. (2013) extracted fractional variability and constructed variability-hardness diagrams to distinguish three main states i.e., the broadened disk (BD: possibly dominated by a slim disk, overall luminosity erg s-1), hard ultraluminous (HUL; low-inclination i.e., more face-on; luminosity erg s-1), and the soft ultraluminous (SUL; high inclination i.e, more edge-on; luminosity erg s-1). Variabilities reaching have been reported for the SUL and BD states. Kajava &
Poutanen (2009) have noted that the ’soft excess’ reported for many ULXs around 0.2 keV does not follow the expected temperature profile () of a standard disk. These considerations raise very important questions regarding not only the configuration (and/or the contribution) of the accretion disk but the accretion process itself i.e, whether it is primarily disk-fed or driven via clumpy winds or possibly even a mixture of the two with the development of transient disk structures.
Optical observations of the environments of ULXs provide important information regarding the nature of these sources and also the evolution patterns of X-ray binaries (Poutanen et al., 2013; Fabrika et al., 2021; Kaaret
et al., 2017). The optical emissions detected in ULXs could arise from an accretion disk, as a result of irradiation, and/or from the donor star (Feng &
Soria, 2011; Tao
et al., 2011). Determining the main source of the emissions would help in estimating the mass of the compact object and, therefore, provide a better understanding of the physical nature of ULXs. Many studies have shown that ULXs are associated with crowded star formation regions in their host galaxies (Ranalli
et al., 2003; Grimm
et al., 2003; Kaaret
et al., 2004; Swartz
et al., 2009). Therefore, to identify counterparts in such cases, the high spatial resolution and superior pointing capacity of Chandra coupled with the excellent resolution and imaging capacity of the Hubble Space Telescope (HST), provide a powerful combination for precise astrometry (Patruno &
Zampieri, 2010; Grisé et al., 2011; Poutanen et al., 2013; Avdan
et al., 2016; Egorov
et al., 2017; Urquhart
et al., 2018; Avdan
et al., 2019). The number of ULXs defined by optical observations is still limited since they are quite faint in the optical band ( mag). With the aid of recent HST data the optical counterpart candidates for a number of ULXs have been studied in detail (Tao
et al., 2011; Soria et al., 2012; Gladstone
et al., 2013; Avdan
et al., 2016, 2019; Akyuz et al., 2020) and O-B type (and less commonly cold) stars have been identified as unique optical counterparts for over a dozen ULXs (Avdan
et al., 2019; Liu
et al., 2004; Kuntz et al., 2005; Grisé et al., 2012; Gladstone
et al., 2013; Vinokurov et al., 2018). Several studies, based on ground-based observations, have reported the optical spectra of a number of ULXs (or their environment) (Motch et al., 2011; Avdan
et al., 2016; Vinokurov et al., 2018; Fabrika et al., 2015). These studies found that the observed spectra show similar structures in which they exhibit broad emission lines (e.g. He II ) (Vinokurov et al., 2018; Fabrika et al., 2021). In some cases where background active galactic nuclei (AGNs) are misidentified and catalogued as ULXs, ground-based spectral observations are crucial in distinguishing between them (Masetti et al., 2003; Arp et al., 2004; Clark
et al., 2005; Dadina
et al., 2013; Gutiérrez, 2013; López
et al., 2020; Vinokurov et al., 2020).
Our prime focus in this paper is the multiwavelength study of two ULX candidates (X-2 and X-3) in NGC 4536, a late-type barred spiral galaxy at a distance of 15.8 Mpc in the Virgo constellation (McAlpine et al., 2011; Earnshaw et al., 2019; Hatt
et al., 2018; de Vaucouleurs et al., 1976). McAlpine et al. (2011) studied this galaxy with the aim of probing the nature of the nuclear and off-nuclear X-ray emission using XMM-Newton, supplemented with optical data from HST, infrared imaging data from the Spitzer and GALEX (Galaxy Evolution Explorer). They detected statistically significant variability which provides evidence of an AGN. They also explored the possibility of X-ray emission due to existence of X-ray binaries (XRBs) and found that XRBs could be responsible for only a small fraction of the X-ray luminosity detected, and that the significant [Ne v] emission in the galaxy cannot be explained by the presence of XRBs alone. Singha &
Devi (2019) performed a spectral and temporal analysis of ULXs in NGC 4536 and identified three X-ray point sources (X-ray counts 100 counts/sec) and concluded that these sources are ULXs with X-ray luminosity of erg s-1. Earnshaw et al. (2019) catalogued three sources as ULXs in NGC 4536 galaxy. In this study, we investigate two of them since the third one was not observed with HST. Our goal is to search for and identify potential optical counterparts for these ULX candidates using the archival Chandra and HST observations. For completeness the X-ray spectra of the candidate ULXs were also obtained using Chandra and XMM-Newton archival data.
The paper is organized as follows: Section 2 reports the details of the observations, the data reduction, and methodology; Section 3 presents the results of the optical and X-ray spectral analysis. In section 4, we summarize our findings.
2 Data Reduction and Methodology
2.1 Observations
NGC 4536 was observed with XMM-Newton and Chandra for 34ks (in 2008) and 15ks (2017), respectively, and with HST in 2020. The details of the observations used in this work are summarized in Table 1.
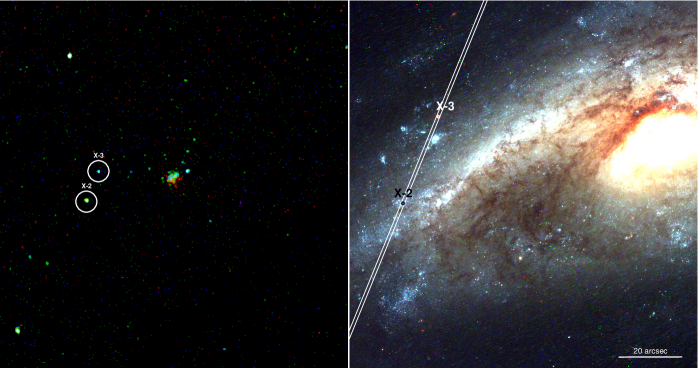
The XMM-Newton data are used for spectral analysis because the sources do not have enough statistics in the Chandra observation. The archival Chandra observation is used to correct relative astrometry between HST and Chandra images in order to search for possible optical counterparts of the ULX candidates (see Figure 1 for the location of the sources). The optical photometry is performed with the archival HST/WFC3/UVIS observations.
Both ULX candidates (X-2 and X-3) were also observed on 2021 May 13 using the 6-m Big Telescope Alt-azimuth (BTA) of the Special Astrophysical Observatory (SAO) with a SCORPIO-2 spectrograph (Afanasiev & Moiseev, 2011) in the long slit mode. A total of 4 exposures of 1200 s were taken. The selected grism VPHG940@600 and slit width of 1″ provided a spectral resolution of Å in the range of Å. The slit position (PA = 157.5∘) during the observation is shown in the right panel of Figure 1.
| Satellite | ObsID (Filter) | Date | Exp. |
| XMM-Newton | 0551450301 | 2008 June 17 | 34 ks |
| Chandra | 19387 | 2017 July 01 | 15 ks |
| HST (WFC3/UVIS) | IDXR29060 (F275W) | 2020 March 22 | 2190 s |
| IDXR29050 (F336W) | 2020 March 22 | 1100 s | |
| IDXR29040 (F438W) | 2020 March 22 | 1050 s | |
| IDXR29070 (F555W) | 2020 March 22 | 670 s | |
| IDXR29030 (F814W) | 2020 March 22 | 803 s |
2.2 Astrometry and Optical Photometry
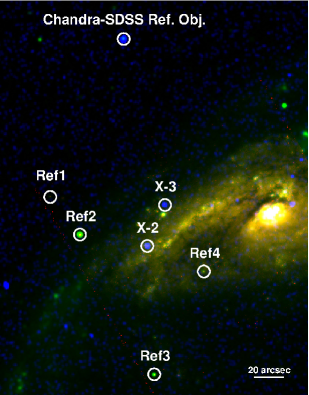
A relative astrometric correction is required to find the accurate positions of the candidate sources in the HST images. Therefore, Chandra and HST/WFC3 images were used to apply astrometric corrections by using the methods described in (Vinokurov et al. 2018 and references therein). As there were not a sufficient number of common sources between the Chandra and HST images, we tried to tie the images via an intermediate step. The SDSS g-band image of the galaxy was used as a reference image to determine the shift between the Chandra and HST/WFC3 F555W images. First the Chandra and HST images were aligned with the SDSS image individually. One bright point-like source was used to calculate the shift between the Chandra and the SDSS images and four bright sources were used for the HST and the SDSS images. The list of these reference objects, the original position of ULXs in Chandra images and the final corrected positions on the HST/WFC3 F555W image are given in Table 2. The positions of the reference objects and ULXs (X-2 and X-3) on the three-color composite image are also shown in Figure 2. After the correction, the positions of X-2 and X-3 were derived with an uncertainty of 04 as RA, Dec; , 210′5484 and 211′2223 on the HST/WFC3 F555W image, respectively. The HST/WFC3 images of the sources are given in Figures 3 and 4 respectively.
| Object | Image | RA | Dec | Difference |
|---|---|---|---|---|
| (J2000) | (J2000) | () | ||
| HST/WFC3 F555W SDSS-g band | ||||
| Ref1 | HST | 12 34 36.883 | +02 11 27.359 | 0.07 |
| SDSS | 12 34 36.881 | +02 11 27.428 | ||
| Ref2 | HST | 12 34 35.547 | +02 11 02.005 | 0.16 |
| SDSS | 12 34 35.553 | +02 11 02.137 | ||
| Ref3 | HST | 12 34 32.263 | +02 09 29.169 | 0.17 |
| SDSS | 12 34 32.269 | +02 09 29.311 | ||
| Ref4 | HST | 12 34 30.073 | +02 10 37.472 | 0.21 |
| SDSS | 12 34 30.082 | +02 10 37.635 | ||
| Chandra SDSS-g band | ||||
| Ref | Chandra | 12 34 33.632 | +02 13 11.676 | 0.49 |
| SDSS | 12 34 33.627 | +02 13 12.162 | ||
| ULXs | ||||
| X-2 | Chandra | 12 34 32.563 | +02 10 54.484 | 0.39 |
| Corrected | 12 34 32.554 | +02 10 54.844 | ||
| X-3 | Chandra | 12 34 31.812 | +02 11 21.867 | 0.39 |
| Corrected | 12 34 31.803 | +02 11 22.227 | ||
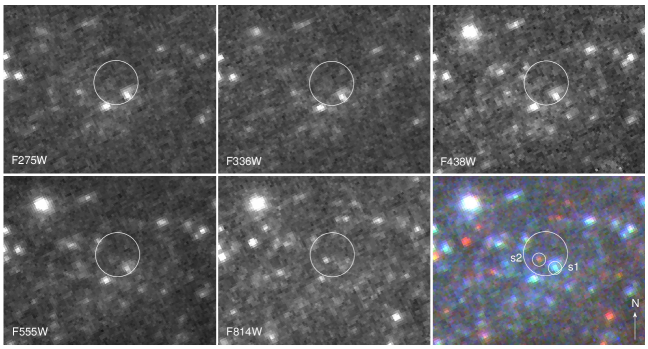
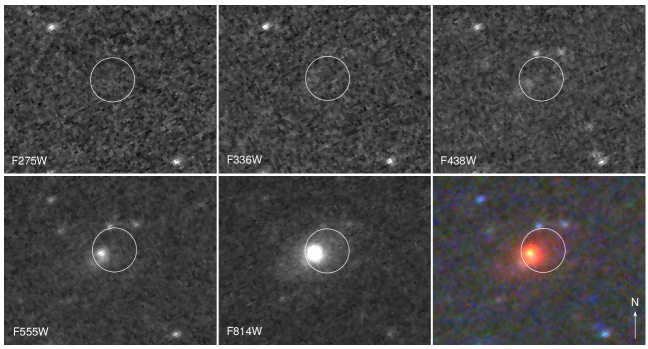
We have identified two relatively bright sources within the error box as possible optical counterparts of X-2 (marked as s1 and s2 in the color image of the Figure 3). An estimate of the size of the blue source s1, using a 2-D Gaussian function in F275W, F336W and F438W images, gives an average size (FWHMs) of , which exceeds the size of the surrounding stars whose FWHM equals 0.082″with a standard deviation of less than 0.007″. However, the broadening may be due to a compact structure that is visible in the images to the north of s1 and is poorly spatially resolved from s1. So, we cannot make an unambiguous conclusion whether s1 is an extended source (for example, the core of a young star cluster) or a point-like source111Note that in the PSF photometric results, DOLPHOT gives a flag parameter as an indicator for the source type. The software returned a flag value of “1” for s1 indicating it to be a point-like source with a PSF fit of 1.28 and 1.01 in the filters F275W and F336W respectively.. The other optical counterpart of X-2, i.e., s2, is a red point-like source clearly visible only in F555W and F814W images. Within the positional error box for X-3 there is a single extended (FWHM = ) optical source whose morphology and color indicates that it is a high redshift galaxy.
For s1 and s2 we performed point spread function (PSF) and aperture photometry and compared the results. PSF photometry was carried out for the HST/WFC3 FLT images using dolphot software version 2.0 (Dolphin, 2000, 2016). The WFC3/F555W drizzled image (DRZ) was chosen as the positional reference image for source detection. An aperture photometry was done for the WFC3 images in DRC format using apphot package in iraf. We chose a small aperture radius of 2 pixels () because of the crowded field; aperture corrections were calculated using magnitudes of (depending on the filter) isolated bright stars measured in 2 and 10 pixels apertures. WFC3/UVIS filters’ zero points for the 10 pixels aperture were taken from the uvis-photometric-calibration webpage222https://www.stsci.edu/hst/instrumentation/wfc3/data-analysis/photometric-calibration/uvis-photometric-calibration/previous-uvis-photometric-calibrations. The background level was estimated in the annulus around the sources with various inner and outer radii from a few pixels to and pixels, for the aperture stars only large annulus was used. For the s1 source, aperture photometry always gave measurements up to 0.5 mag brighter than those obtained by PSF photometry. The smallest difference (0.1–0.2 mag) between the results was obtained when the background was subtracted using a very small annulus with and pixels. This indicates a rather strong influence of a compact stellar environment of the source s1, whose contribution is optimally taken into account only when performing PSF photometry. The magnitudes of s2 remain constant within the errors and are in good agreement with the PSF measurements, regardless of the size of the annulus chosen to estimate the background level. These results make PSF measurements preferable for both for s1 and s2. Unlike the optical sources within the X-2 error box, there is little doubt that the unique optical counterpart candidate in the X-3 error box is point-like. Therefore, only aperture photometry was carried out for this source. The source magnitudes were measured in a large aperture with a radius of 10 pixels, the background was estimated in an annular aperture with and pixels. The reddening corrected instrumental VEGA magnitudes of the counterpart candidates with statistical errors are given in Table 3. The correction was performed in the PySynphot package with adopted values E(B-V)=0.13 for X-2 (see section 2.3 for details) and E(B-V)=0.017 (Galactic value, (Schlafly & Finkbeiner, 2011)) for X-3.
| Filter | X-2 | X-3 | |
|---|---|---|---|
| s1 | s2 | ||
| F275W | —- | ||
| F336W | —- | ||
| F438W | —- | ||
| F555W | |||
| F814W | |||
2.3 Optical Spectroscopy
Spectroscopy was carried out on 2021 May 13 under relatively bad weather conditions, haze (clouds) appeared periodically, seeing was around 22. Data processing was performed with the context long of midas using the standard algorithm, including bias subtraction, flat field correction, cosmic ray rejection, wavelength and flux calibration. Only the extraction of spectra was carried out without using the midas procedures, instead we used specialized software: spextra (Sarkisyan
et al., 2017).
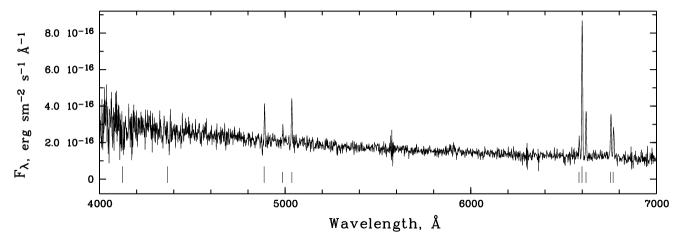
The relatively poor seeing of 22 during our spectral observations did not allow us to separate sources s1 and s2 in the X-2 position error box from the environment. Thus, the acquired data were used only to estimate the reddening from the Balmer decrement in the nebula assuming case B photoionization (Osterbrock & Ferland, 2006). The obtained optical spectrum is shown in Figure 5. The nebula emission lines are clearly seen in the spectrum, the blue continuum and the weak absorption lines marked in the blue part of the spectrum belong to the young stellar population. Having measured the observed ratio of the emissions Hα/Hβ, we obtain the interstellar extinction value mag (()=0.130.10 with ). Such a large uncertainty in the reddening value is associated with a large uncertainty in the depth of Hβ absorption which is presumably from background stars. Note, that lower extinction limit only slightly exceeds the Galactic value mag (Schlafly & Finkbeiner, 2011).
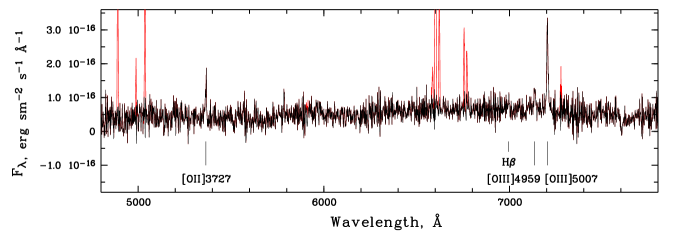
The optical counterpart of X-3 is an object sufficiently isolated from bright sources, which makes it easy to extract its spectrum. However, even in this case, the spectrum of the object is contaminated by the narrow emissions from a nebula surrounding a star-forming region located approximately from the object. After subtracting the nebula contribution, we found several emission features in the residual spectrum which were identified as oxygen lines [OII] 3737, [OIII] 4959, [OIII] 5007, and weak Hβ shifted at 333Statistical errors in the wavelength measurements of the three oxygen lines observed in the AGN spectrum (about 40 km s-1), possible off-centre position of the target in the slit (up to 45 km s-1), and the systematic shift of narrow oxygen lines known for some AGNs relative to other lines (up to km s-1; Boroson 2005) are taken into account for uncertainty calculation of the redshift. The resulting redshift error is obtained as the sum of these three uncertainties.. Thus, it is clear that X-3 is in fact an active galactic nucleus (AGN) that is visible through NGC 4536. The optical spectrum of X-3 is shown in Figure 6 in the 4800–7800 Å range, where all detected object lines are located. We also measured Hα/Hβ ratio in the nebula to estimate the minimal reddening on the line of sight for the AGN in the gas of the nebula and the interstellar medium in front of it. The ratio turned out to be equal to ; within the uncertainties it corresponds to Galactic extinction (Schlafly & Finkbeiner, 2011) adopted for correction of the AGN magnitudes.
2.4 X-ray Analysis
The XMM-Newton data reduction was carried out with sas (Science Analysis Software) version 18.0.0 (Gabriel
et al., 2004). Prior to analyses, re-calibration was performed by using the latest CCF (Current Calibration Files). epchain and emchain tasks were used to obtained calibrated event files of EPIC pn and MOS cameras, respectively. Both event files were filtered in the 0.2 - 12 keV energy band by using the standard event selection expressions within evselect task. The energy spectra of the ULX candidates were extracted by selecting circular regions with a radius of around the sources. For the background spectra, the same size circular regions were used on a source-free region and on the same chip with the sources. X-3 was in the chip gap in the pn image. Therefore only the MOS data were used in the spectral analysis of X-3.
The spectral analysis of the X-ray data was performed using xspec version 12.11.0 (Arnaud, 1996). First the grppha task in ftools package (Blackburn, 1995) was used to group the energy spectra of the sources to have a minimum of 20 counts per bin. Two absorption components (TBABS model in xspec) are included; one was fixed to the Galactic value ( cm-2, Dickey &
Lockman, 1990) and the other was left free to estimate the intrinsic absorption. Powerlaw (PL), disk blackbody (DISKBB) and PL+DISKBB models were used to fit the spectra of the sources. The best-fit model parameters are given in Table 4. The unabsorbed flux values were estimated using the CFLUX convolution model in xspec in the energy range of 0.3 - 10 keV and the luminosity values were calculated at the adopted distance. In addition, we also extracted the optical spectral index, as defined by Tananbaum
et al. (1979). This index depicts a UV-X-ray correlation involving the 2 keV and 2500 Å luminosities respectively, and has been well documented for AGN (Vagnetti et al., 2013; Lusso
et al., 2010). In a recent study, Sonbas et al. (2019) demonstrated the correlation for ULXs and further showed that the slope of the correlation is distinctly different for ULXs and AGNs, a distinguishing feature they suggested as a potential identifier for these different class of sources.
| Source | Model | 1 | (dof) | 2 | ||
|---|---|---|---|---|---|---|
| cm-2 | keV | erg s-1 | ||||
| X-2 | PL | 101.07 (102) | ||||
| DISKBB | <0.02 | 115.08 (102) | ||||
| PL+DISKBB | 100.86 (100) | |||||
| X-3 | PL | 16.61 (11) | ||||
| DISKBB | <0.50 | 16.90 (11) |
Notes: (1) Intrinsic absorption values (hydrogen column densities) toward the sources which were calculated by using TBABS model. (2) The Luminosity values were calculated in the 0.3 10 keV energy range. The adopted distance of the host galaxy was used for X-2 while calculating the luminosities. The distance for X-3 was calculated from the redshift value obtained from the optical spectroscopy of the optical counterpart.
| Optical counterparts | MV | (B-V)0 | OT | Age | log(FX/FV) | log(l2500) | ||
|---|---|---|---|---|---|---|---|---|
| (1) | (2) | (3) | (4) | (5) | (6) | (7) | ||
| X-2 | s1a | -6.2 | -0.3 | OB giant/supergiant | 410 | 81 | -1.050.01 | 23.580.04 |
| s2 | -4.9 | - | KM supergiant | 20 | 315 | - | - | |
| X-3 | -19.08 | 1.54 | AGN | - | 16 | -0.680.05 | 27.060.11 |
Notes: a assuming s1 is a point-like source (see text for details). (1)Absolute magnitudes were obtained from ACS/WFC3 data with adopted distance of 15.8 Mpc. (2) Color value obtained from F438W-F555M (B-V) filters. (3) Object types. (4) Age of the stars in Myr. (5) The FX/FV ratios, (6) X-ray-UV correlation cast in terms of the optical spectral index, . (7) Luminosity at 2500Å in erg s-1 Hz-1
3 Results and Discussion
3.1 Optical
As already noted in Section 2.2, we cannot unambiguously conclude whether s1, one of the two possible X-2 optical counterparts, is point-like or an extended source. In the first case the source emission is likely due to a combination of both the accretion disk and the donor star. If we assume that the donor dominates, its spectral type is estimated as O or early B giant or supergiant (up to Iab). This is based on the intrinsic color 444The intrinsic color was calculated using PySynphot from F438W and F555W magnitudes. and the absolute magnitude mag, where errors take into account the statistical errors, the statistical and systematic accuracy of the distance modulus from Hatt
et al. (2018) and reddening uncertainty. Theoretical stellar parameters were taken from Fitzgerald (1970); Straizys &
Kuriliene (1981). On the other hand, both and color value are characteristic of most bright blue ULX counterparts (Tao
et al., 2011) dominated by radiation from a hot supercritical disk as proposed in Vinokurov et al. (2018). If s1 is an extended source, then it is most likely that it is a star cluster or an association. X-2 can be associated with one of the members of this cluster, and its brightness will be significantly lower than the total brightness of the cluster (). In this case, the optical counterpart of X-2 will be among the weak sources in the distribution of ULXs by absolute magnitudes (Vinokurov et al., 2018).
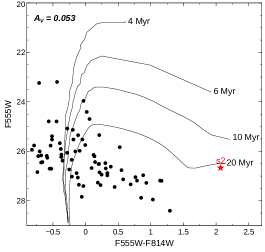
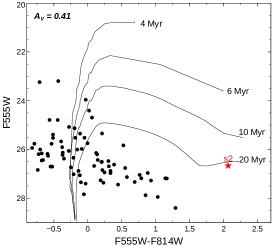
The second optical counterpart candidate, s2, is detected as a point-like source with reliably measured brightness only in the F555 and F814 filters. In blue filters, the source is below the detection threshold with a signal-to-noise ratio S/N = 3. Its intrinsic ; the color, calculated from F555W-F814W, and the absolute magnitude , correspond555 colors for red supergiants were calculated using ATLAS9 (Castelli &
Kurucz, 2003) stellar atmosphere models for solar abundance from late K to early M supergiants close to luminosity class Ib. Donors of this type were previously detected in some ULXs by spectral methods based on absorption features in the spectra (Heida
et al., 2019; López
et al., 2020).
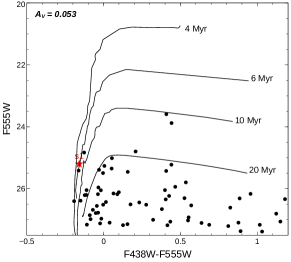
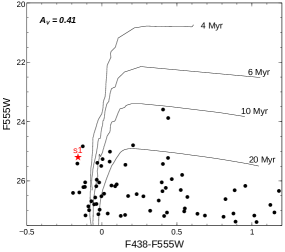
If the optical emission is assumed to be dominated by the donor star, it is possible to constrain the age of the donor star by comparing the source with theoretical isochrones. We therefore constructed color-magnitude diagrams (CMDs) for the optical candidates of X-2 in order to estimate the age of the sources. F555W (roughly corresponds to Johnson band) versus F438W-F555W diagram was used for s1. Since s2 was not detected in F438W filter, the CMDs for this source were obtained using F555W versus F555W-F814W . The PARSEC (Padova and Trieste Stellar Evolution Code) isochrones666http://stev.oapd.inaf.it/cgi-bin/cmd for HST/WFC3 photometric system were adopted (Bressan et al. 2012). The metallicity was taken as solar value while constructing these isochrones. Two CMDs were obtained for both sources by using extinction values (Galactic value) and (obtained from optical spectra) with the distance modulus 30.99 mag (Hatt
et al., 2018). The CMDs for the optical counterpart candidates of X-2 (and field stars) are shown in Figure 7 and 8. As can be seen in the Figure 7, the CMD obtained using Galactic extinction gave better result for s1. Therefore we estimated the age values for s1 using the upper panel in Figure 7. In the case of s2, both extinction values yielded a similar result. The estimated age values are given in Table 5.
The spectrum of X-3 convincingly shows that this source is indeed an AGN with a redshift of , and not an X-ray source in NGC 4536 galaxy. This serves as an illustration of the importance of optical observations, especially spectroscopy, as a valuable asset in clarifying the nature of X-ray sources. The estimated parameters for the optical counterpart of X-2 and X-3 are given in Table 5.
3.2 X-rays
The X-ray to optical flux ratios () were calculated (Aird
et al., 2010; Avdan
et al., 2016) and were found to be 81, 315 for s1 and s2 (of X-2), and 16 for X-3, respectively. The ratios for s1 and s2 are similar to the range for the known ULXs. The ratio for X-3 is in agreement with the range that is derived from the majority of the AGNs (0.1 - 10) (Aird
et al., 2010) and also below the observed range for ULXs (Avdan
et al., 2016; Fabrika et al., 2021). The extracted values of are listed in Table 5. We note that the for X-2 agrees very well with those reported by Sonbas et al. (2019) for a sample of well-known ULXs. The for X-3, on the other hand, does not follow the ULX correlation but instead is in excellent agreement with values typically associated with AGN (Vagnetti et al., 2013; McAlpine et al., 2011; Lusso
et al., 2010; Sonbas et al., 2019). This difference in the alone suggests that X-3 is not a ULX but is instead a background AGN.
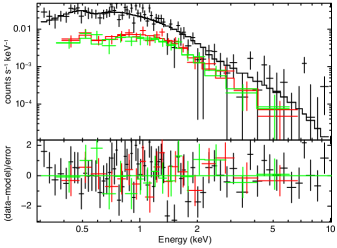
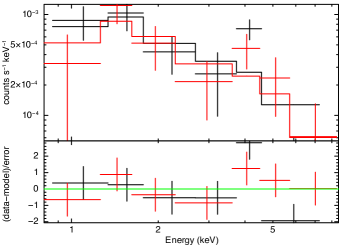
Our analysis of the X-ray spectra for the two sources is somewhat less firm primarily because of the low photon statistics but nonetheless we report the results here for completeness. The best-fit model parameters are given in Table 4. As can be seen in Table 4, for X-2 PL+DISKBB and for X-3 PL model yielded a slightly better fit although arguably the difference in the is minimal. The energy spectra of the sources with the best-fit models are displayed in Figure 9. It is noteworthy that X-2 fit parameters suggest a significant thermal emission component while X-3 tends to favor a larger non-thermal component (with a spectral index = 1.16 0.28), as would be expected in the case of an AGN source. This index is relatively low compared to what one might expect based on a sample of the general AGN population. However, we note that this value is consistent with the value given by Liu et al. (2016), in which they performed a spectral analysis of a number of low-redshift, low-luminosity X-ray- obscured type 2 AGN (see their Table 6). We also mention the work of Lehmer
et al. (2021), who studied the X-ray population in NGC 4536. Their source 16 is our X-3 source, for which they report a spectral index of 1.490.93, in agreement with our result. They list the column density as (9.711) x 1021 cm-2: The very large uncertainty suggests that either the absorption due to the host galaxy is negligible or their model fit and/or their spectrum statistics are inadequate to constrain the column density.
4 Summary and Conclusions
We have deployed archival Chandra, XMM-Newton, and HST data to search for optical counterparts of two previously catalogued ULX candidates in NGC 4536. We applied an astrometric correction to extract accurate coordinates of potential optical counterparts. Also, the optical spectra were used to extract the redshift from the observed oxygen lines. The X-ray and optical fluxes were used to determine the ratios, and the luminosities at 2 keV and 2500 Å respectively were used to calculate the optical spectral indices for both sources. The available X-ray spectra were fitted with appropriate models in order to ascertain whether the emissions were thermal, non-thermal or exhibited features consistent with the presence of both components. We summarize our main findings as follows:
-
•
The flux ratios are in a range that is consistent with the ratios observed for ULXs and AGN
-
•
The optical spectral index for X-2 is consistent with that found for ULXs as reported by Sonbas et al. (2019). However, the index for X-3 is inconsistent with values for ULXs and is, instead, in agreement with the index found for low-z AGN (Vagnetti et al., 2013; Lusso et al., 2010; Sonbas et al., 2019)
-
•
The X-ray spectrum of X-2 is well fitted with a disk blackbody model suggestive of predominantly thermal emission. X-3, on the other hand, presents a slightly better fit with a powerlaw, with a spectral index of = 1.16 0.28, indicating a significant non-thermal component in the emission.
-
•
The optical spectrum obtained with the BTA 6m telescope for X-3 shows a number of redshifted oxygen lines; the extracted redshift (z = 0.43910.0010) is higher then the host galaxy, a clear indication that this source is a background AGN. No such shift is detected for X-2.
-
•
Two candidates have been identified as optical counterparts for X-2, one of which is a blue source (s1) and the other is a red one (s2). The star-like nature of s1 raises some doubts i.e., we cannot rule out that it is a compact star cluster. In that case, X-2 could be one of the members of this cluster, and its brightness then would fall in the low-end of the optical range for ULXs. If, on the other hand, s1 is a point-like source and its measured extent is due to a very close and complex environment, then the reddening-corrected absolute magnitude and color place it in the category of an O-B star (with luminosity class III to Iab). The absolute magnitude and color of the second candidate (s2) correspond to a red supergiant. Based on CMDs, we estimate ages of both s1 and s2 for the case of donor star domination in their optical emission as 410 Myr and 20 Myr, respectively.
Acknowledgements
This research was supported by the Scientific and Technological Research Council of Turkey (TÜBİTAK) through project number 119F334. Observations with the SAO RAS telescopes are supported by the Ministry of Science and Higher Education of the Russian Federation. The renovation of telescope equipment is currently provided within the national project "Science and universities". Optical research was supported by the Russian Science Foundation (project no. 21-72-10167 ULXs: wind and donors).
Data Availability
The scientific results reported in this article are based on archival observations made by the Chandra and XMM-Newton Observatories. This work has also made use of observations made with the NASA/ESA Hubble Space Telescope, and obtained from the data archive at the Space Telescope Science Institute. These data are freely available from the appropriate archives. Additional optical data were acquired with the use of the BTA 6m telescope located at the Special Astrophysical Observatory (SAO). The ground-based optical spectra will be made available upon reasonable request.
References
- Afanasiev & Moiseev (2011) Afanasiev V. L., Moiseev A. V., 2011, Baltic Astronomy, 20, 363
- Aird et al. (2010) Aird J., et al., 2010, MNRAS, 401, 2531
- Akyuz et al. (2020) Akyuz A., Avdan S., Allak S., Aksaker N., Akkaya Oralhan I., Balman S., 2020, MNRAS, 499, 2138
- Arnaud (1996) Arnaud K. A., 1996, in Jacoby G. H., Barnes J., eds, Astronomical Society of the Pacific Conference Series Vol. 101, Astronomical Data Analysis Software and Systems V. p. 17
- Arp et al. (2004) Arp H., Gutiérrez C. M., López-Corredoira M., 2004, A&A, 418, 877
- Atapin et al. (2020) Atapin K., Vinokurov A., Sarkisyan A., Solovyeva Y., Medvedev A., Fabrika S., Kostenkov A., 2020, arXiv e-prints, p. arXiv:2011.00795
- Avdan et al. (2016) Avdan S., et al., 2016, MNRAS, 455, L91
- Avdan et al. (2019) Avdan S., et al., 2019, ApJ, 875, 68
- Bachetti et al. (2014) Bachetti M., et al., 2014, Nature, 514, 202
- Begelman (2002) Begelman M. C., 2002, ApJ, 568, L97
- Blackburn (1995) Blackburn J. K., 1995, in Shaw R. A., Payne H. E., Hayes J. J. E., eds, Astronomical Society of the Pacific Conference Series Vol. 77, Astronomical Data Analysis Software and Systems IV. p. 367
- Boroson (2005) Boroson T., 2005, AJ, 130, 381
- Carpano et al. (2018) Carpano S., Haberl F., Maitra C., Vasilopoulos G., 2018, MNRAS, 476, L45
- Castelli & Kurucz (2003) Castelli F., Kurucz R. L., 2003, in Piskunov N., Weiss W. W., Gray D. F., eds, Vol. 210, Modelling of Stellar Atmospheres. p. A20 (arXiv:astro-ph/0405087)
- Clark et al. (2005) Clark D. M., et al., 2005, ApJ, 631, L109
- Colbert & Mushotzky (1999) Colbert E. J. M., Mushotzky R. F., 1999, ApJ, 519, 89
- Dadina et al. (2013) Dadina M., Masetti N., Cappi M., Malaguti G., Miniutti G., Ponti G., Gandhi P., De Marco B., 2013, A&A, 559, A86
- Dickey & Lockman (1990) Dickey J. M., Lockman F. J., 1990, ARA&A, 28, 215
- Dolphin (2000) Dolphin A. E., 2000, PASP, 112, 1383
- Dolphin (2016) Dolphin A., 2016, DOLPHOT: Stellar photometry (ascl:1608.013)
- Earnshaw et al. (2019) Earnshaw H. P., Roberts T. P., Middleton M. J., Walton D. J., Mateos S., 2019, MNRAS, 483, 5554
- Egorov et al. (2017) Egorov O. V., Lozinskaya T. A., Moiseev A. V., 2017, MNRAS, 467, L1
- Fabrika et al. (2015) Fabrika S., Ueda Y., Vinokurov A., Sholukhova O., Shidatsu M., 2015, Nature Physics, 11, 551
- Fabrika et al. (2021) Fabrika S. N., Atapin K. E., Vinokurov A. S., Sholukhova O. N., 2021, Astrophysical Bulletin, 76, 6
- Farrell et al. (2009) Farrell S. A., Webb N. A., Barret D., Godet O., Rodrigues J. M., 2009, Nature, 460, 73
- Feng & Kaaret (2006) Feng H., Kaaret P., 2006, ApJ, 653, 536
- Feng & Kaaret (2009) Feng H., Kaaret P., 2009, ApJ, 696, 1712
- Feng & Soria (2011) Feng H., Soria R., 2011, New Astron. Rev., 55, 166
- Fitzgerald (1970) Fitzgerald M. P., 1970, A&A, 4, 234
- Fürst et al. (2016) Fürst F., et al., 2016, ApJ, 831, L14
- Gabriel et al. (2004) Gabriel C., et al., 2004, in Ochsenbein F., Allen M. G., Egret D., eds, Astronomical Society of the Pacific Conference Series Vol. 314, Astronomical Data Analysis Software and Systems (ADASS) XIII. p. 759
- Gladstone et al. (2013) Gladstone J. C., Copperwheat C., Heinke C. O., Roberts T. P., Cartwright T. F., Levan A. J., Goad M. R., 2013, ApJS, 206, 14
- Grimm et al. (2003) Grimm H. J., Gilfanov M., Sunyaev R., 2003, Astronomische Nachrichten, 324, 171
- Grisé et al. (2011) Grisé F., Kaaret P., Pakull M. W., Motch C., 2011, ApJ, 734, 23
- Grisé et al. (2012) Grisé F., Kaaret P., Corbel S., Feng H., Cseh D., Tao L., 2012, ApJ, 745, 123
- Gutiérrez (2013) Gutiérrez C. M., 2013, A&A, 549, A81
- Hatt et al. (2018) Hatt D., et al., 2018, ApJ, 861, 104
- Heida et al. (2019) Heida M., et al., 2019, ApJ, 883, L34
- Israel et al. (2017) Israel G. L., et al., 2017, MNRAS, 466, L48
- Kaaret et al. (2004) Kaaret P., Ward M. J., Zezas A., 2004, MNRAS, 351, L83
- Kaaret et al. (2017) Kaaret P., Feng H., Roberts T. P., 2017, ARA&A, 55, 303
- Kajava & Poutanen (2009) Kajava J. J. E., Poutanen J., 2009, MNRAS, 398, 1450
- King & Lasota (2016) King A., Lasota J.-P., 2016, MNRAS, 458, L10
- King et al. (2001) King A. R., Davies M. B., Ward M. J., Fabbiano G., Elvis M., 2001, ApJ, 552, L109
- Kuntz et al. (2005) Kuntz K. D., Gruendl R. A., Chu Y.-H., Chen C. H. R., Still M., Mukai K., Mushotzky R. F., 2005, ApJ, 620, L31
- Lehmer et al. (2021) Lehmer B. D., et al., 2021, ApJ, 907, 17
- Liu et al. (2004) Liu J.-F., Bregman J. N., Seitzer P., 2004, ApJ, 602, 249
- Liu et al. (2016) Liu Z., et al., 2016, MNRAS, 459, 1602
- López et al. (2020) López K. M., Heida M., Jonker P. G., Torres M. A. P., Roberts T. P., Walton D. J., Moon D. S., Harrison F. A., 2020, MNRAS, 497, 917
- Lusso et al. (2010) Lusso E., et al., 2010, A&A, 512, A34
- Masetti et al. (2003) Masetti N., Foschini L., Ho L. C., Dadina M., Di Cocco G., Malaguti G., Palazzi E., 2003, A&A, 406, L27
- McAlpine et al. (2011) McAlpine W., Satyapal S., Gliozzi M., Cheung C. C., Sambruna R. M., Eracleous M., 2011, ApJ, 728, 25
- Middleton & King (2017) Middleton M. J., King A., 2017, MNRAS, 470, L69
- Motch et al. (2011) Motch C., Pakull M. W., Grisé F., Soria R., 2011, Astronomische Nachrichten, 332, 367
- Osterbrock & Ferland (2006) Osterbrock D. E., Ferland G. J., 2006, Astrophysics of gaseous nebulae and active galactic nuclei. CA: University Science Books
- Patruno & Zampieri (2010) Patruno A., Zampieri L., 2010, MNRAS, 403, L69
- Pintore et al. (2018) Pintore F., et al., 2018, MNRAS, 477, L90
- Poutanen et al. (2013) Poutanen J., Fabrika S., Valeev A. F., Sholukhova O., Greiner J., 2013, MNRAS, 432, 506
- Quintin et al. (2021) Quintin E., Webb N. A., Gúrpide A., Bachetti M., Fürst F., 2021, MNRAS, 503, 5485
- Ranalli et al. (2003) Ranalli P., Comastri A., Setti G., 2003, A&A, 399, 39
- Roberts (2007) Roberts T. P., 2007, Ap&SS, 311, 203
- Rodríguez Castillo et al. (2020) Rodríguez Castillo G. A., et al., 2020, ApJ, 895, 60
- Sarkisyan et al. (2017) Sarkisyan A. N., Vinokurov A. S., Solovieva Y. N., Sholukhova O. N., Kostenkov A. E., Fabrika S. N., 2017, Astrophysical Bulletin, 72, 486
- Sathyaprakash et al. (2019) Sathyaprakash R., et al., 2019, MNRAS, 488, L35
- Schlafly & Finkbeiner (2011) Schlafly E. F., Finkbeiner D. P., 2011, ApJ, 737, 103
- Singha & Devi (2019) Singha A. C., Devi A. S., 2019, Journal of Korean Astronomical Society, 52, 1
- Sonbas et al. (2019) Sonbas E., Dhuga K. S., Göğüş E., 2019, ApJ, 873, L12
- Soria et al. (2012) Soria R., Kuntz K. D., Winkler P. F., Blair W. P., Long K. S., Plucinsky P. P., Whitmore B. C., 2012, ApJ, 750, 152
- Straizys & Kuriliene (1981) Straizys V., Kuriliene G., 1981, Ap&SS, 80, 353
- Sutton et al. (2012) Sutton A. D., Roberts T. P., Walton D. J., Gladstone J. C., Scott A. E., 2012, MNRAS, 423, 1154
- Sutton et al. (2013) Sutton A. D., Roberts T. P., Middleton M. J., 2013, MNRAS, 435, 1758
- Swartz et al. (2009) Swartz D. A., Tennant A. F., Soria R., 2009, ApJ, 703, 159
- Tananbaum et al. (1979) Tananbaum H., et al., 1979, ApJ, 234, L9
- Tao et al. (2011) Tao L., Feng H., Grisé F., Kaaret P., 2011, ApJ, 737, 81
- Urquhart et al. (2018) Urquhart R., Soria R., Johnston H. M., Pakull M. W., Motch C., Schwope A., Miller-Jones J. C. A., Anderson G. E., 2018, MNRAS, 475, 3561
- Vagnetti et al. (2013) Vagnetti F., Antonucci M., Trevese D., 2013, A&A, 550, A71
- Vinokurov et al. (2018) Vinokurov A., Fabrika S., Atapin K., 2018, ApJ, 854, 176
- Vinokurov et al. (2020) Vinokurov A., Atapin K., Solovyeva Y., Sarkisyan A., Oparin D., 2020, in Romanyuk I. I., Yakunin I. A., Valeev A. F., Kudryavtsev D. O., eds, Ground-Based Astronomy in Russia. 21st Century. pp 95–99 (arXiv:2010.05866), doi:10.26119/978-5-6045062-0-2_2020_95
- Walton et al. (2021) Walton D. J., et al., 2021, MNRAS, 501, 1002
- de Vaucouleurs et al. (1976) de Vaucouleurs G., de Vaucouleurs A., Corwin H. G. J., 1976, Second reference catalogue of bright galaxies. Containing information on 4,364 galaxies with references to papers published between 1964 and 1975.