11email: marcelino.agundez@csic.es, octavio.roncero@csic.es 22institutetext: Observatorio Astronómico Nacional, IGN, Calle Alfonso XII 3, 28014 Madrid, Spain 33institutetext: Observatorio de Yebes, IGN, Cerro de la Palera s/n, 19141 Yebes, Guadalajara, Spain
The chemistry of H2NC in the interstellar medium and
the role of the C + NH3 reaction††thanks: Based on observations carried out with the IRAM 30m Telescope. IRAM is supported by INSU/CNRS (France), MPG (Germany) and IGN (Spain).
We carried out an observational search for the recently discovered molecule H2NC, and its more stable isomer H2CN, toward eight cold dense clouds (L1544, L134N, TMC-2, Lupus-1A, L1489, TMC-1 NH3, L1498, and L1641N) and two diffuse clouds (B0415+379 and B0355+508) in an attempt to constrain its abundance in different types of interstellar regions and shed light on its formation mechanism. We detected H2NC in most of the cold dense clouds targeted, 7 out of 8, while H2CN was only detected in 5 out of 8 clouds. The column densities derived for both H2NC and H2CN are in the range 1011-1012 cm-2 and the abundance ratio H2NC/H2CN varies between 0.51 and 2.7. The metastable isomer H2NC is therefore widespread in cold dense clouds where it is present with an abundance similar to that of H2CN. We did not detect either H2NC or H2CN in any of the two diffuse clouds targeted, which does not allow to shed light on how the chemistry of H2NC and H2CN varies between dense and diffuse clouds. We found that the column density of H2NC is correlated with that of NH3, which strongly suggests that these two molecules are chemically linked, most likely ammonia being a precursor of H2NC through the C + NH3 reaction. We performed electronic structure and statistical calculations which show that both H2CN and H2NC can be formed in the C + NH3 reaction through two different channels involving two different transition states which lie very close in energy. The predicted product branching ratio H2NC/H2CN is very method dependent but values between 0.5 and 0.8 are the most likely ones. Therefore, both the astronomical observations and the theoretical calculations support that the reaction C + NH3 is the main source of H2NC in interstellar clouds.
Key Words.:
astrochemistry – line: identification – molecular processes – ISM: molecules – radio lines: ISM1 Introduction
The detection of H2NC in the interstellar medium by Cabezas et al. (2021) came as a surprise. The observation of several groups of unidentified lines in the cold dense clouds L483 and B1-b motivated the search for potential carriers, among which H2NC was not initially considered. Only after many plausible candidates were ruled out, H2NC was found to confidently reproduce the complex spectral pattern of astronomical lines. H2NC was not initially considered as a plausible carrier because it is a high-energy isomer of H2CN, which lies 30 kcal mol-1 above in energy (Puzzarini, 2010; Cabezas et al., 2021). Moreover, there are two isomers not yet detected in space which are substantially more stable than H2NC. These are the trans and cis forms of HCNH, which lie 8 and 13 kcal mol-1, respectively, above the most stable isomer H2CN (Puzzarini, 2010; Cabezas et al., 2021). It is worth to note that although H2NC is the least stable member of this family of four isomers, it is the one showing the most intense lines in L483 and B1-b.
The discovery of interstellar H2NC came with several interesting implications. In addition to L483 and B1-b, H2NC was also detected toward the = 0.89 galaxy in front of the quasar PKS 1830211, which is a high-redshift source exceptionally rich in molecules (Muller et al., 2011; Tercero et al., 2020). The fact that the abundance ratio H2NC/H2CN is 1 in L483 and B1-b and 0.27 toward PKS 1830211 suggests that this ratio behaves as the HNC/HCN ratio, with values close to one in cold dense clouds and below one in diffuse clouds (Hirota et al., 1998; Sarrasin et al., 2010; Liszt & Lucas, 2001). Surprisingly, neither H2NC nor H2CN were detected toward the cyanopolyyne peak of TMC-1 (hereafter TMC-1 CP) in spite of a previous claim of detection of H2CN in this cloud by Ohishi et al. (1994). While TMC-1 CP is a young starless core rich in carbon chains, L483 and B1-b are more evolved sources rich in molecules such as ammonia. The detection of H2NC in L483 and B1-b and its non detection in TMC-1 CP suggests that this species is more favored in NH3-rich sources. This would be in line with the suspected chemical origin of H2NC due to the reaction C + NH3 (see discussion in Cabezas et al. 2021).
In order to shed light on the issues raised by the discovery of H2NC, that is, whether or not the H2NC/H2CN ratio behaves differently in dense and diffuse clouds, as occurs for the HNC/HCN ratio, and whether or not there is a correlation between the abundances of H2NC and NH3, which would reflect a chemical link between the two species, we carried out an observational survey to search for H2NC, and simultaneously for H2CN, toward a sample of dense and diffuse clouds with the IRAM 30m telescope. Here we report the results of this survey. We also present a computational study of the reaction between C and NH3 aimed at investigating whether or not H2NC can be formed in this reaction at the low temperatures of cold interstellar clouds.
2 Astronomical observations
| Source | RA(J2000.0) | Dec(J2000.0) |
|---|---|---|
| L1544 | 05:04:18.10 | 25:10:48.0 |
| L134N | 15:54:06.55 | 02:52:19.1 |
| TMC-2 | 04:32:44.74 | 24:24:33.5 |
| Lupus-1A | 15:42:52.40 | 34:07:53.5 |
| L1489 | 04:04:50.60 | 26:18:29.4 |
| TMC-1 NH3 | 04:41:23.02 | 25:48:13.3 |
| L1498 | 04:10:51.46 | 25:09:58.2 |
| L1641N | 05:36:19.01 | 06:22:13.3 |
| B0415+379 | 04:18:21.28 | 38:01:35.8 |
| B0355+508 | 03:59:29.75 | 50:57:50.2 |
| Source | Molecule | Transition | peak | ||||
|---|---|---|---|---|---|---|---|
| (MHz) | (km s-1) | (km s-1) | (mK) | (mK km s-1) | |||
| L1544 | H2NC | 10,1-00,0 = 1.5-0.5 = 2.5-1.5 = 3.5-2.5 | 72194.211 | 7.10(2) | 0.49(4) | 31.7(2) | 16.5(10) |
| L1544 | H2NC | 10,1-00,0 = 1.5-0.5 = 2.5-1.5 = 2.5-1.5 | 72210.940 | 7.13(3) | 0.48(6) | 26.4(2) | 13.4(14) |
| L134N | H2NC | 10,1-00,0 = 1.5-0.5 = 2.5-1.5 = 3.5-2.5 | 72194.211 | 2.40(2) | 0.47(3) | 39.4(3) | 19.6(10) |
| L134N | H2NC | 10,1-00,0 = 1.5-0.5 = 2.5-1.5 = 2.5-1.5 | 72210.940 | 2.40(3) | 0.43(6) | 25.7(3) | 11.8(15) |
| TMC-2 | H2NC | 10,1-00,0 = 1.5-0.5 = 2.5-1.5 = 3.5-2.5 | 72194.211 | 6.19(5) | 0.45(13) | 19.4(5) | 9.3(21) |
| TMC-2 | H2NC | 10,1-00,0 = 1.5-0.5 = 2.5-1.5 = 2.5-1.5 | 72210.940 | 6.25(4) | 0.20(10) | 16.8(5) | 3.6(16) a |
| Lupus-1A | H2NC | 10,1-00,0 = 1.5-0.5 = 2.5-1.5 = 3.5-2.5 | 72194.211 | 5.00(8) | 0.40(19) | 18.9(5) | 8.0(27) |
| Lupus-1A | H2NC | 10,1-00,0 = 1.5-0.5 = 2.5-1.5 = 2.5-1.5 | 72210.940 | 5.11(5) | 0.34(10) | 17.7(5) | 6.4(17) |
| L1489 | H2NC | 10,1-00,0 = 1.5-0.5 = 2.5-1.5 = 3.5-2.5 | 72194.211 | 6.66(4) | 0.50(9) | 14.1(3) | 7.4(12) |
| L1489 | H2NC | 10,1-00,0 = 1.5-0.5 = 2.5-1.5 = 2.5-1.5 | 72210.940 | 6.71(5) | 0.39(10) | 14.2(3) | 5.9(14) |
| TMC-1 NH3 | H2NC | 10,1-00,0 = 1.5-0.5 = 2.5-1.5 = 3.5-2.5 | 72194.211 | 5.89(3) | 0.54(8) | 22.8(2) | 13.0(17) |
| TMC-1 NH3 | H2NC | 10,1-00,0 = 1.5-0.5 = 2.5-1.5 = 2.5-1.5 | 72210.940 | 5.86(4) | 0.54(9) | 22.4(2) | 12.7(18) |
| L1498 | H2NC | 10,1-00,0 = 1.5-0.5 = 2.5-1.5 = 3.5-2.5 | 72194.211 | 7.71(5) | 0.57(14) | 16.7(4) | 10.2(20) |
| L1498 | H2NC | 10,1-00,0 = 1.5-0.5 = 2.5-1.5 = 2.5-1.5 | 72210.940 | 7.80(2) | 0.20(10) | 20.2(4) | 4.4(13) |
| L1544 | H2CN | 10,1-00,0 = 1.5-0.5 = 2.5-1.5 = 2.5-1.5 | 73345.486 | 7.19(3) | 0.39(7) | 14.9(2) | 6.2(9) |
| L1544 | H2CN | 10,1-00,0 = 1.5-0.5 = 2.5-1.5 = 3.5-2.5 | 73349.648 | 7.23(3) | 0.40(5) | 17.8(2) | 7.6(9) |
| L134N | H2CN | 10,1-00,0 = 1.5-0.5 = 2.5-1.5 = 2.5-1.5 | 73345.486 | 2.53(7) | 0.40(15) | 6.6(2) | 2.8(9) a |
| L134N | H2CN | 10,1-00,0 = 1.5-0.5 = 2.5-1.5 = 3.5-2.5 | 73349.648 | 2.45(5) | 0.50(15) | 11.8(2) | 6.3(14) |
| TMC-2 | H2CN | 10,1-00,0 = 1.5-0.5 = 2.5-1.5 = 2.5-1.5 | 73345.486 | 6.40(11) | 0.67(22) | 10.5(4) | 7.5(23) |
| TMC-2 | H2CN | 10,1-00,0 = 1.5-0.5 = 2.5-1.5 = 3.5-2.5 | 73349.648 | 6.47(7) | 0.46(20) | 17.0(4) | 8.2(25) |
| Lupus-1A | H2CN | 10,1-00,0 = 1.5-0.5 = 2.5-1.5 = 2.5-1.5 | 73345.486 | 4.97(9) | 0.31(16) | 9.9(4) | 3.3(16) a |
| Lupus-1A | H2CN | 10,1-00,0 = 1.5-0.5 = 2.5-1.5 = 3.5-2.5 | 73349.648 | 5.10(2) | 0.20(10) | 28.9(4) | 6.1(16) |
| L1489 | H2CN | 10,1-00,0 = 1.5-0.5 = 2.5-1.5 = 2.5-1.5 | 73345.486 | 6.49(5) | 0.49(13) | 7.8(2) | 4.1(9) |
| L1489 | H2CN | 10,1-00,0 = 1.5-0.5 = 2.5-1.5 = 3.5-2.5 | 73349.648 | 6.86(5) | 0.33(8) | 9.1(2) | 3.2(8) |
The line parameters , (full width at half maximum), peak, and were derived from a Gaussian fit to the line profile. Numbers in parentheses are 1 uncertainties in units of the last digits. a Marginal detection.
The astronomical observations were carried out with the IRAM 30m telescope during December 2021, April 2022, and June 2022. The weather conditions ranged from very good to moderate, with levels of precipitable water vapor in the range 1-10 mm. We used the EMIR E090 receiver connected to a fast Fourier transform spectrometer providing a spectral resolution of 48.8 kHz. We targeted the 10,1-00,0 rotational transition of ortho H2NC, which consists of multiples hyperfine components around 72.2 GHz, and the 10,1-00,0 transition of ortho H2CN, which has the strongest hyperfine components around 73.3 GHz. For both H2NC and H2CN, ortho levels have even, while para levels have odd.
We searched for H2NC toward the cold dense clouds L1544, L134N, TMC-2, Lupus-1A, L1489, TMC-1 at the peak position of NH3 (hereafter TMC-1 NH3), L1498, and L1641N, and toward the diffuse clouds B0355+508 and B0415+379. The source coordinates are given in Table 1. The criteria to select these sources were bright emission of HNC, based on the expected analogy of the H2NC/H2CN and HNC/HCN ratios, and bright emission of NH3, because of the potential correlation between H2NC and NH3. We used the studies of cold dense clouds by Suzuki et al. (1992) for ammonia data and by Hirota et al. (1998) for HNC data. We also included the dense core Lupus-1A because of its similarity to TMC-1 CP (Sakai et al., 2010). Regarding diffuse clouds, we included the two clouds among the sample of Liszt & Lucas (2001) with the deepest absorption of HNC, B0415+379 and B0355+508, both of which show also deep absorption by NH3 (Liszt et al., 2006).
For the cold dense clouds the observations were carried out in the frequency-switching observing mode with a frequency throw of 7.2 MHz, while for the diffuse clouds we used the wobbler-switching observing mode with the secondary mirror nutating by 3′ at a rate of 0.5 Hz. Focus was checked at the beginning of each observing session and after sunrise and sunset and pointing was regularly checked every 1 h. The intensity scale is expressed in terms of , the antenna temperature corrected for atmospheric absorption and for antenna ohmic and spillover losses. The uncertainty in is estimated to be around 10 %. All data were reduced using the program CLASS from the software GILDAS111https://www.iram.fr/IRAMFR/GILDAS/.
3 Astronomical results
3.1 Detections and non-detections of H2NC and H2CN
The high-energy isomer H2NC turned out to be easier to detect than its more stable isomer H2CN. We detected H2NC in 7 out of the 8 cold dense clouds targeted (L1544, L134N, TMC-2, Lupus-1A, L1489, TMC-1 NH3, and L1498; that is, in all but L1641N), while H2CN was only detected in 5 of these sources (L1544, L134N, TMC-2, Lupus-1A, and L1489). On the other hand, neither H2NC nor H2CN were detected in the two diffuse clouds observed, B0415+379 and B0355+508.
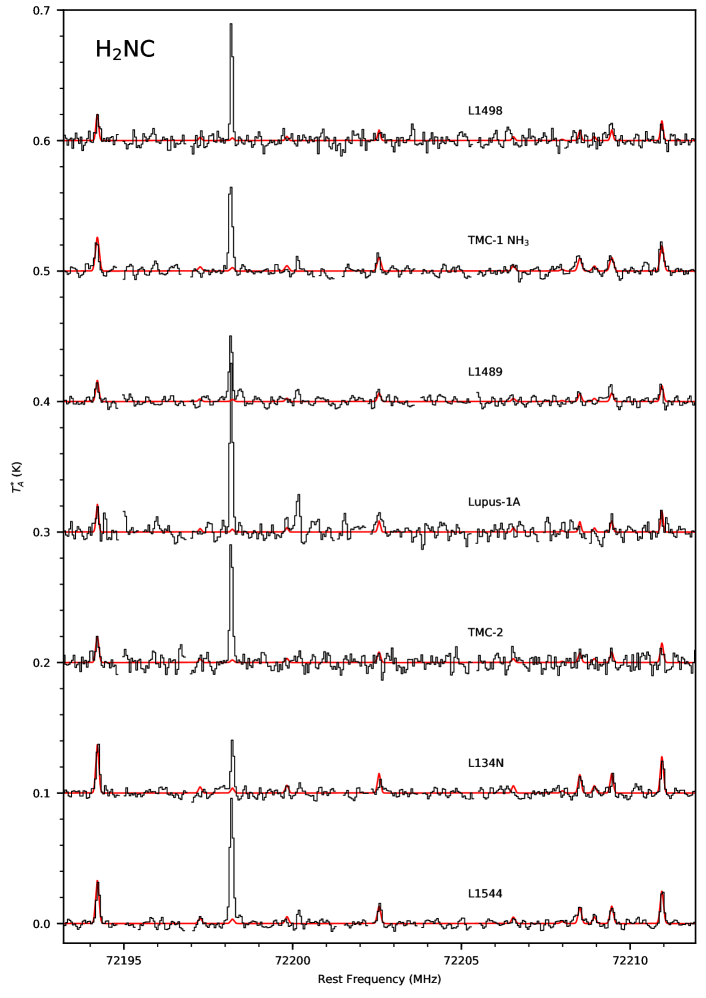
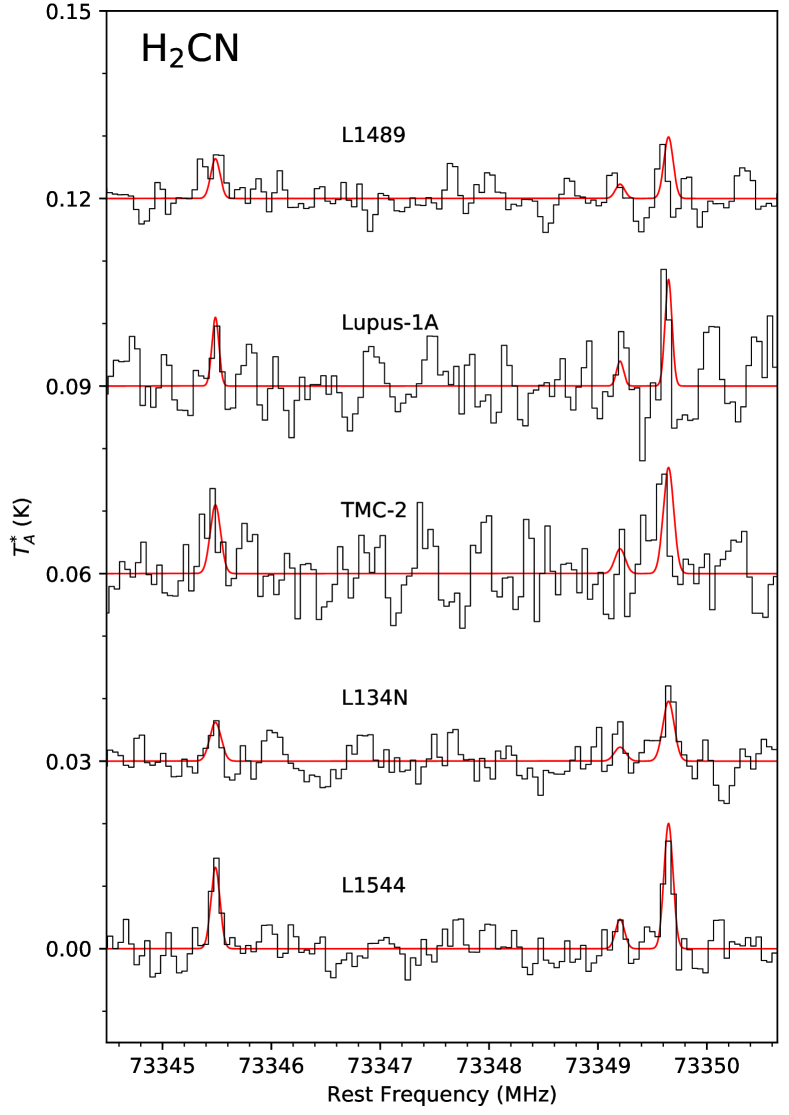
We searched for H2NC through the 10,1-00,0 transition, which lies around 72.2 GHz and spreads over 50 MHz due to fine and hyperfine splitting (see Cabezas et al. 2021). In Fig. 1 we show the part of the spectrum covering the two brightest hyperfine components for the 7 cold dense clouds where H2NC was detected. The strongest component at 72194.211 MHz is well detected in the 7 sources, while the second strongest one at 72210.940 MHz is well seen in all sources except TMC-2, where it is only marginally detected. In addition, there are various weaker hyperfine components for which there is a good match between observed and calculated spectra. The line parameters for the two strongest components of H2NC 10,1-00,0 are given in Table 2. In the case of H2CN, we targeted the 10,1-00,0 transition, which lies around 73.3 GHz and has also a complex hyperfine pattern with components spread over almost 200 MHz. We show the observed spectra around the most intense component, lying at 73349.648 MHz, for the 5 cold dense clouds where H2CN was detected in Fig. 2. In some of the sources the weaker component at 73345.486 MHz is also clearly seen. The line parameters for these two components are given in Table 2.
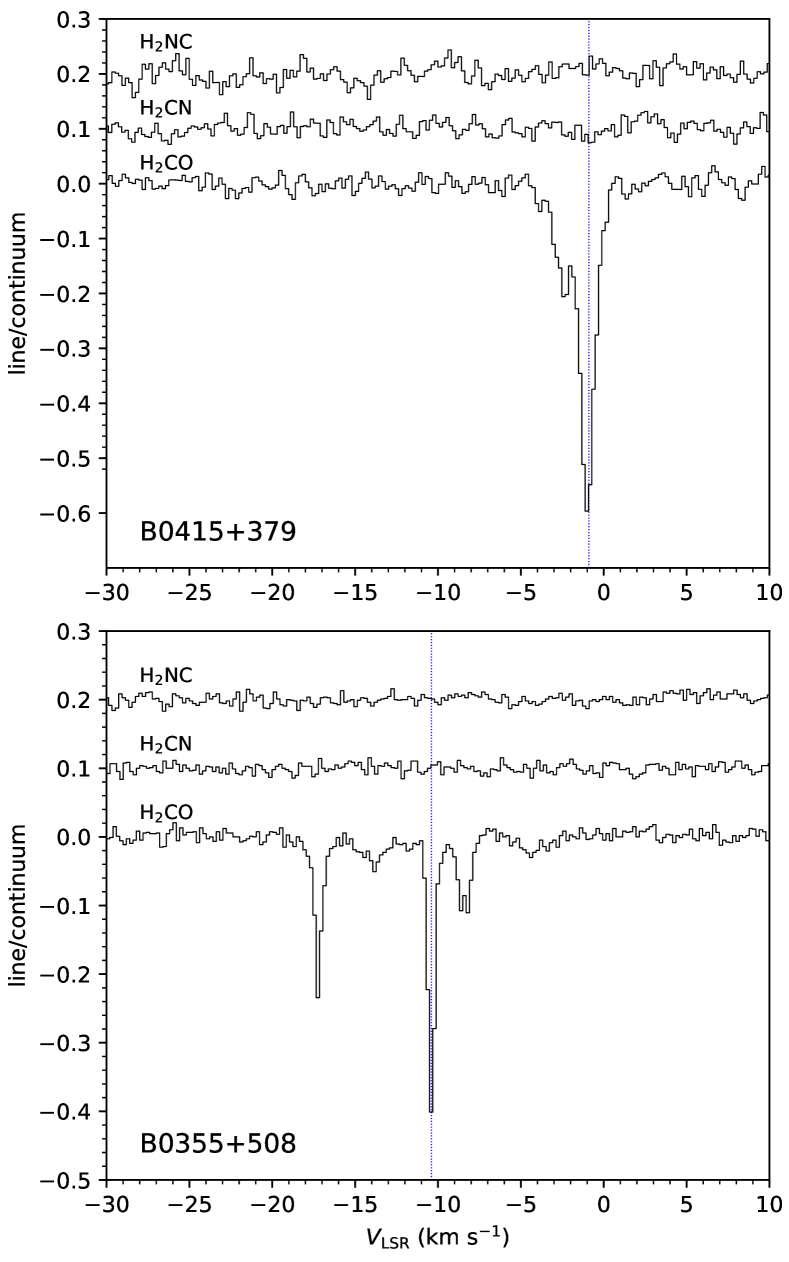
The two isomers H2NC and H2CN were also searched for toward the diffuse clouds B0415+379 and B0355+508, although none of them were detected in these two sources. In Fig. 3 we show the observed spectra around the strongest hyperfine component of H2NC and H2CN, at 72194.211 MHz and 73349.648 MHz, respectively, for the two clouds. In addition we show the observed spectra around the 10,1-00,0 transition of H2CO, lying at 72837.949 MHz, which shows absorption at different velocities, in agreement with previous observations of other transitions of H2CO toward these two sources (Liszt & Lucas, 1995). The ordinate scale is expressed as line/continuum, following the convention by Liszt et al. (2006), where by ’line’ we mean the of the observed spectrum after baseline (or continuum) subtraction and by ’continuum’ we mean the of the continuum level. We find that the deepest H2CO absorption in B0415+379 occurs at = 0.9 km s-1, while in B0355+508 it is located at a velocity of = 10.4 km s-1, in agreement with previous observations of simple molecules toward these two sources (e.g., Liszt & Lucas 1995, 2001; Liszt et al. 2006). As shown in Fig. 3, there is not hint of absorption by H2NC or H2CN toward either B0415+379 or B0355+508.
3.2 Calculation of column densities
We calculated column densities for H2NC and H2CN in those sources where the molecule was detected. When the molecule was not detected, we computed an upper limit to the column density.
| Source | (H2NC) | (H2CN) | H2NC/H2CN | Reference | (NH3) | Reference | |
|---|---|---|---|---|---|---|---|
| (cm-2) | (cm-2) | (cm-2) | |||||
| cold dense clouds | |||||||
| L483 | 1.0 1012 | 8.0 1011 | 1.25 | (1) | 14 1014 | (3) | |
| B1-b | 1.0 1012 | 1.0 1012 | 1.00 | (1) | 11.2 1014 | (4) | |
| TMC-1 CP | 3.2 1011 | 4.8 1011 | – | (1) | 1.9 1014 | (4) | |
| L1544 | 3.9 1011 | 4.3 1011 | 0.91 | (2) | 2.7 1014 | (4) | |
| L134N | 4.0 1011 | 2.5 1011 | 1.60 | (2) | 7.8 1014 | (4) | |
| TMC-2 | 2.1 1011 | 4.1 1011 | 0.51 | (2) | 6.1 1014 | (4) | |
| Lupus-1A | 1.9 1011 | 2.8 1011 | 0.68 | (2) | 1.1 1014 | (5) | |
| L1489 | 1.7 1011 | 2.1 1011 | 0.81 | (2) | 6.3 1014 | (4) | |
| TMC-1 NH3 | 3.3 1011 | 1.2 1011 | 2.7 | (2) | 5.2 1014 | (4) | |
| L1498 | 1.9 1011 | 1.4 1011 | 1.4 | (2) | 4.1 1014 | (4) | |
| L1641N | 3.1 1011 | 4.6 1011 | – | (2) | 11.0 1014 | (4) | |
| diffuse-like clouds | |||||||
| PKS 1830211 | 5.3 1011 | 2.0 1012 | 0.27 | (1) | (5-10) 1014 | (6) | |
| B0415+379 | 3.1 1011 | 5.5 1011 | – | (2) | 10.53 1012 | (7) | |
| B0355+508 | 9.2 1010 | 2.0 1011 | – | (2) | 2.54 1012 | (7) | |
References: (1) Cabezas et al. (2021). (2) This work. (3) Anglada et al. (1997). (4) Suzuki et al. (1992). (5) Value at position Lup1 C4, 2 arcmin off from Lupus-1A (Benedettini et al., 2012). (6) Henkel et al. (2008). (7) Values at the velocity components = 0.9 km s-1 for B0415+379 and = 10.4 km s-1 for B0355+508 (Liszt et al., 2006).
For the cold dense clouds L1544, L134N, TMC-2, Lupus-1A, L1489, TMC-1 NH3, L1498, and L1641N we computed H2NC and H2CN column densities assuming local thermodynamic equilibrium (LTE). Since the hyperfine components of H2NC and H2CN observed belong to the same rotational transition, the 10,1-00,0 for both molecules, the detected lines have very similar upper level energies and thus it is not possible to determine the rotational temperature. In L483 Cabezas et al. (2021) derive a rotational temperature of 4.0 K for both H2NC and H2CN from the observation of various rotational transitions with different upper level energies.This value is lower than the gas kinetic temperature (around 10 K in L483; Anglada et al. 1997; Agúndez et al. 2019), which indicates subthermal excitation, in line with the fact that these two molecules have high dipole moments (3.83 D for H2NC and 2.54 D for H2CN; Cabezas et al. 2021; Cowles et al. 1991). Since cold dense clouds typically have kinetic temperatures around 10 K and H2 volume densities of a few 104 cm-3 (Benson & Myers, 1989), in the absence of better constraints we adopted the rotational temperature derived in L483 for both H2NC and H2CN, 4.0 K, in all the cold dense clouds. We however note that the excitation of H2NC and H2CN could be different, as found for other isomer such as HCN and HNC (Hernández Vera et al., 2017) or the family of isomers of cyanoacetylene (Bop et al., 2019). In the case of H2NC and H2CN, collision rate coefficients are not available and thus we cannot investigate this point, although we acknowledge that this introduces an uncertainty in the calculation of the column densities. Cabezas et al. (2021) also showed that the ortho-to-para ratio of H2NC in L483 is consistent with the statistical value of three. We adopt this value here for both H2NC and H2CN, although we note that this is an additional source of uncertainty in the calculation of the column densities. With these assumptions, we computed synthetic spectra for H2NC and H2CN adopting as line width a value consistent with that observed in each source (see Table 2). The synthetic spectra calculated for H2NC and H2CN are compared with the observed ones in Fig. 1 and Fig. 2, respectively, while the corresponding column densities derived are given in Table 3.
In the case of non-detections of either H2NC or H2CN in cold dense clouds we derived 3 upper limits to the column density, which are also given in Table 3. The only reported detection of H2NC or H2CN in the sources observed here is that of H2CN in L1544 by Vastel et al. (2019). The column density derived here, 3.9 1011 cm-2 (see Table 3), is in agreement with the range of values found by Vastel et al. (2019), (3-6) 1011 cm-2.
In the case of the diffuse clouds B0415+379 and B0355+508 we derived upper limits to the column densities of H2NC and H2CN in the following way. We first computed the line opacity using the equation (e.g., Linke et al. 1981; Nyman 1984; Greaves et al. 1992; Corby et al. 2018)
| (1) |
The velocity-integrated opacity is then related to the column density through the expression (Nyman, 1984; Greaves & Nyman, 1996; Corby et al., 2018)
| (2) |
where is the rotational temperature, is the partition function, is the line strength, is the dipole moment, and are the energies of the lower and upper level, respectively, and and are the Planck and Boltzmann constants, respectively. For convenience, Eq. (2) can be expressed as
| (3) |
where is in units of km s-1, in cm-2, in Debye, and , , and are in units of K. We assumed a rotational temperature equal to that of the cosmic microwave background, i.e., 2.725 K. To derive upper limits to the column densities of H2NC and H2CN we used the line parameters of the strongest hyperfine component, lying at 72194.211 MHz and 73349.648 MHz, respectively. For H2NC, = 3.83 D, = 35.075, = 2.67, = 0.012 K, and = 3.477 K, while for H2CN, = 2.54 D, = 34.597, = 2.67, = 0.018 K, and = 3.538 K. The 3 upper limits to the column densities of H2NC and H2CN in B0415+379 and B0355+508 are given in Table 3. As a reference, the column densities derived for para-H2CO are 4.0 1012 cm-2 in B0415+379 at = 0.9 km s-1 and 1.1 1012 cm-2 in B0355+508 at = 10.4 km s-1, values which are very similar to those derived by Liszt & Lucas (1995).
4 Astrophysical lessons on H2NC and H2CN
The column densities derived for H2NC and H2CN are typically in the range 1011-1012 cm-2, where the largest values are found for the cold dense clouds L483 and B1-b and the = 0.89 galaxy in front of PKS 1830211, which happen to be the three sources where H2NC was initially discovered by Cabezas et al. (2021). On the other hand, the H2NC/H2CN abundance ratio is relatively uniform around unity, with the lowest value of 0.27 found toward PKS 1830211 and the largest one, 2.7, occurring in the cold dense cloud TMC-1 NH3. We aim to understand whether the abundances of H2NC and H2CN, or the abundance ratio H2NC/H2CN, depend on some physical or chemical characteristic of the host cloud.
Cabezas et al. (2021) proposed that the H2NC/H2CN ratio could behave as the HNC/HCN ratio, with values close to one in cold dense clouds and below one in diffuse clouds. This idea was suggested by the fact that the H2NC/H2CN ratio derived in the cold dense clouds L483 and B1-b was 1, while in the redshifted galaxy in front of the quasar PKS 1830211, which has a chemical composition characteristic of a diffuse or translucent cloud, the H2NC/H2CN ratio was found to be 0.27. With this idea in mind, in this study we searched for H2NC and H2CN in various cold dense clouds and in the two most promising diffuse clouds known to contain a relatively rich molecular content, based on the series of studies by Liszt and Lucas (e.g., Liszt & Lucas 2001; Liszt et al. 2006). The observations of cold dense clouds carried out here confirm that the H2NC/H2CN ratio is close to one in this type of sources, with the largest deviation occurring for TMC-1 NH3, where the detection of H2NC and the non detection of H2CN set a lower limit to the H2NC/H2CN of 2.7. However, we did not detect H2NC or H2CN toward the diffuse clouds B0415+379 and B0355+508, making impossible to constrain the H2NC/H2CN ratio in galactic diffuse clouds. The non detection of H2NC and H2CN in these two diffuse clouds is probably related to a too low column density of NH3, in comparison with the typical column densities of NH3 in cold dense clouds, which are 1-2 orders of magnitude higher (see discussion on this point below). The sensitivity achieved in the IRAM 30m observations of these two diffuse clouds, in particular for B0415+379 where the rms noise level reached is 4 mK, suggests that it would be challenging to detect either H2NC or H2CN in a galactic diffuse cloud. It seems therefore difficult to confirm whether or not the H2NC/H2CN ratio is significantly lower in diffuse clouds than in cold dense clouds.
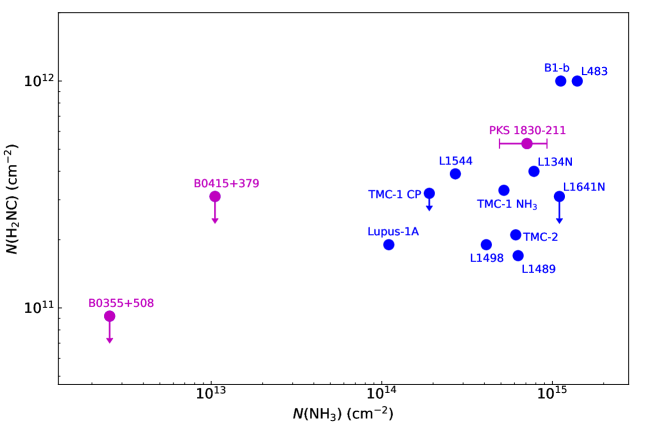
Another interesting feature discussed by Cabezas et al. (2021) concerns the chemical origin of H2NC. The reactions N + CH3 and C + NH3 are two potentially important sources of H2NC. Chemical routes to H2NC involving ions are also possible. For example, the dissociative recombination of cations, such as CH3N+, CH2NH, CH3NH, or CH3NH, with electrons could produce as fragments H2NC and H2CN, although experimental or theoretical information on these reactions is scarce (Yuen et al., 2019). A similar mechanism operates in cold dense clouds for HCN and HNC, with the two isomers being formed with nearly equal yields upon dissociative recombination of HCNH+ with electrons (Mendes et al., 2012). The reaction C + NH3 is a more likely source of H2NC than N + CH3 because it involves a smaller rearrangement of atoms. If the reaction C + NH3 is the main pathway to H2NC we could expect a relation between the abundance of H2NC and that of NH3. To investigate this point we represented in Fig. 4 the column density of H2NC versus that of NH3. Some interesting features emerge from this plot. First, the two sources with the largest column densities of H2NC, which are L483 and B1-b, have also the highest column densities of NH3. Second, among the cold dense clouds, the sources with the lowest column densities of NH3, Lupus-1A and TMC-1 CP, have also low column densities of H2NC. These two findings are very suggestive of a relation between H2NC and NH3, and thus of NH3 being a precursor of H2NC. Cold dense clouds with NH3 column densities in between those of Lupus-1A and TMC-1 CP, on one side, and L483 and B1-b, on the other, show a less clear relation between H2NC and NH3. In particular, there are sources, such as L1498, L1489, TMC-2, and L1641N, which have a moderately high column density of NH3 but a low H2NC column density. This fact suggests that NH3 may not be the only species that regulates the abundance of H2NC. Indeed, if H2NC is mainly formed by the reaction C + NH3, the abundance of atomic carbon would also be a relevant parameter setting the abundance of H2NC. However, it is very difficult to constrain the abundance of atomic carbon inside cold dense clouds (Schilke et al., 1995; Stark et al., 1996). Diffuse clouds have a markedly different chemistry compared to cold dense clouds, with a lower chemical complexity (e.g., Liszt et al. 2008). This may be the reason why H2NC and H2CN were not detected toward B0415+379 or B0355+508. However, if the relation between H2NC and NH3 found for cold dense clouds holds down to the diffuse stage, the reason of the non detection of H2NC and H2CN toward B0415+379 or B0355+508 could be the low NH3 column density in these two sources, 1-2 orders of magnitude smaller than in cold dense clouds (see Fig. 4).
5 The reaction C + NH3 as a source of H2NC
The suspected chemical link between H2NC and NH3 in interstellar clouds may be attributed to the fact that the reaction C + NH3 is the main formation mechanism of H2NC in these environments. Here we revisit this reaction and investigate whether H2NC can be produced this way.
5.1 Previous studies
The reaction C + NH3 has been found to be fast at low temperature, with a measured rate coefficient of (1.8 0.2) 10-10 cm3 s-1 at 50 K (Hickson et al., 2015). The reaction products,
| (4a) | ||||
| (4b) | ||||
| (4c) | ||||
| (4d) | ||||
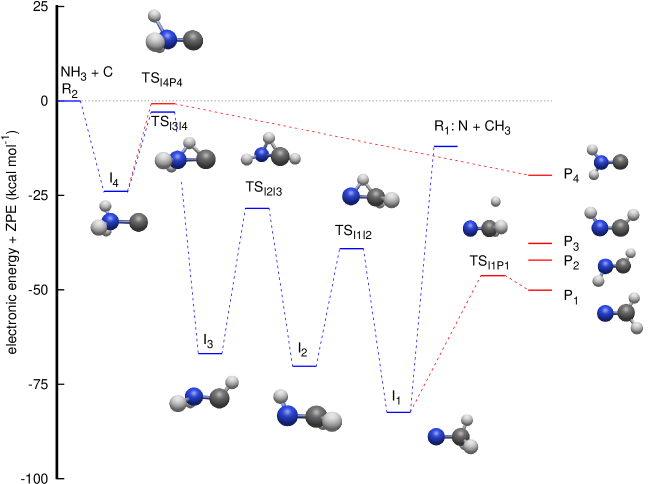
were investigated by Bourgalais et al. (2015). These authors measured the H atom yield to be 0.99 0.08, independent of temperature, over the 50-296 K range. On the other hand, they also used tunable vacuum-ultraviolet photoionization coupled with time of flight mass spectrometry in a gas flow tube experiment at 330 K, which indicated that H2CN, and not cis or trans HCNH, is likely the main isomer produced. Bourgalais et al. (2015) also performed electronic structure calculations, which indicated that the reactants approach each other in an attractive potential without barrier to form the intermediate CNH3 (hereafter I4; see Fig. 5). From I4 the dynamics can proceed overpassing two barriers. The lower is TSI3I4, that connects I4 to I3, giving access to the statistical reaction mechanism that is expected to majoritarily lead to H2CN. The second barrier, TSI4P4, connects I4 directly with the H2NC product, and according to Bourgalais et al. (2015) has an energy slightly above the reactants (although this is very method dependent), which implies that this pathway is closed at a temperature of 10 K. As a consequence, Bourgalais et al. (2015) assigned a branching ratio of 100 % for channel (4a).
It is also interesting to discuss the reaction N + CH3 because it occurs on the same triplet potential energy surface (PES) than C + NH3. This reaction has been studied experimentally (Stief et al., 1988; Marston et al., 1989a, b) and theoretically (González & Schlegel, 1992; Sadygov & Yarkony, 1997; Cimas & Largo, 2006; Alves et al., 2008; Chiba et al., 2015). The rate coefficient has been measured to be (0.64-1.7) 10-10 cm3 s-1 in the temperature range 200-423 K (Marston et al., 1989a). The major reaction products have been experimentally inferred to be H2CN + H, with about 10 % of the reaction leading to HCN + H2 (Marston et al., 1989b), which has been theoretically explained in terms of an intersystem crossing from the triplet to the singlet PES (González & Schlegel, 1992; Sadygov & Yarkony, 1997; Chiba et al., 2015). The mechanism of the reaction has been discussed in detail by Cimas & Largo (2006). The reactants approach each other in an attractive potential to form the intermediate NCH3 (hereafter I1; see Fig. 5), which is connected to two saddle points: the lower is TSI1P1, which yields H2CN as product, while the higher TSI1I2 connects to the HCNH2 intermediate (I2). The two barriers are submerged, i.e., have energies below the reactants N + CH3, but since TSI1P1 TSI1I2, according to RRKM arguments most of the flux will go through TSI1P1 to form H2CN. The I2 intermediate in turn is connected to I3 (H2NCH). The path along these intermediates I1 I2 I3, in which successive H atom migrations take place, is expected to behave statistically, and therefore the main product along this second statistical reaction mechanism is also expected to be H2CN. Thus, Cimas & Largo (2006) conclude that the main products should be H + H2CN.
5.2 Stationary points of the triplet electronic state
We carried out a progressive optimization of the stationary points of the triplet PES using several methods, M06-2X, RCCSD(T), and RCCSD(T)-F12, and different basis sets, VTZ-F12 and VQZ-F12 (Peterson & Werner, 2008), using the MOLPRO package (Werner et al., 2012). The relative energies of the stationary points varied considerably depending on the method and basis set, specially for the transition states, which indicates that electronic correlation is very important. For every transition state we calculated the intrinsic reaction coordinate to check the two minima connected to it.
| Name | System | ZPE | + ZPE | |
|---|---|---|---|---|
| R2 | C(3P)+NH3() | 0.0 | 21.599 | 0.0 |
| R1 | N(4S)+CH3() | 9.153 | 18.718 | 12.033 |
| I4 | C-NH3 | 26.884 | 24.580 | 23.902 |
| I3 | HC-NH2 | 68.771 | 23.487 | 66.882 |
| I2 | H2C-NH | 71.036 | 22.392 | 70.235 |
| I1 | H3C-N | 84.210 | 23.353 | 82.455 |
| P4 | H + H2NC | 14.745 | 16.664 | 19.680 |
| P3 | H + cis-HCNH | 31.780 | 15.651 | 37.727 |
| P2 | H + trans-HCNH | 36.775 | 16.244 | 42.129 |
| P1 | H + H2CN | 44.274 | 15.780 | 50.092 |
| TSI3I4 | CHNH2 | 1.750 | 20.420 | 2.929 |
| TSI2I3 | HCHNH | 26.836 | 20.007 | 28.427 |
| TSI1I2 | H2CHN | 37.337 | 19.825 | 39.111 |
| TSI4P4 | CNH2-H | 1.547 | 19.306 | 0.745 |
| TSI1P1 | H-H2CN | 41.726 | 17.062 | 46.262 |
The calculation of for N + CH3 (R1) was done independently for each subsystem and their energies were added. The imaginary frequencies at the saddle points TSI3I4, TSI2I3, TSI1I2, TSI4P4, TSI1P1 are 4.837, 5.719, 5.578, 5.154, and 2.283 kcal mol-1, respectively.
The RCCSD(T)-F12/VQZ-F12 results are listed in Table 4 and represented in Fig. 5. The height of TSI4P4 is critical since it connects the CNH3 well, I4, with the H2NC product, P4. With the RCCSD(T)-F12/VQZ-F12 method the electronic energy of TSI4P4 is above that of the reactants C + NH3, but when the zero point energy (ZPE) is included the energy at the TSI4P4 point becomes negative, and therefore the H2NC product becomes accessible in the C + NH3 reaction even at low temperatures.
The computational effort of geometry optimization increases dramatically with the size of the basis set, specially when the gradients and hessians need to be calculated numerically, as it happens when using RCCSD(T)-F12 methods. An alternative is to extrapolate the energies obtained with two or more electronic correlation-consistent basis sets to the complete basis set (CBS) limit. There are many extrapolation methods, and some of them were reviewed and applied to H by Velilla et al. (2010), who found that the best option is the two points extrapolation method (Lee & Park, 2000; Huh & Lee, 2003):
| (5) |
where refers to the basis ( = 3 and 4 for VTZ and VQZ, respectively) and = 1 is the best choice when using RCCSD(T) methods. The results are listed in Table 5. In the CBS limit, the transition states TSI4P4 and TSI3I4 have similar energies, both lying below the reactants C + NH3, as found with the RCCSD(T)-F12/VQZ-F12 method.
| Name | + ZPE | ||
|---|---|---|---|
| RCCSD(T)-F12 | MRCI-F12 | MRCI-F12+Q | |
| R2 | 0.0 | 0.0 | 0.0 |
| I4 | 25.395 | 29.574 | 28.455 |
| TSI3I4 | 3.907 | 7.567 | 7.392 |
| TSI4P4 | 1.568 | 7.260 | 6.266 |
CBS energies obtained using Eq. (5) with the VTZ-F12 and VQZ-F12 basis sets, where in both cases electronic energies are obtained at the geometries optimized using RCCSD(T)-F12/VQZ-F12.
Single reference methods like RCCSD(T)-F12 have problems to describe reactions, specially at the saddle points, which usually present a large multi-reference character. In the RCCSD(T)-F12 calculations discussed above, the T1-diagnostic is always below 0.023, as previously found by Bourgalais et al. (2015). This value usually allows to consider that RCCSD(T)-F12 results are reasonably good even at saddle points (Lee & Taylor, 1989). Multi reference methods, such as the multi reference configuration interaction (MRCI) method (Werner & Knowles, 1988; Shiozaki & Werner, 2013) are considered more accurate to describe reactions, specially at saddle points. Since MRCI calculations are more computationally demanding, here we performed single point calculations at the geometries optimized with the RCCSD(T)-F12/VQZ-F12 method, with and without the Davidson correction (Davidson, 1975), which we denote as MRCI-F12 and MRCI-F12+Q, respectively. The results obtained with the VTZ and VQZ basis sets are then used to get the complete basis limit, which are listed in Table 5. With the MRCI-F12 and MRCI-F12+Q methods the heights of the reaction barriers TSI3I4 and TSI4P4 are lower than with the RCCSD(T)-F12 method and, interestingly, the energies of these two transitions states become much more similar.
5.3 Reaction rate coefficient and RKKM branching ratios
At low energies, the two reactants approach each other forming the CNH3 intermediate I4 following a descendent potential energy path with no barrier. This is a clear example of a capture mechanism, which is governed by long-range interactions at low temperatures. Long-range forces are due to the interaction of the electric dipole and quadrupole of NH3 with the quadrupole of the p state of C(), and the long-range potential varies as a function of (the distance between the C atom and the center of mass of NH3) as (Zeimen et al., 2003)
| (6) |
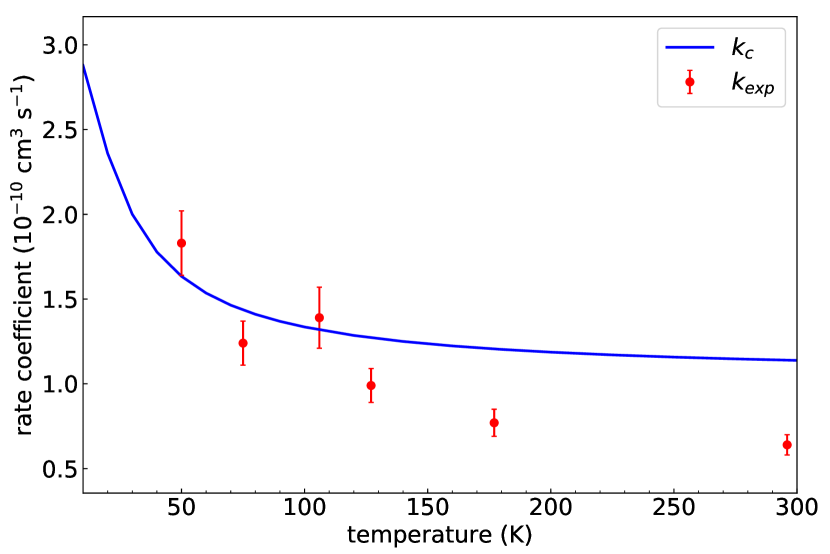
where (C) and (NH3) are the quadrupoles of C and NH3, respectively, (NH3) is the dipole moment of NH3, and and are 3 3 matrices that account for the quadrupole-dipole and quadrupole-quadrupole interactions, respectively (Zeimen et al., 2003). In the present treatment we neglect the quadrupole-quadrupole contribution and the dependence on the angle . We thus consider an isotropic long range potential , where = 2 (C) (NH3). The parameter is obtained by fitting to CCSD(T) calculations, with the aVTZ basis set. The ab initio calculations are done for NH3 in its equilibrium geometry, with its symmetry axis along the axis and its center of mass at origin, varying the = coordinate of the C atom. We obtain a value of = 0.85 hartree bohr4. This is similar to the Langevin case, and the capture rate coefficient is then given by
| (7) |
where is the reduced mass of the C + NH3 system and is the electronic partition function of C(). Assuming that only the 3 lowest spin-orbit states of C() yield trapping, we get
| (8) |
The calculated capture rate coefficient is compared in Fig. 6 with the experimental reactive rate coefficient measured at different temperatures by Hickson et al. (2015). We note that the capture rate coefficient is an upper limit to the reactive rate coefficient because once the complex is formed it can either come back to the reactants C + NH3 or evolve to form different products (H2CN, cis-/trans-HCNH, or H2NC).
According to the statistical RRKM theory, the micro-canonical rate coefficient leading to any possible product at a fixed collision energy and total angular momentum is expressed as (Marcus, 1952a, b; Miller, 1979, 1987)
| (9) |
where are the energies of the vibrational and rotational levels at the saddle point yielding each product and is the density of states of the initial system, which in our case is the intermediate CNH3 (I4). The function in Eq. (9) is the transmission probability over the barrier, and can be calculated classically or semiclassically by considering tunneling through a monodimensional Eckart barrier, as proposed by Miller (1979, 1987).
The intermediate CNH3 (I4) will unimolecularly decompose into three channels. The first one is the redissociation back to the reactants C + NH3 (R2) overpassing the barrier of the effective monodimensional potential (where is the orbital angular momentum of the C atom with respect to the center of mass of NH3), similarly as it is done for the capture model. The second channel leads to the products H + H2NC (P4) overpassing TSI4P4 barrier. The third one consists of a statistical mechanism in which TSI3I4 is overpassed to reach the I3 intermediate. Along this mechanism, the system will proceed towards I2 and I1 intermediates. This complex-forming mechanism is expected to behave statistically, favoring the exit towards the most stable product, H + H2CN (P1). This was the case calculated by Cimas & Largo (2006) in the N + CH3 reaction. Here, we shall assume as a zero-order approximation that once TSI3I4 is overpassed the reaction mechanism yields only H + H2CN (P1).
The branching ratio between the two products channels leading to H2NC (P4) and H2CN (P1) is then given as a function of collision energy as
| (10) |
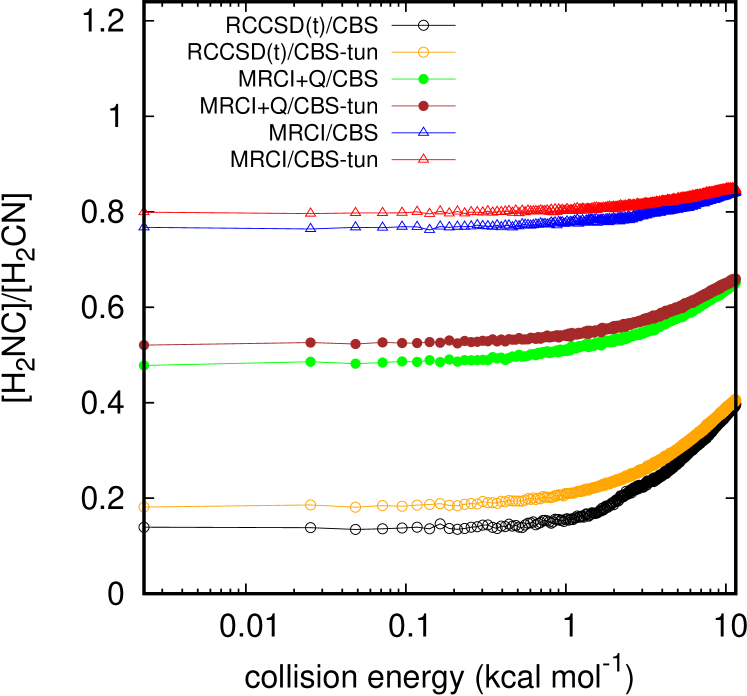
The calculated branching ratio [H2NC]/[H2CN] is shown in Fig. 7 as a function of the collision energy using the CBS limit results with the RCCSD(T)-F12, MRCI-F12, and MRCI-F12+Q methods. It is seen that the branching ratio is very dependent on the relative heights of the barriers TSI4P4 and TSI3I4, which in turn are very dependent on the method, i.e., on how electronic correlation is included. Saddle points correspond to the configurations where bonds are formed and destroyed, and hence, multi-reference methods are in principle more accurate. For this reason, we consider that MRCI-F12 and MRCI-F12+Q results are the most accurate in the present work. The inclusion of tunneling only accounts for corrections of about 2 %. It is worth noting that the energy differences between the barriers TSI4P4 and TSI3I4 involved in this reaction are probably close to the accuracy of state-of-the-art ab initio methods. For all explored methods, the [H2NC]/[H2CN] branching ratio is almost constant for collision energies below 0.3 eV. Above this energy, the ratio increases because the density of states at TSI4P4 increases faster than at TSI3I4 due to the smaller rotational constants. Using the MRCI+Q-CBS results, the rotational constants for TSI4P4 are 5.18 cm-1, 0.98 cm-1, and 0.96 cm-1, while for TSI3I4 they are 6.49 cm-1, 0.87 cm-1, and 0.86 cm-1.
We can conclude that the [H2NC]/[H2CN] branching ratio at 10 K should have a value between 0.5 and 0.8. This value is to be compared with the abundance ratio H2NC/H2CN observed in cold dense clouds in this work, which lies between 0.51 and 2.7 (see Table 3). Taking into account the significant variation of the predicted branching ratio [H2NC]/[H2CN] with the method employed and the spread of H2NC/H2CN ratios found in the targeted clouds, the reaction C + NH3 could perfectly be the main source of H2NC in cold dense clouds, and also in the redshifted galaxy in front of the quasar PKS 1830211, where the abundance ratio H2NC/H2CN is 0.27.
6 Concluding remarks
We carried out an observational survey to search for the metastable isomer H2NC toward various cold dense and diffuse clouds to determine its abundance and understand the chemistry of this recently discovered molecule. Simultaneously the most stable isomer, H2CN, was also searched for in the same sources. We were mainly interested in exploring two particular hypotheses suggested by the discovery of H2NC. First, whether or not the H2NC/H2CN abundance ratio behaves as the HNC/HCN ratio, with values around one in cold dense clouds and below one in diffuse clouds. And second, whether or not H2NC is chemically connected to ammonia.
We detected H2NC in most of the cold dense clouds targeted, which indicates that this species is widespread in this kind of interstellar clouds. On the other hand, we did not detect neither H2NC nor H2CN toward two diffuse clouds which seemed among the most favorable for detection, most likely because of the lower molecular richness of diffuse clouds compared to dense clouds. The non detection of H2NC toward diffuse clouds did not allowed to confirm the hypothesis that the H2NC/H2CN abundance ratio behaves similarly to the HNC/HCN in dense and diffuse clouds. On the other hand, we found that the column density of H2NC is correlated with that of NH3 because the sources where H2NC is most abundant are also very abundant in ammonia. This latter fact suggests that these two molecules are chemically connected, probably because ammonia is a precursor of H2NC through the C + NH3 reaction.
Previous studies of the C + NH3 reaction favored H2CN as the main product. We thus revisited this reaction from a theoretical point of view and found that the two isomers H2CN and H2NC can be formed through two different reaction pathways which involve two different transition states, the energies of which are predicted to be very similar and slightly below that of the reactants. The product branching ratio H2NC/H2CN is predicted to be between 0.5 and 0.8, which is of the order of the abundance ratios H2NC/H2CN observationally found in cold dense clouds, which range from 0.51 to 2.7. We therefore conclude that the reaction C + NH3 is probably the main formation route to H2NC in interstellar clouds.
Acknowledgements.
We acknowledge funding support from Spanish Ministerio de Ciencia e Innovación through grants PID2019-106110GB-I00, PID2019-107115GB-C21, PID2019-106235GB-I00, and PID2021-122549NB-C2. We thank the referee for useful comments that helped to improve this article.References
- Agúndez et al. (2019) Agúndez, M., Marcelino, N., Cernicharo, J. et al. 2019, A&A, 625, A147
- Alves et al. (2008) Alves, T. V., de Oliveira Filho, A. G. S., & Ornellas, F. R. 2008, Chem. Phys. Lett., 457, 36
- Anglada et al. (1997) Anglada, G., Sepúlveda, I., & Gómez, J. F. 1997, A&AS, 121, 255
- Benedettini et al. (2012) Benedettini, M., Pezzuto, S., Burton, M. G., et al. 2012, MNRAS, 419, 238
- Benson & Myers (1989) Benson, P. J. & Myers, P. C. 1989, ApJS, 71, 89
- Bop et al. (2019) Bop, C. T., Batista-Romero, F. A., Faure, A., et al. 2019, ACS Earth Space Chem., 3, 1151
- Bourgalais et al. (2015) Bourgalais, J., Capron, M., Kailasanathan, R. K. A., et al. 2015, ApJ, 812, 106
- Cabezas et al. (2021) Cabezas, C., Agúndez, M., Marcelino, N., et al. 2021, A&A, 654, A45
- Chiba et al. (2015) Chiba, S., Honda, T., Kondo, M., & Takayanagi, T. 2015, Comput. Theor. Chem., 1061, 46
- Cimas & Largo (2006) Cimas, A. & Largo, A. 2006, J. Phys. Chem. A, 110, 10912
- Corby et al. (2018) Corby, J. F., McGuire, B. A., Herbst, E., & Remijan, A. J. 2018, A&A, 610, A10
- Cowles et al. (1991) Cowles, D. C., Travers, M. J., Frueh, J. L., & Ellison, G. B. 1991, J. Chem. Phys., 94, 3517
- Davidson (1975) Davidson, E. R. 1975, J. Comput. Phys., 17, 87
- González & Schlegel (1992) González, C. & Schlegel, H. B. 1992, J. Am. Chem. Soc., 114, 9118
- Greaves et al. (1992) Greaves, J. S., White, G. J., Ohishi, M., et al. 1992, A&A, 260, 381
- Greaves & Nyman (1996) Greaves, J. S. & Nyman, L.-Å. 1996, A&A, 305, 950
- Henkel et al. (2008) Henkel, C., Braatz, J. A., Menten, K. M., & Ott, J. 2008, A&A, 485, 451
- Hernández Vera et al. (2017) Hernández Vera, M., Lique, F., Dumouchel, F., et al. 2017, MNRAS, 468, 1084
- Hickson et al. (2015) Hickson, K. M., Loison, J.-C., Bourgalais, J., et al. 2015, ApJ, 812, 107
- Hirota et al. (1998) Hirota, T., Yamamoto, S., Mikami, H., & Ohishi, M. 1998, ApJ, 503, 717
- Huh & Lee (2003) Huh, S. B. & Lee, J. S. 2003, J. Chem. Phys., 118, 3035
- Lee & Taylor (1989) Lee, J. & Taylor, R. 1989, Int. J. Quantum Chem., 36, 199
- Lee & Park (2000) Lee, J. S. & Park, S. Y. 2000, J. Chem. Phys., 112, 10746
- Linke et al. (1981) Linke, R. A., Stark, A. A., & Frerking, M. A. 1981, ApJ, 243, 147
- Liszt & Lucas (1995) Liszt, H. & Lucas, R. 1995, A&A, 299, 847
- Liszt & Lucas (2001) Liszt, H. & Lucas, R. 2001, A&A, 370, 576
- Liszt et al. (2006) Liszt, H., Lucas, R., & Pety, J. 2006, A&A, 448, 253
- Liszt et al. (2008) Liszt, H., Pety, J., & Lucas, R. 2008, A&A, 486, 493
- Marcus (1952a) Marcus, R. A. 1952a, J. Chem. Phys., 20, 352
- Marcus (1952b) Marcus, R. A. 1952b, J. Chem. Phys., 20, 355
- Marston et al. (1989a) Marston, G., Nesbitt, F. L., Nava, D. F., et al. 1989a, J. Phys. Chem., 93, 5769
- Marston et al. (1989b) Marston, G., Nesbitt, F. L., & Stief, L. J. 1989b, J. Chem. Phys., 91, 3483
- Mendes et al. (2012) Mendes, M. B., Buhr, H., Berg, M. H., et al. 2012, ApJ, 746, L8
- Miller (1979) Miller, W. H. 1979, J. Am. Chem. Soc., 101, 6810
- Miller (1987) Miller, W. H. 1987, Chem. Rev., 87, 19
- Muller et al. (2011) Muller, S., Beelen, A., Guélin, M., et al. 2011, A&A, 535, A103
- Nyman (1984) Nyman, L.-Å, 1984, A&A, 141, 323
- Ohishi et al. (1994) Ohishi, M., McGonagle, D., Irvine, W. M., et al. 1994, ApJ, 427, L51
- Peterson & Werner (2008) Peterson, K. A. & Werner, H.-J. 2008, J. Chem. Phys., 128, 084102
- Puzzarini (2010) Puzzarini, C. 2010, Int. J. Quantum Chem., 110, 2483
- Sadygov & Yarkony (1997) Sadygov, R. G. & Yarkony, D. R. 1997, J. Chem. Phys., 107, 4994
- Sakai et al. (2010) Sakai, N., Shiino, T., Hirota, T., et al. 2010, ApJ, 718, L49
- Sarrasin et al. (2010) Sarrasin, E., Ben Abdallah, D., Wernli, M., et al. 2010, MNRAS, 404, 518
- Schilke et al. (1995) Schilke, P., Keene, J., Le Bourlot, J., et al. 1995, A&A, 294, L17
- Shiozaki & Werner (2013) Shiozaki, T. & Werner, H.-J. 2013, Mol. Phys., 111, 607
- Stark et al. (1996) Stark, R., Wesselius, P. R., van Dishoeck, E. F., & Laureijs, R. J. 1996, A&A, 311, 282
- Stief et al. (1988) Stief, L. J., Marston, G., Nava, D. F., et al. 1988, Chem. Phys. Lett., 147, 570
- Suzuki et al. (1992) Suzuki, H., Yamamoto, S., Ohishi, M., et al. 1992, ApJ, 392, 551
- Tercero et al. (2020) Tercero, B., Cernicharo, J., Cuadrado, S., et al. 2020, A&A, 636, L7
- Vastel et al. (2019) Vastel, C., Loison, J.-C., Wakelam, V., & Lefloch, B. 2019, A&A, 625, A91
- Velilla et al. (2010) Velilla, L., Paniagua, M., & Aguado, A. 2010, Int. J. Quantum Chem., 111, 387
- Werner & Knowles (1988) Werner, H.-J. & Knowles, P. J. 1989, J. Chem. Phys., 89, 5803
- Werner et al. (2012) Werner, H.-J., Knowles, P. J., Knizia, G., et al. 2012, WIREs Comput. Mol. Sci., 2, 242
- Yuen et al. (2019) Yuen, C. H., Ayouz, M. A., Balucani, N., et al. 2019, MNRAS, 484, 659
- Zeimen et al. (2003) Zeimen, W. B., Kłos, J., Groenenboom, G. C., & van der Avoird, A. 2003, J. Chem. Phys., 118, 7340