\ul
Vision Transformer-based Model for Severity Quantification of Lung Pneumonia Using Chest X-ray Images
Abstract
To develop generic and reliable approaches for diagnosing and assessing the severity of COVID-19 from chest X-rays (CXR), a large number of well-maintained COVID-19 datasets are needed. Existing severity quantification architectures require expensive training calculations to achieve the best results. For healthcare professionals to quickly and automatically identify COVID-19 patients and predict associated severity indicators, computer utilities are needed. In this work, we propose a Vision Transformer (ViT)-based neural network model that relies on a small number of trainable parameters to quantify the severity of COVID-19 and other lung diseases. We present a feasible approach to quantify the severity of CXR, called Vision Transformer Regressor Infection Prediction (ViTReg-IP), derived from a ViT and a regression head. We investigate the generalization potential of our model using a variety of additional test chest radiograph datasets from different open sources. In this context, we performed a comparative study with several competing deep learning analysis methods. The experimental results show that our model can provide peak performance in quantifying severity with high generalizability at a relatively low computational cost. The source codes used in our work are publicly available at https://github.com/bouthainas/ViTReg-IP.
Keywords— Automatic prediction, Chest X-ray, COVID-19, Severity quantification, Vision Transformer
1 Introduction
The number of deaths caused by coronavirus disease-19 (COVID-19) continues to rise even after vaccination by mandatory policies in most countries [61, 42]. Many physicians have turned to new tactics and technologies due to the increased impact of the pandemic on healthcare systems around the world. Chest radiographs X-rays (CXR) offer a relatively noninvasive method to track disease progression [62, 42]. CXR imaging is becoming more popular and more widely used worldwide, as demonstrated by many recent studies [40, 26, 54, 25, 48, 22, 60]. CXR imaging devices are more widely accessible than CT scanners due to their lower cost and faster decontamination times [17]. In addition, because portable CXR units are available, imaging can be performed within a stationary unit, which significantly reduces the risk of contamination transmission[48, 25, 11]. Finally, CXR imaging in patients with respiratory complaints is considered a commonly accepted good standard practice in medicine [41] and it has been shown to provide insightful information about disease progression [60]. Numerous studies have looked at CXR images, particularly those of SARS-CoV-2-positive patients [26, 22, 28], with bilateral abnormalities, ground-glass opacity, and interstitial abnormalities. Determining the severity of a patient’s disease is an important help of CXR assessment by physicians to guide the treatment and management of the disease, as it relies on the detected imaging features and observation of their progression and extent over the duration of disease onset. As a result, several recent studies have focused on severity scoring to quantify the severity of lung disease [60, 54]. Disease severity can help physician to determine the appropriate treatment and monitoring for each patient. Radiology services often employ experienced physicians for whom determining the severity of a CXR is not an easy task. Clinical diagnosis with the help of a computer could make this difficult task easier for physicians. In this research, we developed and studied a model that can predict the severity of lung pneumonia based on CXR and can be used to support patient care management. Escalation or de-escalation of care, particularly in the intensive care unit (ICU), may be based on the ability to assess the severity of pulmonary infection. Over time, a patient’s response to treatment and disease progression can be objectively and quantitatively tracked using an automated method. We anticipate that the use of CXRs from a global pool of patients with pulmonary infections and normal patients can lead to a reliable and generic computer-aided severity grading of lungs. Throughout the study, we are interested in investigating the performance of our proposed model in predicting a scalar representing severity, rather than just classifying images as infected or uninfected. Recent work has shown that Deep Learning can be used to solve regression problems such as estimating the age of faces [13], predicting the beauty of faces [1], and evaluating the risk score of breast cancer disease progression [37].
Then our task is a regression task where we need ground truth scores for supervised learning. Specifically, in this study, we develop, train, and validate a transformer-based deep neural network capable of achieving the required score prediction. It will be used to perform multiple scoring systems by exploiting CXRs from both infected and normal patients. In this way, we can assess the feasibility of computer-aided lung severity scoring towards assistance to support accurate diagnosis and treatment. Although transformer-based architectures have been widely used recently [32], most research focuses on solving a classification problem rather than a regression problem as in the case of our research.
Our main contributions are summarized below:
-
•
Formulation of a generalized and outperforming approach based on a vision transformer (ViT) to predict the severity of a lung infected with COVID-19.
-
•
Derivation of mixing and fusing data augmentation methods, originally developed for classification tasks, as a scoring augmentation stage for our regression solution to generate a larger dataset.
-
•
Carrying out a comparative study by exploiting state-of-the-art databases (RALO, Brixia, Danilov et al. COVID-19 and Cohen COVID-19) and eight different deep learning models (COVID-NET, COVID-NET-S, ResNet50, InceptionNet, XceptionNet, Swin Transformer, MobileNetV3, and Stonybrook Feature Extraction).
-
•
Conducting a series of ablation studies showing the relative contribution of each component in our ViTReg-IP.
-
•
We made our source codes publicly available to encourage other researchers to use them as a benchmark for their studies: https://github.com/bouthainas/ViTReg-IP.
The remainder of the paper is organized as follows: Related studies and a review of the state-of-the-art were described in Section 2. The description of our proposed generalized pneumonia severity quantification model is presented in Section 3. The performance evaluation, including the datasets used and the experimental results, as well as a detailed evaluation of the performance of each approach in severity assessment, are presented in Section 4. In Section 5, we interpret and discuss the obtained results. Section 6 summarizes the results and provides some concluding notes.
2 Related Work
COVID-19 has monopolized the focus and financial resources of researchers in digital technologies, artificial intelligence, and data science from the onset of the pandemic [53, 30]. Shi et al. [50] and Islam et al. [24] state that there are several artificial intelligence techniques in image data acquisition, segmentation, and diagnosis for COVID. The authors organized prior work according to different tasks, such as contactless imaging workflow, image segmentation, disease detection, radiological feature extraction, and severity quantification. At the very beginning of the outbreak, when a systematic collection of a large CXR dataset for deep neural network training was still difficult, Oh et al. [43] proposed the use of convolutional neural networks (CNN) to analyze CXRs for presumptive early diagnosis and better patient handling based on signs of pneumonia. Researching deep learning techniques was also investigated in [18] for autonomous assessment of CXR images to provide healthcare with accurate tools for COVID-19 screening and patient diagnosis. The increasing availability of CXR datasets from patients with COVID-19 during the outbreak has focused almost all research efforts on diagnosis-oriented image interpretation investigations. There are so many studies that apply AI techniques to the acquisition, segmentation, and classification of imaging data for COVID-19, whether using CXRs or CT scans, that it would be difficult to cover them all [50, 65]. We refer only to those related to our work and the most recent emergent challenges.
Even though CXR imaging modality is frequently used in many healthcare facilities, few studies to date have presented AI-driven solutions for COVID-19 disease surveillance and pneumonia severity assessment based on CXR especially those that predict a score, as is done in our study. The first paper was by Irmak et al. [23] was based on a quantitative CXR assessment [44]. However, this study needs readers with more knowledge to confirm the consistency of the severity score. After that, the COVID-Gram [35] and the deep learning applied works of Liang et al. [36] were used for COVID-19 identification based on CXR abnormality. The extent of lung pneumonia was determined in the work of Colombi et al. [8] to indicate the severity of the disease. Another notable work was COVID-NET-S [57], one of the earliest research projects on COVID-19 severity assessment, in which the author developed a deep neural network to forecast extent scores from CXR. To do this, they had to train their model on a huge dataset. Several features from a neural network that has been trained on CXR datasets other than COVID-19 are taken into account for their predictive score on the estimate of COVID-19 severity ratings in [6]. Ridley created a unique type of deep learning algorithm called Convolutional Siamese Neural Network (CSNN) to produce a score of COVID-19 patient pulmonary X-ray severity (PXS) that was well correlated with radiologist assessments and could also be used to predict whether or not a patient will need to be incubated before death [45]. In [34], a transfer learning method is applied from a large non-COVID-19 dataset to a small COVID-19 one to show a clear relationship between a lung-based severity score rating and automated prediction. Improved generalizability was attained in a subsequent study by the same authors [33]. In [16], pneumonia localization and lung segmentation networks were used to produce a geographic extent severity score that was annotated and linked with experts’ evaluations on 94 CXRs. The geographic extent and opacity severity scores were predicted in [59]. The authors in [57] used a modified COVID-19 detection architecture and stratified Monte Carlo cross-validation. These were performed on 396 CXRs, measuring the relationship with respect to expert annotations. CheXNet, which was pretrained on ImageNet and later trained to predict COVID-19 severity using a unique dataset, was proposed in the study by Kwon et al. [29]. An end-to-end deep learning architecture was used in [51] to predict a multi-regional score; Brixia score based on CXR images (CXR), indicating the severity of lung damage in COVID-19 patients. The architecture used a large dataset and needed several pieces of training for segmentation and subsequent prediction.
When deep architectures are used to evaluate datasets with thousands of images, the computational cost is often very high. Furthermore, when datasets are used to represent only COVID-19 images and neglect other types of pneumonia, we may encounter problems that lead to inefficient results. These early studies confirm the need for specialized methods for this difficult visual task, the urgency of working with small annotated datasets, and the need for computationally inexpensive models for meaningful explanatory solutions while demonstrating the feasibility of COVID-19 severity estimation on CXRs. In contrast to the aforementioned methods, our work shows how a focused straightforward technical solution that can handle the complexity of an organized severity assessment can achieve high performance and robustness at a low computational cost.
3 Proposed Methodology
3.1 Combined Feature Extraction Models
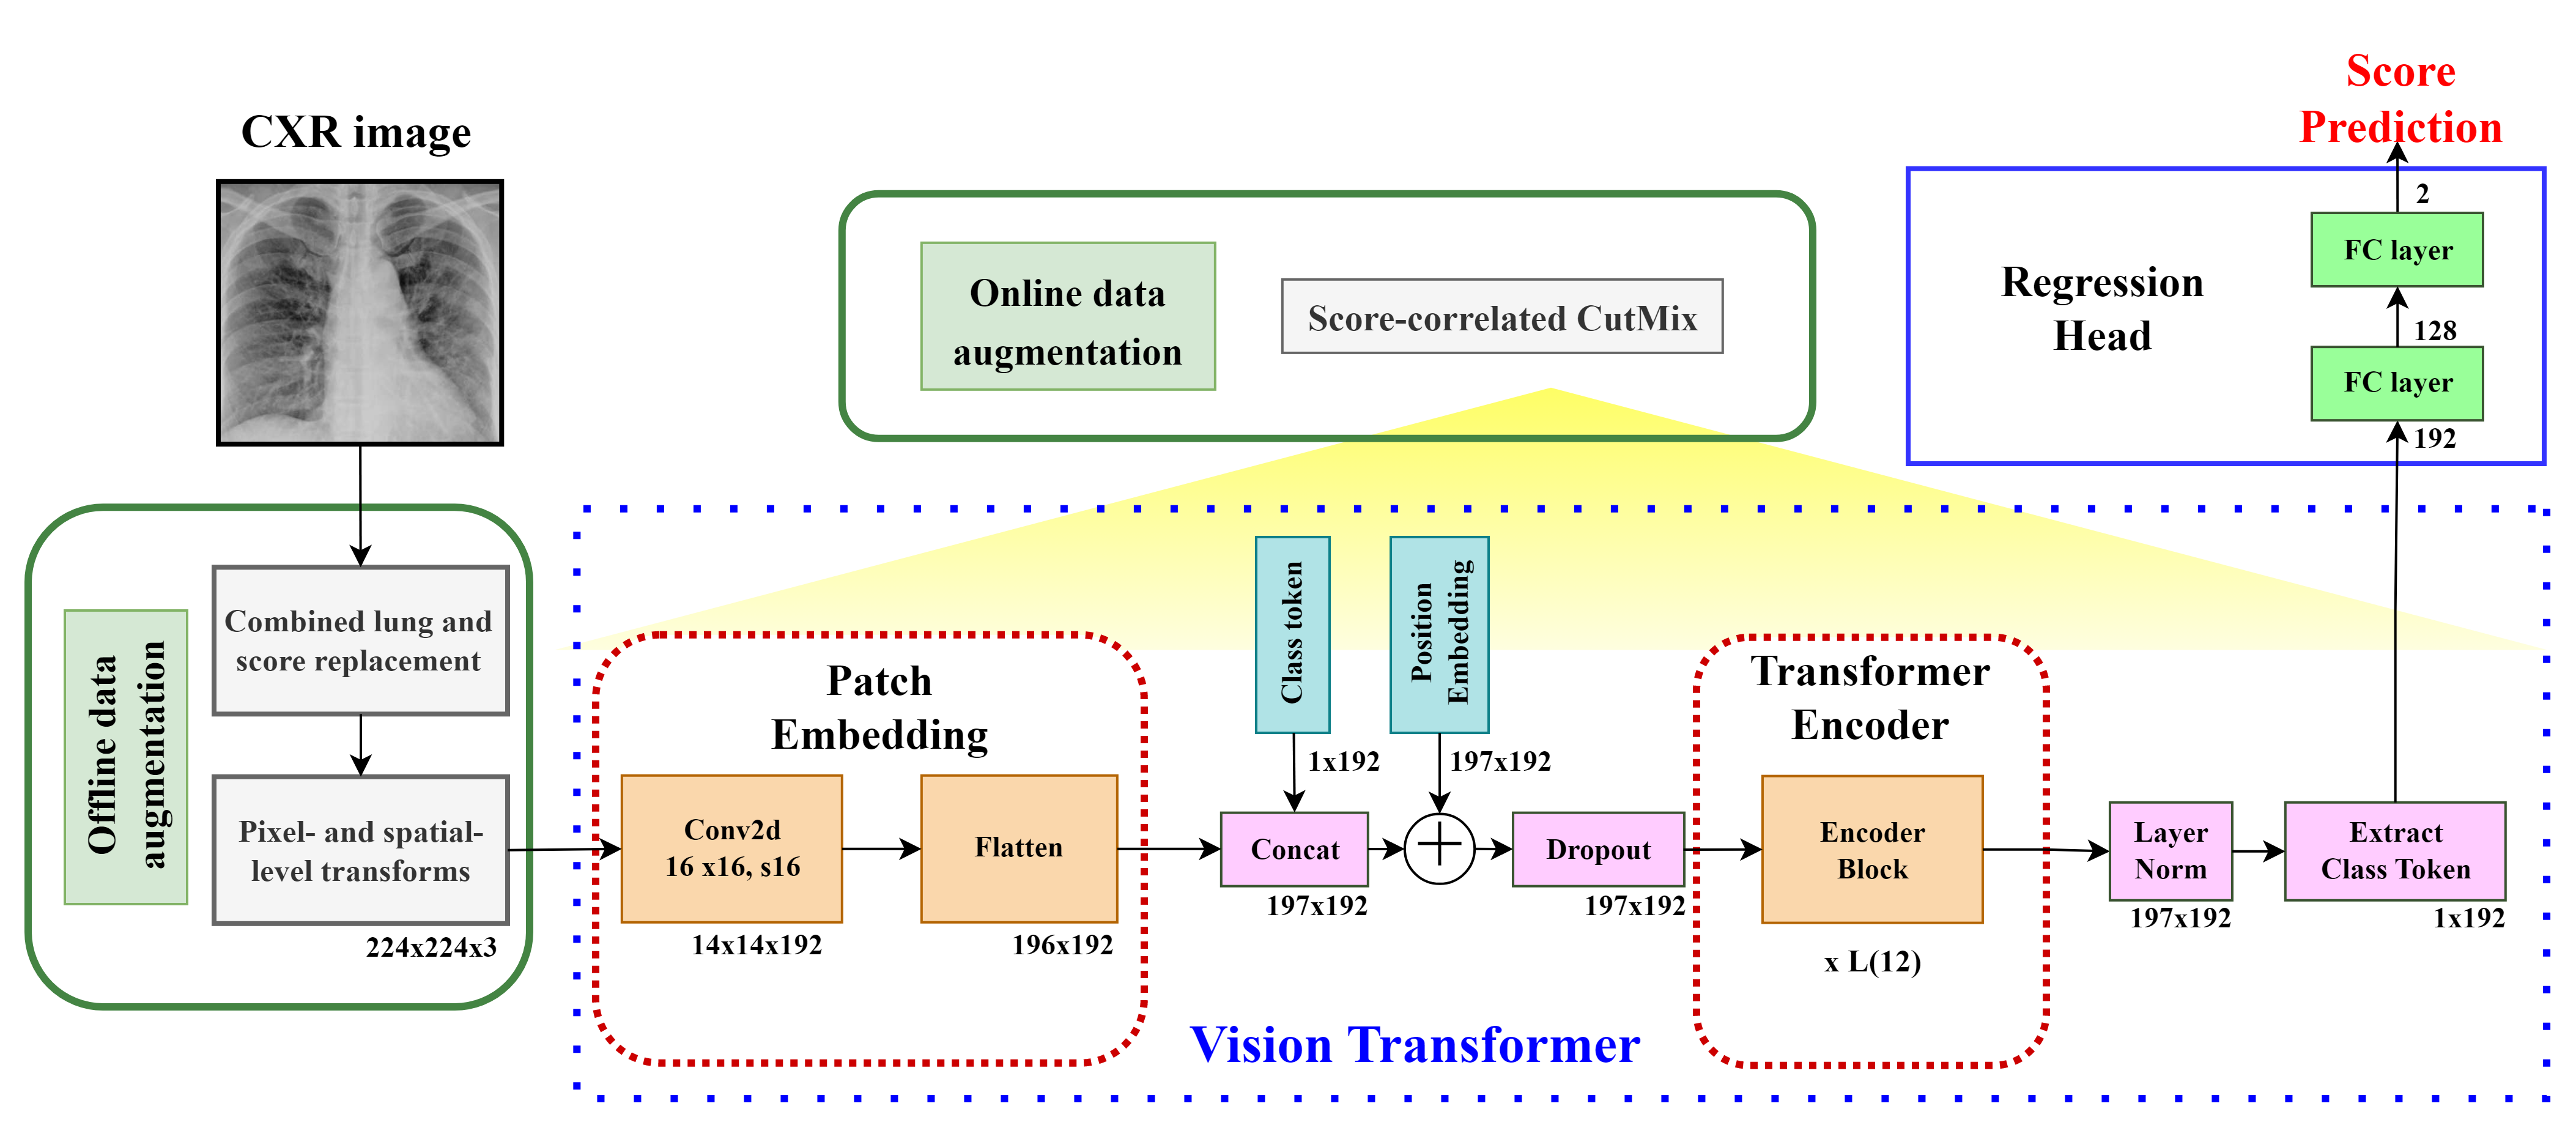
Given a CXR image with dimensions , where is the spatial resolution and is the number of channels, our goal is to predict the respective lung infection severity score. In our approach, a regressor is backed by the vision transformer ViT [14]. Figure 1 shows the schematic diagram of our proposed model ViTReg-IP.
3.1.1 Vision Transformer Backbone
In this study, our ViTReg IP model is based on the vision transformer [14]. The parameters are initialized using the deep neural network, which has already been pre-trained on ImageNet [55]. The non-hierarchical ViT design of the deep neural network was used in this study to underpin the architecture of the proposed model used to evaluate the functionality of the computational severity of lung disease. The ViT reshapes the input CXR image into a sequence of flattened 2D patches, where each patch has size and is the number of image patches. Using a trainable linear projection, we translate the vectorized image patches into a latent -dimensional embedding space. We learn certain position embeddings that are added to the patch embeddings to obtain the position information that encodes the spatial patch information. Thus, the encoding of the patches is represented by the matrix as follows:
| (1) |
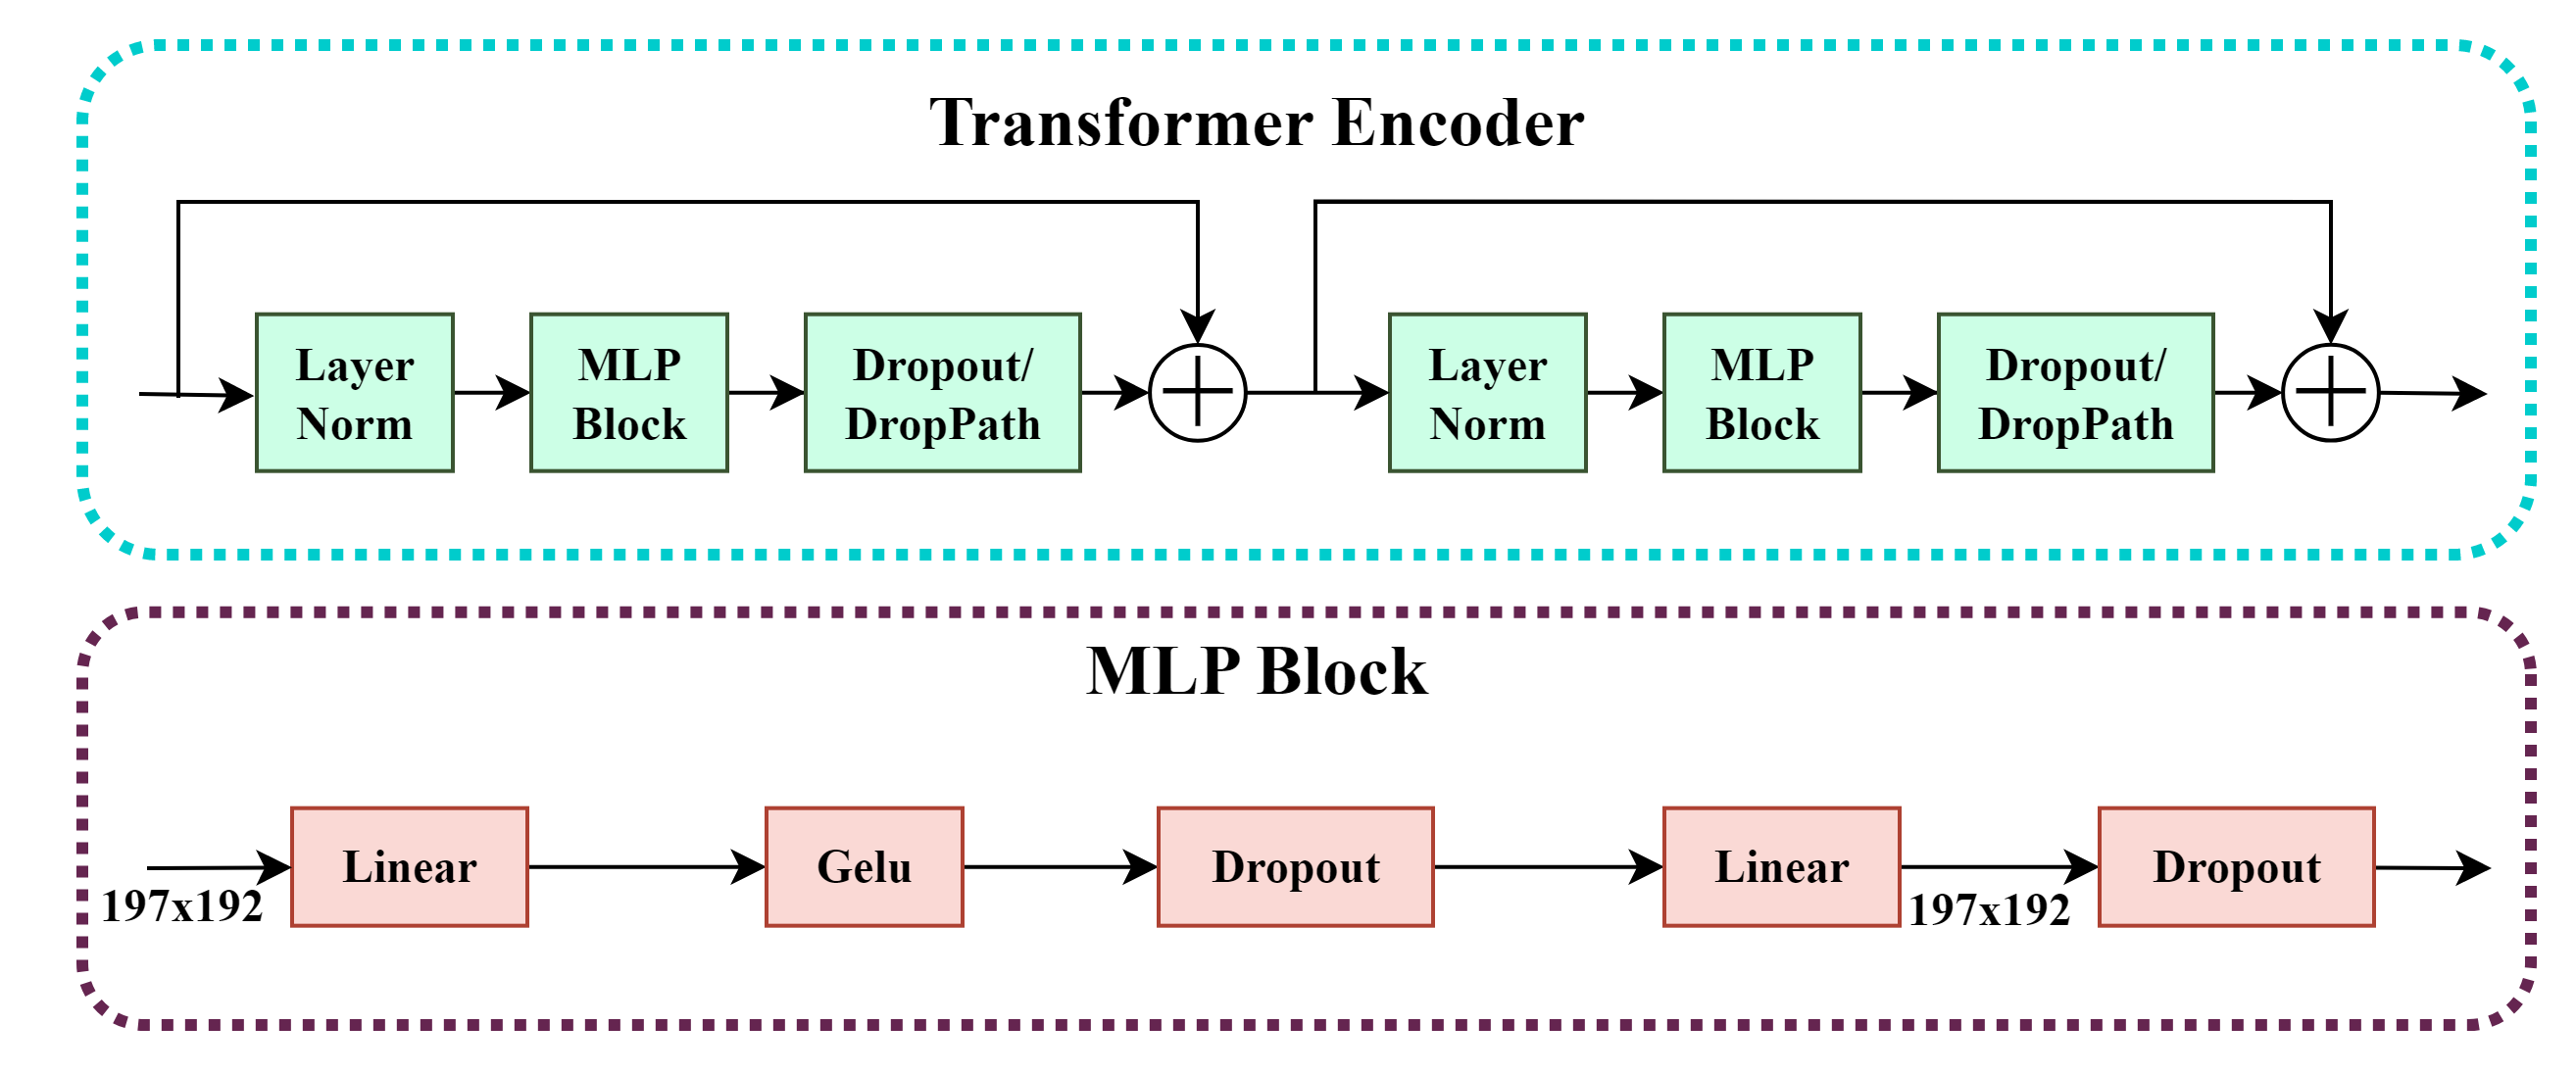
where is the patch embedding projection, and is the position embedding. The Multihead Self-Attention (MSA) and Multi-Layer Perceptron (MLP) blocks are included in all layers of the transformer encoder (2) and (3). Consequently, the following can be expressed as the output of the layer:
| (2) |
| (3) |
where represents the layer normalization operator and is the encoded image representation at layer . The structure of a transformer encoder is illustrated in Figure 2a. In our tests, we use a tiny ViT backbone with , , , , and .
3.1.2 Regression Head
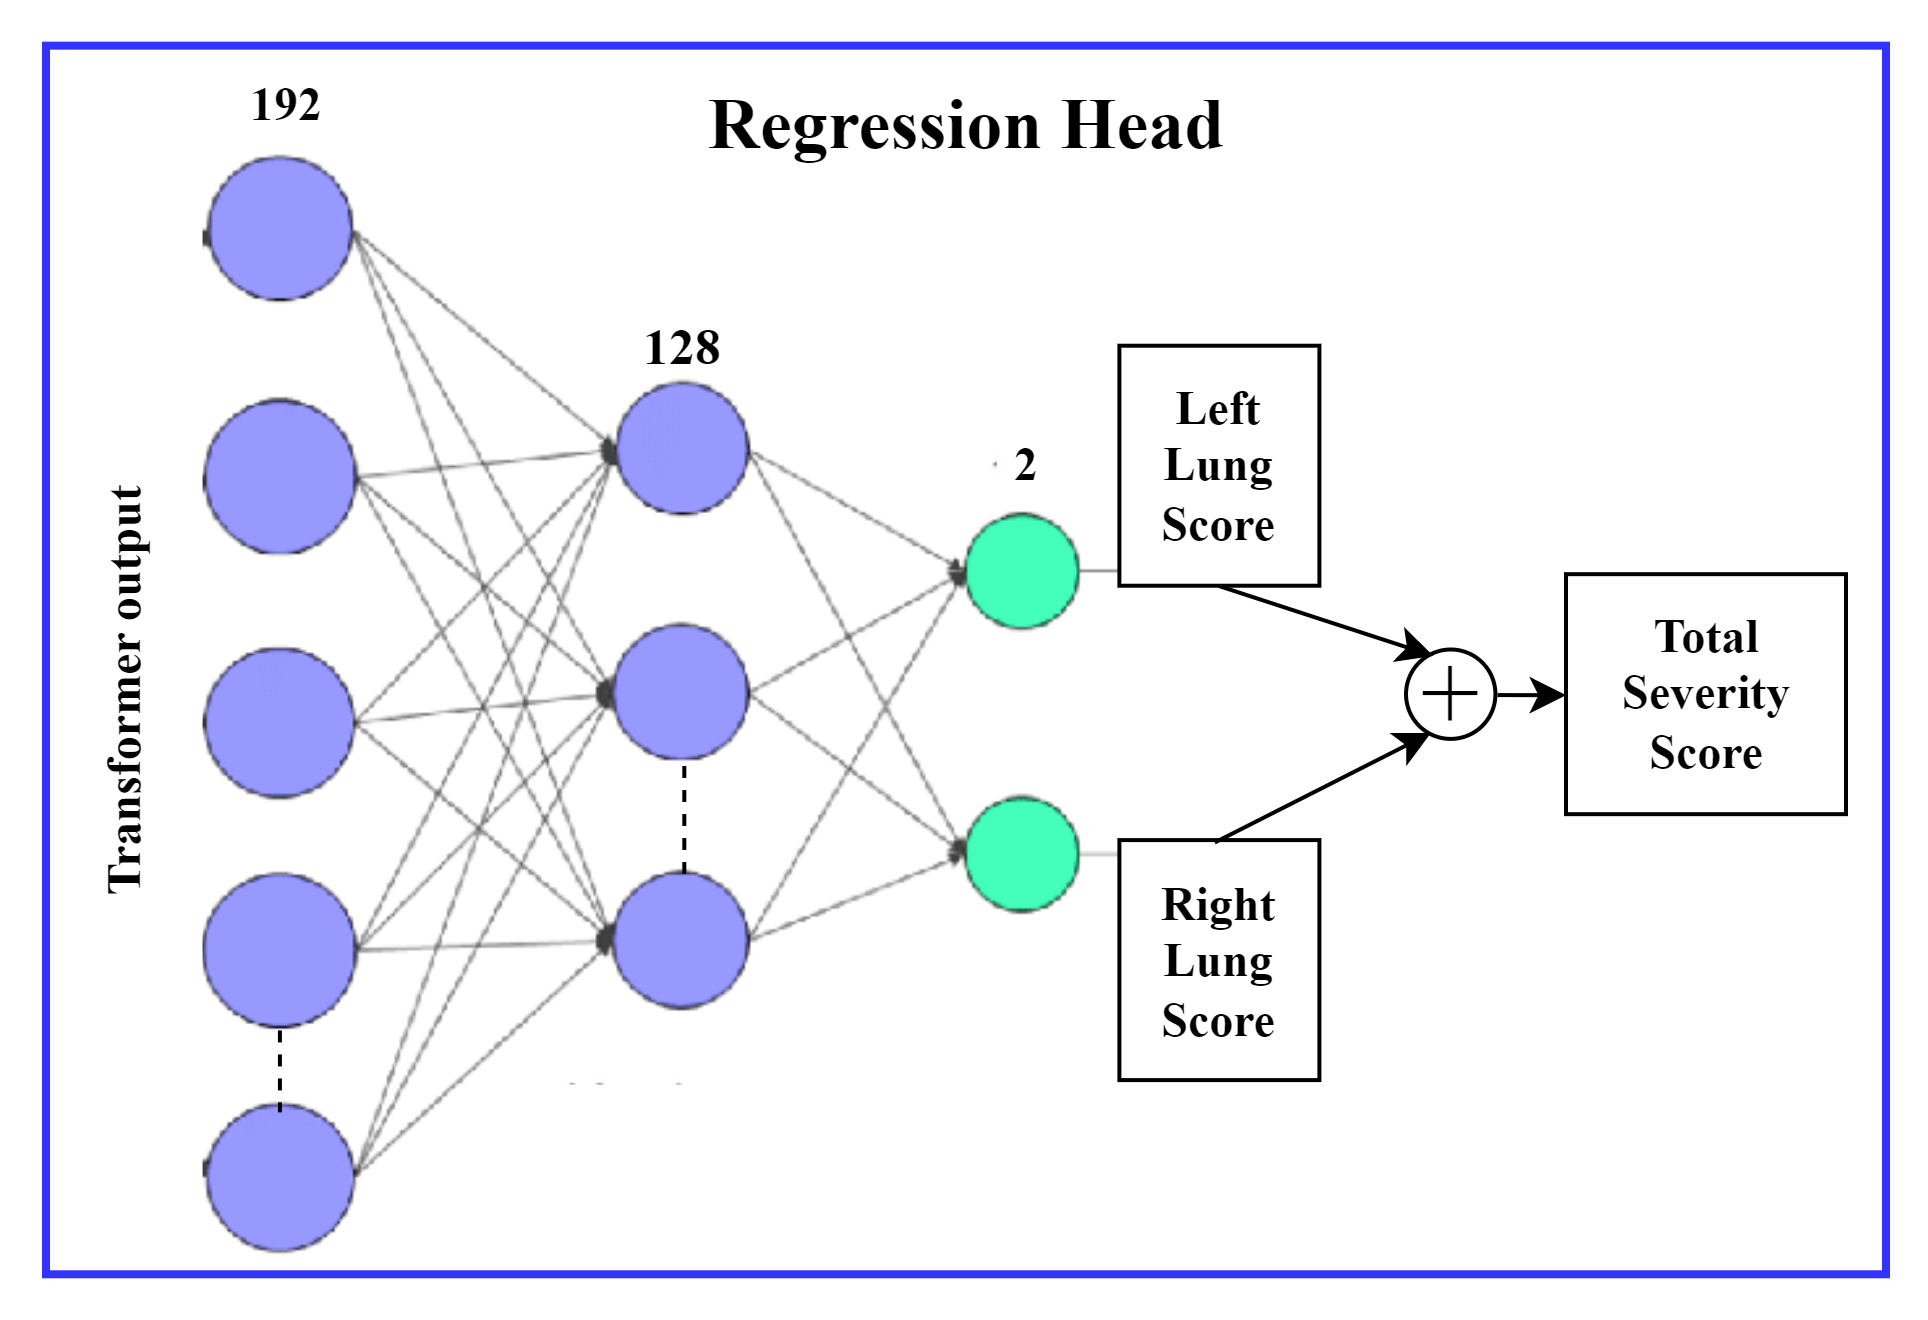
Our regressor consists of two Fully Connected (FC) layers. It takes as input the CLS token provided by the last layer of the ViT backbone. It then computes two predictions (left and right lungs) for the score since the infection levels in the two lungs are independent of one another. The regression head is thus composed of two new fully connected layers that replace the ViT’s classification layer. These two layers are: a linear layer with 128 neurons and a linear layer with 2 neurons. An illustration of the regression head is shown in Figure 2b. To determine the extent of infection, each score serves as a prediction for the severity of the left lung and the right lung. The final output of the network is the score prediction with a value falling between 0 and 8, which is the sum of the two output scores.
| (4) |
where and are the two trainable fully connected layers respectively, is the CLS token of the final transformer layer, and p is the predicted vector including the left and right lung scores. The final global output score is the sum of these two scores, .
The final prediction of our VitReg-IP model, , corresponds to the predicted CXR severity. Using a specific loss function, this value is then compared to the ground truth score to train the entire network. The radiological scores are the ground-truth scores. It is important to note that although our proposed model produces predicted scores for each lung, the training data don’t necessarily need to include ground-truth scores for each lung because the loss function is based on the total score.
3.2 Data Augmentation
All CXR data used in this study underwent data normalization, a crucial step that ensures that each input parameter pixel has a uniform data distribution. This accelerates convergence during training of the model. In addition, to facilitate the training of the deep neural networks in this study, all CXR data were reformatted to identical data dimensions of size . We construct our deep neural network by applying successive operations in order to convert the CXR input data into the projected severity scores (e.g., geographic extent score, opacity extent score, and Brixia score). The efficiency and effectiveness of our network are highly dependent on the accessibility to data as well as the preparation of training and test data.
If learned weights perform well in the training set but poorly in the test set, these models are overfitted. In the context of this study, we need to expand the size of the dataset used to avoid overfitting, which prevents generalization of the model. Indeed, in precision health, there is often a lack of input data due to the novelty of the tackled topics and the high cost of labeling by medical experts [58]. In our architecture, the size of CXR images is increased by operating dropping and merging data augmentation methods.
More specifically, the data augmentation in this study involves the creation of new training images from the original CXR data of the training set using the combined offline lung and score replacement (inspired by the lung replacement method [46]) and the online score-correlated CutMix derived from the simple CutMix [63]. These two augmentation methods increase the data variety and potential of deep neural networks in terms of robustness and accuracy. The above two augmentation methods were developed and adapted for our regression problem and thus are used to generate the augmented images as well as their corresponding ground-truth scores.
3.2.1 Combined Lung and Score Replacement
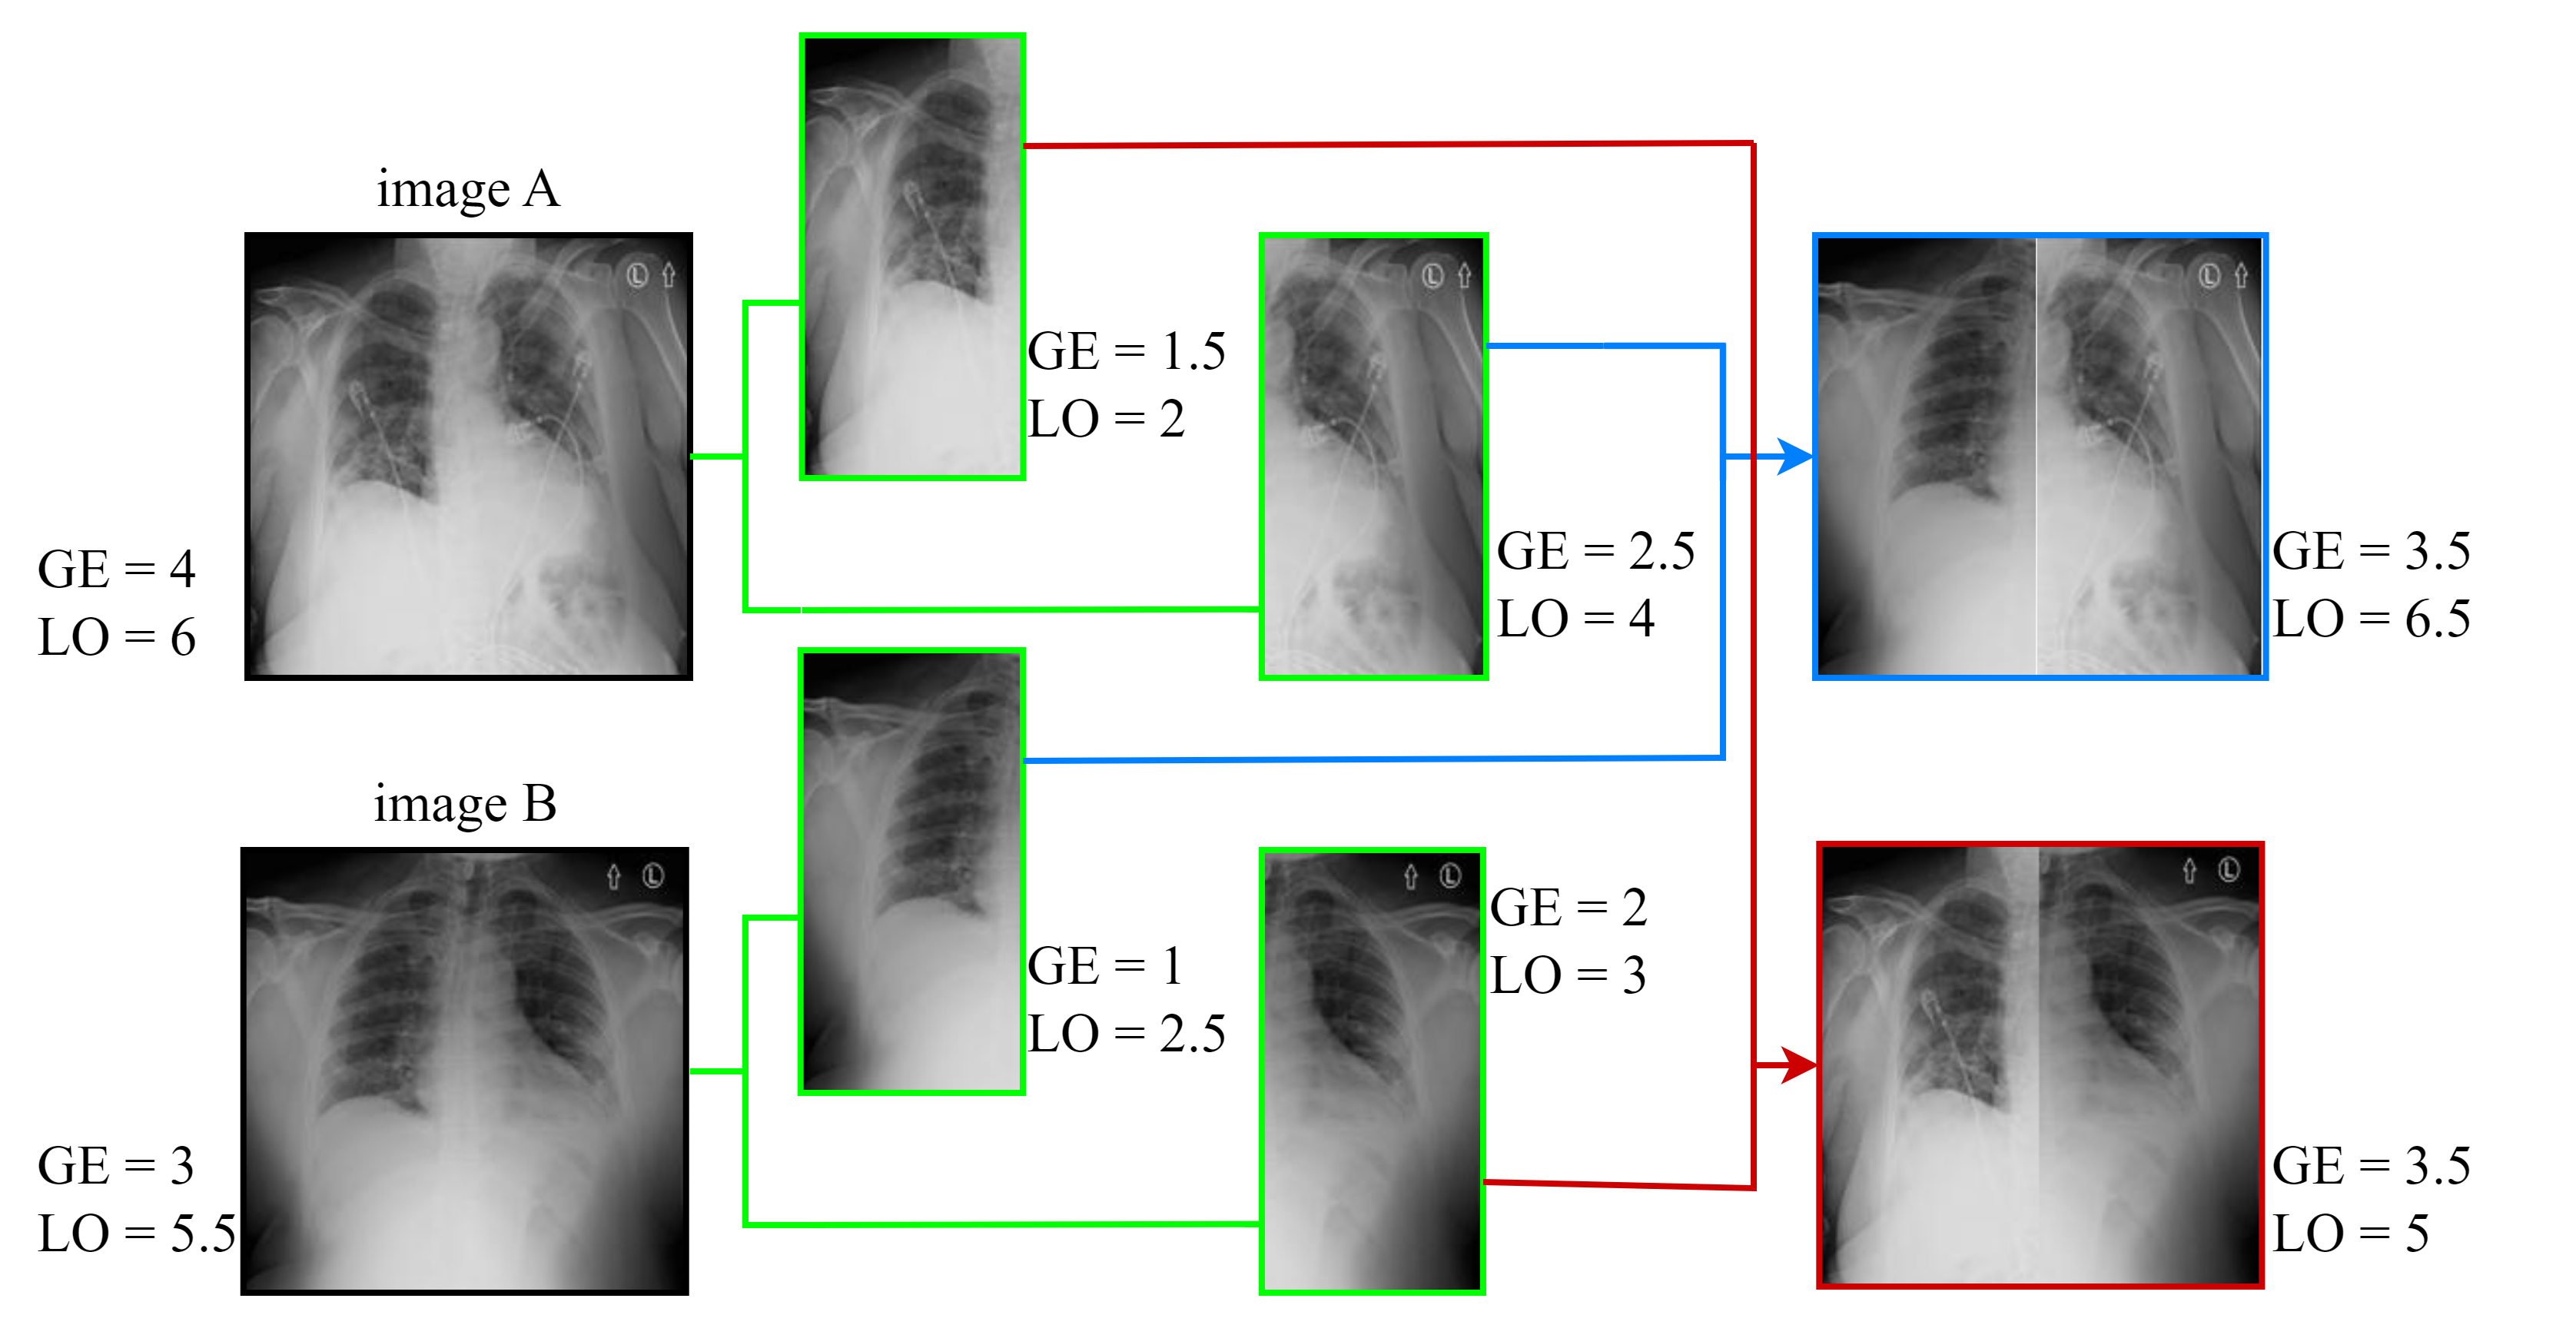
We applied a lung replacement procedure already proposed for a classification problem, but in an improved version for the case of regression. The principle is based on replacing the left or right lung of a given patient with the opposite lung from a CXR of another patient. Lung replacement was applied to CXRs of the same class in [46] to increase the training data. However, since we have a regression problem in our case, we can apply the lung segmentation to any two CXR images. Moreover, the new ground truth scores of the two resulting images are calculated by adding the individual lung scores of the left and right parts of the original images. Thus, we apply a combined lung and score replacement. Thus, the individual lung images are merged and the ground truth scores of the combined lungs are added to also determine the ground truth scores of the created images. To use this method, the individual ground truth scores must be available. An illustration of the process can be seen in Figure 3. We applied this method to the training portion of the dataset, which originally consisted of 1878 images for the RALO dataset [59]. A combined lung and score replacement was applied to these images, resulting in two sets of synthetic images since we have two types of severity scores. The new training dataset now consists of a total of 5634 CXR images.
3.2.2 Score-correlated CutMix
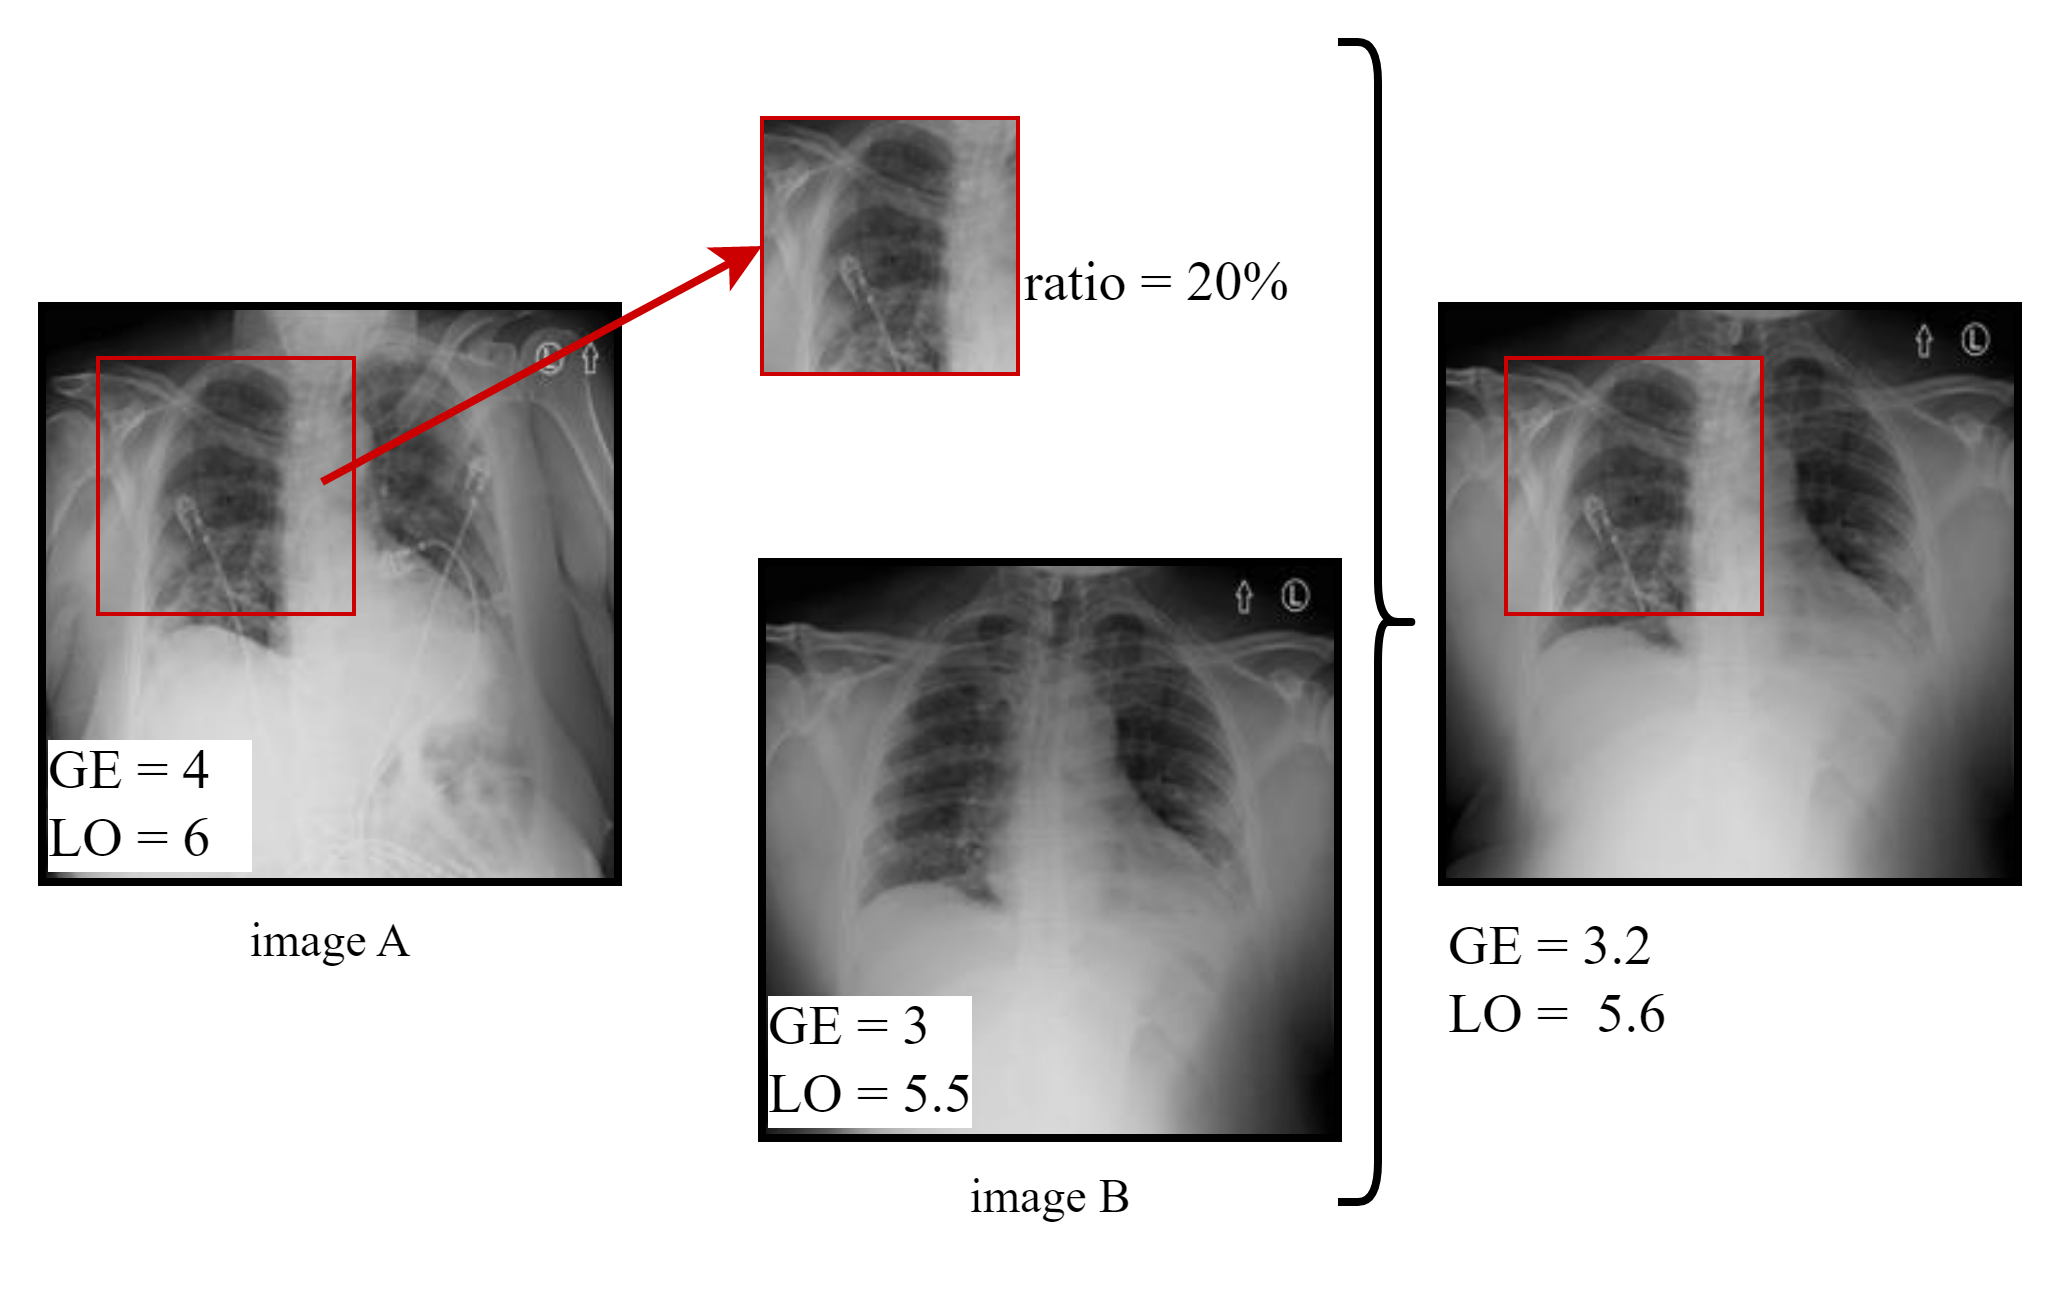
The CutMix method creates a locally natural image by replacing a single image region with a patch from another training image. We use CutMix by replacing cropped portions from image with a patch from another image in which the size is chosen randomly within a given range, to create a new image, as shown in Figure 4. This method was used during online training, where one image is CutMix-ed with other images from the same batch in each epoch. In our study, we have a regression problem, i.e., we are interested in computing the new ground truth score of the synthesized image. Therefore, we adapt the conventional CutMix (purely image-based) to our regression problem and create a score-correlated CutMix. According to the total number of pixels in the fused images, the ground truth labels are computed by a weighted average of the ground truth scores of both images, as shown in (5).
| (5) |
where is the ratio between the size of the replaced area and the total size of the image, and are the ground truth scores of images and , respectively, and is the new ground truth score.
Efficient deep network training requires a significant amount of data. From a few images, it is possible to generate many more augmented images using the combined lung and score replacement method. Additionally, using the score-correlated CutMix during model training enables the creation of diverse images and their corresponding relative scores.
3.3 Loss Function and Optimizer
loss, also known as Absolute Error Loss, is the loss function we use for training. The used loss function is described in (6).
| (6) |
where and are the ground truth score and the predicted score of the image, respectively. is the size of the batch. The experiments’ findings demonstrated that when trained on the analyzed RALO dataset of CXR data using Loss, ViTReg-IP had the best performance in comparison to other loss functions.
The stochastic gradient descent (SGD) optimizer is employed to change the model’s parameters. Its role is to modify model weights in order to minimize the loss function. This optimizer is chosen after testing varied optimizers and comparing the model’s performance.
4 Performance Evaluation
4.1 Datasets
The main objective of this study is to evaluate the feasibility of Deep Learning-based computer assistance in assessing the severity of lung disease. To this end, we evaluate our solution as well as other deep neural networks capable of assessing CXR images of patients with different severities of lung infections. To this end, several CXR datasets were used in this study [57, 49, 9, 7]. Table 1 summarizes the datasets used.
4.1.1 RALO dataset
We used the Radiographic Assessment of Lung Opacity Score (RALO) dataset in our study [57]. Stony Brook Medicine recorded and scored the RALO dataset to provide researchers with a common COVID-19 dataset. Two renowned radiologists assessed the dataset, which consists of 2373 CXRs, to perform an additional COVID-19 severity analysis. The RALO dataset is divided into training and test data with 1878 and 495 images, respectively. Geographic extent (GE) and lung opacity (LO) are the two assessment metrics considered in the radiological evaluation. The right and left lungs are assessed independently, and the geographic extent of lung involvement by morning opacification or consolidation is scored as follows: 0 = no involvement; ; and involvement. The total score for geographic extent (right + left lung) ranges from 0 to 8 after the scores were summed. The degree of opacity was scored for the right and left lungs separately as follows: 0 = no opacity; 1 = ground glass opacity; 2 = mixture of consolidation and ground glass opacity (less than 50% consolidation); 3 = mixture of consolidation and ground glass opacity (more than 50% consolidation); and 4 = complete opacification. The total score for the extent of opacity, obtained by adding the scores for the right and left lungs, ranges from 0 to 8 points [59].
4.1.2 Brixia dataset
The Brixia dataset, compiled from a dataset of 4695 CXR images matching the number of images acquired for patient monitoring in ICUs during the pandemic, was one of three datasets used to perform our tests [49]. The following annotations describe the relative Brixia score. The lungs are divided into six zones, three for each lung, when viewed from the anteroposterior (AP) or posteroanterior (PA) angle. Depending on the type and severity of lung abnormalities, a score of 0 (no abnormalities), 1 (interstitial infiltrates), 2 (interstitial and alveolar infiltrates, interstitial dominance), or 3 (interstitial and alveolar infiltrates, alveolar dominance) is assigned for each zone. The six scores can be combined to obtain a Global Score ranging from 0 to 18.
4.1.3 Cohen COVID-19 dataset
The dataset of Cohen et al. COVID-19 is also used [7]. This collection consists of CXR images collected from numerous locations around the world, at different spatial resolutions, and with other unidentified image quality factors such as modality and window-level settings. Two subsets of this dataset were exploited in our analysis:
-
•
The CXR labeled with the Brixia scores subset is used. The associated Brixia score annotations for the CXR in this collection were prepared by two experienced radiologists, a certified staff member Rs and a trainee Rj, with 22 and 2 years of experience, respectively. The collected dataset consists of 192 CXRs that were fully annotated using the Brixia scoring system.
-
•
We also used a retrospective cohort of 94 posteroanterior (PA) CXR images from the COVID-19 imaging dataset, which is available to the general public. Physicians for each patient indicated that they were all COVID-19 positive. Ratings of geographic extent and opacity extent ratings are used to label these images.
4.1.4 Danilov et al. COVID-19 dataset
In this dataset, the authors provide a collection of CXRs from COVID-19-positive and negative patients. There are a total of 1,364 images. Of these, 580 images show COVID-19 positive results (43%), while 784 images show no results at all (57%). Each image was assigned a score between 0 and 6, with 0 representing no abnormalities and 6 representing a severe case of COVID-19 involving more than 85% of the lungs. In addition to the COVID-19 data, it also includes CXR images of healthy lungs without pneumonia or other abnormalities [9].
4.2 Experimental Setup
We compared the performance of our deep neural network with other deep learning architectures and evaluated our ViTReg-IP model against additional datasets to investigate the effectiveness of the deep neural network we developed for the computational assessment of lung disease severity. Several deep-learning models were used for comparison. We show that the proposed network model provides higher sensitivity and interpretability than the current COVID-Net [59] and COVID-NET-S[57]. We also employ ResNet50, a ResNet variant developed by Kaiming He et al. [20], with 50 layers, where we replace the output layer with a regression head with two outputs. We also tested the Swin transformer [38]. This is a hierarchical transformer architecture whose representation is generated by shifted windows. It can serve as the main structural support for a regression task performed for evaluation. Similarly, the depth-separable regular convolutions of the XceptionNet architecture [5] are put to the test. We also tested the InceptionNet architecture, [52] which emphasizes parallel processing and concurrent feature extraction. Moreover, we tested the model proposed by Cohen et al. [6] which was trained using a large dataset as a feature extractor and allows score predictions. In addition, we tested MobileNetV3, a convolutional neural network tailored to cell phone CPUs through a combination of hardware-aware network architecture search (NAS) and the NetAdapt algorithm [21]. The output of this model was also modified to predict the score through a regression head.
In order to evaluate our experiments, we tested our ViTReg-IP model over several datasets. We trained CXR images of size 224224 each, a batch size of 32, a learning rate of , and 60 iterations with Loss as the loss function. Python language and the PyTorch Lightning learning package were used for the entire model development process.
We compute the mean absolute error (MAE) and Pearson correlation coefficient (PC) between predicted scores outputted by the deep neural networks and ground truth scores by expert radiologists for geographic extent, opacity extent, and Brixia scores in the test sub-set of CXR data for each trial in order to measure the performance of the deep neural networks learned in this study. A model evaluation metric used with regression models is the mean absolute error as in (7).
| (7) |
where is the prediction and the true value. The average of the absolute prediction error over all test images is the mean absolute error of a model.
The linear link between the two sets of scores is gauged by the Pearson correlation coefficient as follows:
| (8) |
where denotes the number of test images, is the predicted score (GE or LO) of the test CXR image, is its ground-truth score, is the mean of all predicted scores and is the mean of all ground-truth scores. and are the standard deviations of the predicted and ground-truth scores, receptively. This correlation coefficient, like others, ranges from to , with denoting no correlation and a precise linear one.
4.3 Experimental Results and Comparison
We used nine different models to train the processed and expanded RALO dataset for lung severity assessment: COVID-NET [59], COVID-NET-S[57], ResNet50[20], InceptionNet [52], XceptionNet [5], Swin Transformer [38], Stonybrook Feature Extraction [6], MobileNetV3 [21], and our ViTReg-IP model. The dataset contains images labeled with the geographic extent and lung opacity, with values ranging from 0 to 8 to denote disease severity, which ranges from normal to severe. The dataset used includes the original images and the images resulting from combined lung and score replacement, and the score-correlated CutMix was applied as an online augmentation method. This applies to all training conducted for all models tested. The models COVID-NET, COVID-NET-S and Stonybrook Feature Extractor were trained unchanged, while the remaining models were used as a backbone to replace the ViT in our proposed model. The results are shown in Tables 2 and 3. For each metric in each table, a thorough investigation of the performance of deep learning models in assessing infection severity is provided. In addition, there are two columns indicating the number of parameters used in each model and the time required for training. Table 2 presents the results obtained after training the models using the geographic extent as a label. It shows that our proposed model has the best performance. Table 2 similarly shows the results for the score of lung opacity.
| Model | MAE | PC | Number of | Training |
|---|---|---|---|---|
| parameters | time | |||
| COVID-NET[59] | 4.563 | 0.545 | 12 M | 40 min |
| COVID-NET-S[57] | 4.746 | 0.581 | 12 M | 40 min |
| ResNet50[20] | 1.107 | 0.684 | 23 M | 1.5 hr |
| Swin Transformer[38] | 0.927 | 0.819 | 29 M | 2 hr |
| XceptionNet [5] | 0.864 | 0.802 | 23 M | 1.5 hr |
| InceptionNet [52] | 0.717 | 0.881 | 24 M | 1.5 hr |
| Feature Extraction[6] | 0.981 | 0.741 | 20 M | 1 hr |
| MobileNetV3[21] | 0.864 | 0.822 | 4.2 M | 40 min |
| ViTReg-IP (ours) | 0.569 | 0.923 | 5.5 M | 20 min |
| Model | MAE | PC | Number of | Training |
|---|---|---|---|---|
| parameters | time | |||
| COVID-NET[59] | 2.249 | 0.531 | 12 M | 40 min |
| COVID-NET-S[57] | 2.227 | 0.525 | 12 M | 40 min |
| ResNet50[20] | 1.082 | 0.427 | 23 M | 1.5 hr |
| Swin Transformer[38] | 0.811 | 0.692 | 29 M | 2 hr |
| XceptionNet[5] | 0.771 | 0.696 | 23 M | 1.5 hr |
| InceptionNet[52] | 0.614 | 0.825 | 24 M | 1.5 hr |
| Feature Extraction[6] | 0.881 | 0.701 | 20 M | 1 hr |
| MobileNetV3[21] | 0.741 | 0.731 | 4.2 M | 40 min |
| ViTReg-IP (ours) | 0.512 | 0.855 | 5.5 M | 20 min |
| Data | Score | Original | Training | Test | MAE | PC |
| Training Size | Size* | Size | ||||
| Brixia | Brixia Score | 4695 | 4695 | 250 | 0.981 | 0.622 |
| Brixia | Brixia Score | 4695 | 9390 | 250 | 0.811 | 0.763 |
| RALO | LO | 1878 | 1878 | 495 | 0.881 | 0.681 |
| RALO | LO | 1878 | 5634 | 495 | 0.512 | 0.855 |
| RALO | GE | 1878 | 1878 | 495 | 0.931 | 0.803 |
| RALO | GE | 1878 | 5634 | 495 | 0.596 | 0.923 |
| Danilov et al. COVID-19 | COVID Score | 1225 | 1225 | 139 | 0.389 | 0.951 |
| *if combined lung and score replacement is applied | ||||||
| Training | Test | Score | Original | Training | Test | MAE | PC |
| Data | Data | Training Size | Size* | Size | |||
| Brixia | Cohen COVID-19 | Brixia Score | 4695 | 4695 | 192 | 1.86 | 0.461 |
| Brixia | Cohen COVID-19 | Brixia Score | 4695 | 9390 | 192 | 1.23 | 0.587 |
| RALO | Cohen COVID-19 | LO | 1878 | 5634 | 94 | 0.857 | 0.697 |
| RALO | Cohen COVID-19 | GE | 1878 | 5634 | 94 | 0.838 | 0.842 |
| *if combined lung and score replacement is applied | |||||||
To obtain a model with high generalizability, we trained our ViTReg-IP with different combinations of datasets. Depending on the type of data the model was trained with, the results may look different. The experiments included both intra- and cross-evaluation methods. For the intra-evaluation, in addition to the RALO dataset, the datasets of Brixia and Danilov et al. COVID-19 were used. In each case, the images from the same dataset are split into training and test data and the results of the performance of our trained ViTReg-IP model are collected. The data splitting and the results of intra-evaluation are shown in Table 4To avoid biased performance and to ensure the generalizability of the model, cross-evaluation is tested. Splitting the data into training data from one dataset and test data from another dataset is called cross-evaluation. To avoid any biased performance and confirm the generalizability of the model, cross-evaluation is tested. Several tests were performed by training our ViTReg-IP model with different combinations of datasets. The cross-evaluation results are shown in Table 5. In both intra- and cross-evaluation, experiments are performed on images with and without combined lung and score replacement. This augmentation method can only be applied to data that have separate scores for individual lungs, as in the case of the RALO and Brixia datasets. From Table 5 we can see that the performance of the cross-evaluation was lower than that of the intra-evaluation.
4.3.1 Qualitative Analysis
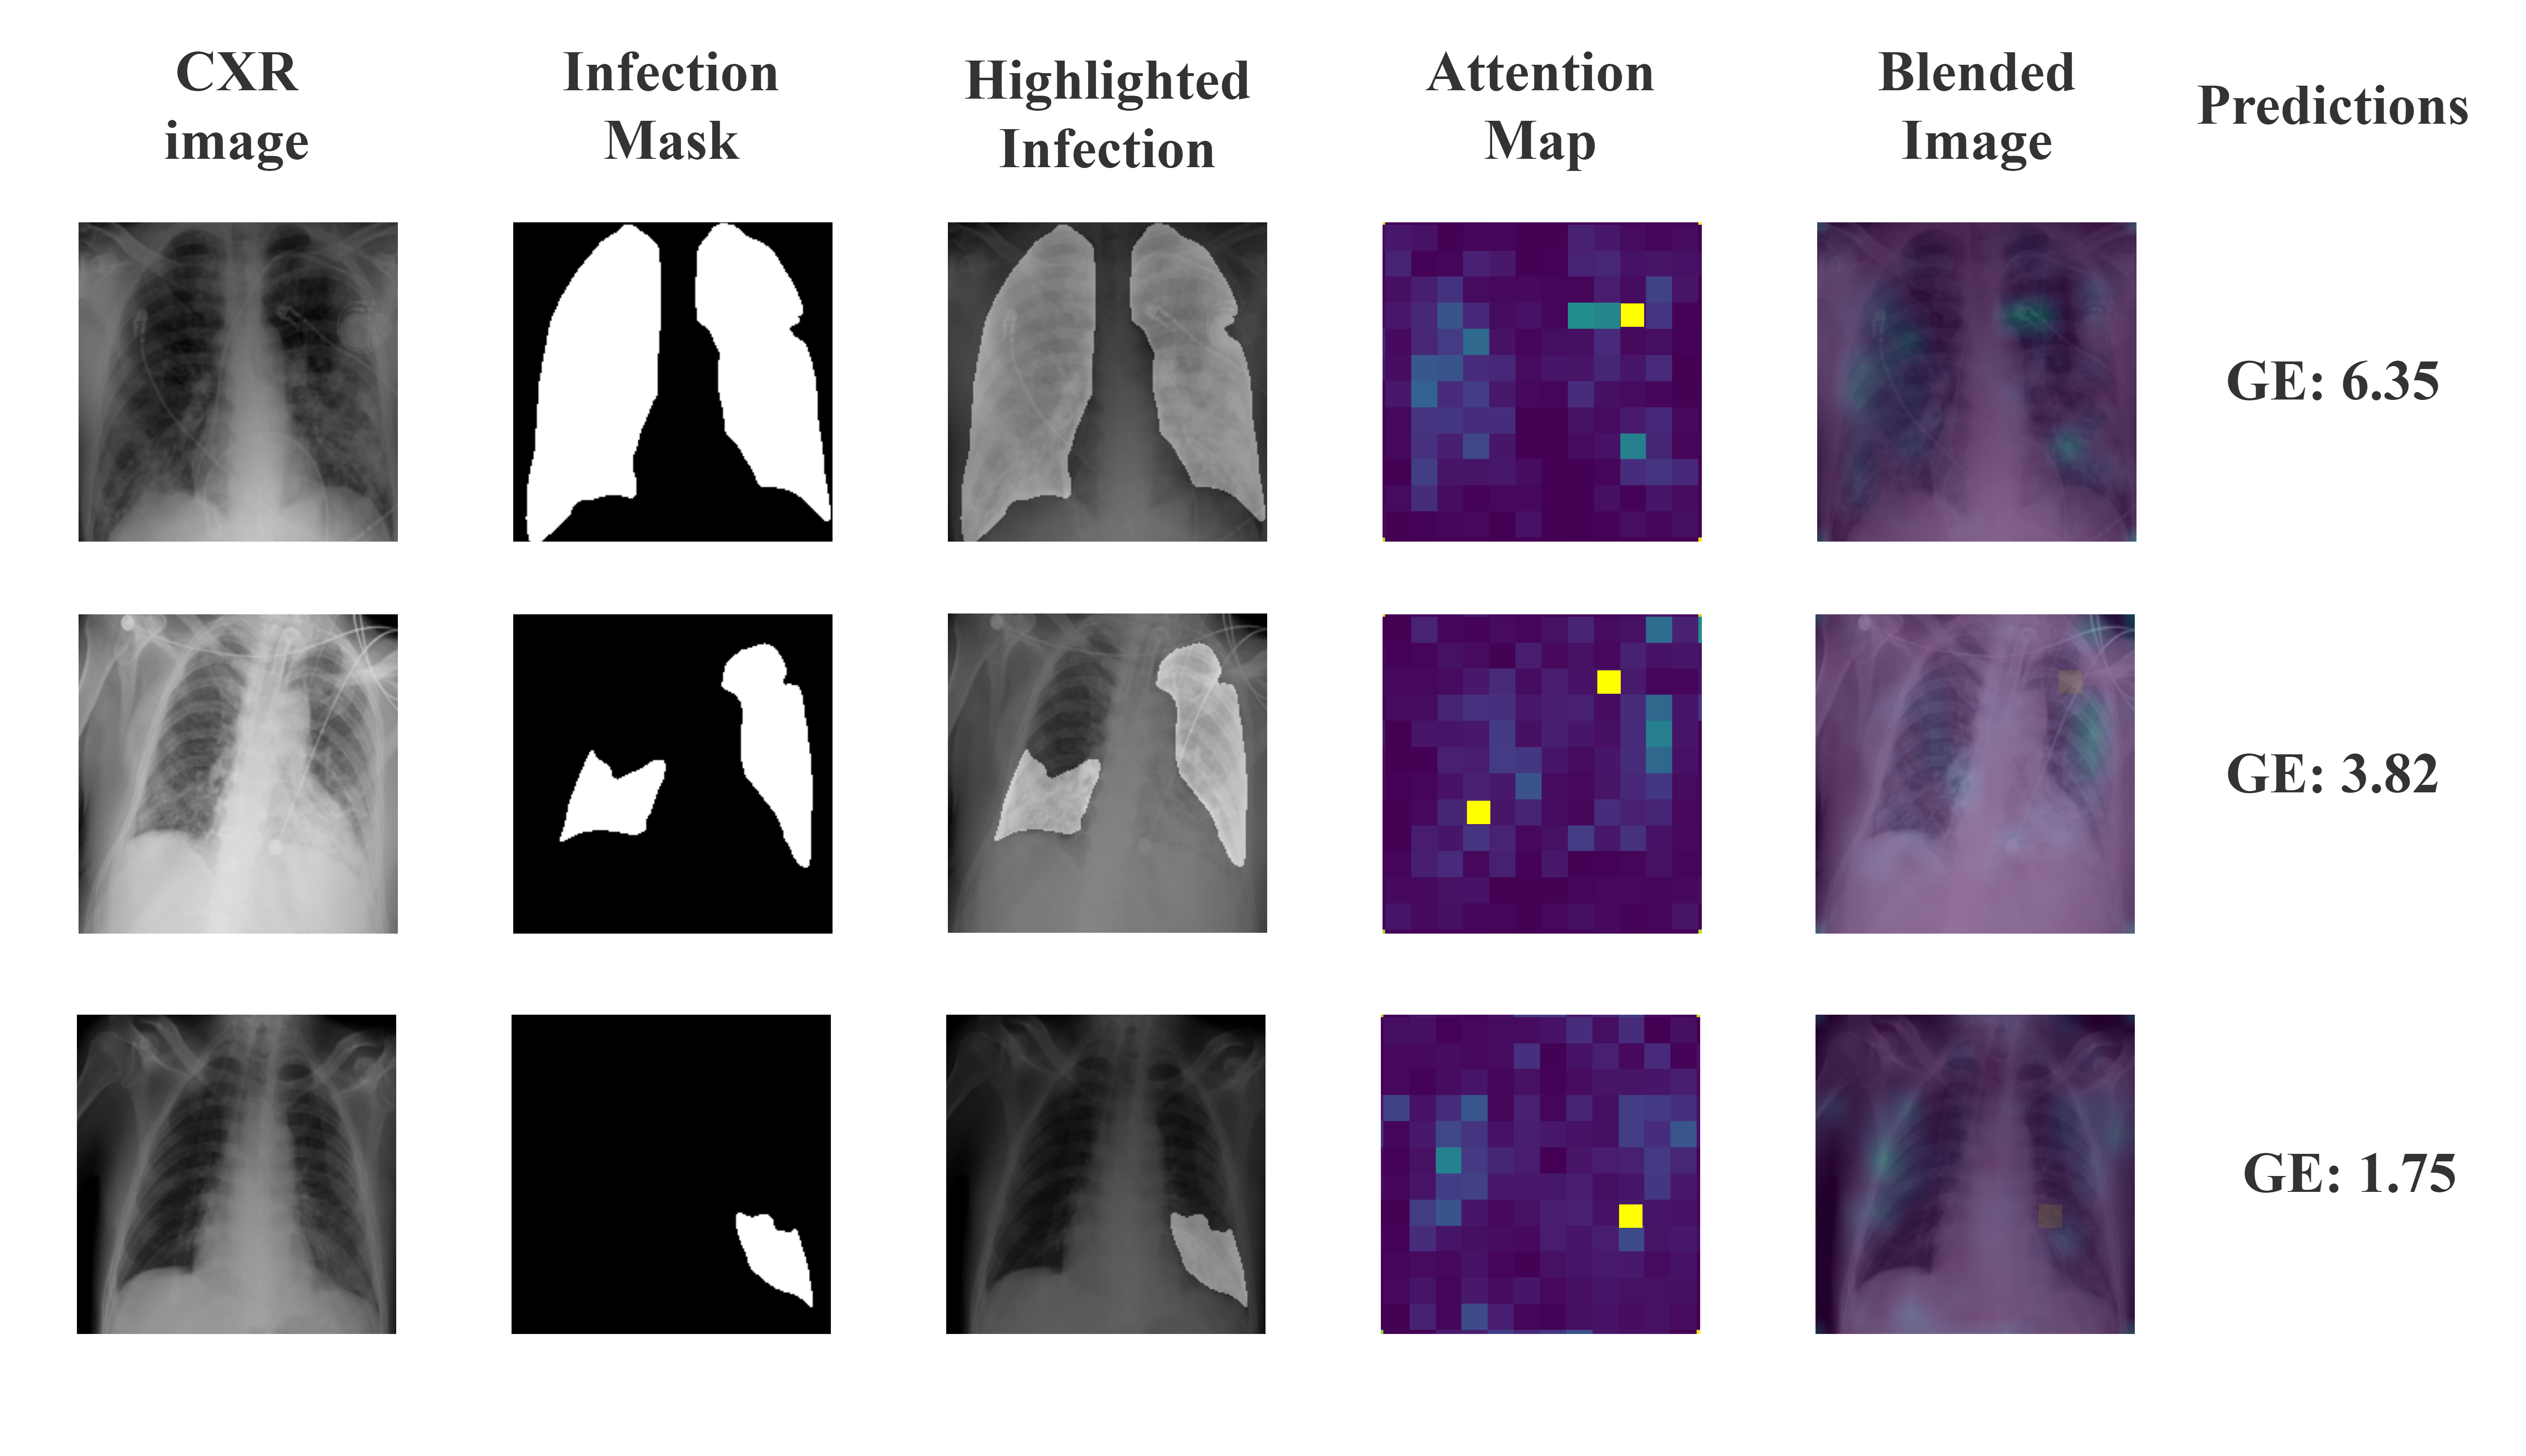
We projected the attention maps to demonstrate the effectiveness of our model in identifying areas at risk of infection. Figure 5 shows the ground truth as well as the high-intensity areas corresponding to infection, represented as a feature map. Without the use of sophisticated methods, our recommended model provided a good representation of infection when the ViTReg-IP is trained using geographic extent as a label, with the score correlated to the location of infection. Figure 5 shows some examples of the data collected to evaluate the effectiveness of the proposed method for representing lung infection areas. Since the datasets used in this work do not have a ground truth mask for infections, we used CXRs from the QaTa COV19 dataset [10]. In Figure 5, the first column shows the original CXR, the second column shows the actual ground truth of the infection area, the third column shows the image overlaid with the ground truth, column four shows the corresponding attention map, and column five shows a preview of the overlay of the original image with the attention map. The predicted geographic extent values are also included in the last column. The obtained attention maps and predicted scores are highly correlated with the actual location of infection. In addition, the predicted GE scores also correlate with the extent of infection. This indicates that our proposed model has high efficiency in localizing the area of infection with respect to the high intensities in the spatial attention map.
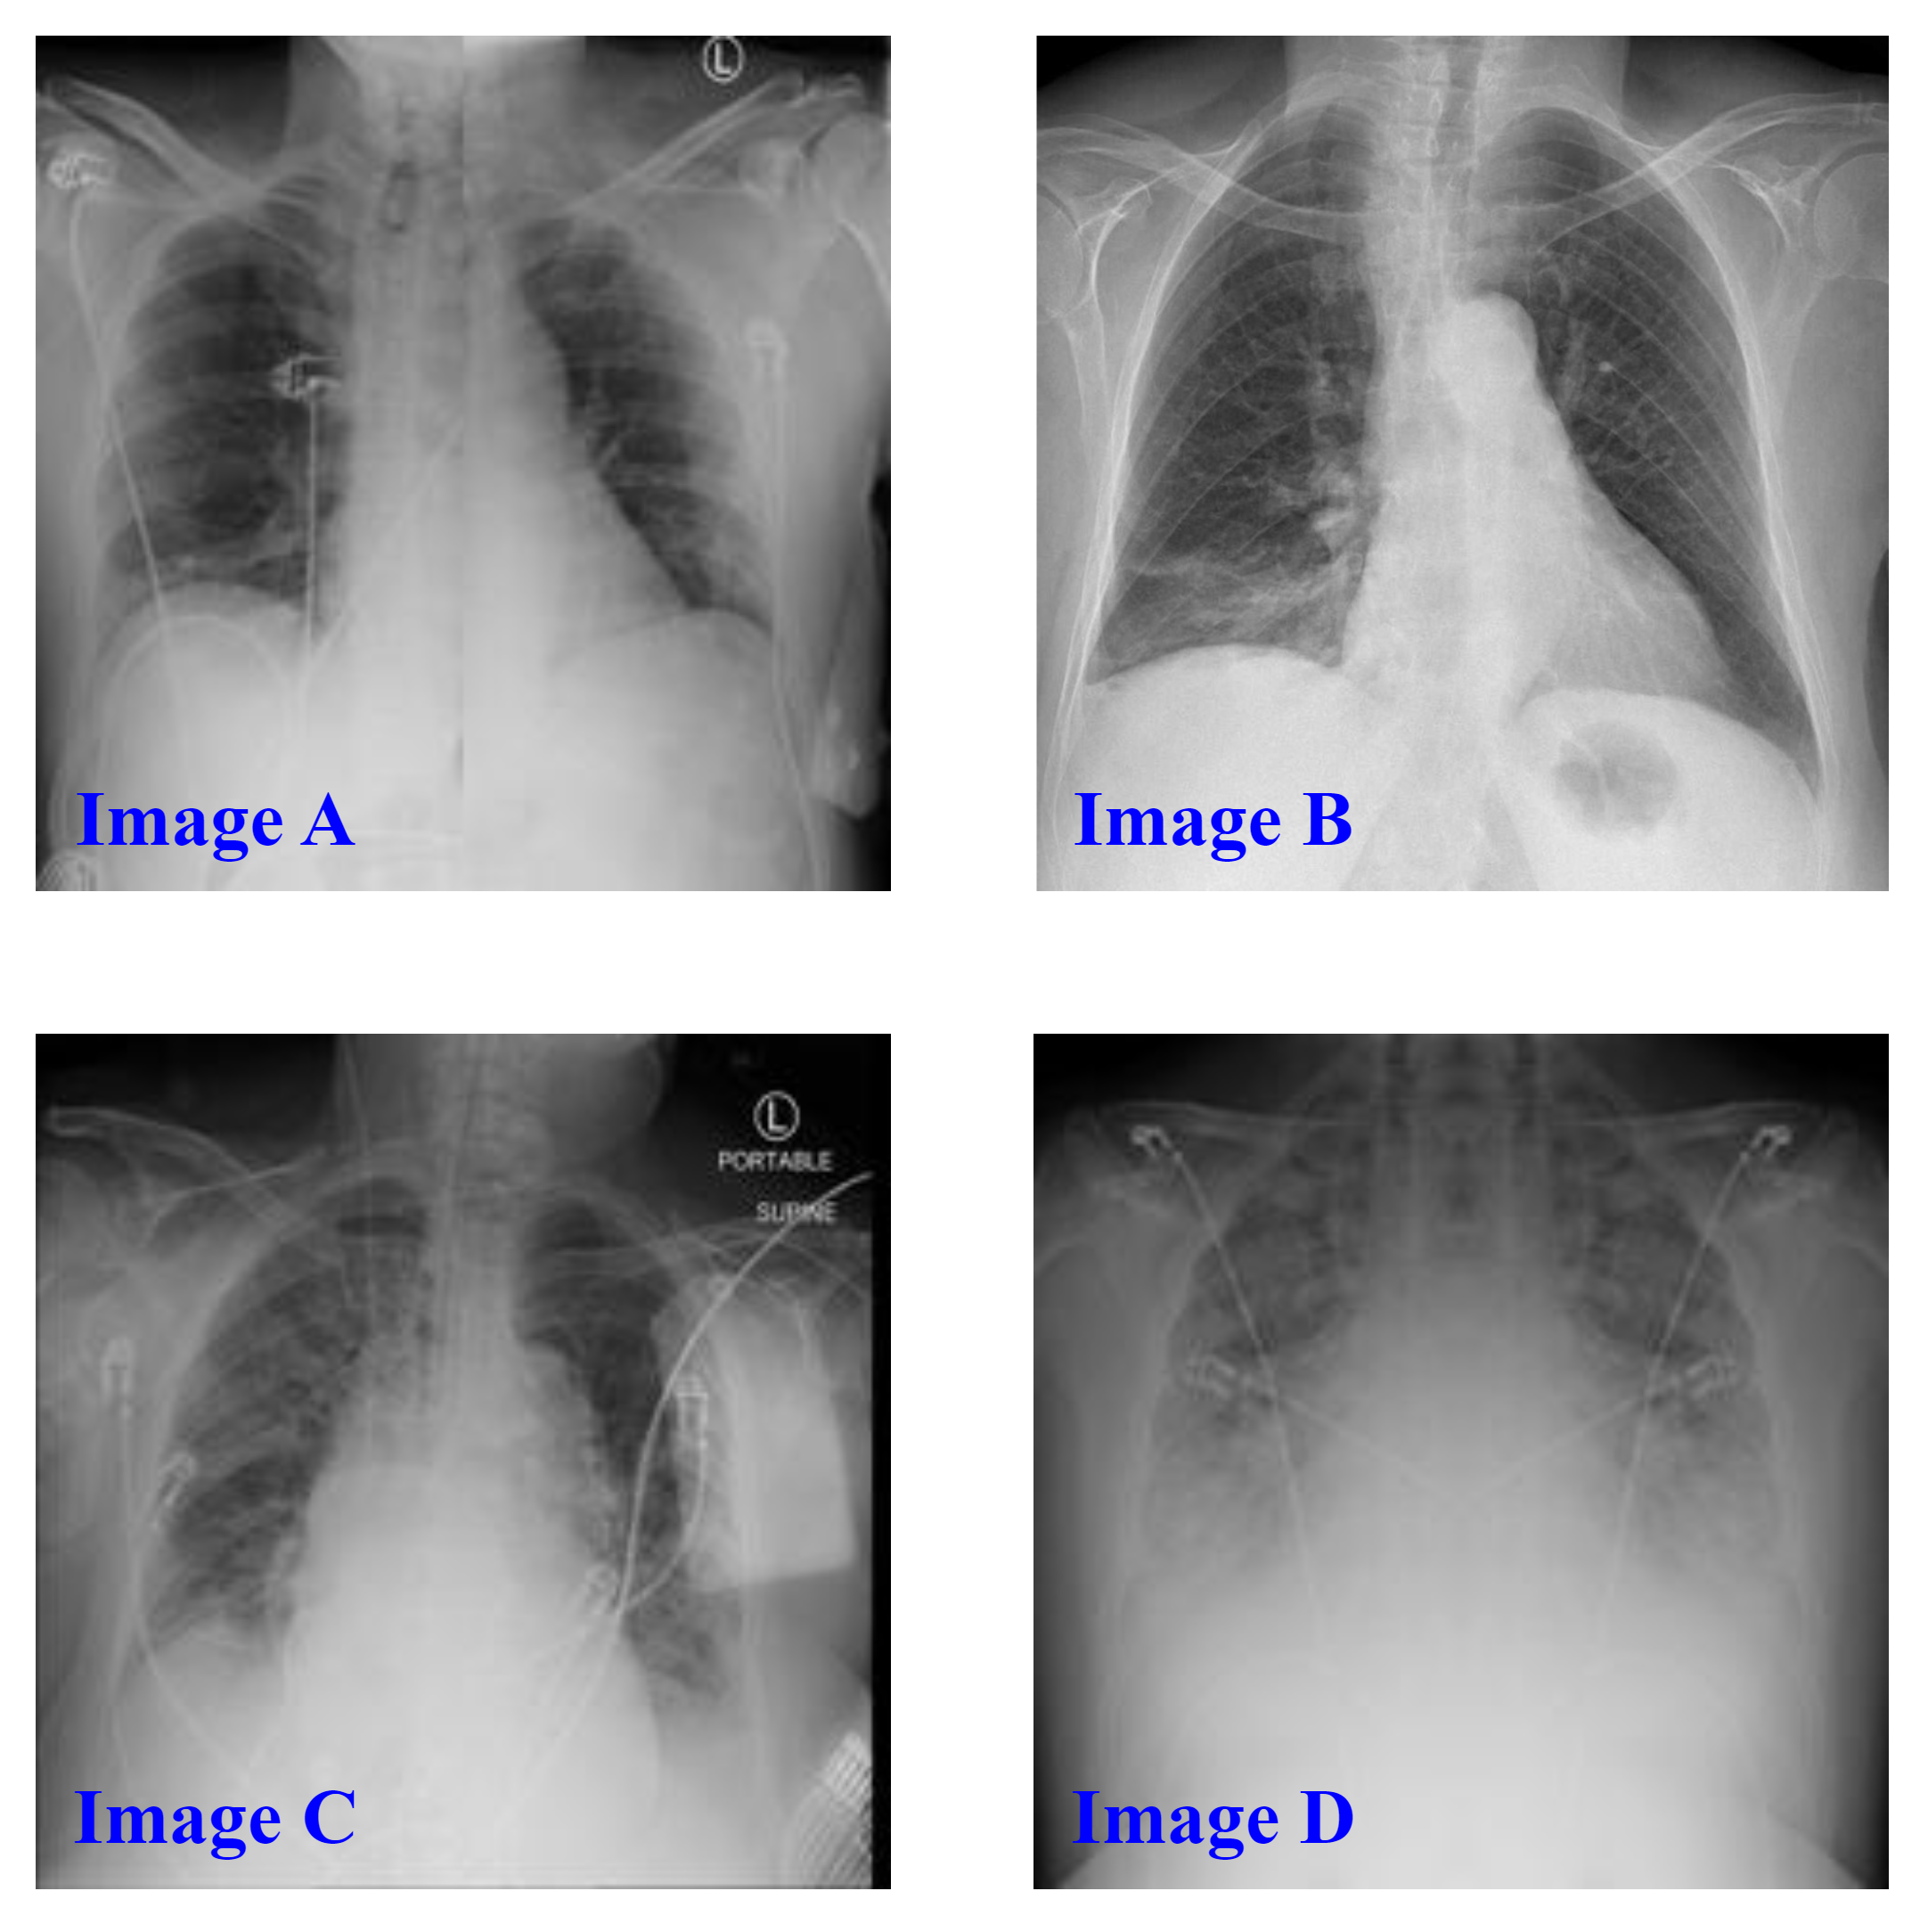
On the other hand, Figure 6 shows the predictions made for four CXR images using the different deep learning architectures. The images were selected to have different ground truth scores from the total range to prove that our proposed model is efficient in the whole range of scores. As shown in the table embedded in Figure 6, the scores predicted by our proposed model are closest to the ground truth labels of the CXR images as annotated by radiology experts. Even in the absence of infection (scores = 0), as in Image A, the predictions for geographic extent and lung opacity are close to zero compared with the other models. Similarly, the error between the predicted and actual values is smallest when using the ViTReg-IP model in images B, C, and D.
| Prediction | ||||||||
|---|---|---|---|---|---|---|---|---|
| Image A | Image B | Image C | Image D | |||||
| Model | GE | LO | GE | LO | GE | LO | GE | LO |
| Ground Truth | 0 | 0 | 1 | 1.5 | 6 | 3 | 7.5 | 8 |
| COVID-NET [59] | 1.78 | 1.54 | 2.01 | 2.95 | 2.13 | 1.52 | 5.51 | 4.86 |
| COVID-NET-S [57] | 2.01 | 1.82 | 2.16 | 3.12 | 3.21 | 2.15 | 5.13 | 5.65 |
| ResNet50 [20] | 0.97 | 1.21 | 1.95 | 3.14 | 4.80 | 2.06 | 6.92 | 7.01 |
| Swin Transformer [38] | 1.06 | 0.89 | 0.567 | 0.75 | 4.91 | 2.54 | 7.91 | 6.56 |
| XceptionNet [5] | 0.67 | 1.12 | 1.57 | 1.62 | 5.58 | 2.52 | 7.12 | 6.78 |
| InceptionNet [52] | 0.98 | 0.99 | 0.53 | 1.23 | 6.56 | 3.51 | 6.88 | 6.96 |
| Feature Extraction [6] | 1.12 | 1.01 | 1.58 | 0.94 | 6.84 | 3.78 | 7.95 | 7.15 |
| MobileNetV3 [21] | 0.91 | 0.33 | 1.61 | 1.21 | 5.06 | 3.29 | 7.44 | 7.16 |
| ViTReg-IP (ours) | 0.36 | 0.27 | 1.05 | 1.47 | 5.48 | 3.12 | 7.53 | 7.96 |
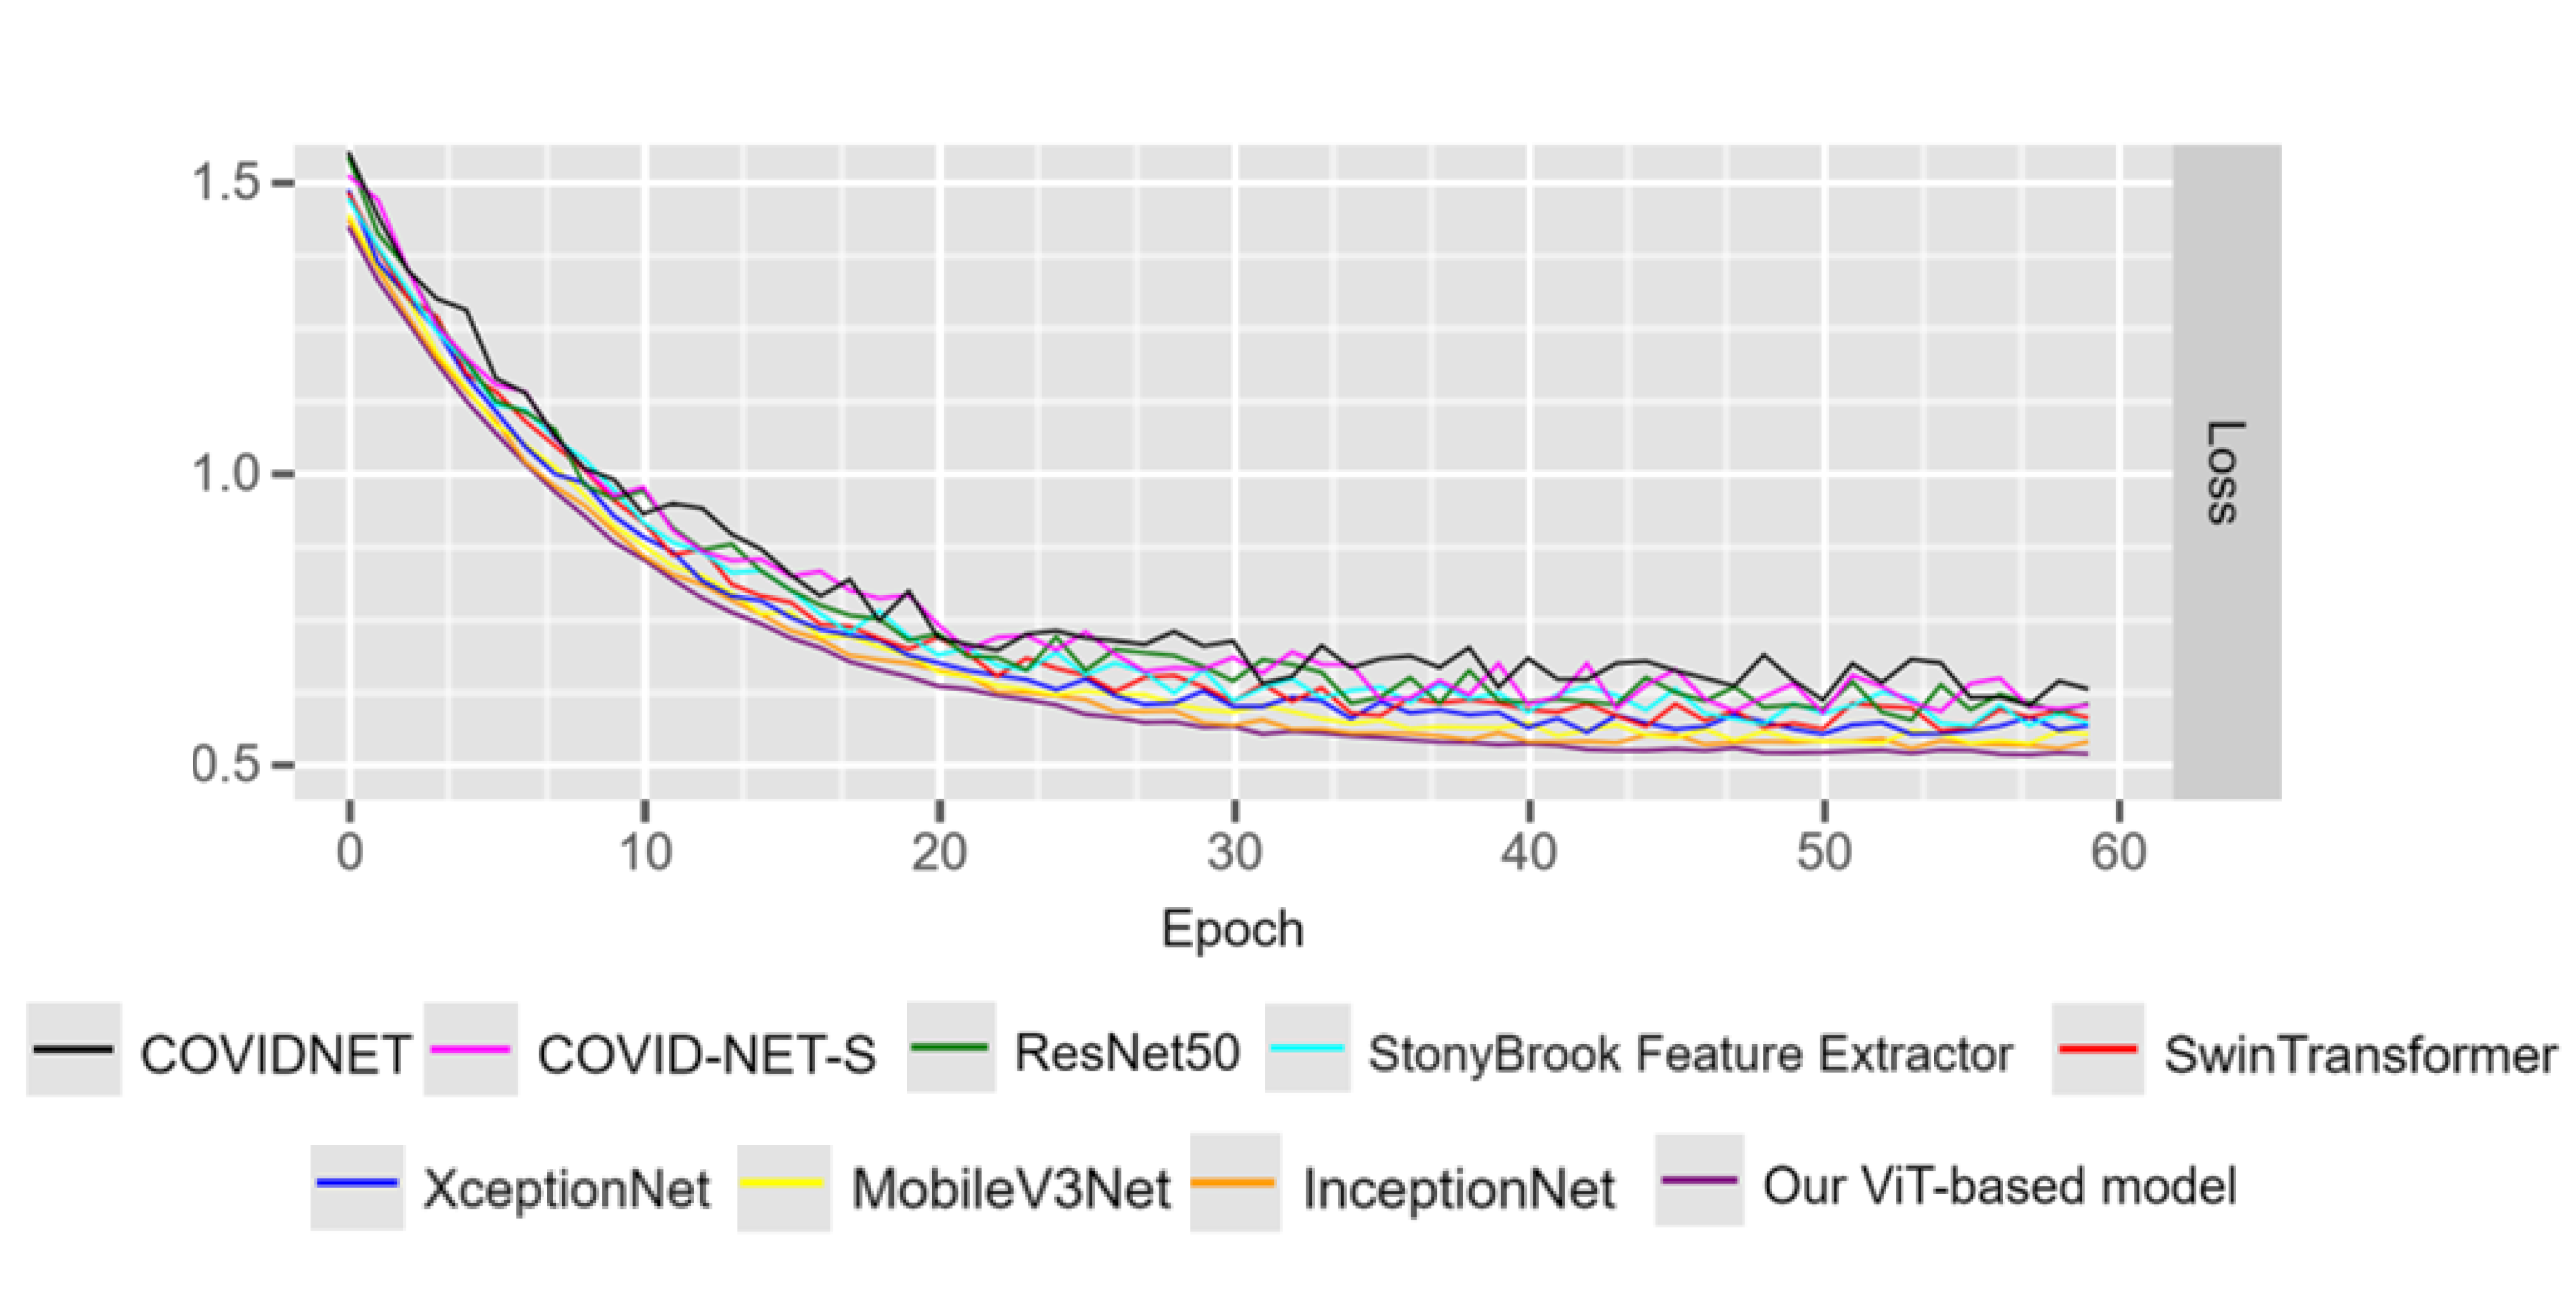
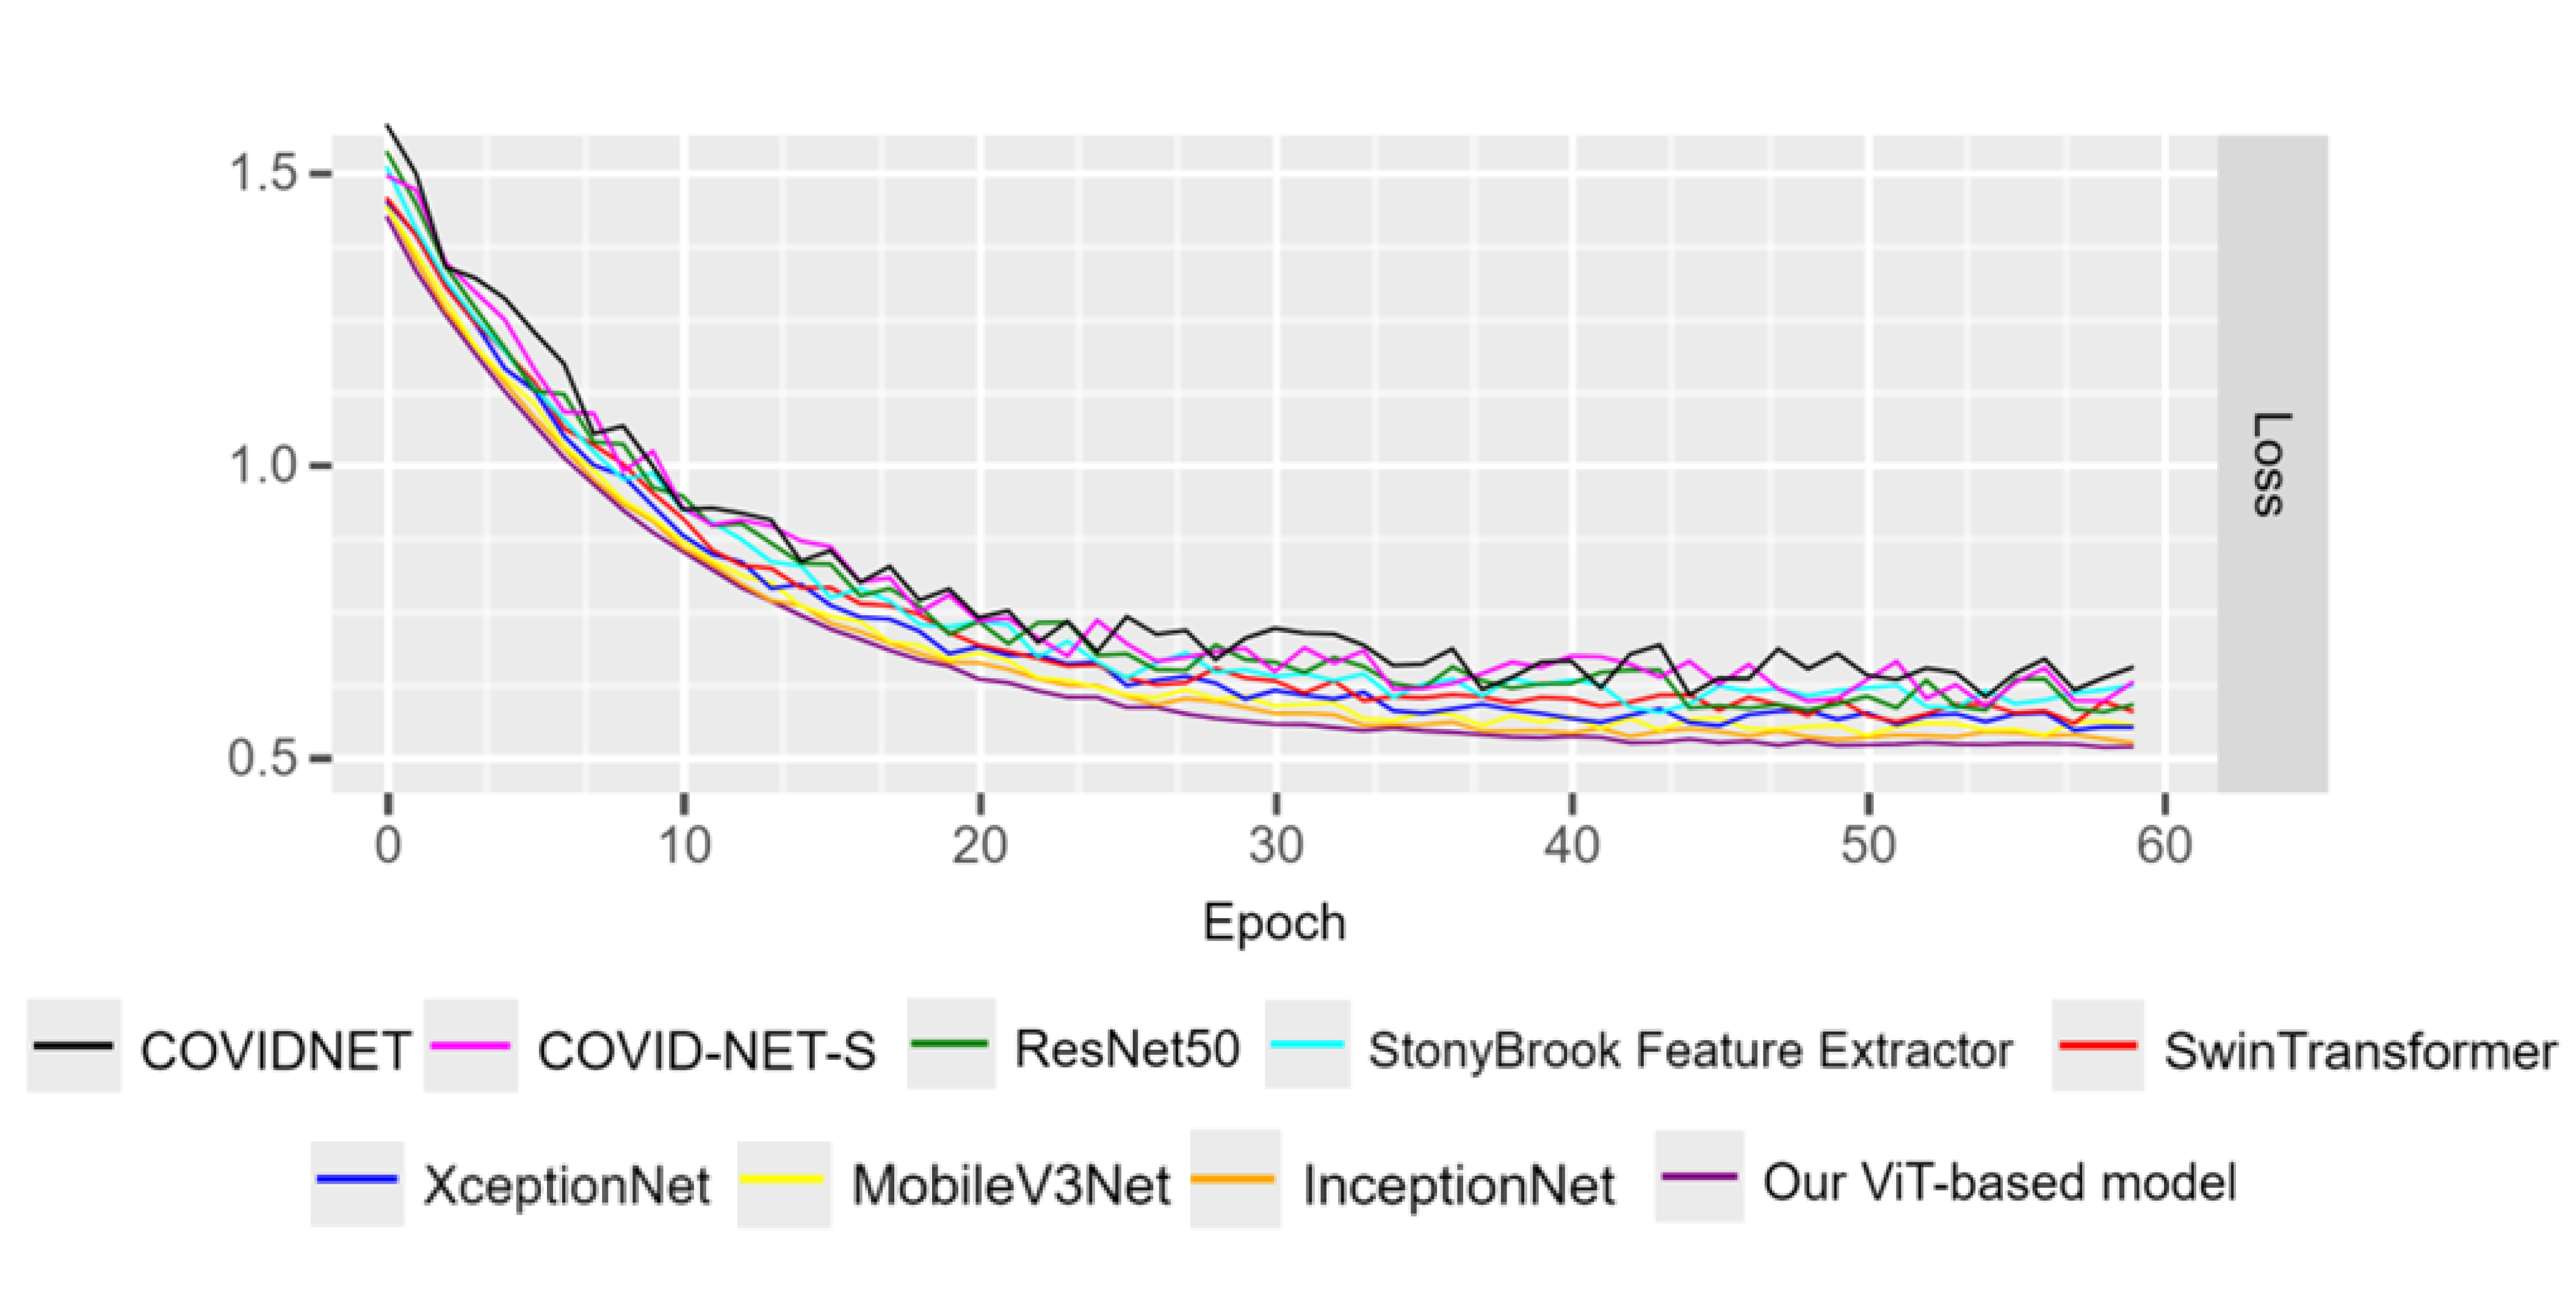
Moreover, Figure 7 shows the training performance of the proposed model and the eight state-of-the-art models presented over 60 epochs. It can be seen that all the trained models converge. As the number of epochs increases, the training loss with the proposed model reaches its stable value in the shortest time compared to the other models. The learning curves are shown for both the geographic extent (Figure 7a) and the lung opacity (Figure 7b) scores.
4.3.2 Quantitative Analysis
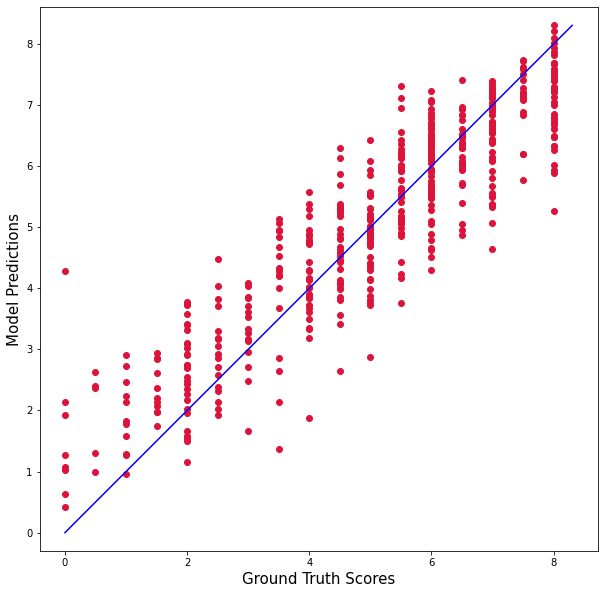
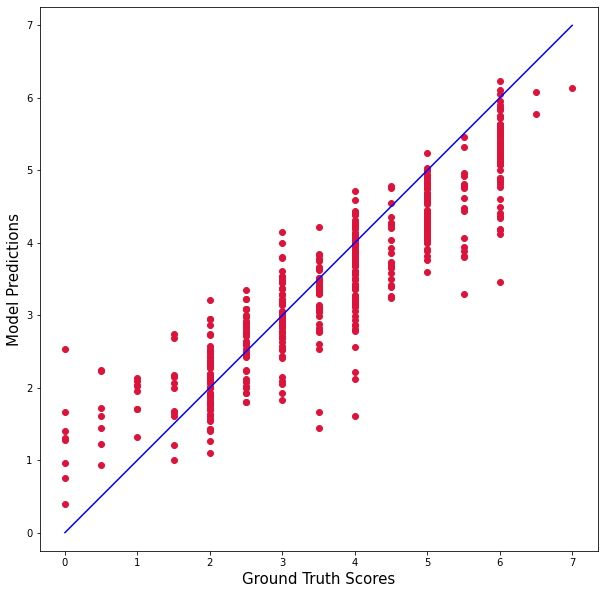
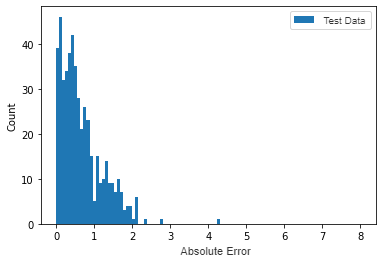
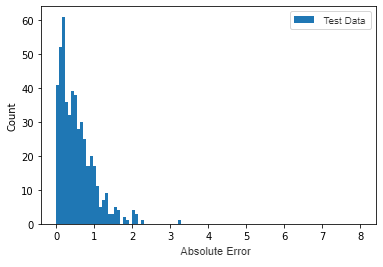
The quantitative outcomes of the proposed model are shown in Tables 2 and 3. In terms of ground truth versus prediction, our model has obtained the best results. The predicted values are relatively close to the actual values, as can be seen in Figure 8 for the RALO dataset. The same is true for both annotations, i.e., geographic extent and lung opacity scores. We also plotted the histograms of the absolute errors obtained with the test images (Figures 8c and 8d). From these histograms, we can see that the highest bars are shifted to the left meaning that a large number of test images have a small prediction error. It can be seen that most of the errors of the individual test images are in the range of 0-1, giving the total error.
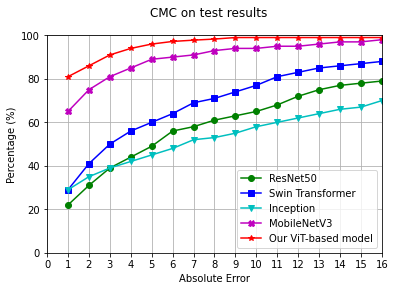
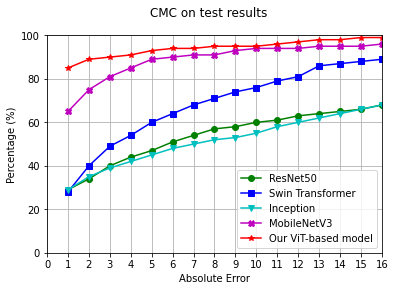
We also considered the cumulative matching curves (CMC) of some tested models to evaluate their performance. The curves for test images for both scores are shown in Figure 9. Our proposed model outperformed three other models. Each color represents one model. For the GE score (Figure 9a), about 80% of the test images in our model have a prediction error below the first error threshold (here it is set to one). The other models tested, such as RestNet50, Swin Transformer, Inception, and MobileNetV3, resulted in a much lower percentage for the same threshold. Similar behavior was obtained with the CMC of the LO score (Figure 9b).
4.3.3 Ablation Studies
We performed a series of ablation studies to better understand the contributions of each component in our ViTReg-IP model. As shown in Tables 6, 7, 8, 9, 10, and 11. First, we conducted an ablation study to determine the impact of the loss function used on the performance of our proposed model. The model is trained using the CXR images for each loss function and the results are previewed. The loss functions used are the Huber loss, the MSE loss, and the smooth L1 loss in addition to the L1 loss. The results are shown in Table 6. The Huber loss function uses a quadratic term to create a criterion if the absolute error is less than a given parameter, otherwise, a scaled L1 term is used. The MSE loss establishes a standard that evaluates the mean squared error between the predicted value and the target value. The smooth L1 loss uses a quadratic term if the absolute error is less than a given parameter, and an L1 term otherwise. The results show that using L1 Loss as the loss function gives the best results. Using L1 Loss, MAE is smallest with values of 0.569 and 0.512 and PC with highest values of 0.923 and 0.855 for geographic extent and lung opacity, respectively.
| GE | LO | |||
|---|---|---|---|---|
| Loss Function | MAE | PC | MAE | PC |
| L1Loss | 0.569 | 0.923 | 0.512 | 0.855 |
| MSE Loss | 0.590 | 0.917 | 0.612 | 0.817 |
| Smooth L1 Loss | 0.615 | 0.913 | 0.542 | 0.843 |
| Huber Loss | 0.637 | 0.909 | 0.601 | 0.807 |
To choose the best optimizer for our model, we trained our ViTReg-IP with five different optimizers and compared the results in terms of MAE and PC. The optimizers tested include Adadelta, SGD, Adam, AdamW, and RMSprop. Table 7 shows the results of the tests and shows that SGD ensures the best performance.
| GE | LO | |||
|---|---|---|---|---|
| Optimizer | MAE | PC | MAE | PC |
| SGD | 0.569 | 0.923 | 0.512 | 0.855 |
| Adadelta | 0.743 | 0.881 | 0.667 | 0.811 |
| Adam | 0.885 | 0.841 | 0.939 | 0.613 |
| AdamW | 0.901 | 0.821 | 0.813 | 0.691 |
| RMSprop | 1.178 | 0.697 | 0.909 | 0.618 |
Table 8 shows the ablation study performed for the size of the linear fully connected layer connected to the output of the transformer in the regressor of our ViTReg-IP. We tested a range of sizes and previewed the MAE and PC values corresponding to each test. The results show that the 128 FC layer we chose gives the best results compared to other sizes.
| GE | LO | |||
|---|---|---|---|---|
| FC Size | MAE | PC | MAE | PC |
| 50 | 0.663 | 0.922 | 0.563 | 0.845 |
| 75 | 0.662 | 0.921 | 0.584 | 0.839 |
| 100 | 0.686 | 0.910 | 0.556 | 0.845 |
| 128 | 0.569 | 0.923 | 0.512 | 0.855 |
| 150 | 0.649 | 0.901 | 0.546 | 0844 |
| 175 | 0.646 | 0.902 | 0.529 | 0.849 |
The next study targeted the effect of the augmentation methods on model performance. Training of our ViTReg-IP was performed using either combined lung and score replacement or score-correlated CutMix, both, or neither methods. The results in Table 9 show that combined lung and score replacement made a greater contribution to improving model performance, with MAE decreasing the most and PC increasing the most when applied alone, compared to score-correlated CutMix applied alone. Score-correlated CutMix also improved results, but to a lesser extent.
| Augmentation | GE | LO | |||
|---|---|---|---|---|---|
| Combined Lung & Score Replacement | Score-correlated CutMix | MAE | PC | MAE | PC |
| 1.032 | 0.778 | 0.926 | 0.635 | ||
| 0.655 | 0.905 | 0.573 | 0.843 | ||
| 0.931 | 0.803 | 0.881 | 0.681 | ||
| 0.569 | 0.923 | 0.512 | 0.855 | ||
The study revealed in Table 10 considers several online augmentations of the state-of-the-art. It was conducted to confirm that choosing CutMix as the online augmentation step produced the best results. CutOut replaces a random box from each image with a black one [12], Attentive CutMix replaces the most descriptive regions of an image based on the intermediate attention maps of a feature extractor with those of another image [56], and MixUp performs a fusion of two images to create a new image [64]. GridMix uses patch-level label prediction for local context mapping and grid-based mixing [4]. SuperPixelMix uses information merging to create a new style of image augmentation based on superpixel decomposition [19]. PuzzleMix is a MixUp approach that directly uses saliency data and supporting statistics [27]. TransMix is similar to CutMix in terms of mixing images, however, it blends labels based on the Vision Transformers attention matrices [3]. Horizontal image flipping and image blurring are two traditional augmentation methods that were also tested [2]. For all tested augmentation methods that use image mixing, the scoring strategy explained in (5) is applied for each case. All previously mentioned augmentation methods are tested. As confirmed by the test results in terms of the lowest MAE and the highest PC, the best results were obtained using CutMix as the online data augmentation.
To investigate whether lung segmentation [39] can improve our model or not, we tested some segmentation architectures to segment the lung regions from the original CXR image as a preliminary step before training the regression model. Thus, lung segmentation can be considered a preprocessing step for the CXR input images. With respect to state-of-the-art segmentation architectures, we used MA-Net [15], PAN [31], and UNet [47]. We decided to test a traditional CNN-based model in addition to our ViTReg-IP. Both models were trained with both geographic extent and lung opacity scores. The results in Table 11 show that similar results are obtained whether or not segmentation is performed before training our proposed model. In addition, we tested ResNet50 as a backbone for the regressor with or without lung segmentation for the CXR input data. The results in terms of MAE and PC are shown in Table 11. As can be seen, the MA-Net lung segmentation method improved the performance of the ResNet50-based model.
| Online | GE | LO | ||
|---|---|---|---|---|
| Augmentation | MAE | PC | MAE | PC |
| Score-correlated CutMix | 0.569 | 0.923 | 0.512 | 0.855 |
| TransMix[3] | 0.582 | 0.921 | 0.551 | 0.855 |
| SuperPixelMix[19] | 0.789 | 0.892 | 0.712 | 0.873 |
| Horizontal Flip [2] | 0.599 | 0.915 | 0.574 | 0.844 |
| Blur [2] | 0.602 | 0.919 | 0.547 | 0.843 |
| MixUp[64] | 0.611 | 0.904 | 0.651 | 0.837 |
| CutOut[12] | 0.642 | 0.914 | 0.601 | 0.814 |
| Attentive CutMix[56] | 0.832 | 0.889 | 0.789 | 0.795 |
| PuzzleMix[27] | 0.754 | 0.851 | 0.721 | 0.732 |
| GridMix[4] | 0.848 | 0.832 | 0.834 | 0.701 |
| ViT-Reg-IP (ours) | ResNet50 | |||||||
|---|---|---|---|---|---|---|---|---|
| Segmentation | GE | LO | GE | LO | ||||
| MAE | PC | MAE | PC | MAE | PC | MAE | PC | |
| No segmentation | 0.569 | 0.923 | 0.512 | 0.855 | 1.107 | 0.684 | 1.082 | 0.427 |
| Segmentation: MA-Net [15] | 0.578 | 0.919 | 0.534 | 0.841 | 0.798 | 0.776 | 0.764 | 0.762 |
| Segmentation: PAN [31] | 0.589 | 0.914 | 0.554 | 0.831 | 0.812 | 0.754 | 0.809 | 0.759 |
| Segmentation: UNet [47] | 0.654 | 0.849 | 0.612 | 0.798 | 0.952 | 0.521 | 0.935 | 0.507 |
5 Analysis of results and discussions
In this work, a novel deep-learning method is developed and validated to predict the severity of COVID-19-infected patients. According to the experimental results, the proposed model holds the potential for clinical diagnosis and early therapy by accurately and rapidly predicting the severity of infection in COVID-19 patients using CXR images. Our proposed ViTReg-IP model can predict accurate quantification of the severity of lung infection, although it was trained on a small dataset. For the evaluation of a system based on quantitative assessments, we proposed an image analysis method. In all experiments, the use of a combined ViT regressor yielded the best performance in score prediction. Compared with the radiologist’s clinical annotations for geographic extent or lung opacity on the entire test set of 495 CXRs, the reported mean absolute errors are less than 0.5, with a range of ground truth scores of . For a diagnosis of urgency that provides a very accurate assessment of the degree of infection, a MAE of less than 0.5 is considered an acceptable error for the network and radiologists. Other features of the strategy proposed in this study make it superior to similar methods in the literature. The same experiments are performed with other competing architectures. COVID-NET, COVID-NET-S, and Stonybrook Feature Extraction are trained in addition to training ResNet50, InceptionNet, XceptionNet, Swin Transformer, and MobileNetV3 as a backbone to the regressor instead of the ViT. The results of training the deep learning architectures are compared with the results of our proposed model to demonstrate the value of the work. The proposed model outperforms the existing deep learning models in terms of MAE and PC compared to other supervised AI-based prediction models, as shown in Tables 2 and 3. The experimental results show that the learned ViTReg-IP model, when trained on the analyzed RALO dataset of CXR data, could achieve MAE between the predicted values and the radiologist’s scores for the geographic extent of 0.596 and the opacity extent of 0.512, which is the lowest error compared to the state-of-the-art. Similarly, the best performance can also be indicated by the PC metric, where it is highest using our proposed model with 0.923 and 0.855 for geographic extent and lung opacity, respectively.
When choosing configuration values, considering training costs is as important as focusing on the absolute best performance. For this reason, it is important to examine the number of parameters and the training time for each model. This insight is taken into account when selecting a model over a time-consuming training process. Tables 2 and 3 illustrate the computational efficiency indicated by the number of parameters and training time of the proposed model. The proposed model provides the lowest MAE, although it has only 5.5 million parameters that take at most 20 minutes to train, resulting in a low computational cost. On the other hand, the world and the context in which the model is applied are potentially constantly changing. This change may take the form of an urgent pandemic, a change in interest rates, or a model failure. In addition, the model may be applied to a new context: For example, the model may be trained again to predict a different score for a new virus or a particular lung infection. The time required to train a model is one of several factors to consider when selecting a model. Because of data drift, it is rarely possible to train the model only once. The input data and the target variable can change over time, which can cause the model to perform significantly worse if it’s not continuously re-trained. In addition, more data may be collected over time that we want to incorporate in order to obtain the best possible model.
In addition, Tables 4 and 5 show the generalization and robustness of our model over different combinations of CXR images with different labeling scores. These tests include both intra- and cross-validation tests with different combinations of CXR images. The MAE values of the intra-validations performed range from 0.981 to 0.389 and the PC values range from 0.622 to 0.951. These results confirm the ability of our ViTReg-IP to perform well on different data. The results of the cross-tests also indicate a good performance of our model. The MAE values of the cross-tests have a maximum of 1.86 and a minimum PC of 0.461. The results are evidence of the successful application of our proposed model when trained on CXR images from different datasets, and it can still provide efficient results that can be used for primary diagnosis and rapid intervention in emergencies.
The ablation studies performed have highlighted the different contributions of multiple parameters. First, we focused on the loss function chosen in our studies. Table 6 shows that the use of L1Loss gave the best results compared to Huber, SmoothL1, and MSE losses. Similarly, we tested the efficiency of choosing the right optimizer and the first FC layer size. The results shown in Tables 7 and 8 confirm the correct use of SGD optimizer and 128-long FC layer. In addition, data augmentation made a large contribution to improving the performance of our model, with the offline combined lung and score replacement augmentation making the largest contribution. This can be seen in Table 9 by testing the performance of the model with and without offline and online augmentation steps. The decision to use CutMix as the online augmentation step was made after testing various state-of-the-art augmentation methods. As can be seen in Table 10, CutMix, TransMix, and Superpixelmix each provide the best results.
Although lung segmentation is a crucial first step in radiological lung imaging, in which a computer-assisted procedure separates the boundaries of the lung from the surrounding thoracic tissue on CXR images, Table 11 proves that lung segmentation did not improve the results in our case. The results show that the model works efficiently with or without the segmentation of the input CXR. Even when the segmentation models with the highest performance are applied in separating the lung from the surrounding in CXR images, the robustness of our ViT-based model is not improved compared to using non-segmented images. This can be due to the particular self-attention mechanisms in the layers of the Transformer. However, applying segmentation to the input images before training a traditional CNN such as ResNet50 resulted in improved performance (MAE is 1.107 for GE, 1.082 for LO without segmentation, and 0.798 for GE 0.764 for LO with segmentation using MA-Net). This can be explained by the fact that transformers interpret the images as patches and solve sequence tasks rather than complete images, while CNN compares image features located at approximately the same positions as the original image. Masking a particular region of the CXR by segmentation can deceive the transformer and lead to a larger error in prediction. As can be seen, in contrast to the state-of-the-art, segmentation can be bypassed in our proposed model and still achieve good performance. In this case, we can additionally reduce the high computational cost required to train a segmentation model and apply the segmentation to the input datasets.
In summary, disease detection is the focus of the bulk of Deep Learning-based COVID-19 research on diseases. The remaining relevant literature shows that disease severity assessment typically involves binary categorization as opposed to multi-classification of COVID-19. To the best of the authors’ knowledge and after a careful review of the literature, the main advantages and contributions of the methodology proposed in this paper are that the proposed study differs from other disease detection studies in that it not only detects COVID-19 disease but also determines the severity of the disease. This study avoids the significant amount of work required for lesion segmentation, which saves time and improves the ability of clinicians to quickly and efficiently perform COVID-19 disease assessment studies based on deep learning methods.
6 Conclusion
In this study, we hypothesized that a generalized transformer-based approach could reliably and rapidly predict the degree of pulmonary infection in patients with COVID-19 by exploiting multi-score datasets of graded CXRs and comparing them with ground truth scores annotated by radiologists. Using computer-aided severity evaluation of CXR images from COVID-19-positive patients, the experimental results demonstrate the effectiveness of the proposed model and its potential to be a helpful tool for clinicians and healthcare workers. Our experimental results showed that the proposed network could be stably trained with a small dataset, made comparisons with the state-of-the-art methods, and produced results with the lowest error that were highly correlated with radiological results. Moreover, this open-access approach provides a biomedical assistance tool that may be useful for automatically alerting on CXRs scored by physicians which may require double-checking due to an identified high score deviation. In addition to being highly efficient, our model has the advantage of being computationally inexpensive due to its short training time and not requiring segmentation as a preprocessing step. As a result, the ViTReg-IP can be retrained on new data to respond to the same or different pulmonary infections by predicting the relative corresponding score.
Author contributions
Conceptualization: Bouthaina Slika, Fadi Dornaika & Karim Hammoudi; Methodology: Bouthaina Slika, Fadi Dornaika & Karim Hammoudi; Formal analysis and investigation: Bouthaina Slika, Fadi Dornaika & Karim Hammoudi; Writing - Review & Editing: all authors.
References
- [1] F. Bougourzi, F. Dornaika, and A. Taleb-Ahmed. Deep learning based face beauty prediction via dynamic robust losses and ensemble regression. Knowledge-Based Systems, 242:108246, 2022.
- [2] Alexander Buslaev, Vladimir I Iglovikov, Eugene Khvedchenya, Alex Parinov, Mikhail Druzhinin, and Alexandr A Kalinin. Albumentations: fast and flexible image augmentations. Information, 11(2):125, 2020.
- [3] Jie-Neng Chen, Shuyang Sun, Ju He, Philip Torr, Alan Yuille, and Song Bai. Transmix: Attend to mix for vision transformers. In The IEEE Conference on Computer Vision and Pattern Recognition (CVPR), June 2022.
- [4] Pengguang Chen, Shu Liu, Hengshuang Zhao, and Jiaya Jia. Gridmask data augmentation, 2020.
- [5] François Chollet. Xception: Deep learning with depthwise separable convolutions. In Proceedings of the IEEE conference on computer vision and pattern recognition, pages 1251–1258, 2017.
- [6] Joseph Paul Cohen, Lan Dao, Karsten Roth, Paul Morrison, Yoshua Bengio, Almas F Abbasi, Beiyi Shen, Hoshmand Kochi Mahsa, Marzyeh Ghassemi, Haifang Li, et al. Predicting covid-19 pneumonia severity on chest x-ray with deep learning. Cureus, 12(7), 2020.
- [7] Joseph Paul Cohen, Paul Morrison, and Lan Dao. Covid-19 image data collection. arXiv preprint arXiv:2003.11597, 2020.
- [8] Davide Colombi, Flavio C Bodini, Marcello Petrini, Gabriele Maffi, Nicola Morelli, Gianluca Milanese, Mario Silva, Nicola Sverzellati, and Emanuele Michieletti. Well-aerated lung on admitting chest ct to predict adverse outcome in covid-19 pneumonia. Radiology, 2020.
- [9] Viacheslav Danilov, Alex Proutski, Alexander Kirpich, Diana Litmanovich, and Yuriy Gankin. Dataset for covid-19 segmentation and severity scoring, January 2022.
- [10] Aysen Degerli, Mete Ahishali, Serkan Kiranyaz, Muhammad E. H. Chowdhury, and Moncef Gabbouj. Reliable covid-19 detection using chest x-ray images. In 2021 IEEE International Conference on Image Processing (ICIP), pages 185–189, 2021.
- [11] Carole Dennie, Cameron Hague, Robert S Lim, Daria Manos, Brett F Memauri, Elsie T Nguyen, and Jana Taylor. Canadian society of thoracic radiology/canadian association of radiologists consensus statement regarding chest imaging in suspected and confirmed covid-19. Canadian Association of Radiologists Journal, 71(4):470–481, 2020.
- [12] Terrance DeVries and Graham W. Taylor. Improved regularization of convolutional neural networks with cutout, 2017.
- [13] F. Dornaika, SE. Bekhouche, and I. Arganda-Carreras. Robust regression with deep cnns for facial age estimation: An empirical study. Expert Systems with Applications, 141:112942, 2020.
- [14] Alexey Dosovitskiy, Lucas Beyer, Alexander Kolesnikov, Dirk Weissenborn, Xiaohua Zhai, Thomas Unterthiner, Mostafa Dehghani, Matthias Minderer, Georg Heigold, Sylvain Gelly, et al. An image is worth 16x16 words: Transformers for image recognition at scale. arXiv preprint arXiv:2010.11929, 2020.
- [15] Tongle Fan, Guanglei Wang, Yan Li, and Hongrui Wang. Ma-net: A multi-scale attention network for liver and tumor segmentation. IEEE Access, 8:179656–179665, 2020.
- [16] Maayan Frid-Adar, Rula Amer, Ophir Gozes, Jannette Nassar, and Hayit Greenspan. Covid-19 in cxr: From detection and severity scoring to patient disease monitoring. IEEE journal of biomedical and health informatics, 25(6):1892–1903, 2021.
- [17] Hester A Gietema, Noortje Zelis, J Martijn Nobel, Lars JG Lambriks, Lieke B Van Alphen, Astrid ML Oude Lashof, Joachim E Wildberger, Irene C Nelissen, and Patricia M Stassen. Ct in relation to rt-pcr in diagnosing covid-19 in the netherlands: A prospective study. PloS one, 15(7):e0235844, 2020.
- [18] Karim Hammoudi, Halim Benhabiles, Mahmoud Melkemi, Fadi Dornaika, Ignacio Arganda-Carreras, Dominique Collard, and Arnaud Scherpereel. Deep learning on chest x-ray images to detect and evaluate pneumonia cases at the era of covid-19. Journal of medical systems, 45(7):1–10, 2021.
- [19] Karim Hammoudi, Adnane Cabani, Bouthaina Slika, Halim Benhabiles, Fadi Dornaika, and Mahmoud Melkemi. Superpixelgridmasks data augmentation: Application to precision health and other real-world data. Journal of Healthcare Informatics Research, pages 1–19, 2023.
- [20] Kaiming He, Xiangyu Zhang, Shaoqing Ren, and Jian Sun. Deep residual learning for image recognition. In Proceedings of the IEEE conference on computer vision and pattern recognition, pages 770–778, 2016.
- [21] Andrew Howard, Mark Sandler, Grace Chu, Liang-Chieh Chen, Bo Chen, Mingxing Tan, Weijun Wang, Yukun Zhu, Ruoming Pang, Vijay Vasudevan, Quoc V. Le, and Hartwig Adam. Searching for mobilenetv3, 2019.
- [22] Chaolin Huang, Yeming Wang, Xingwang Li, Lili Ren, Jianping Zhao, Yi Hu, Li Zhang, Guohui Fan, Jiuyang Xu, Xiaoying Gu, et al. Clinical features of patients infected with 2019 novel coronavirus in wuhan, china. The lancet, 395(10223):497–506, 2020.
- [23] Emrah Irmak. Covid-19 disease severity assessment using cnn model. IET image processing, 15(8):1814–1824, 2021.
- [24] Md Islam, Tahmina Nasrin Poly, Belal Alsinglawi, Ming Chin Lin, Min-Huei Hsu, Yu-Chuan Jack Li, et al. A state-of-the-art survey on artificial intelligence to fight covid-19. Journal of clinical medicine, 10(9):1961, 2021.
- [25] Adam Jacobi, Michael Chung, Adam Bernheim, and Corey Eber. Portable chest x-ray in coronavirus disease-19 (covid-19): A pictorial review. Clinical imaging, 64:35–42, 2020.
- [26] Wei jie Guan, Zheng yi Ni, Yu Hu, Wen hua Liang, Chun quan Ou, Jian xing He, Lei Liu, Hong Shan, Chun liang Lei, and David SC Hui. Clinical characteristics of coronavirus disease 2019 in china. New England journal of medicine, 382(18):1708–1720, 2020.
- [27] Jang-Hyun Kim, Wonho Choo, and Hyun Oh Song. Puzzle mix: Exploiting saliency and local statistics for optimal mixup, 2020.
- [28] Weifang Kong and Prachi P Agarwal. Chest imaging appearance of covid-19 infection. Radiology: Cardiothoracic Imaging, 2(1), 2020.
- [29] Young Joon Kwon, Danielle Toussie, Mark Finkelstein, Mario A Cedillo, Samuel Z Maron, Sayan Manna, Nicholas Voutsinas, Corey Eber, Adam Jacobi, Adam Bernheim, et al. Combining initial radiographs and clinical variables improves deep learning prognostication in patients with covid-19 from the emergency department. Radiology: Artificial Intelligence, 3(2):e200098, 2020.
- [30] Siddique Latif, Muhammad Usman, Sanaullah Manzoor, Waleed Iqbal, Junaid Qadir, Gareth Tyson, Ignacio Castro, Adeel Razi, Maged N Kamel Boulos, Adrian Weller, et al. Leveraging data science to combat covid-19: A comprehensive review. IEEE Transactions on Artificial Intelligence, 1(1):85–103, 2020.
- [31] Hanchao Li, Pengfei Xiong, Jie An, and Lingxue Wang. Pyramid attention network for semantic segmentation, 2018.
- [32] Jun Li, Junyu Chen, Yucheng Tang, Ce Wang, Bennett A. Landman, and S. Kevin Zhou. Transforming medical imaging with transformers? a comparative review of key properties, current progresses, and future perspectives. Medical Image Analysis, 85:102762, 2023.
- [33] Matthew D Li, Nishanth T Arun, Mehak Aggarwal, Sharut Gupta, Praveer Singh, Brent P Little, Dexter P Mendoza, Gustavo CA Corradi, Marcelo S Takahashi, Suely F Ferraciolli, et al. Multi-population generalizability of a deep learning-based chest radiograph severity score for covid-19. Medicine, 101(29), 2022.
- [34] Matthew D Li, Nishanth T Arun, Mishka Gidwani, Ken Chang, Francis Deng, Brent P Little, Dexter P Mendoza, Min Lang, Susanna I Lee, Aileen O’Shea, et al. Automated assessment and tracking of covid-19 pulmonary disease severity on chest radiographs using convolutional siamese neural networks. Radiology: Artificial Intelligence, 2(4):e200079, 2020.
- [35] Wenhua Liang, Hengrui Liang, Limin Ou, Binfeng Chen, Ailan Chen, Caichen Li, Yimin Li, Weijie Guan, Ling Sang, Jiatao Lu, et al. Development and validation of a clinical risk score to predict the occurrence of critical illness in hospitalized patients with covid-19. JAMA internal medicine, 180(8):1081–1089, 2020.
- [36] Wenhua Liang, Jianhua Yao, Ailan Chen, Qingquan Lv, Mark Zanin, Jun Liu, SookSan Wong, Yimin Li, Jiatao Lu, Hengrui Liang, et al. Early triage of critically ill covid-19 patients using deep learning. Nature communications, 11(1):1–7, 2020.
- [37] Pei Liu, Bo Fu, Simon X. Yang, Ling Deng, Xiaorong Zhong, and Hong Zheng. Optimizing survival analysis of xgboost for ties to predict disease progression of breast cancer. IEEE Transactions on Biomedical Engineering, 68(1):148–160, 2021.
- [38] Ze Liu, Yutong Lin, Yue Cao, Han Hu, Yixuan Wei, Zheng Zhang, Stephen Lin, and Baining Guo. Swin transformer: Hierarchical vision transformer using shifted windows. In Proceedings of the IEEE/CVF International Conference on Computer Vision, pages 10012–10022, 2021.
- [39] Awais Mansoor, Juan J. Cerrolaza, Geovanny Perez, Elijah Biggs, Kazunori Okada, Gustavo Nino, and Marius George Linguraru. A generic approach to lung field segmentation from chest radiographs using deep space and shape learning. IEEE Transactions on Biomedical Engineering, 67(4):1206–1220, 2020.
- [40] Bei Mao, Yang Liu, Yan-Hua Chai, Xiao-Yan Jin, Hai-Wen Lu, Jia-Wei Yang, Xi-Wen Gao, Xiao-Lian Song, Hong Bao, and An Wang. Assessing risk factors for sars-cov-2 infection in patients presenting with symptoms in shanghai, china: a multicentre, observational cohort study. The Lancet Digital Health, 2(6):e323–e330, 2020.
- [41] A Nair, JCL Rodrigues, S Hare, A Edey, A Devaraj, J Jacob, A Johnstone, R McStay, Erika Denton, and G Robinson. A british society of thoracic imaging statement: considerations in designing local imaging diagnostic algorithms for the covid-19 pandemic. Clinical Radiology, 75(5):329–334, 2020.
- [42] Ming-Yen Ng, Elaine YP Lee, Jin Yang, Fangfang Yang, Xia Li, Hongxia Wang, Macy Mei-sze Lui, Christine Shing-Yen Lo, Barry Leung, Pek-Lan Khong, et al. Imaging profile of the covid-19 infection: radiologic findings and literature review. Radiology: Cardiothoracic Imaging, 2(1), 2020.
- [43] Yujin Oh, Sangjoon Park, and Jong Chul Ye. Deep learning covid-19 features on cxr using limited training data sets. IEEE transactions on medical imaging, 39(8):2688–2700, 2020.
- [44] Marcello A Orsi, Giancarlo Oliva, Tahereh Toluian, Carlo Valenti Pittino, Marta Panzeri, and Michaela Cellina. Feasibility, reproducibility, and clinical validity of a quantitative chest x-ray assessment for covid-19. The American journal of tropical medicine and hygiene, 103(2):822, 2020.
- [45] Erik Ridley. AI can assess COVID-19 severity on chest x-rays, 2020.
- [46] Muhammad Ridzuan, Ameera Ali Bawazir, Ivo Gollini Navarette, Ibrahim Almakky, and Mohammad Yaqub. Challenges in covid-19 chest x-ray classification: Problematic data or ineffective approaches? arXiv preprint arXiv:2201.06052, 2022.
- [47] Olaf Ronneberger, Philipp Fischer, and Thomas Brox. U-net: Convolutional networks for biomedical image segmentation. In International Conference on Medical image computing and computer-assisted intervention, pages 234–241. Springer, 2015.
- [48] Geoffrey D Rubin, Christopher J Ryerson, Linda B Haramati, Nicola Sverzellati, Jeffrey P Kanne, Suhail Raoof, Neil W Schluger, Annalisa Volpi, Jae-Joon Yim, Ian BK Martin, et al. The role of chest imaging in patient management during the covid-19 pandemic: a multinational consensus statement from the fleischner society. Radiology, 296(1):172–180, 2020.
- [49] Mattia Savardi, Alberto Signoroni, Sergio Benini, Nicola Adami, and Davide Farina. Brixia score covid-19 dataset, May 2021.
- [50] Feng Shi, Jun Wang, Jun Shi, Ziyan Wu, Qian Wang, Zhenyu Tang, Kelei He, Yinghuan Shi, and Dinggang Shen. Review of artificial intelligence techniques in imaging data acquisition, segmentation, and diagnosis for covid-19. IEEE reviews in biomedical engineering, 14:4–15, 2020.
- [51] Alberto Signoroni, Mattia Savardi, Sergio Benini, Nicola Adami, Riccardo Leonardi, Paolo Gibellini, Filippo Vaccher, Marco Ravanelli, Andrea Borghesi, Roberto Maroldi, et al. Bs-net: Learning covid-19 pneumonia severity on a large chest x-ray dataset. Medical Image Analysis, 71:102046, 2021.
- [52] Christian Szegedy, Wei Liu, Yangqing Jia, Pierre Sermanet, Scott Reed, Dragomir Anguelov, Dumitru Erhan, Vincent Vanhoucke, and Andrew Rabinovich. Going deeper with convolutions. In Proceedings of the IEEE conference on computer vision and pattern recognition, pages 1–9, 2015.
- [53] Daniel Shu Wei Ting, Lawrence Carin, Victor Dzau, and Tien Y Wong. Digital technology and covid-19. Nature medicine, 26(4):459–461, 2020.
- [54] Danielle Toussie, Nicholas Voutsinas, Mark Finkelstein, Mario A. Cedillo, Sayan Manna, Samuel Z. Maron, Adam Jacobi, Michael Chung, Adam Bernheim, and Corey Eber. Clinical and chest radiography features determine patient outcomes in young and middle-aged adults with covid-19. Radiology, 297(1):E197, 2020. pmid:32407255.
- [55] Athanasios Voulodimos, Nikolaos Doulamis, Anastasios Doulamis, and Eftychios Protopapadakis. Deep learning for computer vision: A brief review. Computational intelligence and neuroscience, 2018, 2018.
- [56] Devesh Walawalkar, Zhiqiang Shen, Zechun Liu, and Marios Savvides. Attentive cutmix: An enhanced data augmentation approach for deep learning based image classification, 2020.
- [57] Linda Wang, Zhong Qiu Lin, and Alexander Wong. Covid-net: A tailored deep convolutional neural network design for detection of covid-19 cases from chest x-ray images. Scientific Reports, 10(1):1–12, 2020.
- [58] Martin J Willemink, Wojciech A Koszek, Cailin Hardell, Jie Wu, Dominik Fleischmann, Hugh Harvey, Les R Folio, Ronald M Summers, Daniel L Rubin, and Matthew P Lungren. Preparing medical imaging data for machine learning. Radiology, 295(1):4–15, 2020.
- [59] A Wong, ZQ Lin, L Wang, AG Chung, B Shen, A Abbasi, M Hoshmand-Kochi, and TQ Duong. Towards computer-aided severity assessment via deep neural networks for geographic and opacity extent scoring of sars-cov-2 chest x-rays. Scientific reports, 11(1):1–8, 2021.
- [60] Ho Yuen Frank Wong, Hiu Yin Sonia Lam, Ambrose Ho-Tung Fong, Siu Ting Leung, Thomas Wing-Yan Chin, Christine Shing Yen Lo, Macy Mei-Sze Lui, Jonan Chun Yin Lee, Keith Wan-Hang Chiu, Tom Wai-Hin Chung, et al. Frequency and distribution of chest radiographic findings in patients positive for covid-19. Radiology, 296(2):E72–E78, 2020.
- [61] World Health Organization. The true death toll of covid-19: Estimating global excess mortality. https://www.who.int/data/stories/the-true-death-toll-of-covid-19-estimating-global-excess-mortality, 2022.
- [62] Soon H. Yoon, Kyung H. Lee, Jin Y. Kim, Young K. Lee, Hongseok Ko, Ki H. Kim, Chang M. Park, and Yun-Hyeon Kim. Chest radiographic and ct findings of the 2019 novel coronavirus disease (covid-19): Analysis of nine patients treated in korea. Korean J Radiol, 21(4):494–500, 2020.
- [63] Sangdoo Yun, Dongyoon Han, Seong Joon Oh, Sanghyuk Chun, Junsuk Choe, and Youngjoon Yoo. Cutmix: Regularization strategy to train strong classifiers with localizable features. In Proceedings of the IEEE/CVF international conference on computer vision, pages 6023–6032, 2019.
- [64] Hongyi Zhang, Moustapha Cisse, Yann N. Dauphin, and David Lopez-Paz. Mixup: Beyond empirical risk minimization, 2017.
- [65] Yongbei Zhu, Shuo Wang, Siwen Wang, Qingxia Wu, Liusu Wang, Hongjun Li, Meiyun Wang, Meng Niu, Yunfei Zha, and Jie Tian. Mix contrast for covid-19 mild-to-critical prediction. IEEE Transactions on Biomedical Engineering, 68(12):3725–3736, 2021.