360BEV: Panoramic Semantic Mapping for Indoor Bird’s-Eye View
Abstract
Seeing only a tiny part of the whole is not knowing the full circumstance. Bird’s-eye-view (BEV) perception, a process of obtaining allocentric maps from egocentric views, is restricted when using a narrow Field of View (FoV) alone. In this work, mapping from 360° panoramas to BEV semantics, the 360BEV task, is established for the first time to achieve holistic representations of indoor scenes in a top-down view. Instead of relying on narrow-FoV image sequences, a panoramic image with depth information is sufficient to generate a holistic BEV semantic map. To benchmark 360BEV, we present two indoor datasets, 360BEV-Matterport and 360BEV-Stanford, both of which include egocentric panoramic images and semantic segmentation labels, as well as allocentric semantic maps. Besides delving deep into different mapping paradigms, we propose a dedicated solution for panoramic semantic mapping, namely 360Mapper. Through extensive experiments, our methods achieve and mIoU on both datasets respectively, surpassing previous counterparts with gains of and in mIoU.111The datasets and code are available at the project page 360BEV.
1 Introduction
Semantic scene understanding has achieved remarkable performance on indoor- and outdoor scenes via pixel-wise semantic segmentation [22]. It can be utilized directly on a wide range of downstream applications, such as autonomous driving [10, 13], navigation in robotics [4, 6] or in assistive technologies [38] to name a few. Recently, Bird’s-Eye-View (BEV) semantic perception [17] can be a solution for enabling a straightforward understanding of the environment and objects therein. While BEV semantic segmentation has gained traction in outdoor scenes for autonomous driving [17], BEV perception has not yet been extensively explored for indoor scenes, which are often characterized by complex and varied structures, objects, and challenging lighting conditions. For semantically mapping these indoor scenes, sequence-based methods [4, 6] were proposed, which have to process whole videos and entail a moving camera. As shown in Fig. 1, (1) these methods rely on computationally expensive processing of entire sequences of video-frames due to the narrow Field of View of the pinhole camera, and (2) they are constrained to explore indoor mapping on synthetic simulators [26, 33], due to the lack of real indoor datasets. These drawbacks limit their applicability to real-world indoor semantic mapping.
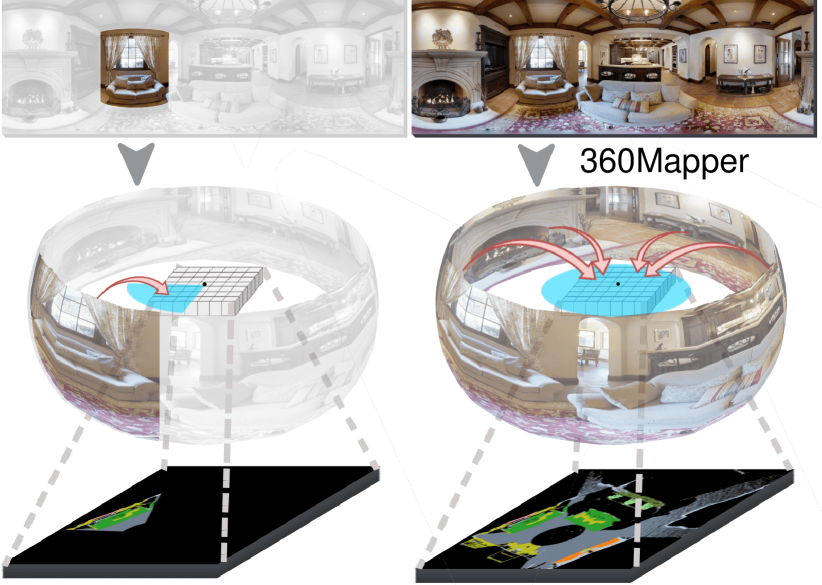
To solve these limitations, in this work, we introduce 360BEV to achieve panoramic semantic mapping for indoor BEV, which is illustrated in Fig. 1. Our considerations are twofold: (1) To unleash the potential of indoor semantic mapping in real-world scenarios, real indoor databases with BEV semantic labels are crucial; (2) To reduce the computational complexity of narrow-FoV sequence methods [4] ( video-frames to process) or the complexity of multi-camera setups [17] ( camera views needed), we leverage a single-frame 360° image with depth information and thus bypass multi-sensor calibration, synchronization, and data fusion procedures. With this in mind and to enable 360BEV segmentation we present two real indoor BEV datasets, which are extended from the Matterport3D [5] and Stanford2D3D [3] datasets. First, the Front-View images captured by pinhole cameras from Matterport3D are extended to 360° panoramas for benchmarking on 360FV-Matterport. Furthermore, for the first time, two BEV datasets, 360BEV-Matterport and 360BEV-Stanford are established to enable bird’s-eye view panoramic semantic mapping, i.e., predicting a complete BEV semantic map from a single-frame 360° image with depth. Moreover, by decoupling the computationally expensive processing of sequences or multiple views, our direct 360BEV semantic mapping is more streamlined for generating indoor semantic maps.
However, spatial distortions and object deformations in panoramic images [39] severely harm the performance of methods proposed for narrow-range image [12, 34] or multi-view perception [17]. Thus, to comprehensively investigate the established 360BEV task, we first revisit three possible projection paradigms, including: (1) Early projection, (2) Late projection, and (3) Intermediate projection. Based on our observation that intermediate features maintain dense information, we explore the intermediate projection paradigm and propose a dedicated solution for 360BEV mapping, which we call 360Mapper. The challenge in this scheme resides in the feature conversion. While the prior BEVFormer [17] relied on multi-view perception and SMNet [4] projects the extracted feature directly via the depth-based transformation index, which is not appropriate for panoramic imagery due to its distortions and deformations, we propose a new transformation method, the Inverse Radial Projection (IRP), to project features from 2D to 3D representations using only depth information. An additional benefit is that the depth information helps maintain object shape and space layout after being transferred to top-down views, rendering the 2D reference index for the feature map as well as the BEV representation more accurate and consistent. Besides, unlike the deformable attention [17, 45] using multi-scale layers and fusion from multi-view cameras, we adopt 360Attention with adaptive sampling offsets to extract information from omnidirectional feature maps, yielding the bird’s-eye-view feature with less distortion in an adaptive manner. These are combined with the 2D index obtained by IRP to include a deformation-aware mechanism in 360 scenes, which in turn serves to compensate for the adverse effects of distortion. With these designs, our 360Mapper model represents a step towards a more complete and accurate indoor semantic mapping, which has important implications for downstream applications such as indoor navigation and scene understanding.
Through extensive experiments, the new 360BEV task is thoroughly benchmarked with two real indoor BEV datasets, three projection paradigms, and more than ten methods, respectively. Compared to the semantic mapping counterparts, our 360Mapper models achieve state-of-the-art performance, with mean intersection-over-union (mIoU) gains of on the 360BEV-Matterport dataset and on the 360BEV-Stanford dataset.
To summarize, we present the following contributions:
-
•
A new 360BEV task is introduced for the first time to address indoor semantic mapping via a single-frame panoramic image, decoupling complex processing of multi-view or sequence inputs.
-
•
Two indoor BEV datasets, i.e., 360BEV-Matterport and 360BEV-Stanford, are extended with front-view panoramic images and BEV semantic labels, thoroughly benchmarking panoramic semantic mapping.
-
•
360Mapper model – addressing spatial distortions and object deformations in panoramas – is proposed as a dedicated solution for interior panoramic semantic mapping and achieves state-of-the-art performance.
2 Related Work
2.1 Panoramic Semantic Segmentation
Image semantic segmentation [31, 34, 36, 41] has achieved great progress. In contrast to narrow-FoV perception, panoramic semantic segmentation [7, 8, 9, 14, 29, 30, 37, 39], yielding holistic scene understanding by using a single 360° front-view image, has received increasing attention in recent years. Besides, 3D60 [46] and Pano3D [1] datasets are generated for depth estimation from 360° images, but lack semantic labels. In indoor panorama segmentation, there are some benchmarks that provide synthetic [16, 42] and real [3] panoramic images and labels for training. Matterport3D [5] has large-scale panoramic images collected from indoor buildings, yet, it has not been benchmarked due to the lack of corresponding panoramic semantic labels. To enable this, we generate the panoramic semantic segmentation labels by combining the original pinhole camera labels regarding their camera transformation matrices. Therefore, a 360° Front-View (FV) dataset, 360FV-Matterport, with large-scale real indoor scenes, is provided to facilitate panoramic semantic segmentation. Besides, the 360FV-Matterport dataset is required to perform the late-projection paradigm of BEV semantic mapping.
2.2 BEV Semantic Mapping
Apart from front-view image semantic segmentation, some previous work explored top-view semantic segmentation, known as semantic mapping [6, 22] in indoor scenes and bird’s-eye-view semantic segmentation [17, 24] in outdoor driving scenes. The indoor semantic mapping methods can be divided into three categories according to the level of projection from the front view to the top-down view: Early-projection approaches [20, 28] are performed via general semantic segmentation methods, which first construct the BEV views from perspective images and then apply segmentation. Unfortunately, these pipelines lose fine-grained visual cues during the projection and thus result in unsatisfactory performance for small object segmentation. Intermediate-projection methods [4, 6] directly take front views as input for holistic indoor scene understanding, however, they work on synthetic data generated from Gibson [33] or Habitat [26] simulators and rely on time-consuming image sequences. For example, SMNet [4] gradually captures an average of view-points for each floor to generate a semantic map for indoor scenes. Instead, we explore achieving efficient allocentric scene understanding via a single panorama image. The Late-projection pipeline [2, 11, 21, 25, 27] performs egocentric semantic segmentation and project labels to top-down views, which are sensitive to depth map and agent pose information, inevitably facing the projection error and under-fitting of model training, thus remaining a suboptimal solution. There are some BEV-related methods that leverage multiple perspective view sensors or LiDAR sensors and focus on outdoor object detection [17, 18, 35], optical flow estimation [15, 19], and semantic segmentation [23, 44]. Different from previous methods, our 360Mapper is carefully designed for learning indoor holistic representations by forwarding a single panorama without using multi-view images, image sequences, or point clouds.
3 Panorama Semantic Mapping (360BEV)
To investigate the 360BEV task, we analyze potential panoramic projection paradigms in Sec. 3.1. The generation and data statistics of the dataset are detailed in Sec. 3.2. To tackle the challenging panoramic semantic mapping, in Sec. 3.3 we present our solution 360Mapper with the Inverse Radial Projection method and 360Attention module, which enable distortion-aware feature processing.
3.1 360 Projection Paradigms
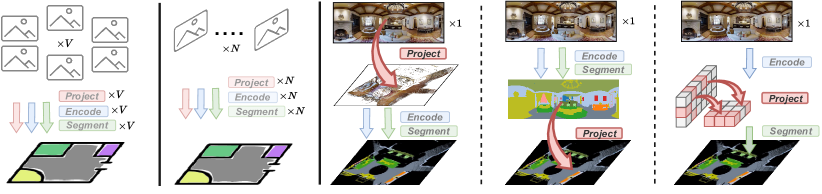
As shown in Fig. 2, unlike multi-view methods relying on more than six views ( in Fig. 2) and sequence-based methods using more than narrow views ( in Fig. 2), panoramic semantic mapping uses a single image with depth. We investigate three projection paradigms, i.e., how to process data from front-view panoramas to bird’s-eye-view semantics, which are:
-
(1)
Early projection: Proj.Enc.Seg. in Fig. 2.
-
(2)
Late projection: Enc.Seg.Proj. in Fig. 2.
-
(3)
Intermediate projection: Enc.Proj.Seg. in Fig. 2.
Based on these properties, we mainly explore 360BEV with intermediate projections, in which we identify the following challenges: In the feature extraction stage, spatial distortions and object deformations severely hinder the encoder from extracting representative features from the front-view panoramic image. For the intermediate feature projection, only depth information is utilized for consistent view transformation of high-dimensional features. In addition, many large objects in the front view (e.g., walls) are projected to thin objects in the top-down view, which greatly impedes capturing wide-range features during projection.
3.2 360FV and 360BEV Data Generation
360FV-Matterport. The original Matterport3D [5] was collected via narrow-FoV cameras. As shown in Fig. 3, we convert the narrow-view images and annotations into the 360° format by using rotation-translation matrices.
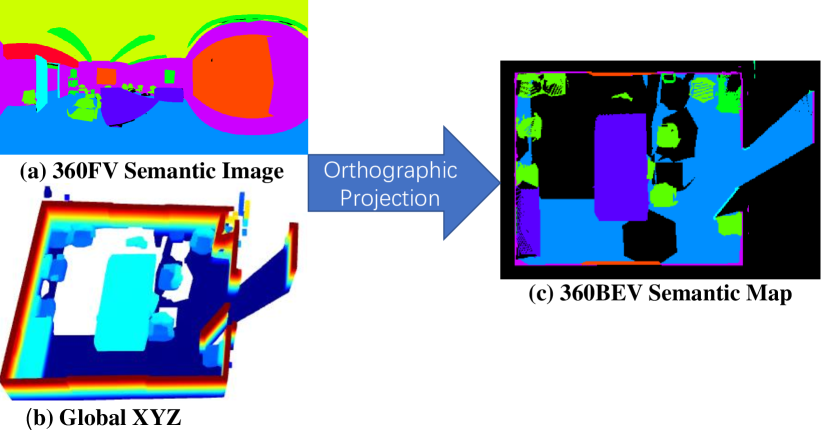
360BEV-Stanford. The Stanford2D3D dataset [3] has front-view panoramic images and semantic labels. However, it lacks BEV semantic labels. As presented in Fig. 4, we utilize the spatial semantic information from the global XYZ image to generate the corresponding BEV semantic map. By applying orthographic projection, we generate the BEV semantic maps within a visible range as BEV ground truth, enabling end-to-end training from font-view images to top-down semantics.
360BEV-Matterport. Inspired by the global XYZ modality [3], we generate a global XYZ for each panoramic image by using the provided depth ground truth. In order to generate BEV semantic ground truth corresponding to the panoramic view, several key steps must be considered. Firstly, a panoramic image can be processed as a sphere with rays shooting from the center of the sphere, where the camera is located.
| (1) | ||||
Here, and are angle matrices of panoramic images with size , which consist of two dimensional Euler angular equivariant series. Given the representation in spherical coordinate systems, each 3D point in the camera coordinate system will be obtained through the calculation in Eq. (2),
| (2) | ||||
where is the panoramic depth information. After obtaining 3D points, the orthographic projection matrix is applied to transform 3D coordinates to 2D panoramic BEV indices , which is presented in Eq. (3), where is the transformation matrix.
| (3) | |||
| Dataset | #Scene | #Room | #Frame | #Category |
|---|---|---|---|---|
| train | 5 | 215 | 1,040 | 13 |
| val | 1 | 55 | 373 | 13 |
| 360BEV-Stanford | 6 | 270 | 1,413 | 13 |
| train | 61 | – | 7,829 | 20 |
| val | 7 | – | 772 | 20 |
| test | 18 | – | 2,014 | 20 |
| 360BEV-Matterport | 86 | 2,030 | 10,615 | 20 |
Dataset statistics. As a result, two BEV datasets for panoramic semantic mapping are obtained. The detailed data statistics of 360BEV-Stanford and 360BEV-Matterport datasets are shown in Table 1. While the 360BEV-Stanford dataset has classes and images, the 360BEV-Matterport dataset includes classes and samples. In the Matterport3D dataset [5], there are object categories in the dense annotation. However, many of them are relatively rare in the original dataset, e.g., TV and beam (), which are excluded. Thus, 360BEV-Matterport maintains the most common object categories and merges some uncommon classes. Besides, we further present the per-class pixel number and per-class frequency in Fig. 5. It is worth noting that the class has a much higher frequency on both datasets. This category is important for tasks that rely on complete maps, such as indoor navigation and is therefore also retained.
3.3 Proposed Model: 360Mapper
Overall Architecture. As shown in Fig. 6, our end-to-end 360Mapper framework includes four steps: (1) The transformer-based backbone extracts features from the panoramic image. (2) The Inverse Radial Projection (IRP) module obtains a 2D index by projecting reference points generated by depth. (3) The 360Attention module enhances the front-view feature by 2D index and generates offsets from BEV queries to eliminate the effects of distortion. (4) The lightweight decoder parses the projected feature map and predicts the semantic BEV map.
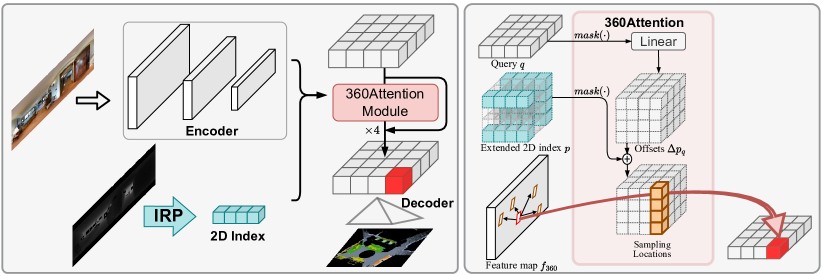
Inverse Radial Projection. Next, we propose a flexible projection method, the Inverse Radial Projection (IRP), for which the input of panoramic depth is included. We can easily obtain a top-view mask map by projecting from depth information. This mask map is then used to generate 3D reference points with the corresponding map height. 3D reference points are projected onto the sphere to generate 2D reference indexes, as shown in Eq. (4), where and represent the index values of the 2D reference for the height and width of the feature map, respectively. The 2D reference indexes are then used to locate the corresponding feature points on the encoded front-view feature map.
| (4) | ||||
Due to the distortions in the stitching process of the panorama, it is hard to project the 3D reference points exactly onto the 2D front-view plane by rotation and translation. Thus, we use the depth map to generate a map mask that better describes the shape of the map, so that the accurate projection with the mask not only makes the amount of data entering the 360Attention much smaller, which is conducive to the fast convergence of the model but also facilitates the use of sampling offsets for 360Attention.
360Attention. In Fig. 6, the proposed 360Attention generates sampling offsets through the linear layer in an adaptive manner. Given the BEV query as input, where is the length of query, a operation is applied on and to mask out irrelevant points and 2D indexes according to the mask map from IRP, which is crucial to keep and efficient and reducing computation of 360Attention (). The sampling offset and attention weight are predicted through BEV query by linear layers respectively. The adaptive sampling offsets are then added to the extended 2D index to obtain distortion-aware sampling locations. The 360Attention module can be denoted as:
| (5) | ||||
where , , and indicate the query, the extended 2D index, and panoramic feature map, respectively. The linear layer is specific to each attention head , where is the feature dimension and is the number of heads. The attention weight represents the importance of the sampled points , where . The panoramic features and the adaptive sampling locations are aggregated using attention weights to produce a BEV output. Afterwards, the mask map is applied to assemble the BEV output as . After being added with a residual term of , the BEV result from is forwarded to the next 360Attention module.
Compared to the Spatial Cross-Attention module in BEVFormer [17], the difference lies in (1) Instead of relying on multi-view features across multiple cameras, our 360Attention module is designed to directly adopt adaptive sampling offsets to extract features from a single panoramic feature map. (2) Our module gets rid of the projection of 3D reference points to different image views using the projection matrix, thus compensating for the lack of front-view perception. (3) The mask operation is applied to maintain the BEV query efficient and adaptive to front-view panoramic features by using depth information as a bridge. Through these non-trivial designs, the BEV feature map generated by 360Attention is able to effectively neutralize the effects of front-view distortion.
4 Experiments
4.1 Implementation Details
We train 360Mapper models with 4 A100 GPUs with an initial learning rate of , scheduled by the step strategy over epochs. AdamW is the optimizer with epsilon , weight decay is and batch size is on each GPU. The panoramic image size of 360FV-Matterport and Stanford2D3D [3] are both . The resolution of panoramic images on both 360BEV-Stanford and 360BEV-Matterport datasets are as input for 360Mapper training, while the output BEV maps are set to , which correspond to a perception range of . Following [4, 6], evaluation metrics are pixel-wise accuracy (Acc), pixel recall (mRecall), precision (mPrecision), and mean Intersection-over-Union (mIoU).
4.2 Panorama Semantic Segmentation (360FV)
Results on Stanford2D3D. To verify the capacity to handle object deformations and image distortions, we first evaluate our method on front-view panoramic semantic segmentation. The results on the Stanford2D3D dataset are presented in Table 2. All results are averaged over cross-validation folds. Thanks to the proposed 360Attention module, our 360Mapper model is better capable of handling deformations in panoramas, yielding in mIoU, with performance gains as compared to the previous state-of-the-art Trans4PASS [39] and CBFC [43]. The promising result in front-view panoramas has initially revealed the potential of our model in extracting 360° front-view features, which is crucial for the BEV semantic mapping task as well.
Results on 360FV-Matterport. For the first time, a large-scale 360FV-Matterport is brought to the community of front-view panoramic semantic segmentation. In Table 3, four state-of-the-art methods are selected and reproduced. Compared to the Trans4PASS [39] and Trans4PASS+ [40] models, our model has respective and improvements. Furthermore, our model surpasses RGB-D HoHoNet [29] and SegFormer [34] with and mIoU gains. The results indicate that our model can consistently achieve state-of-the-art performance on large-scale datasets for panoramic semantic segmentation.
4.3 Panorama Semantic Mapping (360BEV)
To thoroughly investigate the 360BEV task, we consistently analyze the early-, late-, and intermediate projections, as well as compare their state-of-the-art methods in both 360BEV benchmarks.
Results on 360BEV-Stanford. In Table 4, to study the Early projection mode, SegFormer [34] and SegNeXt [12] with different backbones, are selected, which merely reach unsatisfactory results. The results indicate that the pre-projected RGB maintains less rich spatial and visual information of front-view images. Using Late projection, SegFormer with the same MiT-B2 backbone achieves mIoU and surpasses the one using Early projection, still yielding sub-optimal semantic mapping results. Interestingly, all methods using Intermediate projection obtain more than mIoU. While using the same MiT-B2 backbone, our proposed 360Mapper achieves with gains compared to the baseline Trans4Map [6]. Further, our efficient model (MiT-B0) outperforms Trans4Map (MiT-B4) with mIoU gains. With a stronger CNN backbone MSCA-B from SegNeXt [12], our method reaches the best score with in mIoU, which indicates 360Mapper is flexible to both CNN- and Transformer-based backbones.
| Method | Backbone | Acc | mRecall | mPrecision | mIoU |
| (1) Early projection: Proj.Enc.Seg. | |||||
| SegFormer [34] | MiT-B2 | 71.69 | 20.82 | 26.34 | 14.15 |
| SegNeXt [12] | MSCA-B | 79.77 | 34.13 | 47.39 | 25.85 |
| (2) Late projection: Enc.Seg.Proj. | |||||
| HoHoNet [29] | ResNet101 | 70.01 | 31.62 | 30.46 | 18.49 |
| Trans4PASS [39] | MiT-B2 | 65.73 | 31.08 | 33.15 | 17.86 |
| Trans4PASS+ [40] | MiT-B2 | 66.11 | 38.06 | 34.14 | 20.44 |
| SegFormer [34] | MiT-B2 | 70.50 | 30.97 | 30.65 | 18.65 |
| (3) Intermediate projection: Enc.Proj.Seg. | |||||
| BEVFormer [17] | MiT-B2 | 85.50 | 40.22 | 51.71 | 31.69 |
| Trans4Map [6] | MiT-B0 | 86.41 | 40.45 | 57.47 | 32.26 |
| Trans4Map [6] | MiT-B2 | 86.53 | 45.28 | 62.61 | 36.08 |
| Trans4Map [6] | MiT-B4 | 86.99 | 46.18 | 58.19 | 36.69 |
| Ours | MiT-B0 | 92.07 | 50.14 | 65.37 | 42.42 (+10.16) |
| Ours | MiT-B2 | 92.80 | 53.56 | 67.72 | 45.78 (+09.70) |
| Ours | MSCA-B | 92.67 | 55.02 | 68.02 | 46.44 |
| Method | Backbone | Acc | mRecall | mPrecision | mIoU |
| (1) Early projection: Proj.Enc.Seg. | |||||
| SegFormer [34] | MiT-B2 | 68.12 | 41.33 | 45.25 | 29.22 |
| SegNeXt [12] | MSCA-B | 68.53 | 42.13 | 46.12 | 30.01 |
| (2) Late projection: Enc.Seg.Proj. | |||||
| HoHoNet [29] | ResNet101 | 62.84 | 38.99 | 44.22 | 26.21 |
| Trans4PASS [39] | MiT-B2 | 55.99 | 29.59 | 40.91 | 20.07 |
| Trans4PASS+ [40] | MiT-B2 | 57.89 | 32.75 | 40.93 | 21.58 |
| SegFormer [34] | MiT-B2 | 62.98 | 41.84 | 45.30 | 27.78 |
| (3) Intermediate projection: Enc.Proj.Seg. | |||||
| BEVFormer [17] | MiT-B2 | 72.99 | 43.61 | 51.70 | 32.51 |
| Trans4Map [6] | MiT-B0 | 70.19 | 44.31 | 50.39 | 31.92 |
| Trans4Map [6] | MiT-B2 | 73.28 | 51.60 | 53.02 | 36.72 |
| Trans4Map [6] | MiT-B4 | 73.51 | 50.78 | 56.67 | 38.04 |
| Ours | MiT-B0 | 75.44 | 48.80 | 56.01 | 36.98 (+5.06) |
| Ours | MiT-B2 | 78.80 | 59.54 | 59.97 | 44.32 (+7.60) |
| Ours | MSCA-B | 78.93 | 60.51 | 62.83 | 46.31 |
Results on 360BEV-Matterport. In Table 5, we further present the results on the 360BEV-Matterport dataset. SegFormer [34] and SegNeXt [12] adopt Early projection and show better performance than the Late projection ones. The reason for this is Late projection methods are constrained by their lower performance in front-view semantic segmentation, which affects the projected BEV semantic maps. In contrast, using Intermediate projection, our 360Mapper models based on two different model scales, i.e., MiT-B0 and MiT-B2, show overall promising performance with and in mIoU, respectively. Compared to the previous state-of-the-art Trans4Map [6] (MiT-B2), our approach with MiT-B2 has improvements by in accuracy, in mRecall, in mPrecision, and in mIoU. Surprisingly, our 360Mapper with MiT-B2 outperforms Trans4Map with MiT-B4 with in mIoU. Besides, to compare multi-view methods, we reproduce BEVFormer [17] by using a single panorama instead of six views of pinhole cameras. Our 360Mapper outperforms BEVFormer (MiT-B2) with mIoU. Furthermore, we verify the flexibility of 360Mapper by using a CNN-based MSCA-B backbone [12], which obtains the highest mIoU score with . All results are in line with our observation that Intermediate projection can preserve dense visual cues and long-range information from front-view panoramas, and deliver more valuable context for BEV semantic mapping, leading to this superiority of 360Mapper, as compared to the other paradigms.
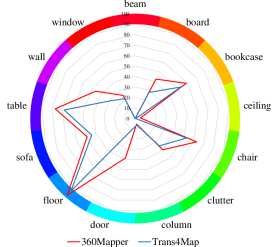
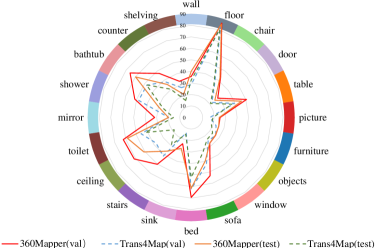
Per-class Results. To study the per-class performance on both 360BEV datasets, we present the comparison results in Fig. 7. For comparison, both the baseline Trans4Map and our 360Mapper model are based on the same backbone, i.e., MiT-B2. On the 360BEV-Stanford dataset (Fig. LABEL:subfig-1:class_iou_s2d3d), our 360Mapper model has significant gains on most of categories, such as board (), wall (), door (), etc. On the 360BEV-Matterport dataset (Fig. LABEL:subfig-2:class_iou_mp3d), it is readily apparent that our model can better recognize the chairs and tables, yielding IoU gains compared to Trans4Map [6]. On the test set of the 360BEV-Matterport dataset, our 360Mapper obtains IoU gains with and on the sink and toilet classes, as compared to Trans4Map. Overall, the consistent improvements on both datasets show the superiority of our 360Mapper on panoramic semantic mapping.
| Methods | Backbone | #Param | FLOPs | mIoU |
|---|---|---|---|---|
| Ours (360Attention offset) | MiT-B0 | 04.60M | 248.57G | 36.98 |
| Ours (360Attention offset) | MiT-B2 | 26.30M | 283.94G | 44.32 |
| Ours (360Attention offset) | MiT-B4 | 62.91M | 341.34G | 45.53 |
| Ours (Multi-scale offset) | MiT-B2 | 26.43M | 284.17G | 43.65 (-0.67) |
| Ours (Fixed-range offset) | MiT-B2 | 26.30M | 283.44G | 43.28 (-1.04) |
| Ours (Separate offset) | MiT-B2 | 26.19M | 279.18G | 42.82 (-1.50) |
| Ours (360Attention offset) | MSCA-B | 27.69M | 274.59G | 46.31 (+1.99) |
Analysis of 360Attention. To better understand 360Attention, we further conduct an analysis of the offset mechanisms in 360Attention and the backbone selection, in Table 6. First, in , we select three model scales, i.e., MiT-B0, MiT-B2, and MiT-B4, to verify the effect of model capacity in 360Attention. The three models obtain good performance, showing that 360Attention has positive effects in different model scales. Besides, different offset schemes are compared among , which are deformable, multi-scale, fixed-range, and separate offset. All of them have the same MiT-B2 backbone. Here, shows the superiority of deformable offset which has a better performance (). However, these comparable results prove that our 360Attention design is robust to offset mechanisms. Further, to analyze the effect of backbone selection, we choose transformer-based MiT-B2 [34] and CNN-based MSCA-B [12] as in . A stronger backbone [12] shows a further improvement of mIoU (), which shows the flexibility of our approach regarding the backbone variants.
| wall | floor | chair | door | table | pictu. | furni. | objec. | windo. | sofa |
| bed | sink | stairs | ceil. | toilet | mirror | show. | batht. | count. | shelv. |
|
 |
 |
 |
|---|---|---|---|
|
 |
 |
 |
|
 |
 |
 |
| Input | Baseline | 360Mapper | Ground Truth |
4.4 Qualitative Analysis
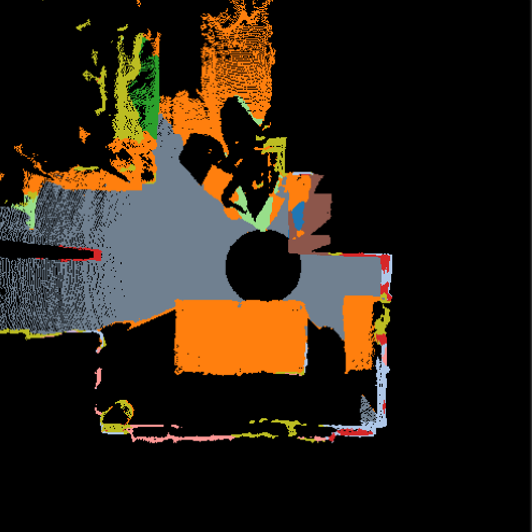
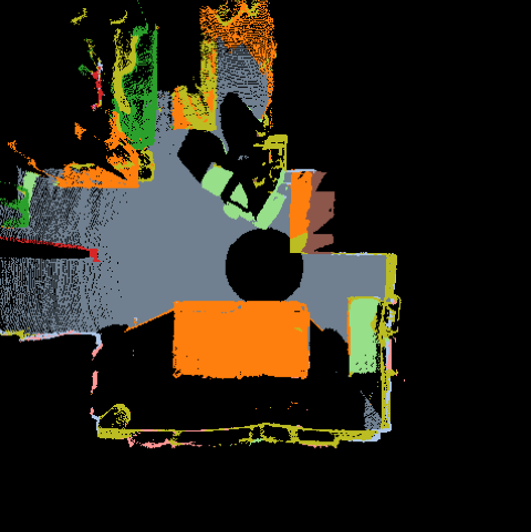
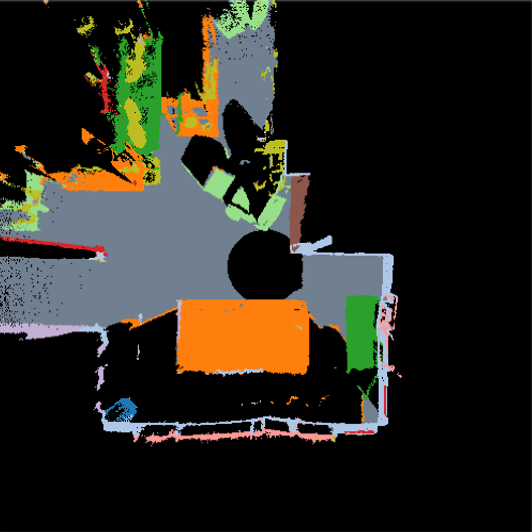
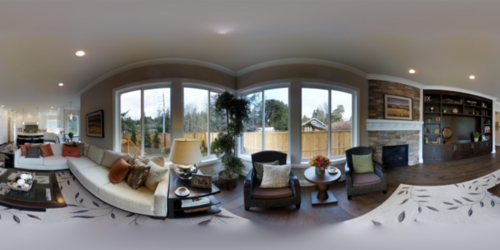
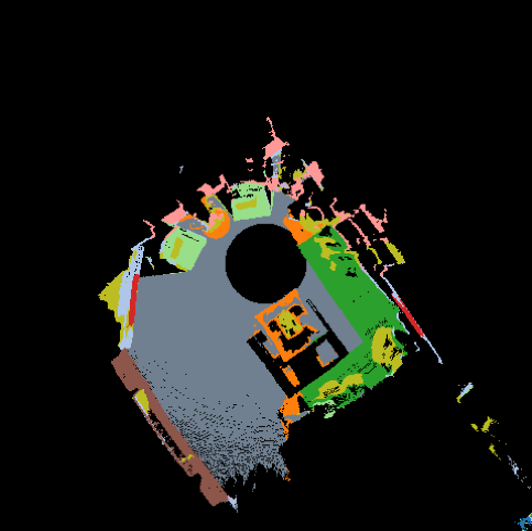
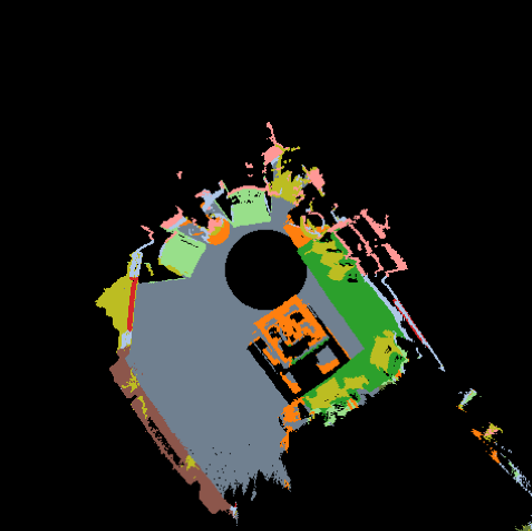
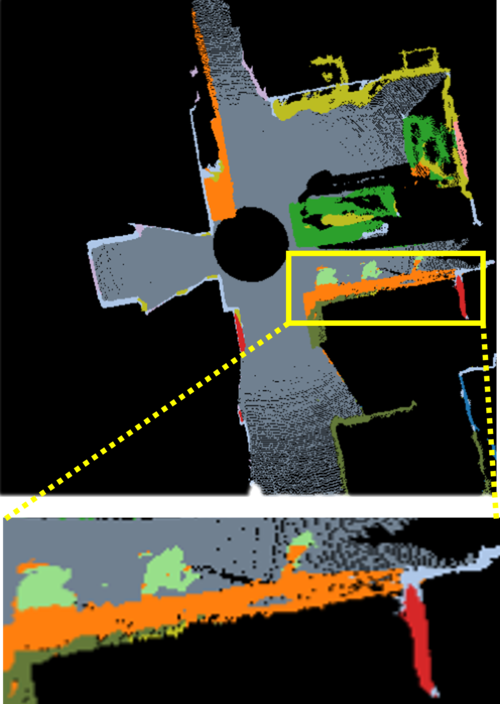
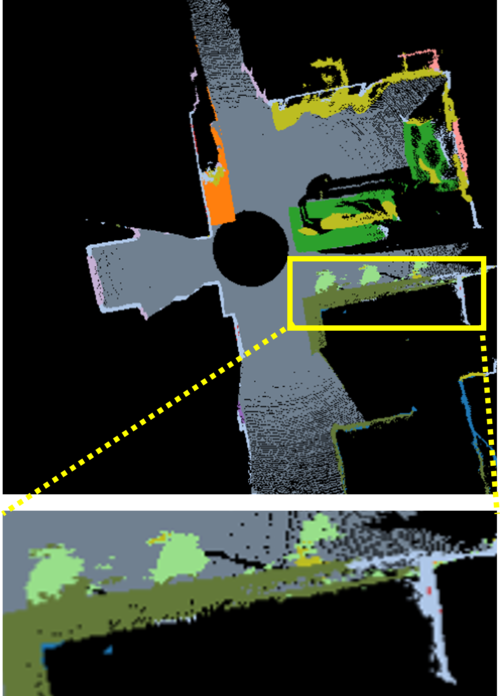
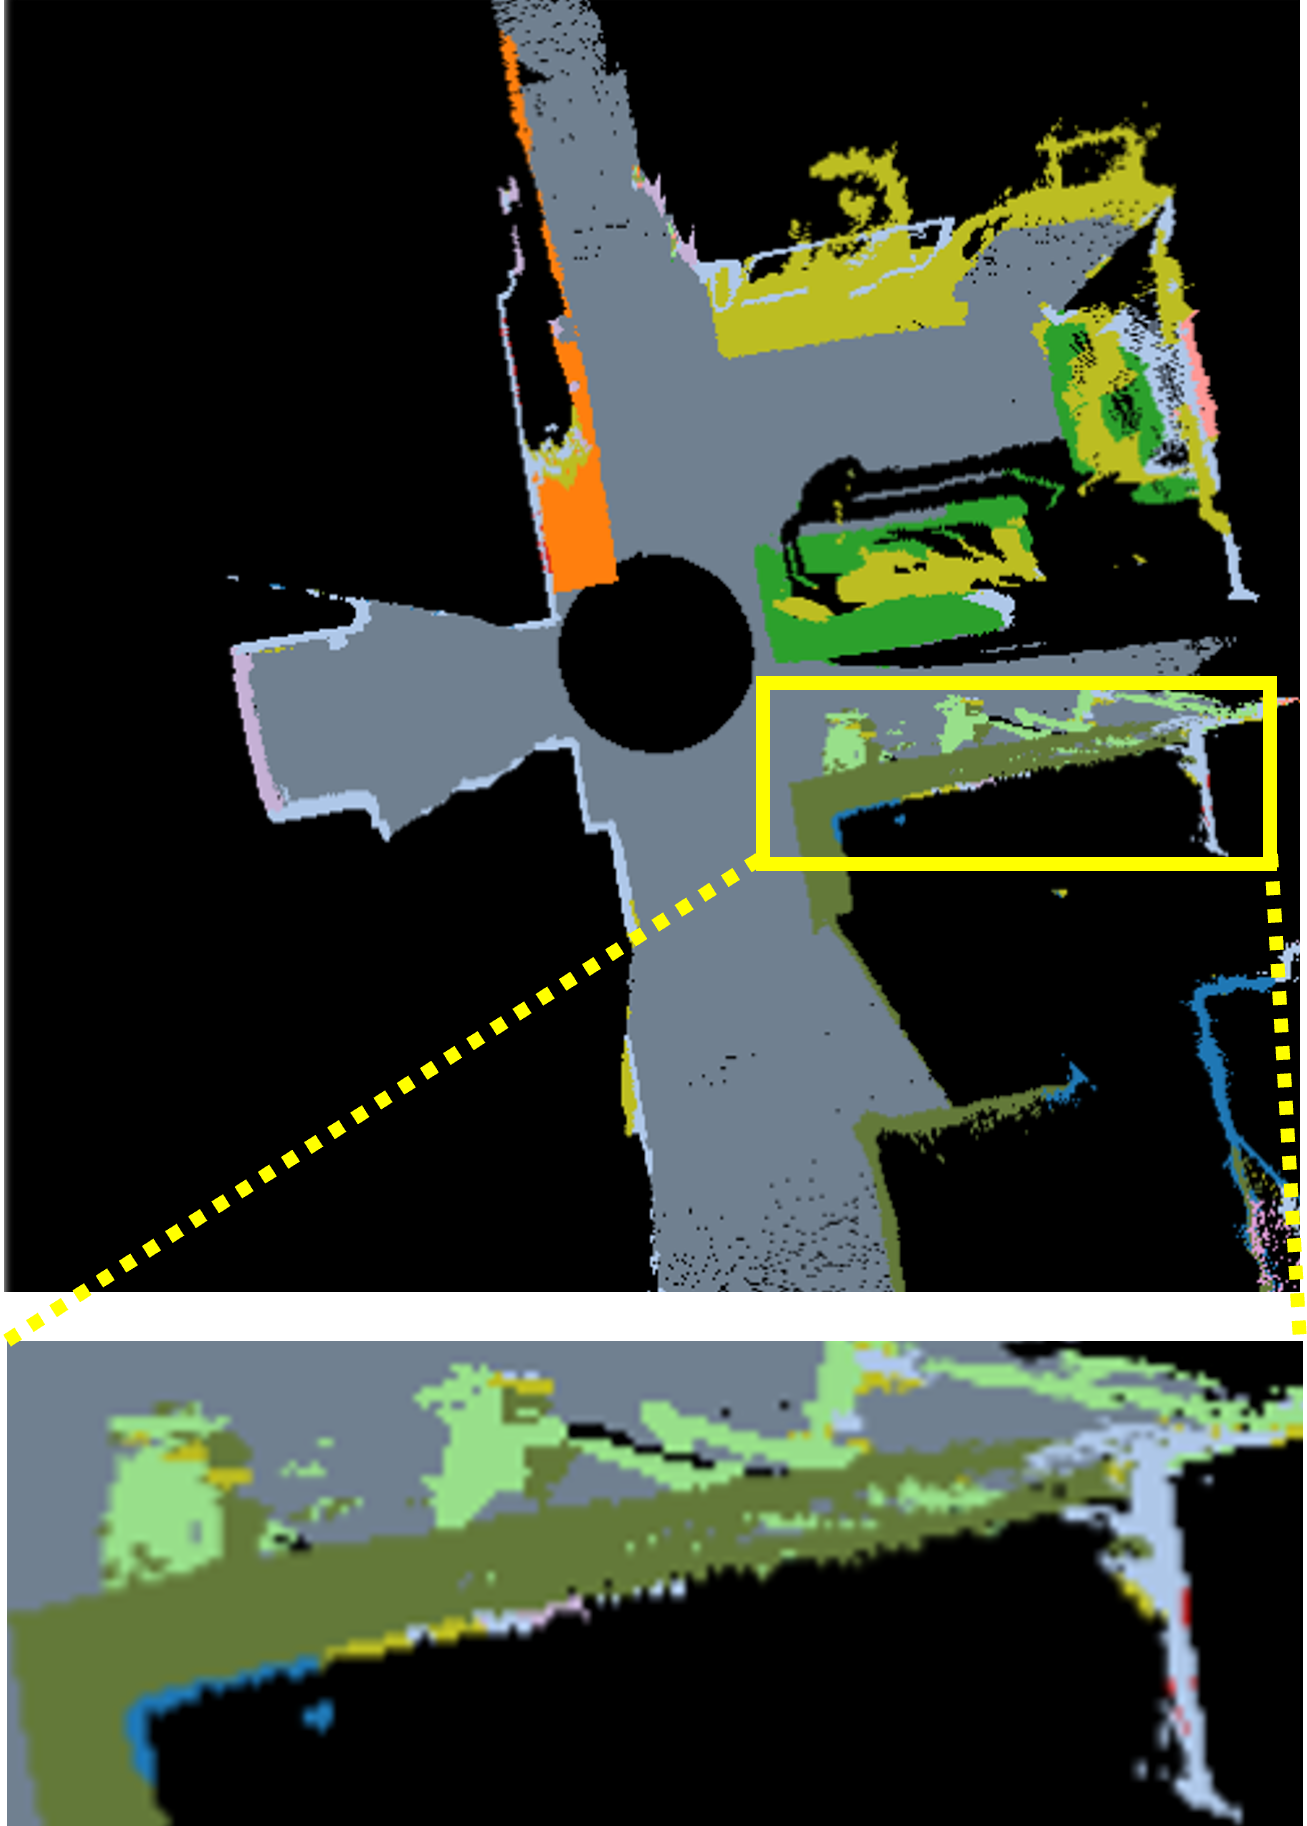
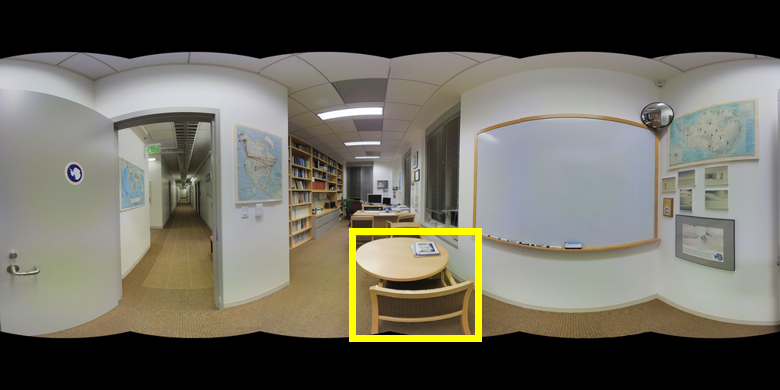
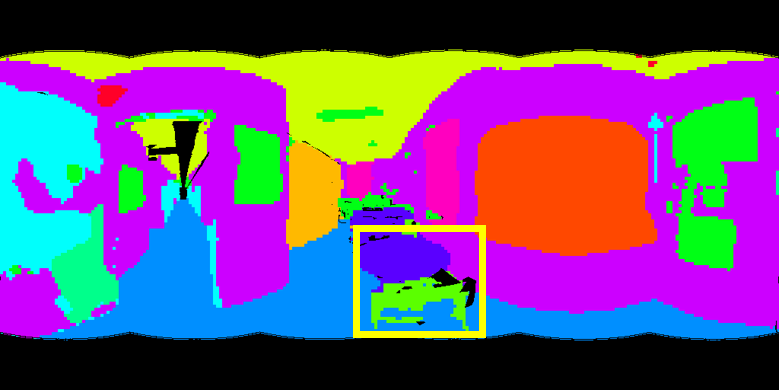
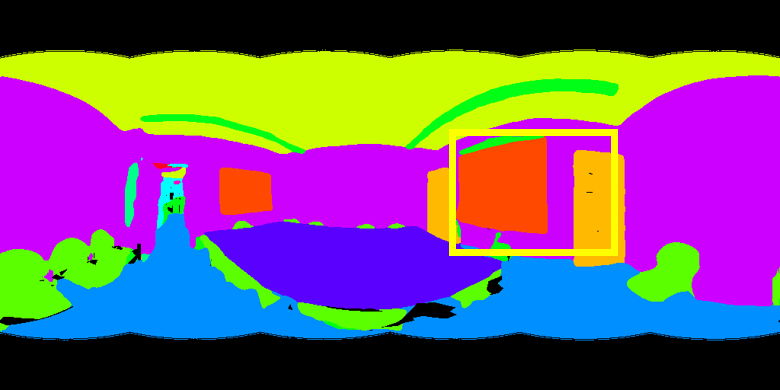
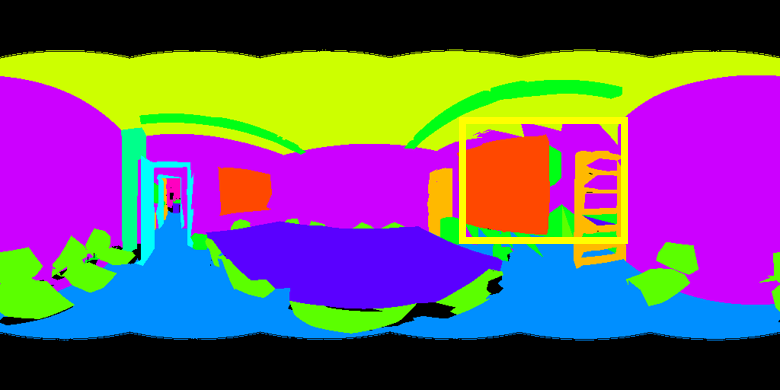
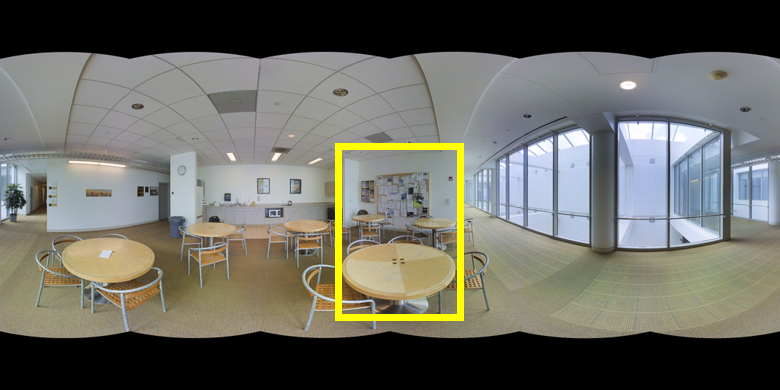
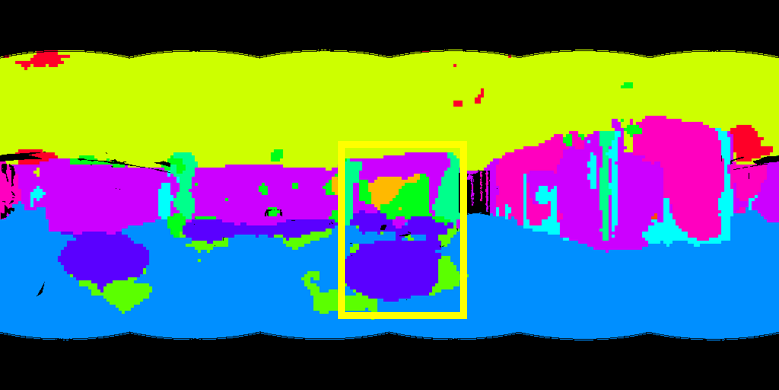
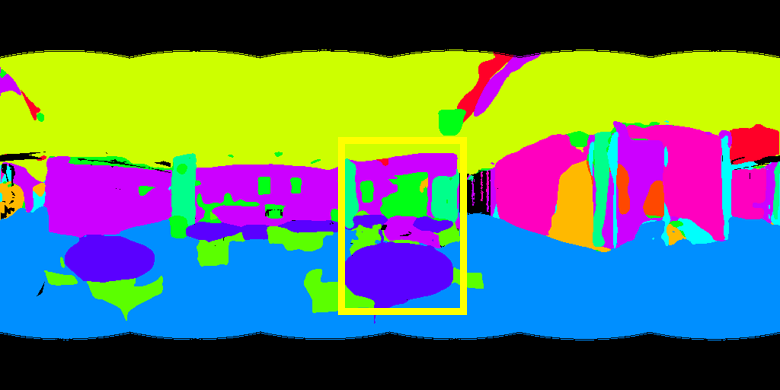
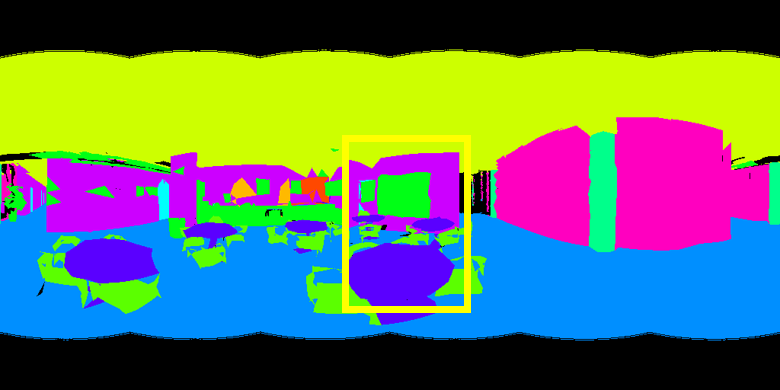
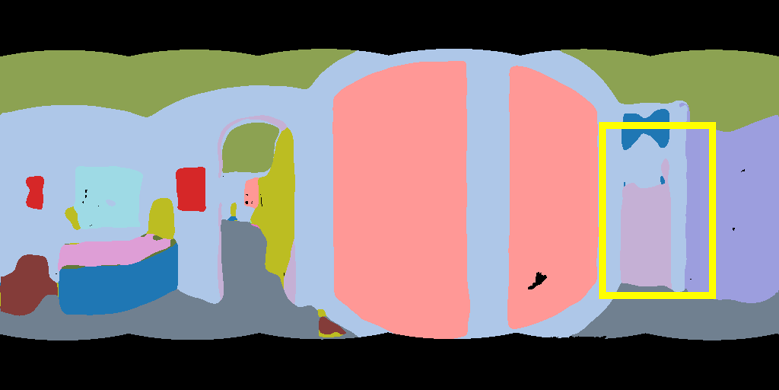
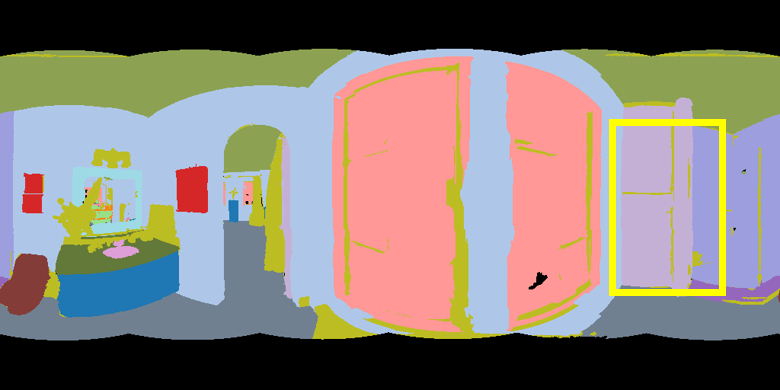
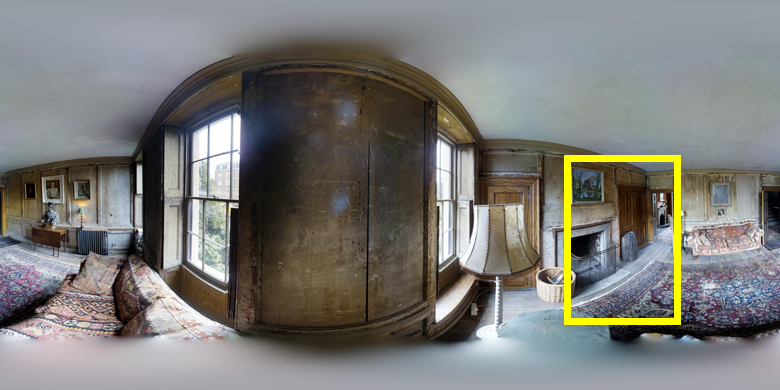
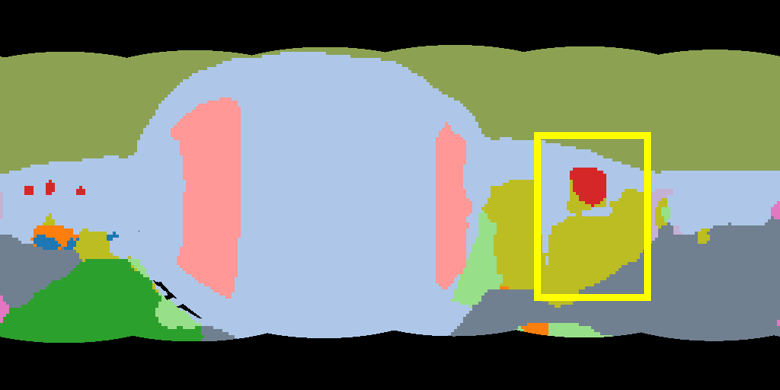
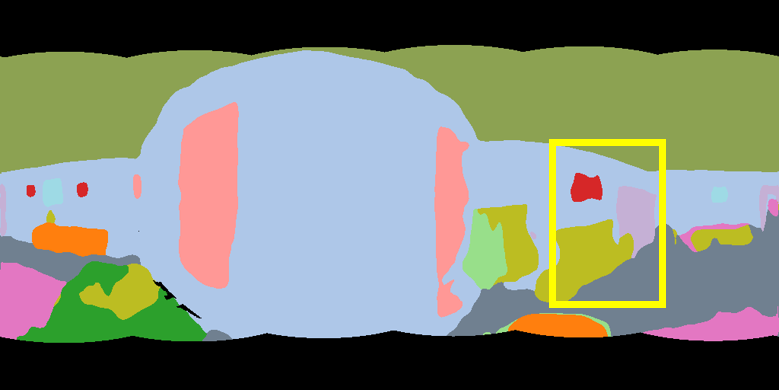
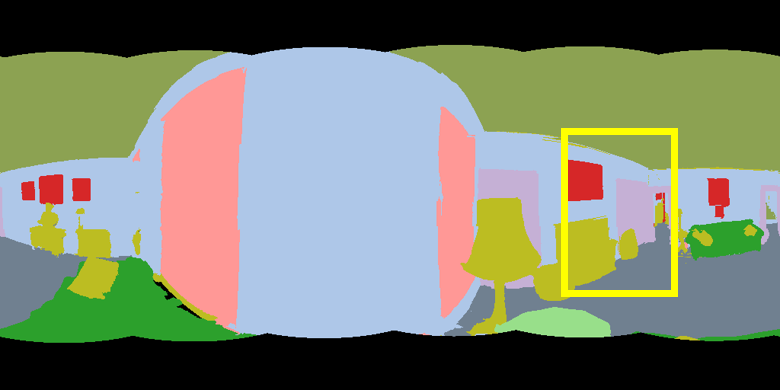
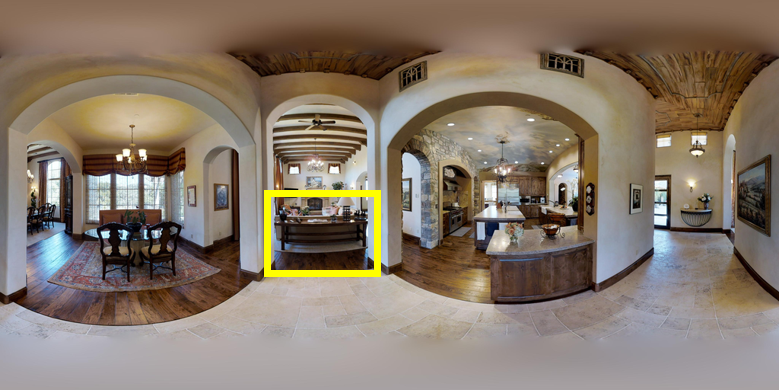
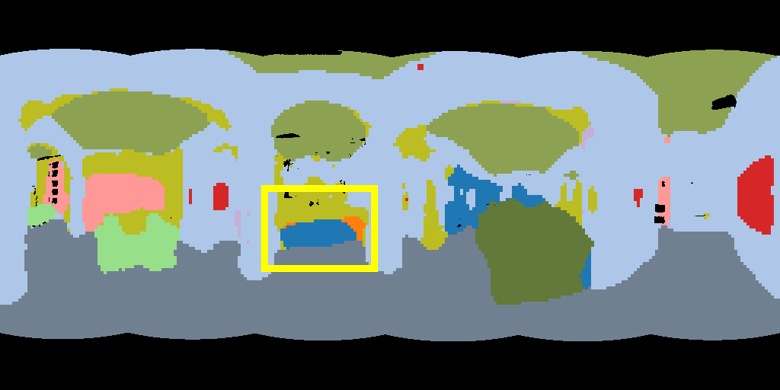
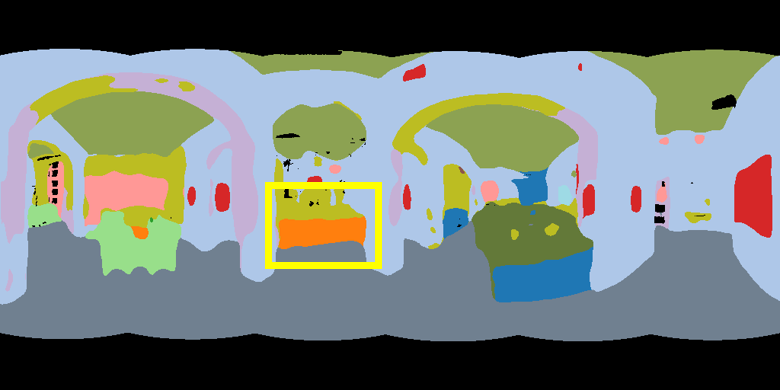
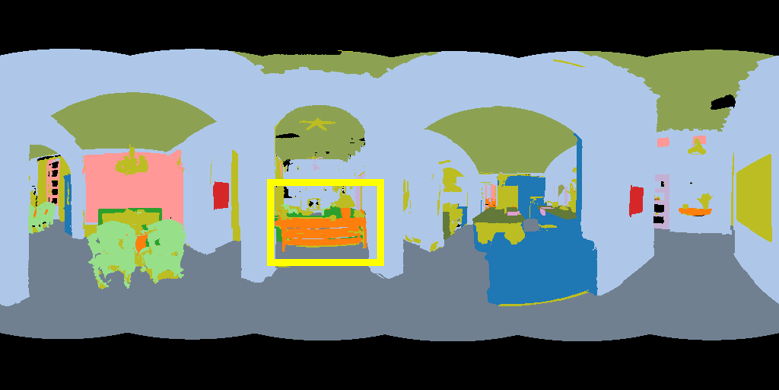
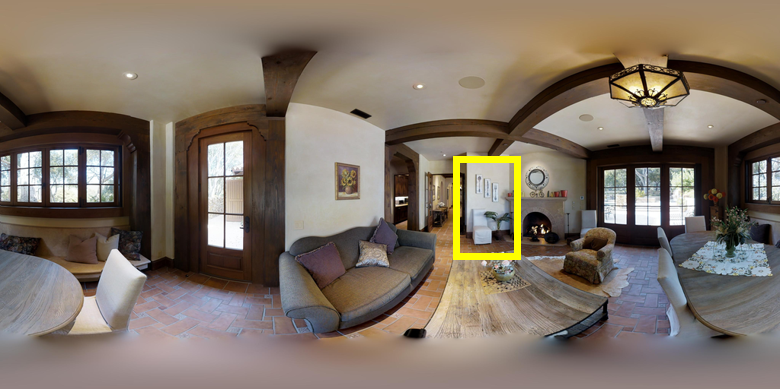
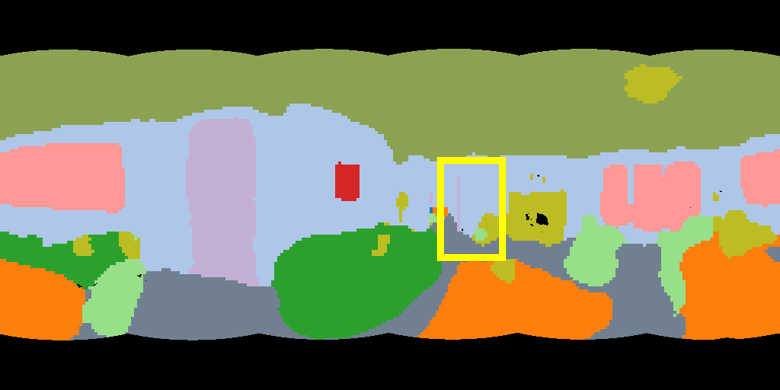
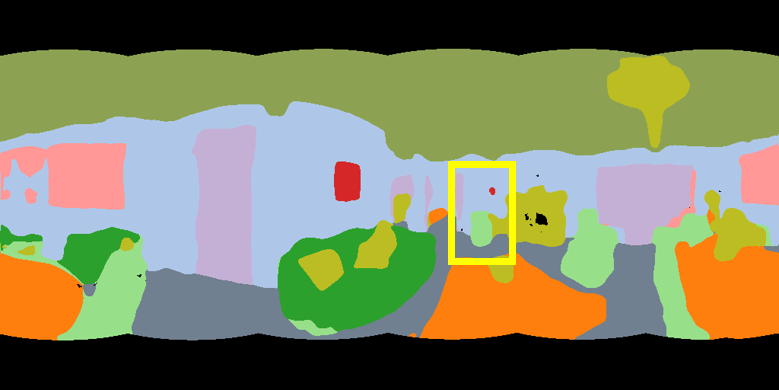
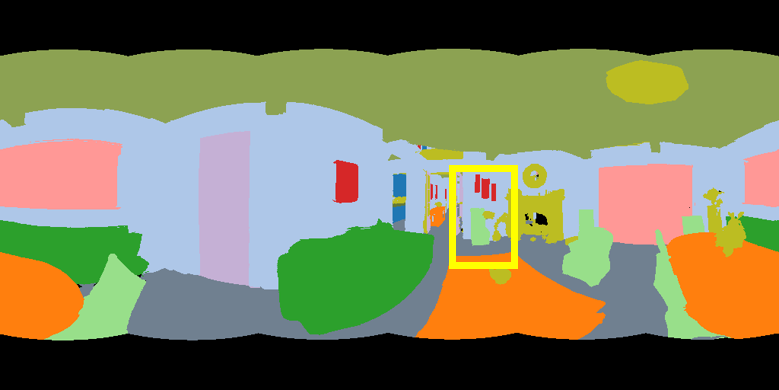
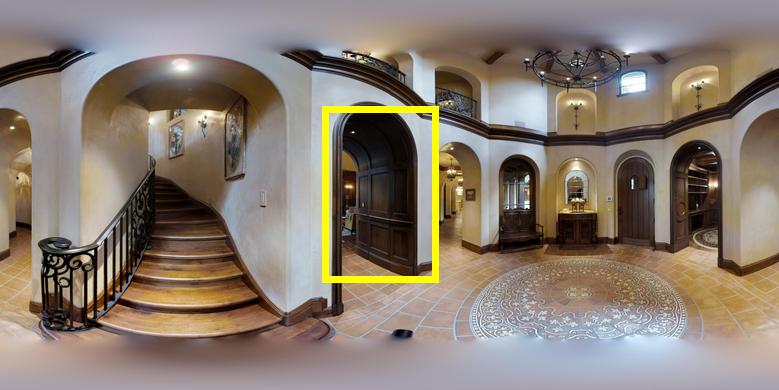
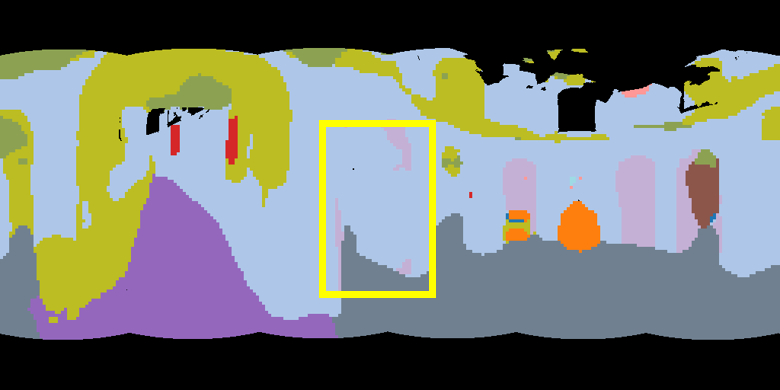
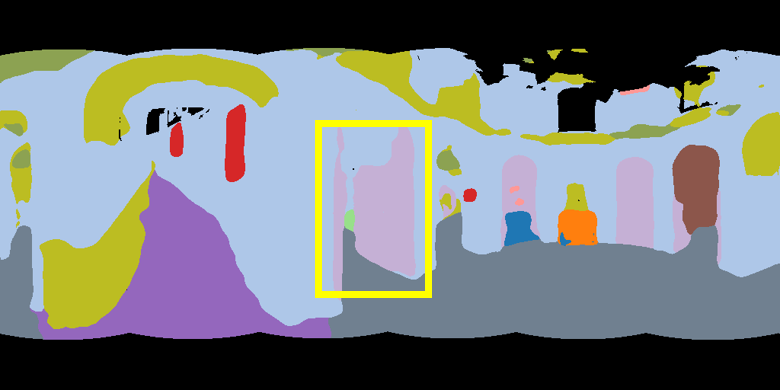
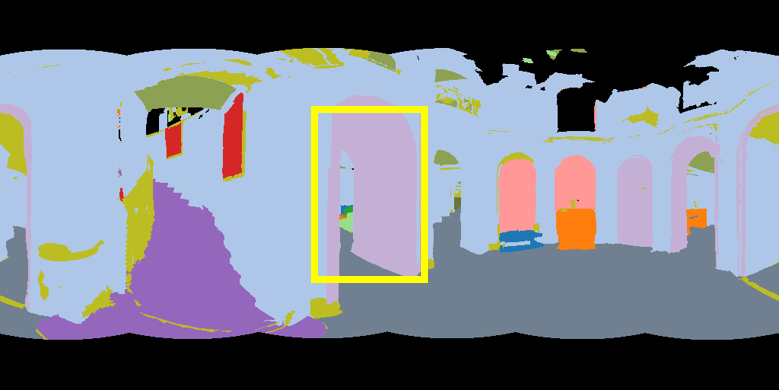
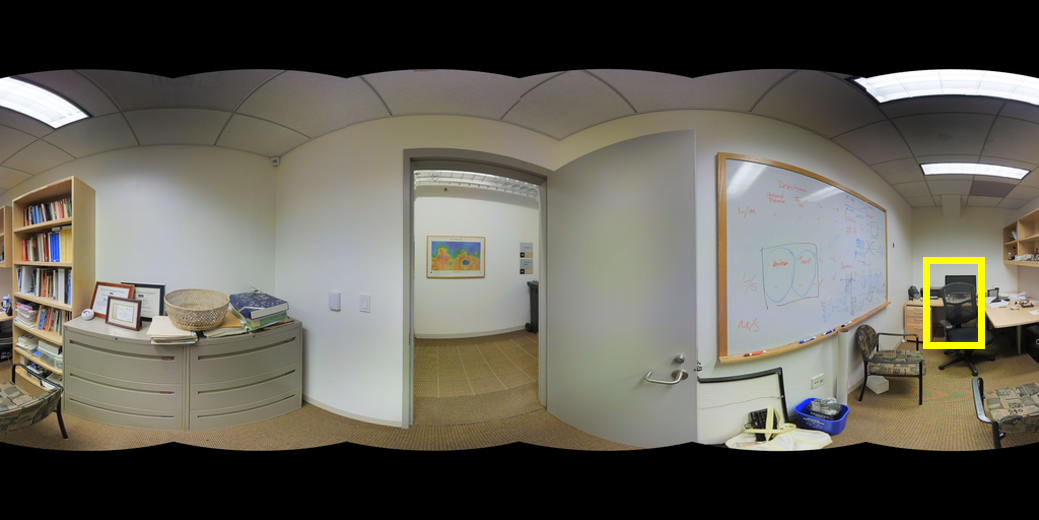
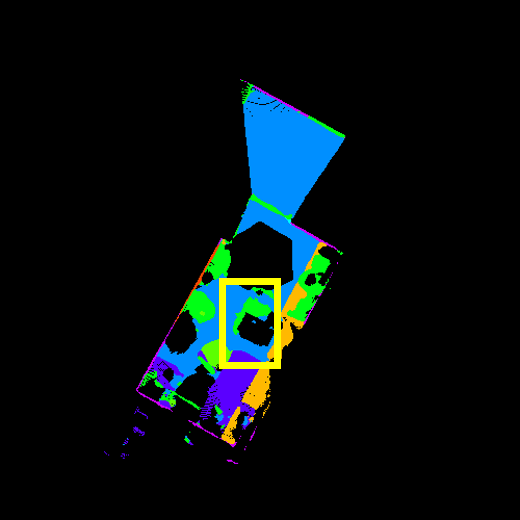
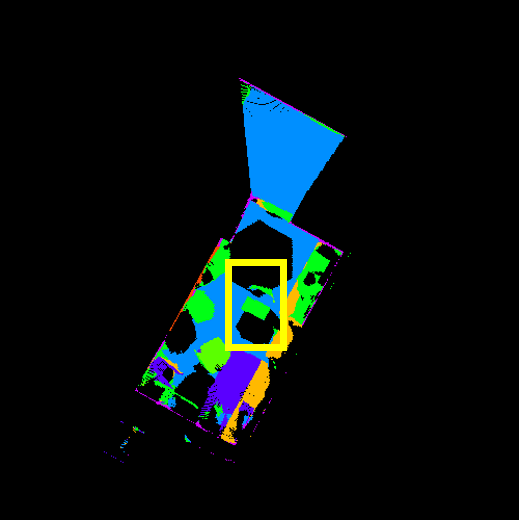
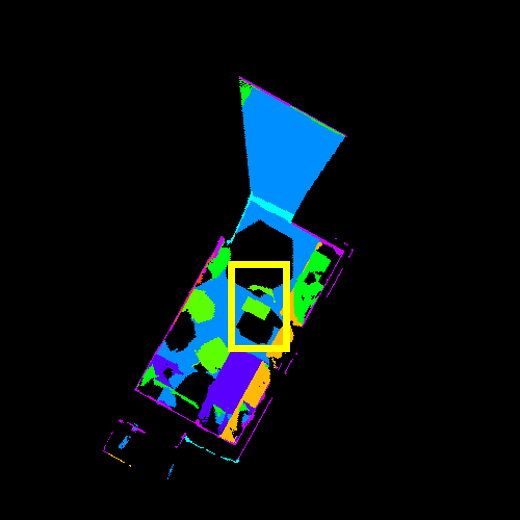
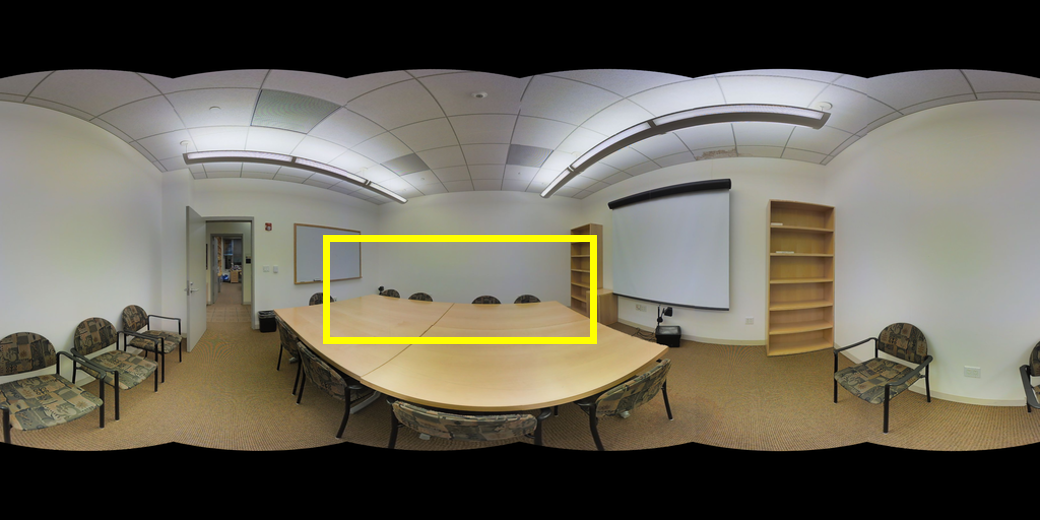
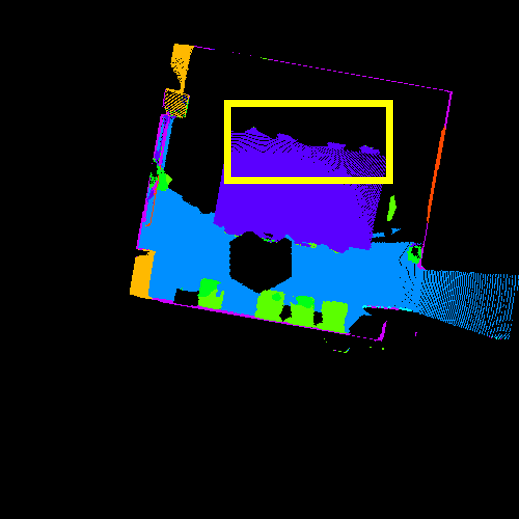
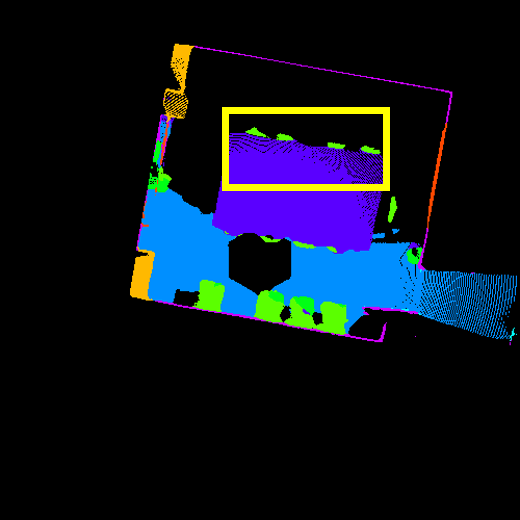
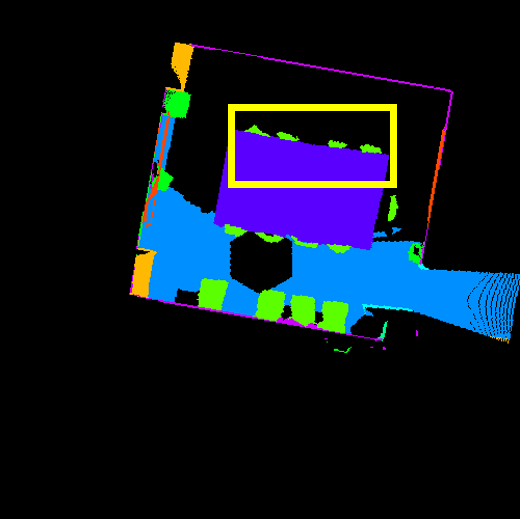
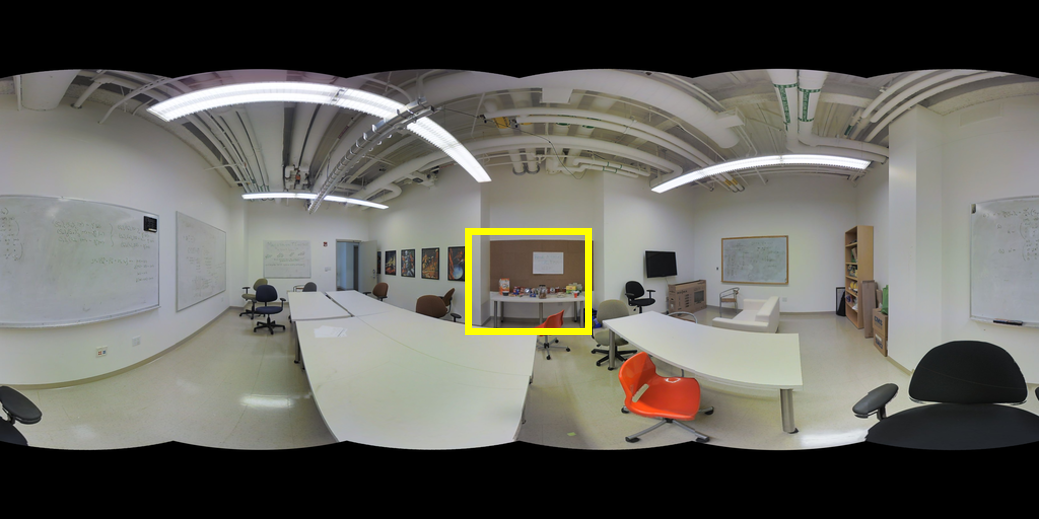
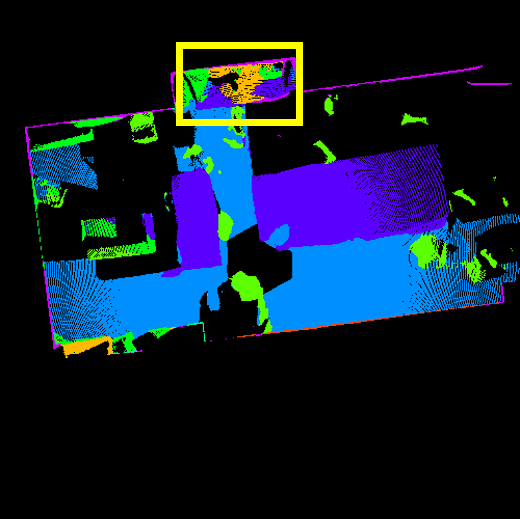
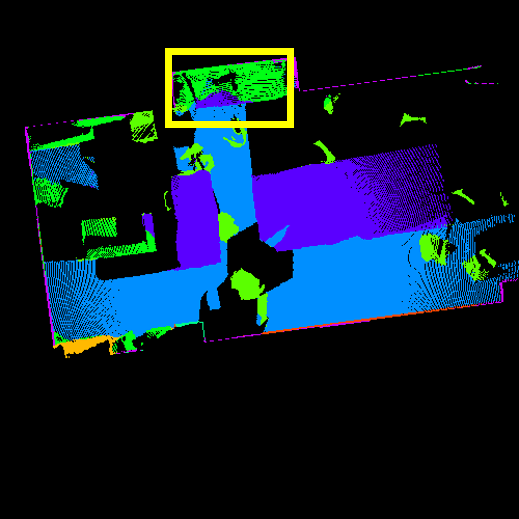
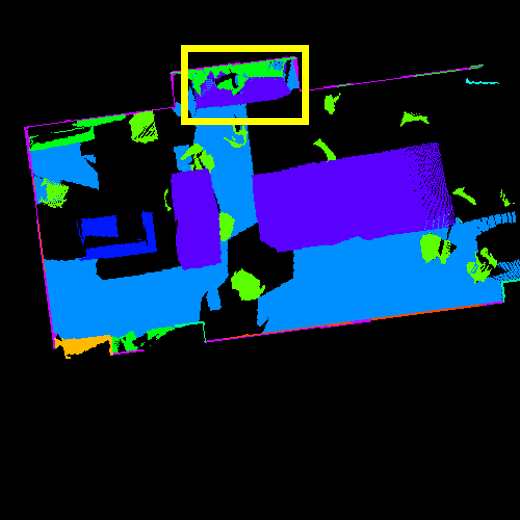
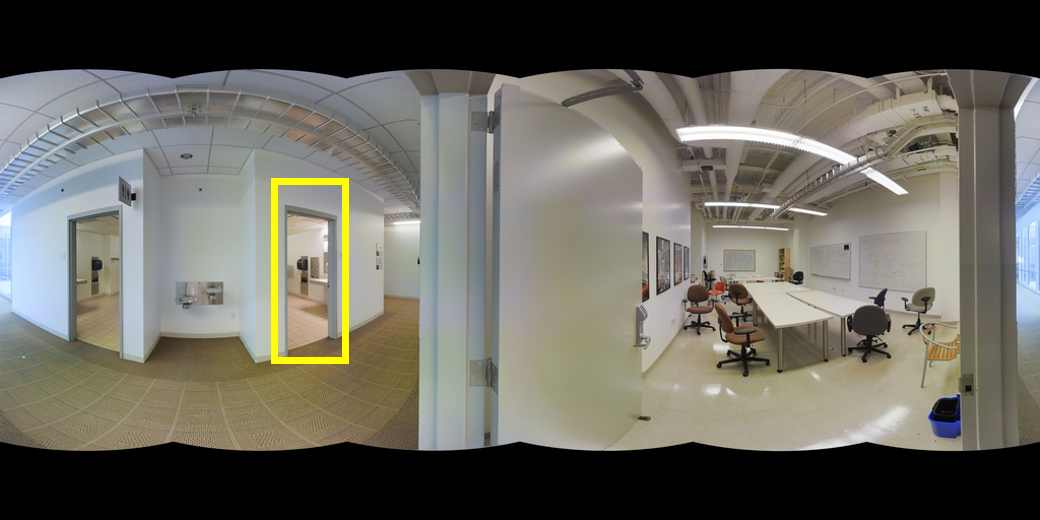
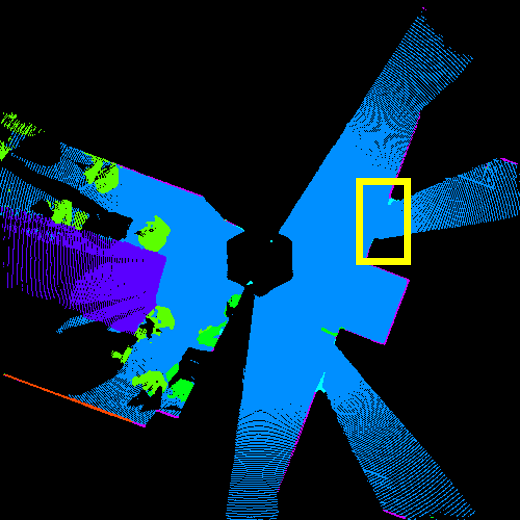
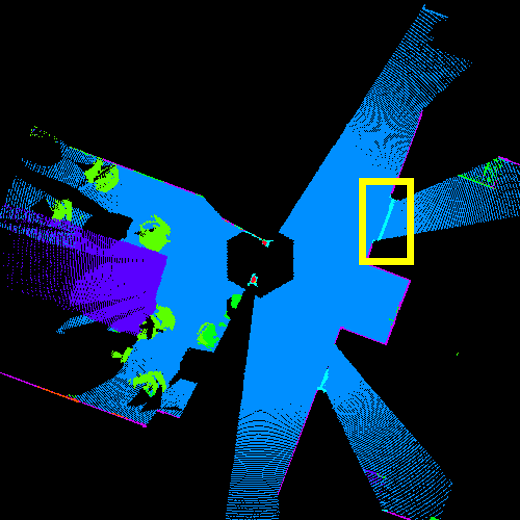
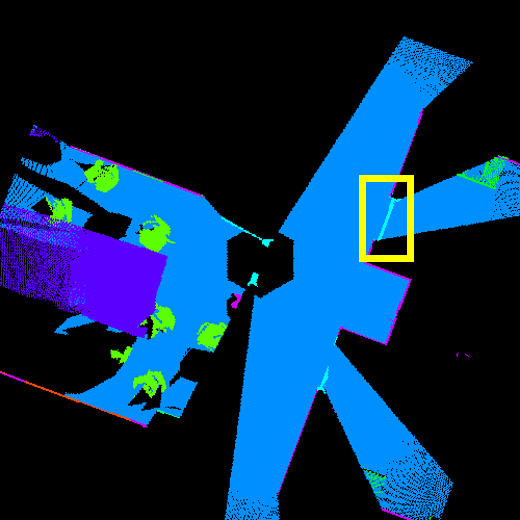
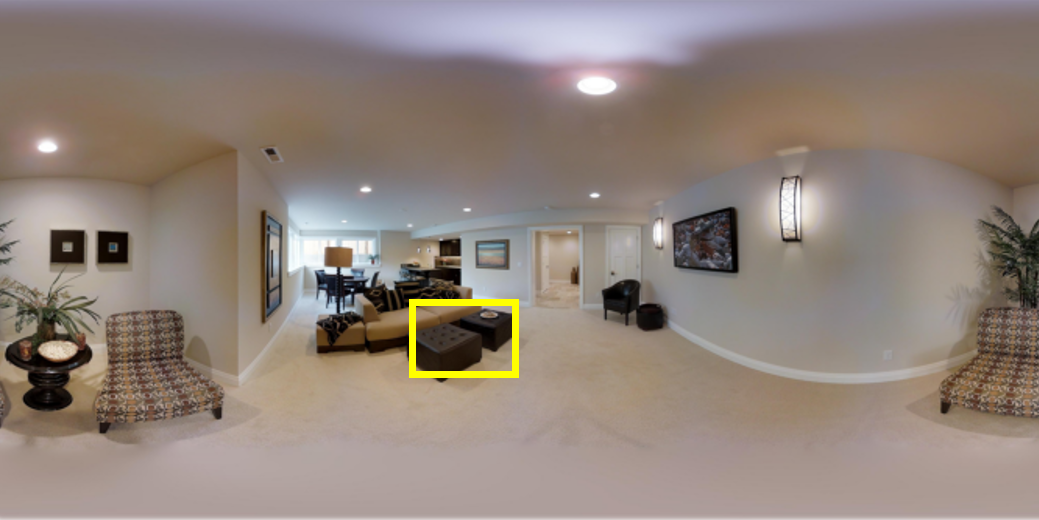
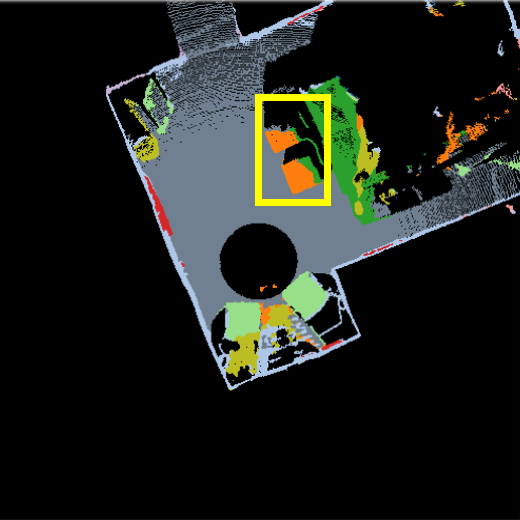
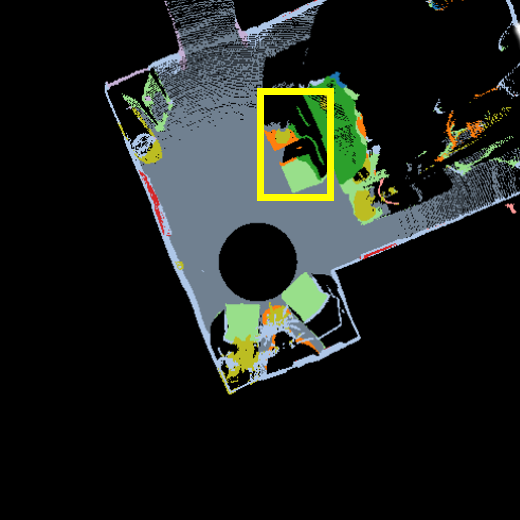
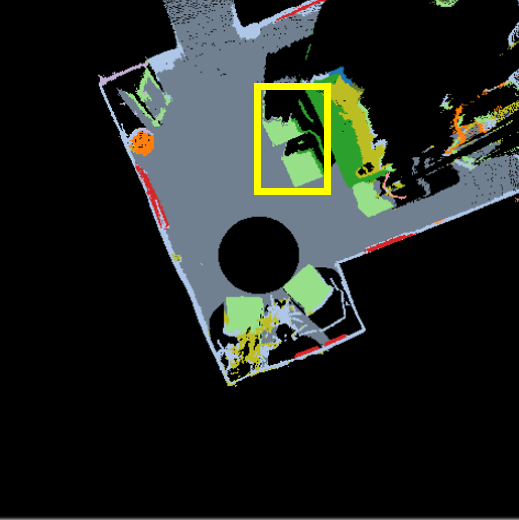
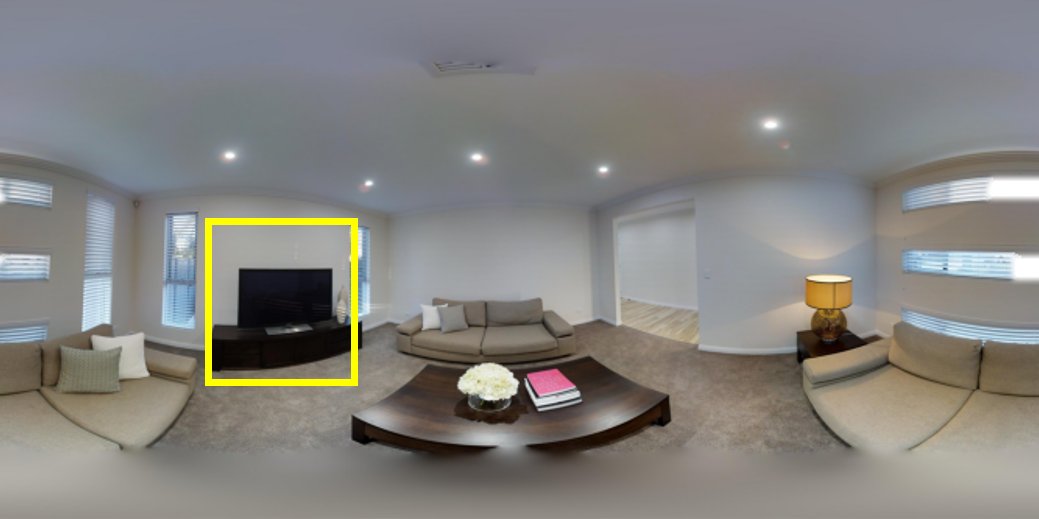
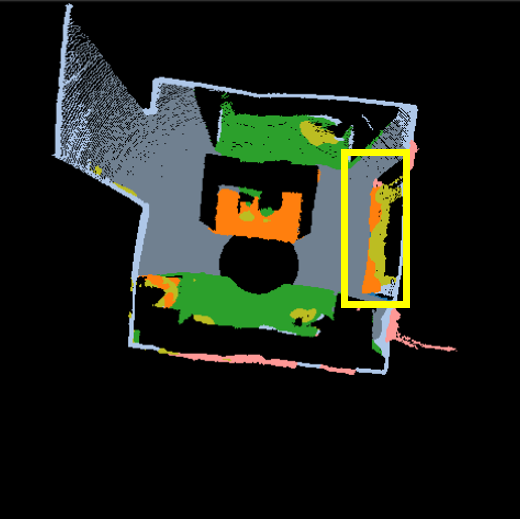
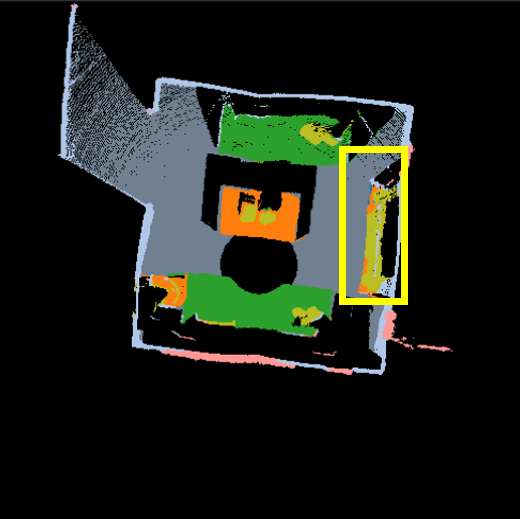
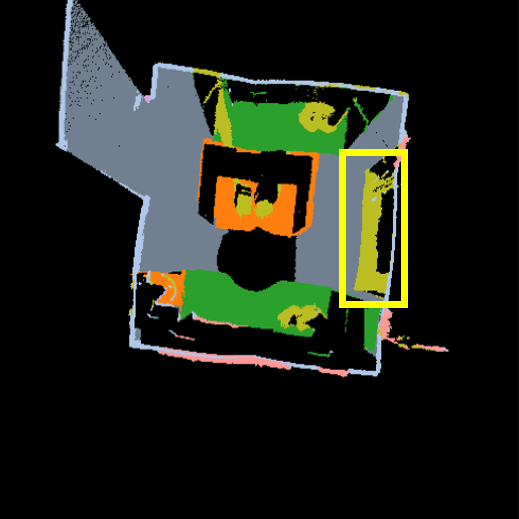
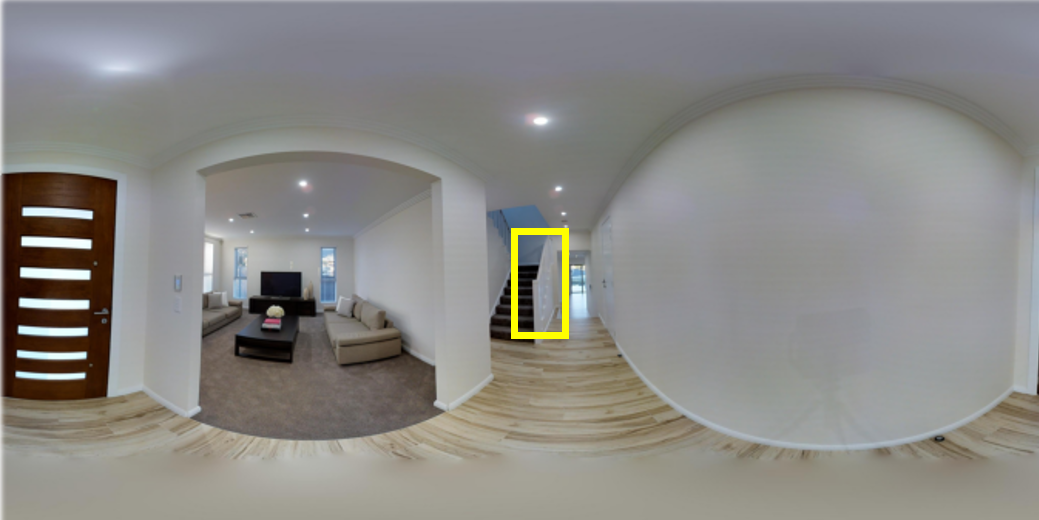
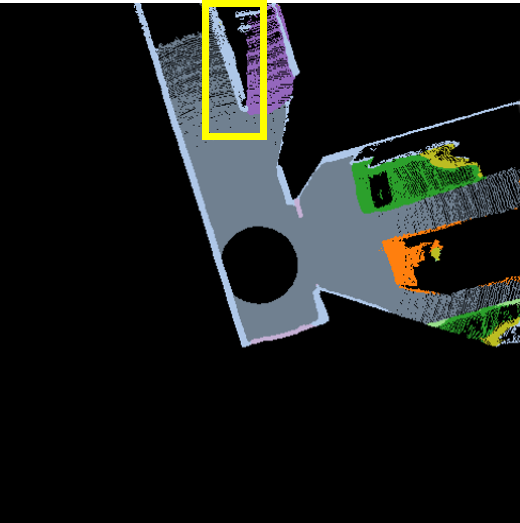
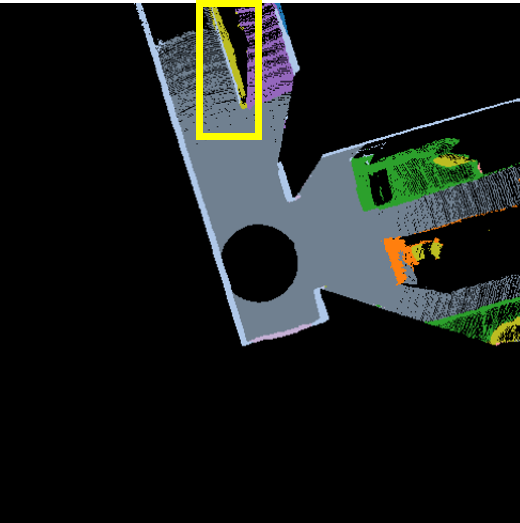
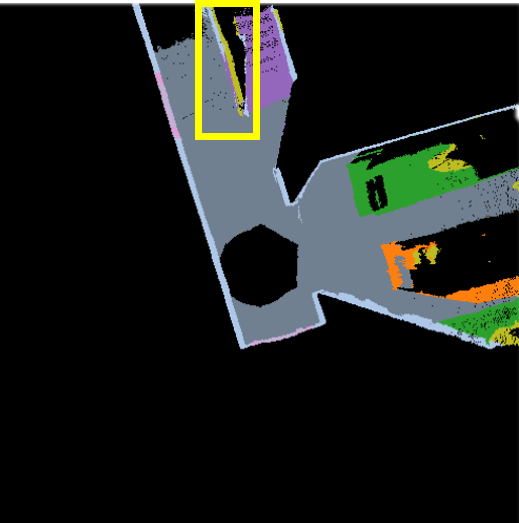
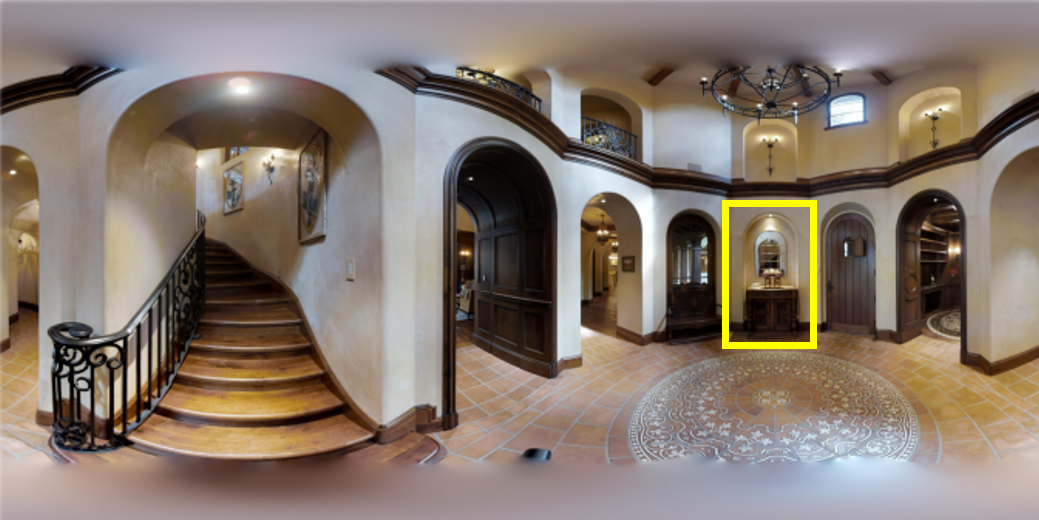
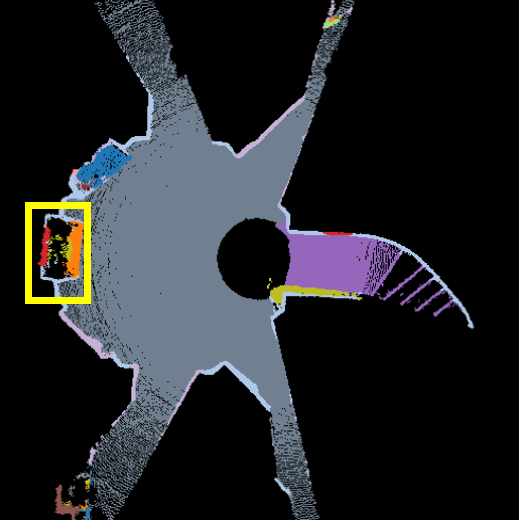
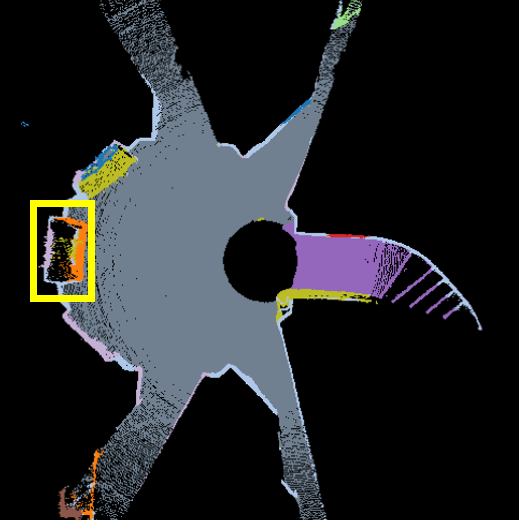
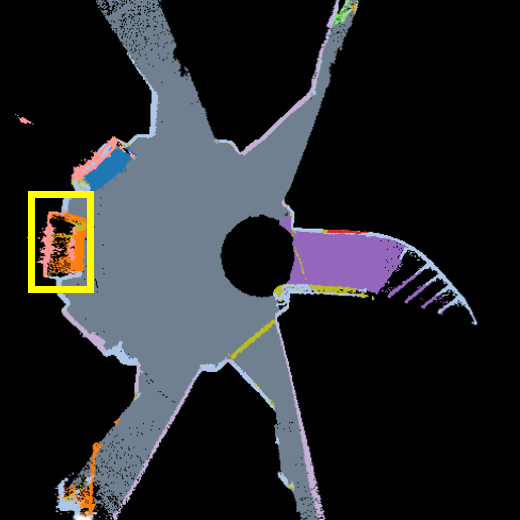
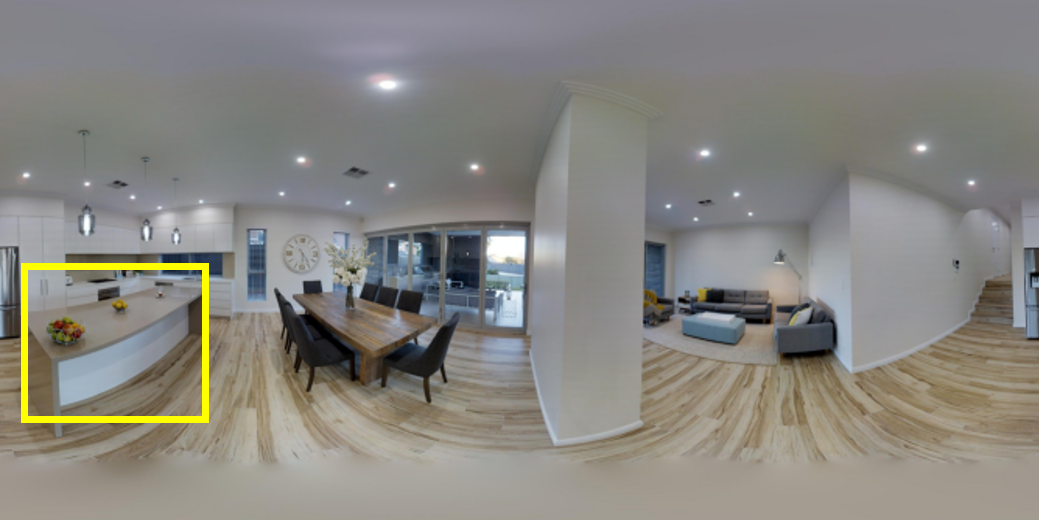
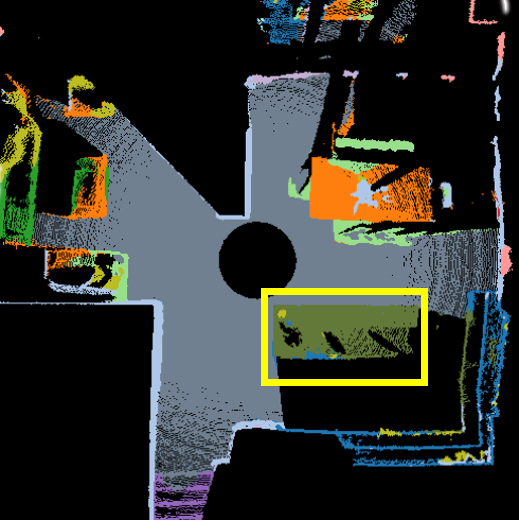
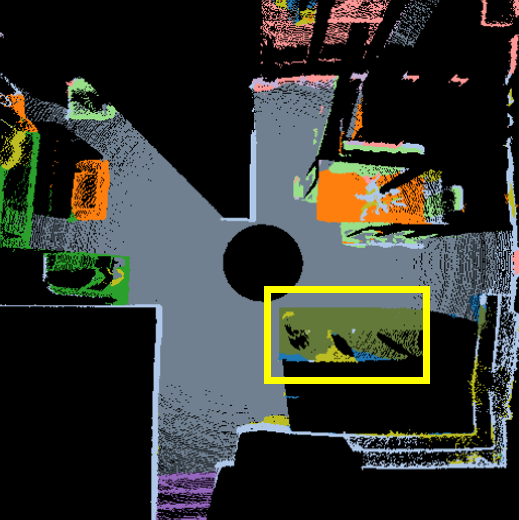
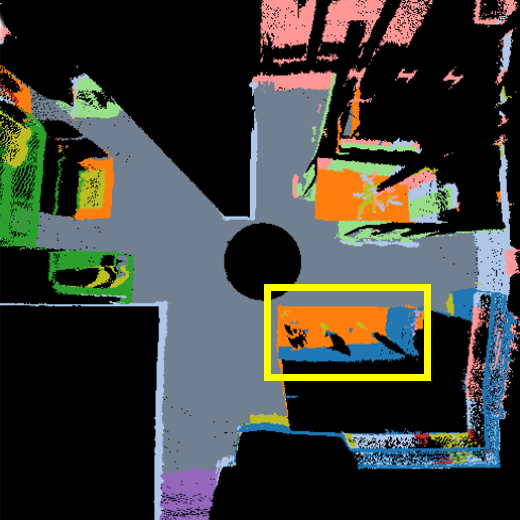
To analyze the predicted semantic maps, we visualize the results from the validation set of the 360BEV-Matterport dataset. In Fig. 8, from left to right are input images, results of baseline [6], results of our 360Mapper, and ground truth. Thanks to the IRP projection and 360Attention, the segmentation results of 360Mapper are much better. In the first scene in Fig. 8, 360Mapper is able to successfully classify chairs, while the baseline model fails, predicting several tables and misclassifying the distant ground as another table. In the second scene, the segmentation of the tables derived by the baseline is incomplete. Furthermore, in the last zoomed-in scene, 360Mapper provides accurate semantic maps, such as in counter, chair, and wall categories, whereas the baseline Trans4Map [6] misclassifies them as tables and doors. Based on the qualitative analysis, our 360Mapper can effectively handle object deformations and image distortions, yielding better BEV semantic maps.
5 Conclusion
In this paper, we introduce 360BEV, a novel task to conduct panoramic semantic mapping in indoor environments, i.e., from a single panoramic image to a holistic BEV semantic map. To enable this, we present 360BEV-Matterport and 360BEV-Stanford, extending off-the-shelf datasets for the presented 360BEV task. We revisit existing transformation paradigms and propose 360Mapper, a novel end-to-end architecture specifically designed for panoramic semantic mapping. As a consequence, 360Mapper outperforms state-of-the-art counterparts by clear margins.
Acknowledgement. This work was supported in part by the “KIT Future Fields” project, in part by the Ministry of Science, Research and the Arts of Baden-Wurttemberg (MWK) through the Cooperative Graduate School Accessibility through AI-based Assistive Technology (KATE) under Grant BW6-03, in part by the Federal Ministry of Education and Research (BMBF) through a fellowship within the IFI program of the German Academic Exchange Service (DAAD), and in part by Hangzhou SurImage Technology Company Ltd. We thank HoreKA@KIT, HAICORE@KIT, and bwHPC supercomputer partitions.
References
- [1] Georgios Albanis, Nikolaos Zioulis, Petros Drakoulis, Vasileios Gkitsas, Vladimiros Sterzentsenko, Federico Alvarez, Dimitrios Zarpalas, and Petros Daras. Pano3D: A holistic benchmark and a solid baseline for 360° depth estimation. In CVPRW, 2021.
- [2] Peter Anderson, Qi Wu, Damien Teney, Jake Bruce, Mark Johnson, Niko Sünderhauf, Ian Reid, Stephen Gould, and Anton Van Den Hengel. Vision-and-language navigation: Interpreting visually-grounded navigation instructions in real environments. In CVPR, 2018.
- [3] Iro Armeni, Sasha Sax, Amir R. Zamir, and Silvio Savarese. Joint 2D-3D-semantic data for indoor scene understanding. arXiv preprint arXiv:1702.01105, 2017.
- [4] Vincent Cartillier, Zhile Ren, Neha Jain, Stefan Lee, Irfan Essa, and Dhruv Batra. Semantic MapNet: Building allocentric semantic maps and representations from egocentric views. In AAAI, 2021.
- [5] Angel Chang, Angela Dai, Thomas Funkhouser, Maciej Halber, Matthias Niessner, Manolis Savva, Shuran Song, Andy Zeng, and Yinda Zhang. Matterport3D: Learning from RGB-D data in indoor environments. In 3DV, 2017.
- [6] Chang Chen, Jiaming Zhang, Kailun Yang, Kunyu Peng, and Rainer Stiefelhagen. Trans4Map: Revisiting holistic bird’s-eye-view mapping from egocentric images to allocentric semantics with vision transformers. In WACV, 2023.
- [7] Taco Cohen, Maurice Weiler, Berkay Kicanaoglu, and Max Welling. Gauge equivariant convolutional networks and the icosahedral CNN. In ICML, 2019.
- [8] Marc Eder, Mykhailo Shvets, John Lim, and Jan-Michael Frahm. Tangent images for mitigating spherical distortion. In CVPR, 2020.
- [9] Carlos Esteves, Ameesh Makadia, and Kostas Daniilidis. Spin-weighted spherical CNNs. In NeurIPS, 2020.
- [10] Di Feng, Christian Haase-Schütz, Lars Rosenbaum, Heinz Hertlein, Claudius Glaeser, Fabian Timm, Werner Wiesbeck, and Klaus Dietmayer. Deep multi-modal object detection and semantic segmentation for autonomous driving: Datasets, methods, and challenges. T-ITS, 2020.
- [11] Margarita Grinvald, Fadri Furrer, Tonci Novkovic, Jen Jen Chung, Cesar Cadena, Roland Siegwart, and Juan Nieto. Volumetric instance-aware semantic mapping and 3D object discovery. RA-L, 2019.
- [12] Meng-Hao Guo, Cheng-Ze Lu, Qibin Hou, Zhengning Liu, Ming-Ming Cheng, and Shi-Min Hu. SegNeXt: Rethinking convolutional attention design for semantic segmentation. In NeurIPS, 2022.
- [13] Joel Janai, Fatma Güney, Aseem Behl, and Andreas Geiger. Computer vision for autonomous vehicles: Problems, datasets and state of the art. Foundations and Trends® in Computer Graphics and Vision, 2020.
- [14] Chiyu Max Jiang, Jingwei Huang, Karthik Kashinath, Prabhat, Philip Marcus, and Matthias Nießner. Spherical CNNs on unstructured grids. In ICLR, 2019.
- [15] Kuan-Hui Lee, Matthew Kliemann, Adrien Gaidon, Jie Li, Chao Fang, Sudeep Pillai, and Wolfram Burgard. PillarFlow: End-to-end birds-eye-view flow estimation for autonomous driving. In IROS, 2020.
- [16] Wenbin Li, Sajad Saeedi, John McCormac, Ronald Clark, Dimos Tzoumanikas, Qing Ye, Yuzhong Huang, Rui Tang, and Stefan Leutenegger. InteriorNet: Mega-scale multi-sensor photo-realistic indoor scenes dataset. In BMVC, 2018.
- [17] Zhiqi Li, Wenhai Wang, Hongyang Li, Enze Xie, Chonghao Sima, Tong Lu, Yu Qiao, and Jifeng Dai. BEVFormer: Learning bird’s-eye-view representation from multi-camera images via spatiotemporal transformers. In ECCV, 2022.
- [18] Yingfei Liu, Tiancai Wang, Xiangyu Zhang, and Jian Sun. PETR: Position embedding transformation for multi-view 3D object detection. In ECCV, 2022.
- [19] Chenxu Luo, Xiaodong Yang, and Alan Yuille. Self-supervised pillar motion learning for autonomous driving. In CVPR, 2021.
- [20] Gellert Mattyus, Shenlong Wang, Sanja Fidler, and Raquel Urtasun. Enhancing road maps by parsing aerial images around the world. In ICCV, 2015.
- [21] Daniel Maturana, Po-Wei Chou, Masashi Uenoyama, and Sebastian Scherer. Real-time semantic mapping for autonomous off-road navigation. In FSR, 2018.
- [22] Branislav Mičušĺík and Jana Košecká. Semantic segmentation of street scenes by superpixel co-occurrence and 3D geometry. In ICCVW, 2009.
- [23] Bowen Pan, Jiankai Sun, Ho Yin Tiga Leung, Alex Andonian, and Bolei Zhou. Cross-view semantic segmentation for sensing surroundings. RA-L, 2020.
- [24] Lang Peng, Zhirong Chen, Zhangjie Fu, Pengpeng Liang, and Erkang Cheng. BEVSegFormer: Bird’s eye view semantic segmentation from arbitrary camera rigs. In WACV, 2023.
- [25] Teng Ran, Liang Yuan, Jianbo Zhang, Dingxin Tang, and Li He. RS-SLAM: A robust semantic SLAM in dynamic environments based on RGB-D sensor. IEEE Sensors Journal, 2021.
- [26] Manolis Savva, Jitendra Malik, Devi Parikh, Dhruv Batra, Abhishek Kadian, Oleksandr Maksymets, Yili Zhao, Erik Wijmans, Bhavana Jain, Julian Straub, Jia Liu, and Vladlen Koltun. Habitat: A platform for embodied AI research. In CVPR, 2019.
- [27] Sunando Sengupta, Paul Sturgess, Lubor Ladicky, and Philip H. S. Torr. Automatic dense visual semantic mapping from street-level imagery. In IROS, 2012.
- [28] Suriya Singh, Anil Batra, Guan Pang, Lorenzo Torresani, Saikat Basu, Manohar Paluri, and C. V. Jawahar. Self-supervised feature learning for semantic segmentation of overhead imagery. In BMVC, 2018.
- [29] Cheng Sun, Min Sun, and Hwann-Tzong Chen. HoHoNet: 360 indoor holistic understanding with latent horizontal features. In CVPR, 2021.
- [30] Keisuke Tateno, Nassir Navab, and Federico Tombari. Distortion-aware convolutional filters for dense prediction in panoramic images. In ECCV, 2018.
- [31] Jingdong Wang, Ke Sun, Tianheng Cheng, Borui Jiang, Chaorui Deng, Yang Zhao, Dong Liu, Yadong Mu, Mingkui Tan, Xinggang Wang, Wenyu Liu, and Bin Xiao. Deep high-resolution representation learning for visual recognition. TPAMI, 2021.
- [32] Erik Wijmans, Samyak Datta, Oleksandr Maksymets, Abhishek Das, Georgia Gkioxari, Stefan Lee, Irfan Essa, Devi Parikh, and Dhruv Batra. Embodied question answering in photorealistic environments with point cloud perception. In CVPR, 2019.
- [33] Fei Xia, Amir R Zamir, Zhiyang He, Alexander Sax, Jitendra Malik, and Silvio Savarese. Gibson env: Real-world perception for embodied agents. In CVPR, 2018.
- [34] Enze Xie, Wenhai Wang, Zhiding Yu, Anima Anandkumar, Jose M. Alvarez, and Ping Luo. SegFormer: Simple and efficient design for semantic segmentation with transformers. In NeurIPS, 2021.
- [35] Chenyu Yang, Yuntao Chen, Hao Tian, Chenxin Tao, Xizhou Zhu, Zhaoxiang Zhang, Gao Huang, Hongyang Li, Yu Qiao, Lewei Lu, Jie Zhou, and Jifeng Dai. BEVFormer v2: Adapting modern image backbones to bird’s-eye-view recognition via perspective supervision. In CVPR, 2023.
- [36] Yuhui Yuan, Xilin Chen, and Jingdong Wang. Object-contextual representations for semantic segmentation. In ECCV, 2020.
- [37] Chao Zhang, Stephan Liwicki, William Smith, and Roberto Cipolla. Orientation-aware semantic segmentation on icosahedron spheres. In ICCV, 2019.
- [38] Jiaming Zhang, Kailun Yang, Angela Constantinescu, Kunyu Peng, Karin Müller, and Rainer Stiefelhagen. Trans4Trans: Efficient transformer for transparent object segmentation to help visually impaired people navigate in the real world. In ICCVW, 2021.
- [39] Jiaming Zhang, Kailun Yang, Chaoxiang Ma, Simon Reiß, Kunyu Peng, and Rainer Stiefelhagen. Bending reality: Distortion-aware transformers for adapting to panoramic semantic segmentation. In CVPR, 2022.
- [40] Jiaming Zhang, Kailun Yang, Hao Shi, Simon Reiß, Kunyu Peng, Chaoxiang Ma, Haodong Fu, Kaiwei Wang, and Rainer Stiefelhagen. Behind every domain there is a shift: Adapting distortion-aware vision transformers for panoramic semantic segmentation. arXiv preprint arXiv:2207.11860, 2022.
- [41] Hengshuang Zhao, Jianping Shi, Xiaojuan Qi, Xiaogang Wang, and Jiaya Jia. Pyramid scene parsing network. In CVPR, 2017.
- [42] Jia Zheng, Junfei Zhang, Jing Li, Rui Tang, Shenghua Gao, and Zihan Zhou. Structured3D: A large photo-realistic dataset for structured 3D modeling. In ECCV, 2020.
- [43] Zishuo Zheng, Chunyu Lin, Lang Nie, Kang Liao, Zhijie Shen, and Yao Zhao. Complementary bi-directional feature compression for indoor 360° semantic segmentation with self-distillation. In WACV, 2023.
- [44] Brady Zhou and Philipp Krähenbühl. Cross-view transformers for real-time map-view semantic segmentation. In CVPR, 2022.
- [45] Xizhou Zhu, Weijie Su, Lewei Lu, Bin Li, Xiaogang Wang, and Jifeng Dai. Deformable DETR: Deformable transformers for end-to-end object detection. In ICLR, 2021.
- [46] Nikolaos Zioulis, Antonis Karakottas, Dimitrios Zarpalas, Federico Alvarez, and Petros Daras. Spherical view synthesis for self-supervised 360° depth estimation. In 3DV, 2019.
Appendix A Data Generation
To perform the data generation, we use an open-source tool222The matterport utils tool. to convert the 3D mesh semantic labels in Matterport3D [5] into pinhole images with semantic labels. Then, every semantic label pairs are concatenated via a corresponding rotation-translation matrix, yielding panoramic semantic ground truth, which is referred to as 360FV-Matterport by us. These panoramic semantic images are originally annotated with object categories. Because many of them are only a small percentage (), we merges some uncommon classes and maintains the most common object categories: wall, floor, chair, door, table, picture, furniture, objects, window, sofa, bed, sink, stairs, ceiling, toilet, mirror, shower, bathtub, counter, and shelving. For another front-view semantic segmentation dataset, Stanford2D3D [3], we keep the original object classes: beam, board, bookcase, ceiling, chair, clutter, column, door, floor, sofa, table, wall, window.
For the presented 360BEV-Stanford dataset, we follow the data split method of Fold-1 of the Stanford2D3D [3] dataset. On the BEV dataset, we use the area1, area2, area3, area4 and area6 as the training data for the proposed 360BEV task, and we use the area5a and area5b as the validation set to evaluate the panoramic semantic mapping performance of models. The results of training and evaluation with the Fold-1 data split is similar the average scores which are calculated by using three-fold cross-validation. Besides, the validation set from Fold-1 is sufficient to evaluate the model performance on panoramic semantic mapping.
For 360BEV-Matterport, we use a different data split compared to Wijmans et al. [32]. Instead of using synthetic simulators, all samples on our dataset are converted from the real images and labels of Matterport3D [5] dataset, where there are unique floors on our dataset, including for training, for validations, and for testing.
Appendix B More Quantitative Analysis
B.1 Results on Stanford2D3D
In Table 7, we present the per-class IoU results of front-view semantic segmentation on the Stanford2D3D dataset. The average (Avg.) scores are calculated with three folds [3] of cross validation, where Fold-2 is the most challenging split on the Stanford2D3D dataset. Compared to previous state-of-the-art Trans4PASS [39], our proposed 360Mapper achieves mIoU in Fold-2 split. Besides, our 360Mapper model has overall better performance ( in mIoU) in the average result calculated by three folds evaluation, surpassing the previous Trans4PASS model with in mIoU. Furthermore, our model achieves the highest scores in of categories, including board, bookcase, ceiling, chair, clutter, door, floor, sofa, table, wall, and window. Improvements in these categories demonstrate the effectiveness of our 360Mapper model in combating distortions of 360° front-view images by incorporating distortion-aware 360Attention.
| Method | Split |
mIoU |
beam |
board |
bookcase |
ceiling |
chair |
clutter |
column |
door |
floor |
sofa |
table |
wall |
window |
|---|---|---|---|---|---|---|---|---|---|---|---|---|---|---|---|
| Trans4PASS [39] | Fold-1 | 53.30 | 00.40 | 69.50 | 62.20 | 82.80 | 58.50 | 34.30 | 21.90 | 44.90 | 91.20 | 40.80 | 57.70 | 74.80 | 54.20 |
| Trans4PASS [39] | Fold-2 | 45.70 | 12.50 | 46.90 | 32.60 | 82.30 | 64.70 | 37.50 | 20.10 | 42.70 | 86.60 | 17.70 | 45.20 | 70.30 | 35.10 |
| Trans4PASS [39] | Fold-3 | 57.20 | 21.40 | 65.40 | 58.30 | 80.20 | 55.80 | 41.90 | 28.60 | 76.30 | 88.60 | 45.40 | 58.80 | 59.30 | 63.60 |
| Trans4PASS [39] | Avg. | 52.10 | 11.40 | 60.60 | 51.10 | 81.80 | 59.70 | 37.90 | 23.50 | 54.60 | 88.80 | 34.60 | 53.90 | 68.10 | 51.00 |
| 360Mapper | Fold-1 | 56.46 | 00.57 | 74.61 | 65.03 | 83.96 | 62.41 | 40.27 | 18.72 | 42.22 | 93.31 | 53.86 | 65.90 | 76.18 | 58.84 |
| 360Mapper | Fold-2 | 47.97 | 09.32 | 41.89 | 40.45 | 83.01 | 62.27 | 34.92 | 25.74 | 57.74 | 88.02 | 24.48 | 42.95 | 72.19 | 41.22 |
| 360Mapper | Fold-3 | 58.60 | 08.05 | 74.32 | 61.05 | 81.05 | 63.29 | 44.44 | 4.64 | 76.56 | 90.91 | 57.28 | 62.52 | 64.96 | 72.77 |
| 360Mapper | Avg. | 54.34 | 05.98 | 63.61 | 55.51 | 82.67 | 62.66 | 39.88 | 16.37 | 58.84 | 90.75 | 45.21 | 57.12 | 71.11 | 57.61 |
B.2 Results on 360FV-Matterport
As shown in Table 8, we present the front-view semantic segmentation results on the test set of 360FV-Matterport dataset. We compare our approaches with SegFormer [34], Trans4PASS [39], Trans4PASS+ [40], HoHoNet [29] with RGB and RGB-D, where HoHoNet uses ResNet-101 as backbone and the others use MiT-B2 as backbone. Compared with the well-established existing work SegFormer, our approach obtains a higher mIoU score with , having a performance improvement of mIoU on the test set. The test set is much more challenging than the validation set of 360FV-Matterport dataset, the results in Table 8 show the superiority of the proposed approach on extracting the underlying cues for the proposed task.
| Method | Backbone | Data |
mIoU |
wall |
floor |
chair |
door |
table |
picture |
furniture |
objects |
window |
sofa |
bed |
sink |
stairs |
ceiling |
toilet |
mirror |
shower |
bathtub |
counter |
shelving |
|---|---|---|---|---|---|---|---|---|---|---|---|---|---|---|---|---|---|---|---|---|---|---|---|
| Trans4PASS+ [40] | MiT-B2 | val | 42.60 | 63.37 | 79.11 | 39.13 | 40.31 | 32.76 | 35.99 | 30.96 | 31.52 | 37.52 | 44.01 | 63.17 | 20.60 | 41.76 | 77.55 | 40.71 | 24.27 | 23.73 | 58.34 | 34.31 | 32.90 |
| 360Mapper | MiT-B2 | val | 46.35 | 64.12 | 83.14 | 45.75 | 44.98 | 37.96 | 41.08 | 32.26 | 35.07 | 40.61 | 48.69 | 69.80 | 25.12 | 47.80 | 80.15 | 45.96 | 28.70 | 22.31 | 60.05 | 38.64 | 34.82 |
| Trans4PASS+ [40] | MiT-B2 | test | 40.41 | 64.32 | 80.12 | 41.24 | 41.70 | 30.86 | 36.93 | 35.16 | 28.27 | 32.65 | 33.28 | 55.98 | 22.93 | 37.19 | 78.36 | 48.96 | 17.73 | 26.51 | 49.65 | 28.64 | 22.82 |
| 360Mapper | MiT-B2 | test | 43.16 | 66.95 | 82.24 | 45.12 | 47.34 | 32.72 | 44.35 | 33.34 | 29.57 | 34.59 | 32.08 | 62.06 | 28.24 | 38.03 | 81.26 | 45.47 | 23.61 | 29.01 | 55.44 | 28.58 | 23.24 |
Apart from that, per-class IoU scores on 360FV-Matterport in Table 9. The performance of 360Mapper on both test and validation sets are demonstrated. 360Mapper delivers and mIoU performance on validation and test sets of 360FV-Matterport dataset respectively. For per-class IoUs, our model has better performance of challenging class, e.g., sink with and on validation and test sets, surpassing Trans4PASS+ [40] with large margins. It notes that the small objects, e.g., furniture, mirror, toilet on the test set, are still challenging for both methods. Apart from these, our models have better semantic segmentation results on of classes on the 360FV-Matterport dataset.
B.3 Results on 360BEV-Stanford
Per-class IoU scores on 360BEV-Stanford are shown in Table 10. On the 360BEV task, 360Mapper can achieve score of mIoU, outperforming the previous Trans4Map [6] method with . Specifically, our 360Mapper achieves per-class IoU with , , , , , , , , , , , and for void, board, bookcase, ceiling, chair, clutter, column, door, floor, sofa, table, wall and window, respectively. Especially, the challenging objects that appear thin lines in bird’s-eye views, such as doors and walls, can be more stably recognized by our method, which improves both IoUs with and . The beam class is not successfully recognized by both methods, because this BEV mechanism directly ignores objects on the ceiling. Different from the front-view semantic segmentation task, the void class is included on the 360BEV task, because this class can be used to indicate the invisible area on the BEV semantic maps, which is important for the downstream task, such as path planing.
| Method | Backbone |
mIoU |
void |
beam |
board |
bookcase |
ceiling |
chair |
clutter |
column |
door |
floor |
sofa |
table |
wall |
window |
|---|---|---|---|---|---|---|---|---|---|---|---|---|---|---|---|---|
| Trans4Map [6] | MiT-B2 | 36.08 | 64.17 | 0.00 | 28.10 | 52.96 | 0.45 | 52.30 | 34.71 | 6.40 | 10.23 | 92.18 | 44.29 | 68.22 | 29.56 | 21.44 |
| 360Mapper | MiT-B2 | 45.78 | 93.33 | 0.00 | 42.52 | 59.14 | 5.06 | 62.66 | 39.75 | 5.48 | 38.74 | 97.76 | 48.92 | 76.76 | 45.86 | 24.89 |
B.4 Results on 360BEV-Matterport
| Method | Backbone | Acc | mRecall | mPrecision | mIoU |
| (1)Early projection: Proj. Enc. Seg. | |||||
| SegFormer [34] | MiT-B2 | 69.72 | 35.28 | 40.41 | 24.04 |
| SegNeXt[12] | MSCA-B | 69.99 | 36.25 | 41.96 | 25.22 |
| (2) Late projection: Enc. Seg. Proj. | |||||
| HoHoNet [29] | ResNet101 | 62.89 | 35.18 | 39.54 | 22.01 |
| Trans4PASS [39] | MiT-B2 | 53.50 | 29.35 | 33.53 | 16.53 |
| Trans4PASS+ [40] | MiT-B2 | 57.24 | 30.639 | 34.49 | 17.72 |
| SegFormer [34] | MiT-B2 | 62.91 | 35.35 | 39.64 | 22.02 |
| (3) Intermediate projection: Enc. Proj. Seg. | |||||
| BEVFormer [17] | MiT-B2 | 72.04 | 36.69 | 47.90 | 27.46 |
| Trans4Map [6] | MiT-B0 | 71.78 | 38.27 | 43.77 | 26.52 |
| Trans4Map [6] | MiT-B2 | 72.94 | 45.45 | 47.03 | 31.08 |
| Trans4Map [6] | MiT-B4 | 73.60 | 44.33 | 49.91 | 31.79 |
| Ours | MiT-B0 | 76.02 | 43.11 | 50.41 | 31.35 (+4.83) |
| Ours | MiT-B2 | 78.04 | 54.47 | 54.27 | 38.78 (+7.70) |
| Ours | MSCA-B | 79.17 | 55.16 | 57.27 | 40.27 |
The 360BEV results on the test set of 360BEV-Matterport are demonstrated in Table 11. We further compare our approach with three backbones, e.g., MiT-B0, MiT-B2 from SegFormer [34] and MSCA-B from SegNeXt [12] on the test set of the 360BEV-Matterport for the panoramic semantic mapping task. Methods based on intermediate projection show the most promising results compared with those based on early projection and late projection. The result is consistent compared with the ones demonstrated on the validation set of 360BEV-Matterport dataset. 360Mapper still delivers the state-of-the art results for the proposed 360BEV task on the test set, indicating the effectiveness of the proposed architecture. Especially, our 360Mapper with MiT-B2 backbone () can surpass Trans4Map with MiT-B2 () as well as the one with MiT-B4 (). Besides, the proposed method based on MSCA-B backbone achieves the best result with in mIoU.
Per-class IoU scores on the 360BEV-Matterport dataset are presented in Table 12. The performance of 360Mapper under MiT-B2 from SegFormer [34] and MSCA-B from SegNeXt [12] are included, which achieves promising performance for the 360BEV task. Compared to Trans4Map [6], our 360Mapper with the same MiT-B2 backbone can achieve respective and in mIoU on the validation set and the test set. The void class is also included on the 360BEV-Matterport dataset. Besides, if using a stronger backbone, e.g., MSCA-B [12], our proposed mehods can achieve higher semantic mapping results on both of validation and test sets of 360BEV-Matterport dataset, which are and in mIoU, respectively.
| Method | Backbone | Data |
mIoU |
void |
wall |
floor |
chair |
door |
table |
picture |
furniture |
objects |
window |
sofa |
bed |
sink |
stairs |
ceiling |
toilet |
mirror |
shower |
bathtub |
counter |
shelving |
|---|---|---|---|---|---|---|---|---|---|---|---|---|---|---|---|---|---|---|---|---|---|---|---|---|
| Trans4Map[6] | MiT-B2 | val | 36.72 | 47.87 | 28.52 | 82.96 | 34.44 | 22.27 | 39.58 | 16.28 | 22.75 | 26.29 | 25.08 | 42.81 | 62.25 | 13.95 | 41.51 | 37.79 | 45.82 | 19.56 | 48.05 | 47.71 | 38.25 | 27.31 |
| 360Mapper | MiT-B2 | val | 44.32 | 74.30 | 31.94 | 85.85 | 42.01 | 26.71 | 46.40 | 23.21 | 25.00 | 24.87 | 27.36 | 51.37 | 66.59 | 20.99 | 47.07 | 54.97 | 56.91 | 29.50 | 55.70 | 63.16 | 45.82 | 31.04 |
| 360Mapper | MSCA-B | val | 46.31 | 74.43 | 35.62 | 86.17 | 43.60 | 28.56 | 50.61 | 25.11 | 25.17 | 26.26 | 27.56 | 53.17 | 69.36 | 24.02 | 50.24 | 61.26 | 62.11 | 31.77 | 51.60 | 65.71 | 47.32 | 33.06 |
| Trans4Map[6] | MiT-B2 | test | 31.08 | 40.51 | 32.54 | 80.21 | 33.23 | 20.85 | 37.21 | 19.01 | 18.46 | 23.05 | 23.56 | 32.35 | 52.08 | 15.34 | 29.02 | 18.27 | 41.90 | 15.39 | 25.58 | 48.19 | 30.38 | 15.52 |
| 360Mapper | MiT-B2 | test | 38.78 | 60.36 | 36.77 | 84.34 | 39.93 | 24.41 | 44.58 | 25.23 | 21.97 | 25.20 | 27.06 | 36.59 | 60.84 | 28.46 | 35.60 | 49.69 | 57.39 | 19.35 | 25.84 | 56.91 | 37.23 | 16.60 |
| 360Mapper | MSCA-B | test | 40.27 | 62.82 | 40.09 | 85.22 | 42.60 | 25.48 | 46.00 | 24.37 | 25.11 | 26.08 | 27.39 | 39.68 | 61.45 | 28.18 | 36.17 | 50.88 | 58.31 | 19.77 | 29.85 | 59.78 | 35.39 | 21.14 |
Appendix C More Qualitative Analysis
C.1 Analysis on Stanford2D3D
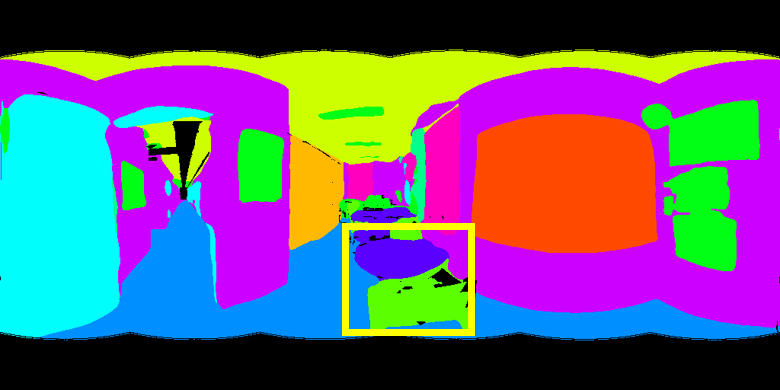
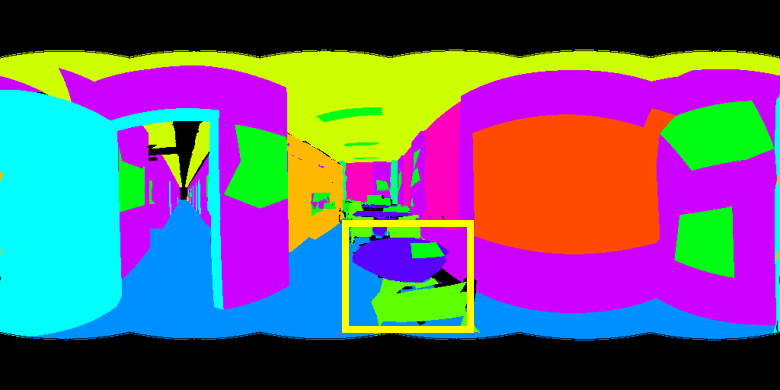
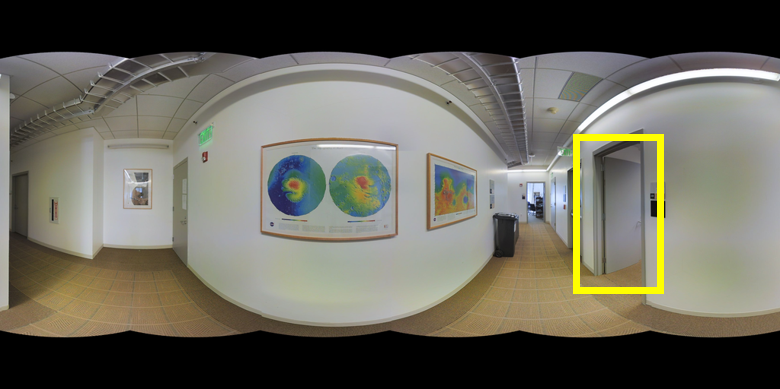
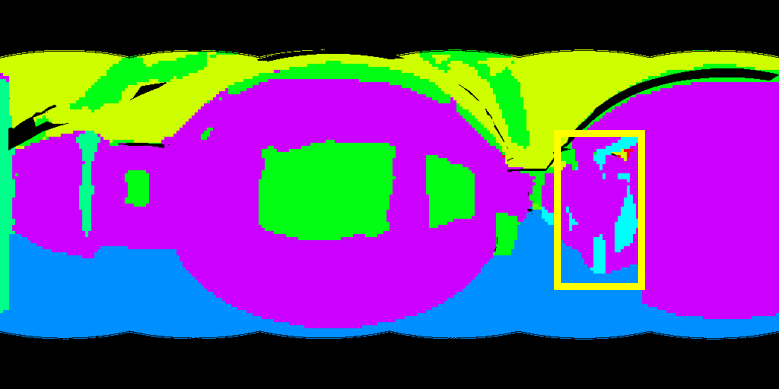
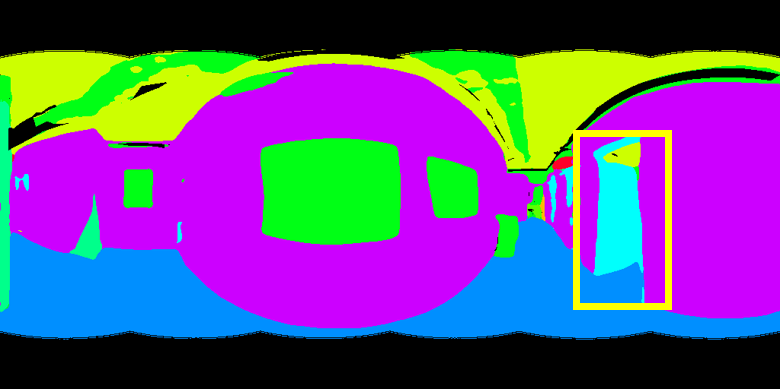
The visualization of front-view semantic segmentation (360FV) on the Stanford2D3D dataset is shown in Fig. 9, where the RGB input, the prediction of the baseline, the prediction of our model and the ground truth are depicted from left to the right. The corresponding color map is showcased at the top of Fig. 9. Compared with the baseline Trans4Pass[39], the panoramic semantic segmentation results of our model have clear boundaries among different objects which is much more similar to the ground truth, e.g., the door and the clutter of the second sample. Our method also show promising performance on the objects with small spatial size, e.g., chairs, compared with the baseline in the last sample, indicating that our 360Attention approach is good at grasping underlying context feature and cues through the deformable sampling locations.
C.2 Analysis on 360FV-Matterport
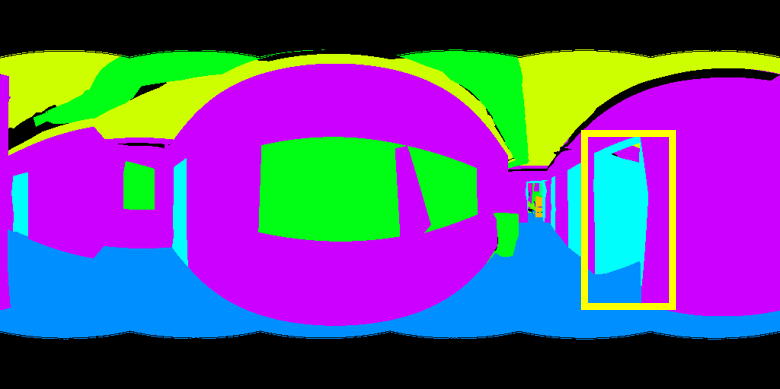
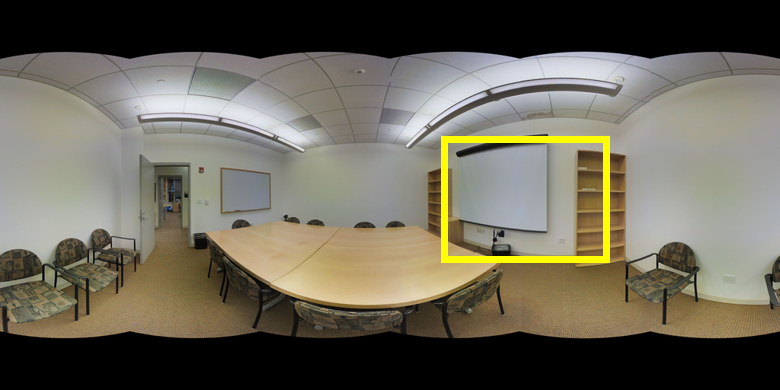
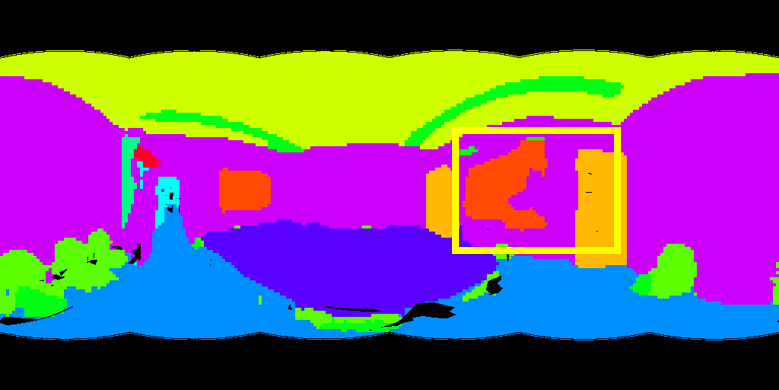
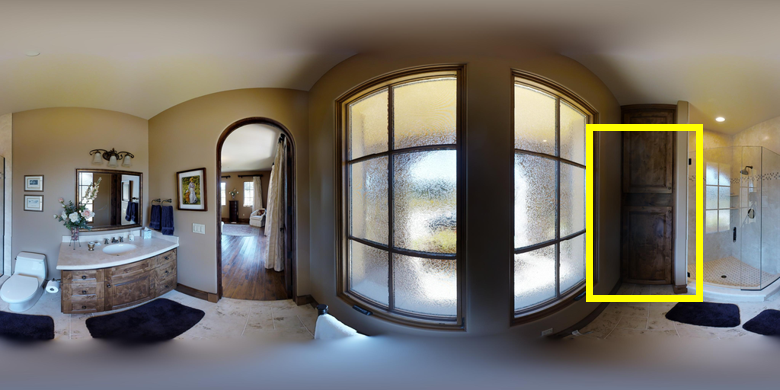
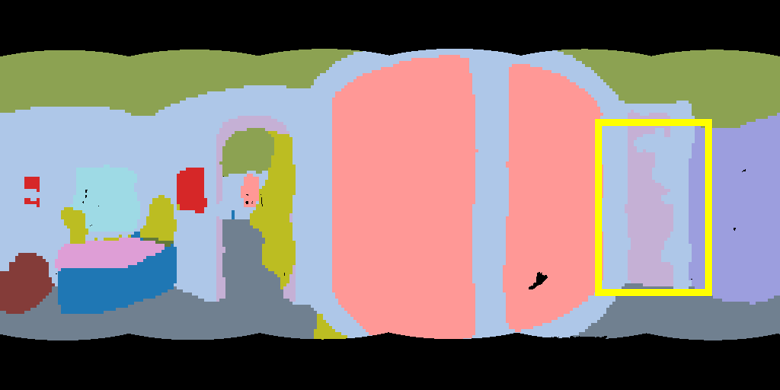
Fig. 10 is the front-view semantic segmentation visualization of the presented 360FV-Matterport dataset, providing a detailed depiction of the spatial distribution of different semantic classes. Compared with the baseline method Trans4Pass[39], our model produces segmentation results exhibit more precise contours and clearer boundaries between different objects, which closely resemble the ground truth segmentation labels, e.g., the toilet and the door of the first sample. In the second row, the door on the right side is not recognized by the baseline model. In contrast to the baseline method, our model is able to accurately distinguish the door class from its surrounding object and wall classes, despite its small size and low contrast with the surrounding environment. The table in the center of the third sample are correctly predicted by our model while it is erroneously segmented by the baseline as furniture. This highlights the superior performance of 360Mapper in panoramic semantic segmentation under challenging conditions. In the last two rows, the small chair by the wall and the door are correctly recognized by our model.
| beam | board | bookcase | ceiling | chair | clutter | column | door | floor | sofa | table | wall | window |
|
 |
 |
 |
|---|---|---|---|
|
 |
 |
 |
|
 |
 |
 |
|
 |
 |
 |
| RGB Input | Baseline | Ours | Ground Truth |
| wall | floor | chair | door | table | pictu. | furni. | objec. | windo. | sofa | bed | sink | stairs | ceil. | toilet | mirror | show. | batht. | count. | shelv. |
|
 |
 |
 |
|---|---|---|---|
|
 |
 |
 |
|
 |
 |
 |
|
 |
 |
 |
|
 |
 |
 |
| RGB Input | Baseline | Ours | Ground Truth |
C.3 Analysis on 360BEV-Stanford
We further introduce the qualitative results of 360BEV task on the 360BEV-Standford dataset in Fig. 11. The RGB input, the BEV semantic mapping results of the baseline and 360 Mapper, the BEV semantic mapping ground truth are depicted from left to right, where the color map is shown at the top of Fig. 11. The chairs of the first and the second sample are correctly predicted by our method while they are partially or entirely missed by the baseline. Compared with the 360Mapper, the baseline shows more false prediction especially regarding some furniture, e.g., the false predicted bookcase at the third sample, which should be predicted as chairs. At the last row of Fig. 11, the challenging door is not recognized by the baseline model, while our 360Mapper can provide accurate door segmentation result, even it is a thin line in the BEV map. Our method shows overall superior performance on the proposed task compared with the baseline in terms of the semantic segmentation performance on small objects, which further illustrates the strength by using 360Attention.
C.4 Analysis on 360BEV-Matterport
Fig. 12 presents qualitative results for the 360BEV task on the 360BEV-Matterport dataset. We observe that our 360Mapper outperforms the baseline method Trans4Map [6] in terms of accurately segmenting small objects. In particular, the baseline method exhibits more false predictions, such as the misclassified chair in the first sample and object misidentified as table in the second sample. Surprisingly, the different steps of stairs in the third and the fourth sample are recognized correctly by both methods. However, we find the fifth sample to be particularly challenging, as both the baseline and our 360Mapper recognize the object in the center of the image as a counter, which is a table as shown in the ground truth. This failure case shows the difficulty of accurately distinguishing between similar object categories from the context of panoramic images to the bird’s-eye-view semantic maps.
| void | beam | board | bookcase | ceiling | chair | clutter | column | door | floor | sofa | table | wall | window |
|
 |
 |
 |
|---|---|---|---|
|
 |
 |
 |
|
 |
 |
 |
|
 |
 |
 |
| RGB Input | Baseline | 360Mapper | Ground Truth |
| void | wall | floor | chair | door | table | pictu. | furni. | objec. | windo. | sofa | bed | sink | stairs | ceil. | toilet | mirror | show. | batht. | count. | shelv. |
|
 |
 |
 |
|---|---|---|---|
|
 |
 |
 |
|
 |
 |
 |
|
 |
 |
 |
|
 |
 |
 |
| RGB Input | Baseline | 360Mapper | Ground Truth |