FAR-ULTRAVIOLET SPECTROSCOPY OF ACTIVE GALACTIC NUCLEI WITH ASTROSAT/UVIT
Abstract
We study accretion disk emission from eight Seyfert active galactic nuclei (AGN) using far ultra-violet ( Å) slit-less grating spectra acquired with AstroSat/UVIT. We correct for the Galactic and intrinsic extinction, contamination from the host galaxies, narrow and broad-line regions, Fe II emission and Balmer continuum, and derive the intrinsic continua. We use HST COS/FOS spectra to account for the emission/absorption lines in the low-resolution UVIT spectra. We find generally redder power-law () slopes () in the far UV band than predicted by the standard accretion disk model in the optical/UV band. We fit accretion disk models such as the multi-temperature disk blackbody (DISKBB) and relativistic disk (ZKERRBB, OPTXAGNF) models to the observed intrinsic continuum emission. We measure the inner disk temperatures using the DISKBB model for seven AGN. These temperatures in the range are lower than the peak temperatures predicted for standard disks around maximally spinning super-massive black holes accreting at Eddington rates. The inner disks in two AGN, NGC 7469 and Mrk 352, appear to be truncated at and , respectively. While our results show that the intrinsic FUV emission from the AGN are consistent with the standard disks, it is possible that UV continua may be affected by the presence of soft X-ray excess emission, X-ray reprocessing, and thermal Comptonisation in the hot corona. Joint spectral modeling of simultaneously acquired UV/X-ray data may be necessary to further investigate the nature of accretion disks in AGN.
1 Introduction
The large luminosity (; Ho 1999; Woo & Urry 2002; Duras et al. 2020) observed from active galactic nuclei (AGN) is thought to arise due to the accretion of matter, in the form of disks, onto supermassive black holes (SMBHs) at the centers of active galaxies. Luminous AGN are thought to host radiatively efficient standard accretion disks that are geometrically thin and optically thick (see e.g., Koratkar & Blaes, 1999; Netzer, 2013). The standard disk model, also known as the disk model, describes the accretion flow onto black holes and predicts the emission spectrum from geometrically-thin and optically-thick accretion disks (Shakura & Sunyaev, 1973; Novikov & Thorne, 1973). According to the standard disk model, each annulus of the disk emits as a blackbody with temperature varying as a function of radius () and the spectrum of the entire disk varying as in the optical/UV band of AGN emission.
Observationally, the big blue bump (BBB) emission in the optical/UV band is believed to be arising from the accretion disks in AGN, thus providing a direct probe of the accretion flow. A number of studies have investigated the optical/UV spectral shape and found varying spectral slopes in different AGN.
| Sources | Redshift | B | N | (ref) | ||
|---|---|---|---|---|---|---|
| () | () | |||||
| Mrk 841 | (1) | |||||
| MR 2251–178 | (2) | |||||
| PG 0804+761 | (3) | |||||
| NGC 7469 | (4) | |||||
| I Zw 1 | (5) | – | ||||
| SWIFT J1921.1–5842 | (6) | |||||
| Mrk 352 | (2) | |||||
| SWIFT J1835.0+3240 | (7) |
† The Galactic H I column density (NH) obtained from the NH calculator available at the HEASARC website https://heasarc.gsfc.nasa.gov/cgi-bin/Tools/w3nh/w3nh.pl.
†† Black hole masses are taken from (1) Vestergaard & Peterson (2006), (2) Winter et al. (2012), (3) Bentz & Katz (2015), (4) Peterson et al. (2004), (5) Wilkins et al. (2021), (6) Wang & Zhang (2007) and
(7) Marchesini et al. (2004).
††† Swift BAT X-ray flux in units of and in the band.
is calculated using Eq. 6.
O’Brien et al. (1988) found the UV slope () of 81 quasars varying from to with a median value of using the International Ultraviolet Explorer (IUE) observations in the Å band. They found the ultraviolet continuum to become harder with increasing redshift. Francis et al. (1991) accounted for Fe II emission and Balmer continuum, and found the median in the Å band for their sample of 718 quasars observed with the Multiple Mirror Telescope (MMT) and Du Pont Telescope at Las Campanas Observatory. Using the Hubble Space Telescope, Zheng et al. (1997) found the UV slope for their composite spectrum of 101 quasars in the Å band. In the sample of 220 AGN in Kuraszkiewicz et al. (2003), the UV continuum slope has a large scatter varying from to . All these results show that quasars have different spectral slopes which are redder than that predicted from the standard disk model. However, a number of effects can alter the observed continuum slopes.
AGN are embedded in their host galaxies, the emission from the accretion disks is not resolved, and not well separated from the host galaxies. The intrinsic emission from the accretion disks is subjected to contamination by the host galaxy emission, complex Fe II emission, Balmer continuum, and emission lines from the broad and narrow line regions. Additionally, the disk emission suffers reddening due to the host galaxy as well as our own Galaxy. These effects altogether can modify the disk spectra substantially. Theoretical models of accretion disks can only be tested with the intrinsic continuum spectra after accounting for the various effects.
The inner regions of accretion disks can be probed by using the broad, relativistic Fe line observed near in the X-ray spectra of AGN. The line is thought to arise due to the reflection of coronal X-rays irradiated onto the disk (see e.g., Laor, 1991; Tanaka et al., 1995; Fabian et al., 2000). The broad iron line can be used to probe the ionization state, special/general relativistic effects and the line emissivity profile of the disk, and to measure the inner edge of the disk and thereby the black hole spin. However, the broad iron line cannot be used to probe the temperature profile of the disk that can be used to test predictions of the standard disk models. Thus, the study of the intrinsic continuum emission in the optical/UV band remains the best way to probe the nature of accretion disks in AGN.
In this paper, we study intrinsic accretion disk emission from eight Seyfert type 1 AGN based on observations performed with the AstroSat mission. Here we study the intrinsic far UV continuum emission using slit-less grating spectra, and in a future paper, we aim to study UV/X-ray broadband spectra. The general properties of the sources are listed in Table 1. These AGN are nearby with redshifts and cover a range of black hole masses . The limited bandwidth ( Å) and low resolution of the slit-less grating spectra make it difficult to separate the emission/absorption lines and the continuum emission. We, therefore, make use of the available HST data for seven out of eight AGN from the HST archive to identify the emission/absorption lines. We organize our paper as follows. We describe our AstroSat observations and data reduction in Section 2; HST spectra in Section 3; spectral complexities in Section 4; spectral analysis and results in Section 5. We discuss our results in Section 6, followed by conclusions in 7. Unless otherwise mentioned, we assumed the cosmological parameters, , to calculate the co-moving radial distances of the sources.
| Sources | Obs. ID | Instrument | Date of Obs. | Exposure time | Count rate |
|---|---|---|---|---|---|
| (ks) | (counts s-1) | ||||
| Mrk 841 | A09_008T05_9000003724 | UVIT/FUV-G1 | 2020-06-18 | 5.8 | |
| UVIT/FUV-G2 | 2020-06-19 | 6.0 | |||
| LC8Y15010 | HST/COS 130M/1291 | 2014-07-06 | 1.7 | ||
| LC8Y15020 | HST/COS 160M/1600 | 2014-07-06 | 2.4 | ||
| MR 2251-178 | A04_218T03_9000002214 | UVIT/FUV-G1 | 2018-07-09 | 5.2 | |
| Y3AI2006T | HST/FOS 130H | 1996-08-02 | 2.3 | ||
| Y3AI2007T | HST/FOS 190H | 1996-08-02 | 2.3 | ||
| PG0804 | G07_062T01_9000001560 | UVIT/FUV G2 | 2017-09-25 | 4.1 | |
| G07_062T01_9000001560 | UVIT/NUV Grating | 2017-09-25 | 4.0 | ||
| LB4F08030 | HST/COS 130M/1291 | 2010-06-12 | 1.6 | ||
| LB4F08080 | HST/COS 160M/1623 | 2010-06-12 | 1.6 | ||
| NGC 7469 | G08_071T02_9000001620 | UVIT/FUV-G1 | 2017-10-18 | 3.4 | |
| UVIT/FUV-G2 | 2017-10-18 | 4.0 | |||
| UVIT/FUV-Silica | 2017-10-18 | 45 | |||
| Y3B60106T | HST/FOS 130H | 1996-06-18 | 2.2 | ||
| Y3B60107T | HST/FOS 190H | 1996-06-18 | 1.6 | ||
| I Zw 1 | A10_101T02_9000004084 | UVIT/FUV G2 | 2020-12-26 | 4.8 | |
| LCKR02030 | HST/COS 130M/1309 | 2015-01-21 | 1.9 | ||
| LCKR01020 | HST/COS 130M/1327 | 2015-01-20 | 0.9 | ||
| LCKR01050 | HST/COS 160M/1589 | 2015-01-20 | 2.5 | ||
| SWIFT1921 | A04_218T08_9000002236 | UVIT/FUV-G1 | 2018-07-17 | 5.7 | |
| UVIT/FUV-G2 | 2018-07-18 | 5.4 | |||
| LC1202010 | HST/COS 130M/1309 | 2012-11-20 | 2.2 | ||
| LC1202020 | HST/COS 160M/1589 | 2012-11-20 | 2.0 | ||
| Mrk 352 | A09_008T06_9000003748 | UVIT/FUV-G1 | 2020-06-30 | 5.3 | |
| UVIT/FUV-G2 | 2020-07-01 | 6.2 | |||
| LCXV07060 | COS 130M/1327 | 2016-07-20 | 1.7 | ||
| LCXV07070 | COS 160M/1589 | 2016-07-20 | 2.2 | ||
| SWIFT1835 | A04_218T04_9000002086 | UVIT/FUV-G1 | 2018-05-10 | 3.2 | |
2 AstroSat/UVIT Observations and Data Reduction
AstroSat is a multi-wavelength space observatory (Singh et al., 2014). It carries four co-aligned and simultaneously-operating instruments – the Ultraviolet Imaging Telescope (UVIT) (Tandon et al., 2017, 2020), the Soft X-Ray Telescope (SXT) (Singh et al., 2016, 2017), the Large Area X-ray Proportional Counters (LAXPC) (Yadav et al., 2016; Antia et al., 2017) and the Cadmium-Zinc-Telluride Imager (CZTI) (Vadawale et al., 2016). In this paper, we utilized the data acquired with the UVIT only as our aim is to study the intrinsic continuum emission from the AGN disks.
The UVIT consists of twin telescopes. One of them is sensitive in the far ultraviolet ( Å) band and is referred to as the FUV channel. The light from the second telescope is split into near ultraviolet ( Å) and visible ( Å) bands, forming the NUV and VIS channels, respectively. The VIS channel is mainly used for tracking satellite pointing, while the FUV and NUV channels are used for scientific observations. Both FUV and NUV channels are equipped with a number of broadband filters. The UVIT has excellent spatial resolution with a point spread function (PSF) in the range of . The UV images are obtained in photon counting mode at a rate of 28 frames s-1 in the full window mode.
In addition, the FUV channel is equipped with two slit-less gratings, FUV-Grating1 and FUV-Grating2 (hereafter FUV-G1 and FUV-G2), and the NUV channel carries a single slit-less grating, referred as the NUV-Grating (hereafter NUV-G). The two FUV gratings are oriented orthogonal to each other to avoid possible contamination along the dispersion direction due to the presence of neighboring sources in the dispersed image. More details on the performance and calibration of the UVIT gratings can be found in Dewangan (2021).
The peak effective area of FUV-G1 and FUV-G2 in the order are at Å and at Å, respectively. The NUV grating has a peak effective area of ( Å) in the order. The spectral resolution for the FUV gratings in the order is FWHM Å and that for the NUV grating in the order is Å. The NUV channel stopped functioning in 2018 March (Ghosh et al., 2021).
We obtained level1 UVIT data for the eight sources: Mrk 841, MR 2251–178, PG 0804+761 (hereafter PG0804), NGC 7469, I ZW 1, SWIFT J1921.1–5842 (hereafter SWIFT1921), Mrk 352 and SWIFT J1835.0+3240 (hereafter SWIFT1835) from the AstroSat data archive 111https://astrobrowse.issdc.gov.in/astro_archive/archive/Home.jsp (see Table 2). We list the available UVIT grating data sets in Table 2. Only FUV-G1 data are available for MR 2251–178 and SWIFT1835 while only FUV-G2 data are available for I ZW 1 and PG0804. NUV grating data are available only for PG0804. We processed the level1 UVIT data using the CCDLAB (Postma & Leahy, 2017) pipeline software. The CCDLAB extracts scientifically useful data for each of the orbits. To correct for the drift of the satellite pointing, we generated drift series (X, Y shifts relative to the reference (first) frame as a function of time) for bright point sources using images acquired with the VIS channel. We then applied the mean drift series (mean X, Y shifts as a function of time) to the FUV/NUV centroid lists. The individual orbit-wise images and the centroid lists obtained after the drift corrections are not co-aligned. We used the registration task available within the CCDLAB that uses two or more point sources to register the centroid lists in different frames into a common frame. Finally, we merged the co-aligned data to obtain a single science image with a greatly improved signal-to-noise ratio. Along the spatial direction in the dispersed images, one pixel corresponds to on the sky. The final grating images of our sources are shown in Fig. 1.
We identified the zero-order positions of our target sources by comparing the patterns of zero-order positions of sources with the available SWIFT/UVOT or GALEX images. We then identified grating orders for our sources and then proceeded with spectral extraction. In addition to the grating images, we processed the available FUV broadband filter (FUV–Silica: Å with Å, FUV–Sapphire: Å with Å) images.
For the spectral extraction, we followed the procedures and tools described in Dewangan (2021). We located the zeroth order of the source of interest in the grating image. The dispersion axes of the gratings are not aligned exactly with the X (FUV-G1) or Y (FUV-G2) axis in the grating images. We calculated the angle of the dispersion axis with respect to the X (FUV-G1, NUV-G) or Y (FUV-G2) image axes. This angle is used to find the centroids along the spatial direction at each pixel along the dispersion direction for the desired order ( for FUV gratings, for NUV-G). We used a 50-pixel width along the cross-dispersion direction and extracted the FUV and NUV grating PHA spectral data in the and orders, respectively, and the associated response matrices as described in Dewangan (2021). We used a similar procedure and extracted background spectra from nearby source-free regions corresponding to each source spectrum. We list the background-subtracted net source count rates for FUV gratings in the order or NUV-G in the order in the last column of Table 2. The exposure time for gratings varies from . The background-subtracted net count rate in FUV gratings varies from . We used Sherpa version (Freeman et al., 2001, 2011) for the spectral analysis of all the sources. We also generated the fluxed spectra using the same extraction parameters mentioned above by applying the wavelength and flux calibration described in Dewangan (2021). We show the fluxed FUV grating spectra of the eight AGN in Figure 2.
3 The HST Spectra
We also used high-resolution UV spectra acquired with the HST’s Cosmic Origin Spectrograph (COS; Green et al. 2011) and the Faint Object Spectrograph (FOS; Keyes et al. 1995). We obtained the COS spectra for the sources Mrk 841, PG0804, I Zw 1, SWIFT1921 and Mrk 352 from the archive (https://archive.stsci.edu/hst/search.php). We used FOS spectra of MR 2251-178 and NGC 7469 from Kuraszkiewicz et al. (2004) (http://hea-www.harvard.edu/~pgreen/HRCULES.html). We did not find HST spectra for SWIFT1835. We list the available HST observations in Table 2.
The HST/FOS can cover a wide wavelength range of Å with high and low-resolution gratings. We used FOS spectra acquired with the high resolution gratings G130H ( Å) and G190H ( Å) with spectral resolution for MR 2251–178 and NGC 7469. The largest circular aperture size is in diameter. We have used spectra acquired with two COS medium resolution gratings, G130M ( Å) and G160M ( Å). The spectral resolution for these medium resolution gratings is . The field of view for COS is in diameter. For each of the COS gratings, there are two segments – FUVA and FUVB, due to a gap in the active area. The gaps are about Å (G130M) and Å (G160M).
Due to high spectral resolution, COS is widely used for absorption and emission line studies. Tilton & Shull (2013) used COS data for 44 AGN including NGC 7469 and PG0804 to derive intrinsic absorption, broad emission/absorption line widths and inferred a rough estimate of black hole masses. In a sample of 159 AGN observed with the HST/COS, Stevans et al. (2014) reported the spectral indices () of (MR 2251–178), (PG0804), (NGC 7469). They estimated the continuum slope in the line free narrow windows above Å.
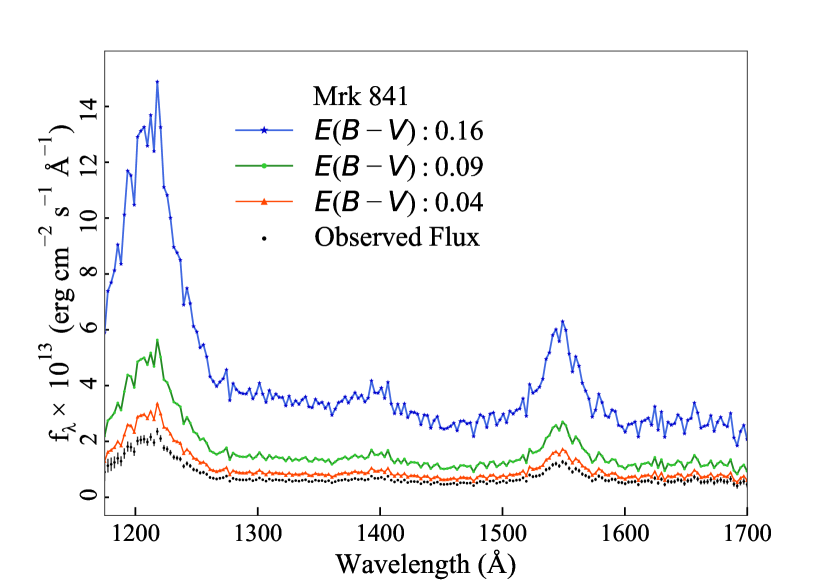
We compared the COS/FOS and UVIT spectra of our sources in Figure 2. The differences in flux measured with UVIT gratings and COS/FOS (e.g., Mrk 841) are due to the variability of the AGN as the two spectrographs are well flux-calibrated. Mrk 841 has been found to be highly variable in X-rays (Nandra et al., 1995; George et al., 1993) as well as in the UV (Miranda et al., 2021). The emission lines and the continuum shapes appear to match well. We find a slight discrepancy in the shapes of emission lines, particularly the C IV Å line, possibly due to the differences in the spectral resolutions, presence of narrow absorption lines not resolved in the UVIT spectra, and/or inaccuracies in the wavelength calibration. The main purpose of our study is to derive the far UV continuum shapes after accounting for the emission lines in terms of Gaussian profiles, therefore, we ignore possible errors in the line positions. Using the HST spectra, we measure the emission/absorption line parameters, and then we use these line parameters while performing UVIT spectral analysis.

4 Spectral Complexities
As mentioned in Section 1, the observed UV spectra of AGN are affected with () Galactic and intrinsic reddening, () host galaxy contribution, () Balmer continuum, () Fe II emission and () emission/absorption lines from the BLR and NLR. Below we describe these effects and the ways to correct them.
4.1 Host Galaxy Contamination
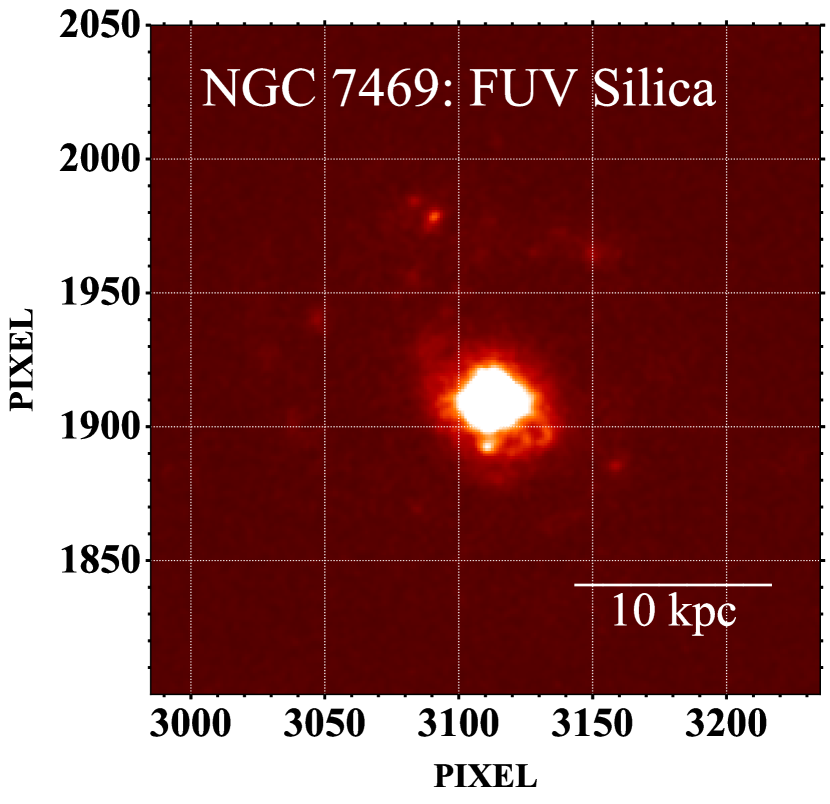
AGN are embedded into their host galaxies. Naturally, the diffuse emission due to the presence of hot stars, H II regions, supernovae remnants, etc. in the central regions of host galaxies can contribute to the observed UV emission. In our sample, all the sources except NGC 7469 are point-like objects. Figure 3 shows the UVIT image of NGC 7469 in the FUV-Silica filter. Clearly, the diffuse UV emission from the host galaxy in addition to the bright nuclear emission is detected. To find out the host galaxy contribution, first, we measured the instrument’s point spreading function (PSF). For this purpose, we generated the radial surface brightness profile of a star BPS CS 29521–0036 (, ) which is located away from the source. Following Dewangan et al. (2021), we fitted the radial profile with a Moffat function,
| (1) |
where the full width at half maximum (FWHM) is defined as . We used a constant model to fit the background. The best-fit Moffat function with FWHM provides the PSF of the instrument. Then, we used this Moffat function i.e. the PSF, to fit the AGN radial profile. We kept the parameters and fixed at the best-fit values derived for the star above. This component accounts for the AGN emission. Around from the nucleus we noticed a large excess after using Moffat and a constant model for the background. This is due to one of the starburst regions observed at radius . We used a Gaussian profile to account for this. For the host galaxy contribution, we used an exponential profile
| (2) |
The integrated galactic emission is of the total emission (AGN+host galaxy) within radius. We followed the same procedure for one of the point-like AGN, Mrk 841. The integrated galactic emission within radius is of the total emission. Therefore, we conclude that the host galaxy contribution is not substantial in the case of NGC 7469 or the point like AGN, and we do not make any corrections for such small contributions.
4.2 Intrinsic reddening
The dust grains in the circumnuclear regions as well as in the ISM of the host galaxy can cause extinction to the AGN emission. The extinction generally rises steeply from the optical to UV bands, thus making the UV band much more susceptible to extinction. A precise extinction correction is important to recover the intrinsic UV spectral slope of AGN (Koratkar & Blaes, 1999). However, the amount of intrinsic extinction is generally poorly known due to the lack of knowledge on the chemical composition and sizes of dust grains and molecules which are most likely dissimilar to that in our Galaxy as the physical conditions in the AGN hosts are quite different than that in our own galaxy.
Fortunately, type 1 AGN are generally devoid of strong intrinsic extinction, and the wavelength dependence of the extinction can be characterized with empirical relations. Czerny et al. (2004) used five composite SDSS spectra of quasars from Richards et al. (2003), and derived the extinction curve. They assumed, the bluest composite spectrum to be unaffected by dust while the other composite spectra differed only due to the dust reddening. Using these composite spectra, they obtained an empirical relation for the intrinsic extinction,
| (3) |
where, ranges from 1.5 to 8.5 . The Balmer decrement, i.e., the ratio of and line fluxes has long been used as a reddening indicator. The color excess can be written in terms of the Balmer decrement as follows (see e.g. Domínguez et al., 2013).
| (4) |
where and are the extinction curves evaluated at and wavelengths, respectively. As shown by Gaskell (2017), the broad line ratio for the optically blue AGN at low redshifts is . We have used this value as the intrinsic ratio . We then used the extinction curve of Czerny et al. (2004) as given in Eq. 3 and the color excess based on the observed Balmer decrement (Eq. 4) and created a spectral model for the spectral fitting package Sherpa. The model parameters are redshift and Balmer decrement. This model calculates the extinction which is then used to calculate intrinsic flux at the desired wavelength in the UV band
| (5) |
4.3 Fe II Emission
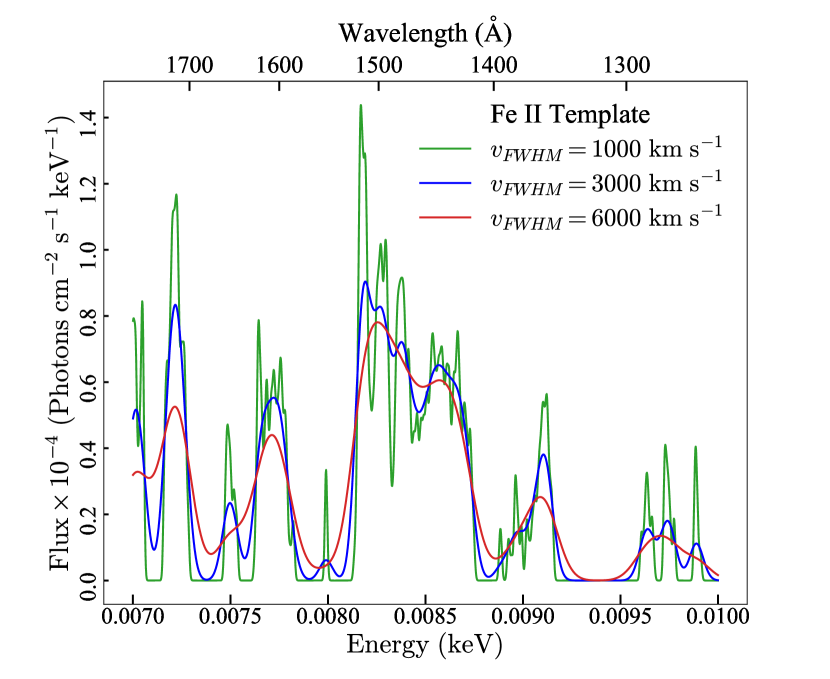
Type 1 AGN, particularly the narrow-line Seyfert 1s, exhibit strong Fe II emission in the wavelength range of Å. The Fe II complex is created by thousands of electronic transitions of Fe II ions in the BLR. Due to the Doppler broadening, these lines overlap with each other giving rise to a pseudo-continuum. To account for the Fe II complex, we used the Fe II template generated using I Zw 1 by Vestergaard & Wilkes (2001) and, created a spectral model for the Sherpa package. The parameters for this model are the redshift, the Gaussian for velocity broadening of individual lines, and a scaling factor to adjust the strength of the Fe II complex. Tilton & Shull (2013) have used this approach and studied the AGN continuum using HST/COS observations. The template has an intrinsic width of FWHM . The best-fitting for an AGN spectrum is the width of the Gaussian used to broaden the Fe II template that matches the Fe II emission in the AGN spectrum. Thus, , where . In Fig. 5, we show the effect of different broadening () on our model Fe II template spectrum with .
4.4 Galactic Reddening
The dust grains and molecules in the ISM of our own Galaxy contribute to the reddening of the optical/UV spectrum. We account for the Galactic reddening in the observed spectra of AGN by using the spectral model REDDEN (Cardelli et al., 1989) in Sherpa. This model has one parameter, the color excess . We estimated the color excess from the observed linear relation between the Hydrogen column density in and the extinction in magnitude (Güver & Özel, 2009):
| (6) |
with .
4.5 Balmer Continuum
The Balmer continuum emission in the wavelength range of Å arising from BLR contributes to the intrinsic continuum. For optically thin emitting region at a fixed electron temperature, the Balmer continuum emission is given by (Grandi, 1982)
| (7) |
where, is the flux at Balmer edge , is electron temperature and is Planck constant. is theoretically at wavelength Å. We modeled this spectral component using the function given by Equation 7. We generated a spectral model for the Balmer continuum within the Sherpa package. The parameters of this model are redshift, amplitude and electron temperature. We used this model component convolved with the XSPEC (Arnaud, 1996) model GSMOOTH (Gaussian smoothing) for the NUV-Grating spectrum available only for PG0804.
5 Spectral analysis
The slit-less UVIT gratings are useful for low-resolution spectroscopy (FWHM ) in a limited wavelength band (FUV: Å, NUV: Å). The width of the emission lines from the NLR are typically whereas the BLR emission line widths range from to . The absorption lines are generally narrow with typical FWHM of the order of a . Thus, the poor spectral resolution of UVIT gratings may not allow for the separation of the emission and absorption lines. This may affect the measurement of continuum emission as our spectral window is populated with prominent broad and narrow emission/absorption lines. In order to separate the discrete features and to measure the continuum shape reliably, we made use of the high resolution (FWHM(FOS); FWHM(COS)) HST spectra. We first measure the emission/absorption lines in the HST spectra and use the measured line widths and positions to fit the UVIT grating spectra. For our spectral fitting, we used the Sherpa package developed for the Chandra X-ray observatory. We used statistics to find the best fit and calculated errors on the best-fit parameters at the confidence level.
5.1 COS/FOS Spectral Analysis
We first converted the fluxed HST spectra into PHA spectral data and diagonal response using the ftflx2xsp tool available within the HEASOFT package. This allowed us to treat the HST and the UVIT spectral data in the same fashion. For each source, we used a common energy band for the UVIT/FUV and the HST data. We used a simple redshifted power-law (ZPOWERLAW) model for the underlying UV continuum in the observed spectrum. We reddened the continuum to account for the Galactic extinction using the REDDEN model component with a single parameter – the color excess (). We kept this parameter fixed at the values listed in Table 1. These values were calculated using Eq. 6. We also tested the model with the color excess calculated using the relation provided by Bohlin et al. (1978). We found that these color excesses generally resulted in inferior fits compared to those calculated from Eq. 6, which we continued to use in the subsequent analysis. Next, we added Gaussian components for the emission lines after inspecting the residuals. The most prominent lines observed are C IV Å, Si IV/O IV] Å, Ly Å and He II Å. For most of these broad emission lines, we used two Gaussian profiles – broad and narrow components. The line widths are of the order of few thousand , typical of the BLR lines. A few more emission lines are added if required which are, O III]/Al II Å, C II Å, O I/Si II Å, Si II Å, and N V Å (see Table 4 and 5).
In the case of MR 2251–178, we used three Gaussian lines for each of the C IV and Ly emission lines. One of the C IV lines is blue-shifted by Å in the source rest frame, indicating the possible presence of outflows. For Mrk 841 and SWIFT1921, we used a single component Gaussian emission line (N IV] Å) at Å and Å (FWHM), respectively. For I Zw 1, some of the emission lines (C II, N V and O I) are blue-shifted or red-shifted by Å. We list these additional weak emission lines of Mrk 841, MR 2251-178, SWIFT1921 and I Zw 1 in Table 6. We added the absorption lines, which further improved the fit significantly. We list the rest wavelength, observed energy, width, and strength for the absorption lines in HST spectra of six sources in Appendix Table A1 and A2.
Although the iron emission is weak in the FUV band, nevertheless, we tested for the presence of the Fe II complex. For all the sources except for MR 2251-178, Mrk 352 and SWIFT1835, the addition of this component improved the by more than 5 per degree of freedom (dof).
Next, we used the intrinsic reddening model, described in section 4.2, with the initial values of Balmer decrement set to those found from the literature which ranges from (see Table 3). If we fix the ratio at the values obtained from the literature, the fits worsened. Therefore, we left the parameter to vary and the fits improved significantly. We needed the intrinsic reddening only for two AGN – PG0804 and I Zw 1. We listed the best-fit values in Table 3. We calculated the errors on the best-fit Balmer decrements by fixing the emission and absorption line centroids at their best-fit values. In I Zw 1, the color excess calculated from the Balmer decrement is , which is slightly higher than that obtained using O I /O I line ratios (, Rudy et al. 2000).
NGC 7469 is known to host starburst regions around the AGN located at and from the center (Mauder et al., 1994; Mehdipour et al., 2018). For our wavelength range of interest and the spectral extraction region (both in the HST and UVIT spectra), we account for the contribution from the starburst regions by using a template spectrum. Kinney et al. (1996) have generated six starburst template spectra suitable for different extinctions such as (SB1), (SB2), (SB3), etc. We generated starburst template models using the starburst template spectra by introducing a single parameter – a normalization which is a multiplicative factor. We tested all the starburst template models from SB1 to SB6. Only SB3 resulted in a very marginal improvement with for an additional parameter. Mehdipour et al. (2018) also found the suitability of the SB3 template for NGC 7469. The spectral indices obtained in our analysis for MR 2251–178 and NGC 7469 are slightly different (see Table 7) than that obtained by Kuraszkiewicz et al. 2004 ( for MR 2251–178 and for NGC 7469). They derived the slope using line-free regions and for a wider band ( Å), while we fitted the continuum and the lines simultaneously in the narrower band. We also used slightly different values of for the Galactic reddening based on the updated relation between the Galactic column density and the extinction (Eq. 6). These differences in the analyses likely resulted in different spectral indices.
The spectrum of Mrk 352 showed the presence of extremely narrow emission lines in the observed frame at Å, Å and Å with FWHM in addition to the broad emission lines. These narrow emission lines observed at the exact position of O I Å triplet are highly unlikely to be related to the AGN, and could possibly be of the Galactic origin. We obtained the best-fit reduced for HST spectral fits in the range of (Mrk 352) to (NGC 7469). The poor quality of the fit to the spectrum of NGC 7469 is most likely due to absorption-like broad features at Å which are likely due to multiple narrow absorption lines of N V. We did not attempt to fit very weak features which are unlikely to affect continuum parameters significantly. We show the HST spectra and the corresponding best-fit models in the left panels of Fig. 6, 7 and 8.
5.2 UVIT Spectral Analysis
We started the fitting of UVIT grating data using the same set of parameters derived from the HST spectral analysis. Initially, we fixed all the parameters except the normalization and photon index of ZPOWERLAW. We used a multiplicative constant factor for scaling the emission line fluxes. This allowed us to preserve the line ratios obtained from the HST data. We also used another constant factor to account for any difference in cross-calibration between the UVIT/FUV-G1 and FUV-G2. We fixed the color excess parameter for the Galactic reddening model REDDEN as in the case of HST spectral fitting. We also fixed the Balmer decrement parameter in the intrinsic reddening model for AGN unless mentioned otherwise. First, we varied the emission line scaling factor, the constant factor between the two gratings and the power-law slope. If we see strong residuals near emission lines or the fit is statistically not acceptable, we allowed to vary line centroids and/or widths and check the improvement in the fit. Thus we accounted for any change in the power-law continuum and the emission lines which might have occurred since the HST and UVIT observations were non-simultaneous, and the type 1 AGN are known to exhibit spectral variability in the UV band (Reichert et al., 1994; O’Brien et al., 1998; Peterson & Wandel, 1999; Wang et al., 2011; Miranda et al., 2021).
Once we finalized the spectral fits with the redshifted power-law (ZPOWERLAW) component, we used the following accretion disk models (in place of the ZPOWERLAW component) for the continuum emission from each AGN.
Below we describe the spectral analysis for individual sources.
5.2.1 Mrk 841
We fitted both FUV-G1 and FUV-G2 spectra jointly. Part of the Ly line falls around the edge of the spectrum at . Therefore, we removed the entire Ly line region from the spectrum, which resulted in our analysis region of (see Fig. 6(b)). We varied the emission line scaling factor, redshifted power-law normalization and the photon index. This resulted in for dof. Then we varied the widths and the centroids of C IV emission lines. This improved the fit to . We obtained the best-fit photon index, (Table 7) and the emission line scaling factor, (Table 4).
The UV continuum emission is thought to arise from the accretion disks in AGN. We first tested the simple multi-color accretion disk model, DISKBB (Mitsuda et al., 1984). This model assumes a geometrically thin disk with each annulus emitting like a blackbody at the local temperature. The resulting spectrum consists of a superposition of multiple blackbody components with the highest temperature corresponding to the innermost disk. It does not consider the relativistic effects of the extreme gravity near the black hole. We convolved the DISKBB component with the ZASHIFT to derive the emission in the source rest frame. This model provided with the inner disk temperature () of .
Next, we considered a fully relativistic accretion disk model ZKERRBB (Li et al., 2005). This uses a ray tracing method for photon trajectory in each annulus. The disk is divided into a number of image elements. The orbit of the photon from each element is traced backward from the observer to the plane of the disk. Considering all the relativistic effects, individual flux density at each element is summed over all elements to obtain the observed flux density. For black holes with mass , the hardening factor is estimated to be (Done et al., 2012). We have considered isotropic emission from the disk, such that the limb darkening effect is not included. Also, we assumed zero torque at the inner boundary. We varied only the inclination, mass accretion rate, and normalization and performed the fit. We considered two cases of the spin parameter (): 0 and 0.998. As the inclination angle is not well constrained, we tested the model for a fixed inclination angle, . Nandra et al. (1997) estimated inclination angles of and based on X-ray reflection spectroscopy for two sets of observations made in 1993 and 1994 using ASCA. Keeping the inclination fixed at the lower end, i.e., 20∘ resulted in and mass accretion rate of for . The normalized mass accretion rate ( ) is with and with . The best-fit parameters are listed in Table 7.
Many AGN are known to show excess emission in the soft X-ray band below which could arise due to thermal Comptonization in the inner disk region. In such a scenario the standard disk is likely truncated at some radius () larger than the innermost stable circular orbit (ISCO). For disk emission is modified black body spectrum. This is described by OPTXAGNF (Done et al., 2012) available in XSPEC. We used this model to obtain the disk contribution only by making negative. This model utilizes the temperature profile of a relativistic accretion disk but unlike the ZKERRBB model, it does not consider the general relativistic effects on photon propagation. Again, we used two cases with spin parameter, and . We obtained for the . The best-fit Eddington ratio () is . For the non-rotating case, the fit resulted in . The in this case is . Although the OPTXAGNF model generates the accretion disk model by setting the negative, some fraction of the accretion power also goes to the warm and hot comptonization component. Therefore we extrapolated the model from and calculated the disk luminosity () by integrating the model. The Eddington ratios are, for and for . The difference in the between the two disk models ZKERRBB and OPTXAGNF arises largely due to the variation in the color-correction factor (). In the case of ZKERRBB model, this factor is fixed at 2.4 at all radii, whereas, in the case of OPTXAGNF model, it varies from 1 to a higher value () depending on the local effective disk temperature () as follows (see Done et al., 2012),
| (8) |
5.2.2 MR 2251–178
After varying the simple power-law index, normalization, and scaling factor to the emission lines and emission line centroids, some residuals still remained which could be due to additional emission lines. To account for these residuals, we added an emission line at Å (N V Å) which was not detected in the HST spectrum (Table 4). This improved the by 62 for three additional parameters. Further, we added one more line near the C IV region at Å (C IV Å) which resulted in for three additional parameters. The FWHM and line normalization of C IV are 3861 and , respectively. The best-fit model consisting of redshifted power-law and emission lines resulted in (Fig. 7(b)) with and the scaling factor for the emission lines, . The DISKBB model resulted in with the best-fit inner disk temperature of . This is lower than that derived () for the HST/COS observation performed in 2020 (Mao et al., 2022). The disk temperature can vary depending on the accretion rate and thereby the disk luminosity. As discussed below, we obtained nearly five times lower accretion rate than that derived by Mao et al. 2022 (). In the relativistic accretion disk model ZKERRBB with and normalization as free parameters, we could not constrain the and . Brunner et al. (1997) estimated an inclination angle of 70∘ by fitting the standard disk model to the IUE and ROSAT data. A recent study using X-ray reflection suggested that the inclination angle is (Nardini et al., 2014).
We obtained the (= 0.998) and () for inclination angle, . For = 0, we obtained and (). With the fit worsened by . We obtained with OPTXAGNF for both the spin cases. The model integrated Eddington ratios are, ( ) and (). We obtained the inner disk to be truncated at a radius , which indicates the may be close to 1. This is apparent from the best-fit model with ZKERRBB as continuum component where the worsened by .
5.2.3 PG 0804+761
We fitted both FUV and NUV spectral data jointly. We used the same set of parameters derived from the COS data for the FUV grating and varied the power-law components, the and line centroids of emission lines. As there are no HST spectra available in the NUV band ( Å), we added emission lines in the NUV band as required by the data and using Berk et al. (2001) for line identification. First, we added Si III] Å which resulted in of for 3 parameters. We allowed the line centroid to vary within the range provided by Berk et al. (2001) and fixed it to the best-fit value. The centroid (rest wavelength), FWHM and the normalization of Si III] emission line are 1896.5 Å, and , respectively. Though the COS data did not show Fe II emission, we tested for the presence of Fe II complex in the entire FUV to NUV band. The addition of this component improved the statistic by for one parameter. We fixed the sigma at due to the poor spectral resolution of UVIT. We further added an emission line for Si II/[Ne III] Å at 1818 Å that resulted in the of . The FWHM and the line normalization are and , respectively. Addition of another emission line for [Ne IV] Å at Å further improved the fit ( of ) for three additional parameters. The FWHM and the line normalization are and , respectively. Finally, to account for an excess near Å, the addition of an emission line due to Fe III Å improved the statistic by for three additional parameters. The FWHM and the line normalization are and , respectively. Some of these lines may have broadened due to the emission from Fe III around this region. We fixed the widths and line centroids of NUV emission lines at the best-fit values in subsequent analysis. We did not detect the emission from the Balmer continuum ( Å) as the fit did not improve after adding this model. The best-fit parameters are shown in Table 4 and 7. We obtained the final with (see Fig. 7(d)). With DISKBB the fit worsened by with the and inner disk temperature () of . Jiang et al. (2019) estimated an inclination angle, based on X-ray reflection spectroscopy. The ZKERRBB with provided = 616/332 () and 558/332 (). We found () for and 7.4 () for .
As we have wider wavelength coverage for this source, we varied and keeping the normalization fixed at 1. As the temperature estimated by DISKBB is somewhat low for a maximally spinning black hole (see Fig. 12), we expect the to be close to 1. With fixed at 1, for , we obtained = 464/331 with and . For , we obtained = 455/331 with and . Fixing the to 2.4 affected the much more than for other sources (e.g., Mrk 841, NGC 7469 or Mrk 352) since the NUV emission region would be lying farther away from the SMBH and thereby, at a much lower temperature than . Therefore, the worsening of fit with the ZKERRBB model as compared to the DISKBB model can be attributed to the high . The OPTXAGNF model resulted in = 432/331 ( = 0.998) and 440/331 ( = 0) and the Eddington ratios are, ( 0.998) and ( 0). The 0.998 resulted in a better fit for both the continuum models, OPTXAGNF and ZKERRBB which indicates the SMBH is likely to be associated with high spin (Piotrovich et al., 2020; Jiang et al., 2019).
5.2.4 NGC 7469
We varied the amplitude of the starburst template model as the UVIT spectral extraction region will have a contribution from both the starburst rings (see Fig. 3) while the HST/FOS aperture ( diameter) includes only the inner ring. Varying the amplitude of the starburst template model resulted in an improved fit with of with a flux contribution of (fractional contribution of relative to the continuum) in the Å band. The best-fit model provided with (see Fig. 7(f)). The emission line scaling factor is . The best-fit model with the DISKBB as the continuum component resulted in with an inner disk temperature of . Using broadband UV/X-ray spectral data acquired with the IUE/RXTE in 1996, Petrucci et al. (2004) obtained the disk temperature, . They varied the Galactic extinction and obtained the using the extinction curve of Seaton (1979). Mehdipour et al. (2018) found a disk temperature of in their broadband SED modelling using HST/COS, Swift/UVOT, and Chandra observations in 2015. They used the line-free windows of COS as in their broadband modelling. Both Petrucci et al. (2004) and Mehdipour et al. (2018) used Comptonised accretion disk models where they approximated the disk emission as either the Wien tail or single temperature simple blackbody instead of multi-temperature disk blackbody. The other emission components such as the soft X-ray excess and primary X-ray continuum being produced as the Comptonisation of the blackbody emission may also be affecting the determination of the temperature. These differences in the accretion disk models and/or Galactic extinction, in addition to the higher flux () in the UVIT data as compared to the FOS data, may have resulted in different disk temperatures.
Using different methods e.g., Fe Kα line, BLR orientation, the inclination angle has been estimated to be , 24∘ to (Patrick et al., 2011; Nguyen et al., 2021). The ZKERRBB model with inclination angle fixed at resulted in () and (). The mass accretion rates are () and () for and , respectively. The OPTXAGNF model resulted in and for both the spin cases. This source also indicates truncation of disk at a radius () larger than ISCO.
5.2.5 I Zw 1
We obtained for the best-fitting power-law continuum with , and the emission lines scaling factor of (see Fig. 8(b)). The DISKBB model provided the with . The ZKERRBB model with an inclination angle of 42∘(Porquet et al., 2004) resulted in for both the spin cases. We obtained high relative accretion rates, for and 8.5 for . We obtained, () and (), in the case of OPTXAGNF model.
5.2.6 SWIFT J1921.1–5842
We obtained for a simple power-law model as the continuum with and (Fig. 8(d)). The addition of an intrinsic reddening model did not improve the fit, and, we did not include this component. The DISKBB model resulted in with best-fit , the upper limit could not be constrained as the BBB peak lies far away from our FUV band and in the unobservable part of the SED.
With the ZKERRBB as continuum component, we obtained for and for with inclination angle set to 30∘ estimated previously by Gondoin et al. (2003). The normalized mass accretion rate, for and for . We obtained for with OPTXAGNF and for and the Eddington ratios are, () and ().
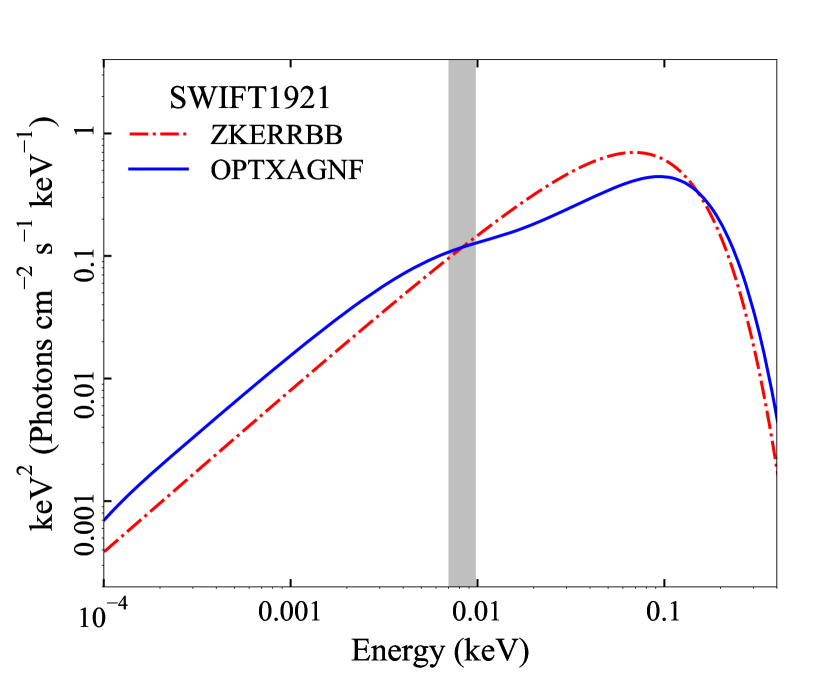
We obtained a large difference in between the OPTXAGNF and ZKERRBB models which is largely due to the variation in color-correction factor, . As the effective disk temperature rises with the decrease in radius and reaches to () at a certain radius, the FUV continuum slope changes sharply. This change occurring in the FUV band is shown in Fig. 9. It occurs due to the variation in as a function of local effective temperature as given by Eq. 8 (see also Figure 1 in Zdziarski et al. 2022). While in the ZKERRBB model, the slope remains almost constant up to due to the constant . As mentioned earlier, with the DISKBB model we obtained the peak disk temperature (, which is higher than the transition temperature, (see Eq. 8). Thus, the flattening of spectral slope due to the change in the alters the shape of the continuum in the UVIT band, leading to different values of for the ZKERRBB and OPTXAGNF models.
5.2.7 Mrk 352
For the simple power-law continuum, we obtained the final after varying the line widths and centroids of C IV line components in comparison to that obtained for the HST data (see Table 5 and Fig. 8(f)). After inspecting the residuals, we added a Gaussian line to account for the He II Å emission line. This resulted in with . The DISKBB model resulted in = 335/345 with . With ZKERRBB model, for (chosen arbitrarily) resulted in = 355/346 () and 353/346 () and () and 0.21 (). We obtained = 335/345 with OPTXAGNF for both the spin values and the Eddington ratios are, ( 0.998) and ( 0).
5.2.8 SWIFT J1835.0+3240
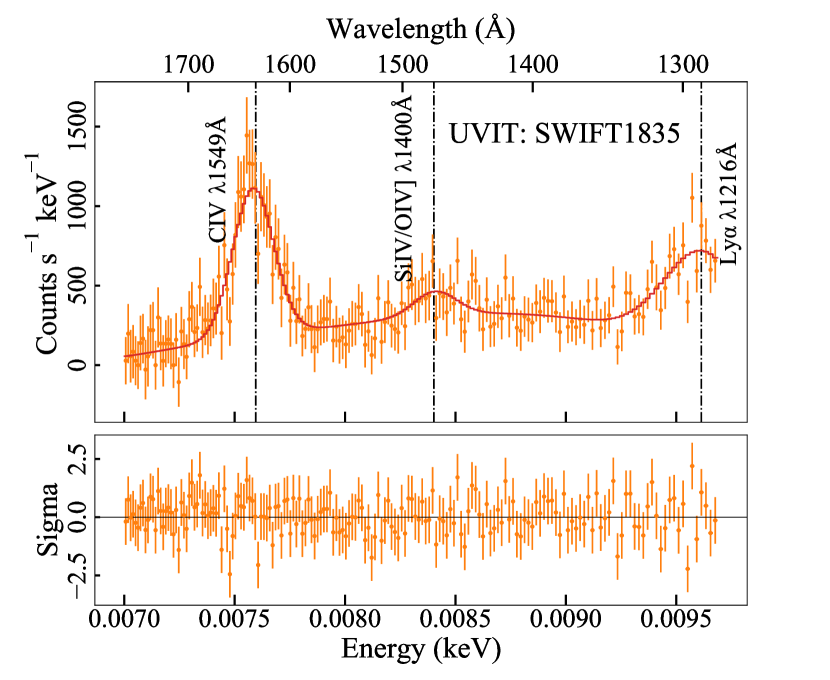
HST data are not available for this source. We fitted three emission lines and a redshifted power-law continuum. This provided a satisfactory fit (Fig. 10) with = 111/169 and . Using the intrinsic reddening model with the Balmer decrement fixed at 4.43 (Popović, 2003) did not improve the fit, therefore we did not use this component. The DISKBB model resulted in a similar as the simple power-law model. We obtained the best-fit inner disk temperature of . ZKERRBB resulted in = 112/170 with (Sambruna et al., 2011). We obtained the Eddington ratios, ( 0.998) and ( 0) with the OPTXAGNF model.
| Objects | Mrk 841 | MR 2251–178 | PG0804 | NGC 7469 | |||||
|---|---|---|---|---|---|---|---|---|---|
| HST | UVIT | HST | UVIT | HST | UVIT | HST | UVIT | ||
| 1 | 1 | 1 | 1 | ||||||
| Ly Å | (Å) | 1214.9 | * | 1214.8 | 1220 | 1214.8 | 1222 | 1218.1 | * |
| 5383 | * | 11682 | * | 10681 | * | 3367 | * | ||
| * | * | * | * | ||||||
| (Å) | 1216.3 | * | 1215.1 | 1210 | 1215.2 | * | 1216.3 | * | |
| 716 | * | 3779 | * | 2542 | * | 901 | * | ||
| * | * | * | * | ||||||
| N V Å | (Å) | 1249 | * | x | 1240.6 | 1245 | 1241.2 | * | |
| 6652 | * | x | 3864 | 3308 | * | 7120 | * | ||
| * | x | * | * | ||||||
| Si II Å | (Å) | 1260 | * | 1264.5 | * | 1260.3 | * | x | x |
| 440 | * | 1994 | * | 4197 | * | x | x | ||
| * | * | * | x | x | |||||
| O I/Si II Å | (Å) | 1305 | * | 1304 | * | 1309 | * | 1304.6 | * |
| 2435 | * | 3321 | * | 1435 | * | 3876 | * | ||
| * | * | * | * | ||||||
| C II Å | (Å) | x | x | x | x | x | x | 1337 | * |
| x | x | x | x | x | x | 3373 | * | ||
| x | x | x | x | x | x | * | |||
| Si IV Å | (Å) | 1398.8 | * | 1400 | * | 1399 | 1403 | 1400.1 | * |
| 6788 | * | 4758 | * | 5060 | * | 5724 | * | ||
| * | * | * | * | ||||||
| C IV Å | (Å) | 1551.5 | 1561 | 1548 | 1559.6 | 1548 | * | 1549.2 | * |
| 10229 | * | 15925 | * | 6648 | 10569 | 7180 | * | ||
| * | * | * | * | ||||||
| (Å) | 1542 | 1548 | 1548 | 1550 | 1548 | * | 1550.0 | * | |
| 3213 | 5282 | 2585 | * | 2202 | * | 1934 | * | ||
| * | * | * | * | ||||||
| He II Å | (Å) | 1640 | * | 1613.5 | * | x | x | 1630.1 | * |
| 11332 | * | 3644 | * | x | x | 13804 | * | ||
| * | * | x | x | * | |||||
| (Å) | 1641 | * | x | x | x | x | 1639.7 | * | |
| 250 | * | x | x | x | x | 725 | * | ||
| * | x | x | x | x | * | ||||
| O III]/Al II Å | (Å) | 1665 | * | 1651 | * | x | x | x | x |
| 1612 | * | 4229 | * | x | x | x | x | ||
| * | * | x | x | x | x | ||||
Note. — ‘*’ same as HST; ‘x’ not detected.
| Objects | I Zw 1 | SWIFT1921 | Mrk 352 | SWIFT1835 | ||||
|---|---|---|---|---|---|---|---|---|
| HST | UVIT | HST | UVIT | HST | UVIT | UVIT | ||
| 1 | 1 | 1 | – | |||||
| Ly Å | (Å) | 1212.8 | * | 1214.2 | * | x | x | 1213.5 |
| 4964 | * | 6823 | * | x | x | 12193 | ||
| * | * | x | x | |||||
| (Å) | 1215 | * | 1215.5 | * | x | x | x | |
| 1024 | * | 1820 | * | x | x | x | ||
| * | * | x | x | x | ||||
| N V Å | (Å) | 1237 | * | 1241.6 | * | x | x | x |
| 2922 | * | 3189 | * | x | x | x | ||
| * | * | x | x | x | ||||
| Si II Å | (Å) | 1262.4 | * | x | x | x | x | x |
| 1461 | * | x | x | x | x | x | ||
| * | x | x | x | x | x | |||
| O I/Si II Å | (Å) | 1305 | * | 1304 | * | x | x | x |
| 905 | * | 2483 | * | x | x | x | ||
| * | * | x | x | x | ||||
| C II Å | (Å) | 1334 | * | x | x | x | x | x |
| 1038 | * | x | x | x | x | x | ||
| * | x | x | x | x | x | |||
| Si IV Å | (Å) | 1397 | * | 1397.3 | * | 1399.4 | * | 1394.6 |
| 3332 | * | 5969 | * | 4592 | * | 6757 | ||
| * | * | * | ||||||
| C IV Å | (Å) | 1539 | * | 1547.0 | * | 1547 | 1543 | 1542.7 |
| 3477 | * | 10148 | * | 9044 | * | 7474 | ||
| * | * | * | ||||||
| (Å) | 1547 | * | 1549 | * | 1553.7 | * | x | |
| 1500 | * | 2381 | * | 2402 | 4821 | x | ||
| * | * | * | x | |||||
| He II Å | (Å) | x | x | 1640 | * | x | x | |
| x | x | 16131 | * | x | 7609 | x | ||
| x | x | * | x | x | ||||
| (Å) | x | x | 1639 | x | x | x | x | |
| x | x | 981 | x | x | x | x | ||
| x | x | x | x | x | x | |||
Note. — ‘*’ same as HST, ‘x’ not detected.
| Objects | Mrk 841 | MR 2251-178 | I Zw 1 | SWIFT1921 | |||||
|---|---|---|---|---|---|---|---|---|---|
| HST | UVIT | HST | UVIT | HST | UVIT | HST | UVIT | ||
| Ly Å | (Å) | x | x | 1217 | * | x | x | x | x |
| x | x | 1856 | * | x | x | x | x | ||
| x | x | * | x | x | x | x | |||
| N V Å | (Å) | x | x | x | x | 1252 | * | x | x |
| x | x | x | x | 1383 | * | x | x | ||
| x | x | x | x | * | x | x | |||
| O I/Si II Å | (Å) | x | x | x | x | 1298 | * | x | x |
| x | x | x | x | 1784 | * | x | x | ||
| x | x | x | x | * | x | x | |||
| (Å) | x | x | x | x | 1310 | * | x | x | |
| x | x | x | x | 541 | * | x | x | ||
| x | x | x | x | * | x | x | |||
| C II Å | (Å) | x | x | x | x | 1344 | * | x | x |
| x | x | x | x | 611 | * | x | x | ||
| x | x | x | x | * | x | x | |||
| N IV] Å | (Å) | 1485 | * | x | x | x | x | 1486 | * |
| 1704 | * | x | x | x | x | 2200 | * | ||
| * | x | x | x | x | * | ||||
| C IV Å | (Å) | x | x | 1536 | * | x | x | x | x |
| x | x | 2932 | * | x | x | x | x | ||
| x | x | * | x | x | x | x | |||
Note. — ‘*’ same as HST, ‘x’ not detected.
| Model | Parameters | Mrk 841 | MR 2251–178 | PG0804 | NGC 7469 | I Zw 1 | SWIFT1921 | Mrk 352 | SWIFT1835 |
|---|---|---|---|---|---|---|---|---|---|
| ZPL (HST) | – | ||||||||
| – | |||||||||
| – | |||||||||
| ZPL | |||||||||
| 410/320 | 203/166 | 401/331 | 381/347 | 141/173 | 377/321 | 335/345 | 111/169 | ||
| DISKBB | |||||||||
| Norm | |||||||||
| 414/320 | 205/166 | 469/331 | 384/347 | 148/173 | 378/321 | 335/345 | 111/169 | ||
| ZKERRBB | |||||||||
| Norm | |||||||||
| 461/321 | 242/167 | 616/332 | 428/348 | 145/174 | 378/322 | 355/346 | 112/170 | ||
| ZKERRBB | |||||||||
| Norm | |||||||||
| 447/321 | 226/167 | 558/332 | 424/348 | 145/174 | 380/322 | 353/346 | 112/170 | ||
| OPTXAGNF | |||||||||
| 412/320 | 205/166 | 432/331 | 383/347 | 141/173 | 475/321 | 335/345 | 111/169 | ||
| OPTXAGNF | |||||||||
| 416/320 | 205/166 | 440/331 | 383/347 | 141/173 | 492/321 | 335/345 | 117/169 |
Note. — The FUV flux () is in the units of in the to ( Å) band . is in the unit of .
6 discussion
We analyzed AstroSat/UVIT grating observations of eight nearby AGN with black hole masses ranging from , and studied the shape of the intrinsic continuum. We confirm the presence of strong emission lines due to C IV, N V, He II, Ly and Si IV/O IV]. The equivalent width (EW) of these broad emission lines fall in the range Å (Ly Å), Å (N V Å), Å (Si IV/O IV]) Å, Å (C IV Å) and Å (He II Å). We found emission line variations as large as compared to the line strengths found in the HST observations. Though the Fe II line complex is weak below Å, we detected this complex in five sources with fractional contributions of (Mrk 841), (PG0804), (NGC 7469), (I ZW 1) and (SWIFT1921) in the Å band relative to the continuum.
We accounted for the intrinsic and the Galactic reddening, host galaxy contamination, and emission lines from the BLR and NLR, and derived the intrinsic continua from the observed UVIT grating spectra. We measured the spectral slopes, to , of the intrinsic power-law continua. These slopes are comparable to those obtained from earlier studies. Stevans et al. (2014) observed the spectral index to range from to using line-free spectral regions for 159 AGN using HST/COS ( Å). Shull et al. (2012) observed slope ranging from to in Å for their sample of 22 AGN using HST/COS. These studies did not account for the contamination of Fe II emission or the intrinsic reddening.
The UV slopes of observed spectra are strongly affected by intrinsic reddening due to the dust and gas in the host galaxies (Koratkar & Blaes, 1999). This is one of the major uncertainty in deriving the accretion disk continuum. We used the empirical relation given by Czerny et al. (2004) where we used Balmer decrement as a reddening indicator. This relation is thought to describe the intrinsic extinction of AGN appropriately. For many Seyfert 1s, Lu et al. (2019) found that the Balmer decrement is distributed as a Gaussian with a peak value of 3.16. For our sources, the best-fit Balmer decrement is in the range of which we obtained using the HST spectra. We observed negligible intrinsic reddening for all the sources except for I Zw 1 (see Table 3). It is possible that the reddening suffered by the far UV spectra is somewhat different than that in the optical band, and the Balmer lines in the optical band may not be the true indicators of extinction in the FUV band. For example, as noted by Pottasch (1960), a higher optical depth of the higher order lines in the Balmer series can affect the line ratio. In this case, radiation is scattered less while some fraction of radiation is re-absorbed and emitted in Paschen and and thereby further steepening the ratio. Apart from hydrogen lines, other line ratios such as He II , O I can be used as reddening indicator. As pointed out by Grandi (1983), these line ratios also suffer from re-absorption or scattering in such a way that may be seen as reddening. Another possibility is that the continuum may not suffer the same reddening as the broad emission lines. As we derived the internal extinction by fitting the high-resolution HST spectra (see section 5.1), some of the above issues are unlikely to affect our results on the continuum shape.
6.1 Intrinsic far UV continuum and the non-relativistic accretion disk model
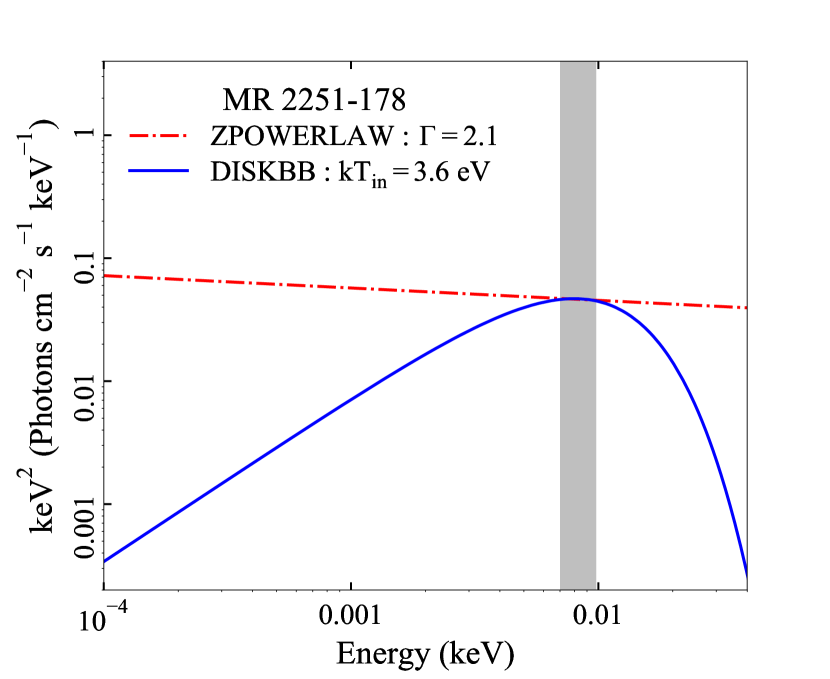
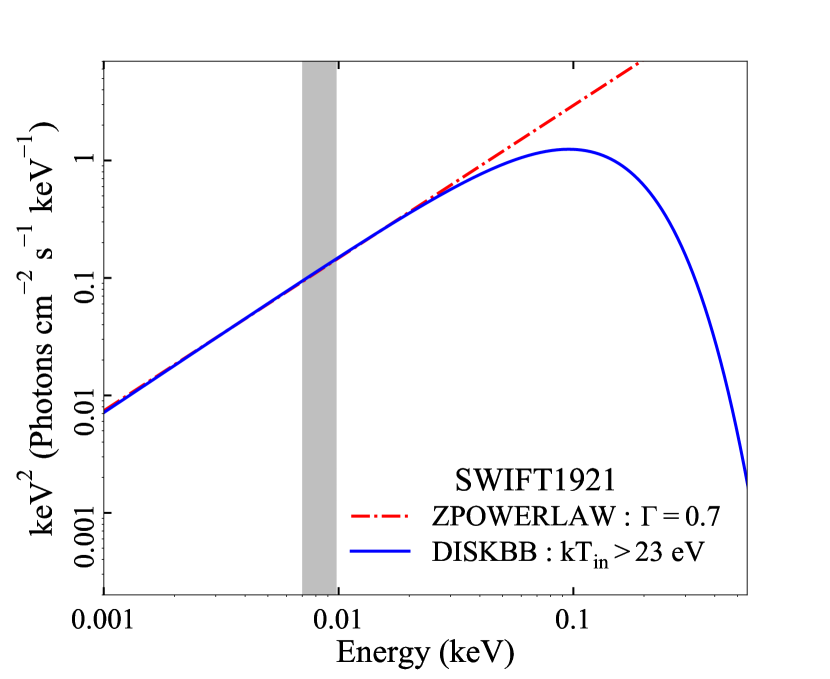
The far UV spectra when fitted with the multi-color accretion disk model (DISKBB), describing a non-relativistic accretion disk around a non-rotating black hole, provided inner disk temperatures in the range of (see Table 7). While both the accretion disk and the simple power-law models resulted in similar fit-statistic, the apparent discrepancy between the redder power-law slopes () compared to that predicted by the standard disk model for most of our AGN is due to the fact that the FUV band does not always lie in the power-law part of disk emission for AGN with different masses and accretion rates. For the sources where the peak disk temperature is higher (), we obtained slopes similar to the standard disk model. In Fig. 11, we compare the best-fit ZPOWERLAW and the DISKBB models for MR 2251–178 and SWIFT1921. In the case of SWIFT1921 with and , the FUV band falls in the region of the spectrum with the power-law shape, and we indeed find a slope consistent with that predicted by the standard disk model. While in the case of MR 2251–178 with and , the emission in the FUV band arises from the innermost disk regions responsible for the exponentially declining continuum and we find a steep power-law slope, .
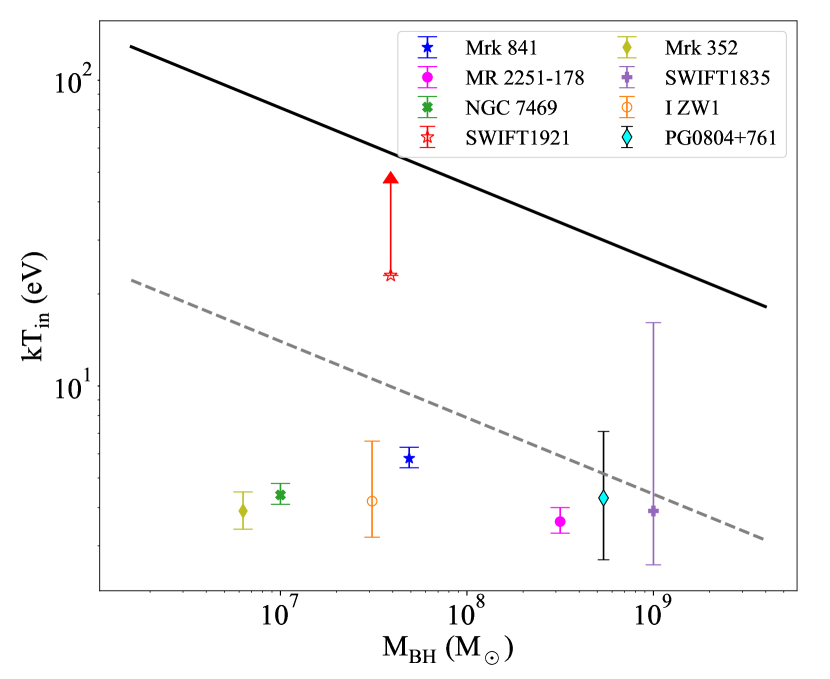
We compare the best-fit inner disk temperatures derived from our spectral analysis with the peak temperature expected from standard disks. We calculated the peak disk temperatures using the well-known relation (Netzer, 2013),
| (9) |
where, is given by , and is black hole mass () in the unit of . We used the known black hole masses, and calculated the peak disk temperatures (observed at radius for Schwarzschild black hole and for Kerr black hole) for two different accretion rates at and at . Fig. 12 compares the predicted peak temperatures for the two values of the accretion rates and the best-fit inner disk temperatures derived from the FUV data using the DISKBB model. Clearly, our best-fit inner-disk temperatures are lower (possibly except for Mrk 841 and SWIFT1921) than the peak temperatures predicted for accretion disks around maximally rotating SMBHs accreting at the Eddington rates. Except for NGC 7469 and Mrk 352, the derived temperatures are similar to that predicted for non-rotating SMBHs accreting at of the Eddington rate. This suggests that either the AGN have truncated accretion disks around highly spinning SMBHs or full accretion disks around slowly or non-rotating SMBHs with low . The best-fit temperatures for NGC 7469 and Mrk 352 are much lower than that predicted for non-rotating SMBHs accreting at (see Fig. 12). The relativistic accretion disk models further support the possibility of truncated disks in these AGN.
The emission from the inner disk regions is subjected to relativistic effects which the multi-color disk model does not account for. The DISKBB model also does not account for the color-correction factor which can make the inner disk temperature higher than that obtained using the DISKBB model. These effects are accounted for in the relativistic accretion disk models which we discuss below.
6.2 Relativistic Standard disks
We used two different relativistic disk models - OPTXAGNF and ZKERRBB. While the ZKERRBB is a fully relativistic model with radius independent color-correction factor and no provision for truncation, the OPTXAGNF model uses the temperature profile of a relativistic disk which allows for radius dependent color-correction and disk truncation but does not account for light bending. For I Zw 1, SWIFT1921 and SWIFT1835, the ZKERRBB model provided either better or similar quality fit as the OPTXAGNF model, and our data suggested untruncated accretion disks in these AGN. We were not able to constrain the spin parameter and disk inclination, therefore we used reasonable or previously estimated values.
For Mrk 841, MR 2251–178, PG0804, NGC 7469, and Mrk 352 we obtained a better fit with the OPTXAGNF model compared to the ZKERRBB model. We were able to well constrain the inner disk radii () of and for NGC 7469 and Mrk 352, respectively, irrespective of the spin parameter. The disk in MR 2251–178 may also be truncated at a smaller radius () if the SMBH is spinning at a high rate. The large inner radii for NGC 7469 and Mrk 352 are consistent with the absence of broad, relativistic iron K lines. X-ray spectroscopy of NGC 7469 has shown only a narrow iron line (FWHM ) (Mehdipour et al., 2018; Andonie et al., 2022). A narrow Fe K line has been observed from Mrk 352 (Winter et al., 2008). The disk truncation we inferred in NGC 7469 and Mrk 352 may be similar to the low/hard state of Galactic black hole X-ray binaries (BHB) (see Esin et al., 1997; Done et al., 2007; Bollimpalli et al., 2020)
The low/hard state of BHB is observed at of the Eddington limit. We found for Mrk 352 using the OPTXAGNF model, this may be similar to the low/hard state of BHB. However, NGC 7469 has a much higher bolometric fraction (), and it appears to be similar to IC 4329A with a possible truncated disk at high bolometric fraction (Dewangan et al., 2021). Another possibility for the apparent truncation of accretion disks could be due to the presence of soft X-ray excess emitting region in the innermost regions of the disk such as that predicted by the intrinsic Comptonised disk models (Done et al., 2012; Kubota & Done, 2018). The simultaneously acquired X-ray data along with the UV data presented here with AstroSat will help us to investigate the connection between the inner disk and the soft excess emitting region, which we plan in a future paper.
Since the relativistic effects are expected to dominate in the innermost regions of the disk that emits at shortest UV wavelengths, it is difficult to constrain all the parameters with the limited band-pass of the UVIT/FUV gratings. It is also possible that the thermal Comptonisation of UV photons into the broadband X-ray power-law component and the possible presence of optically thick and warm Comptonising component giving rise to the soft excess emission can modify the intrinsic UV continuum from the disk. Broadband UV, soft, and hard X-ray spectral modeling can help investigate the innermost disk regions. We hope to address these issues by using the far UV grating spectra, the soft and hard X-ray data simultaneously acquired with AstroSat.
Although the disk emits in the EUV/optical bands, the intrinsic disk emission may be modified by X-ray reprocessing. Observations of optical/UV variations lagging behind the variations in the X-ray emission by a few days in several AGN have been interpreted in terms of the X-ray reprocessing into UV/optical (Haardt & Maraschi, 1991; McHardy et al., 2014). It is thought that the X-rays from the hot corona illuminate the disk, and a part of the X-ray emission is absorbed, reprocessed, and re-radiated in the UV/optical band. Such reprocessing can alter the shape of the accretion disk continuum. We plan to use physical disk/corona models that include the X-ray reprocessing and reflection e.g., the KYNSED model (Dovčiak et al., 2022) and study the disk/corona emission using our AstroSat UV/X-ray observations.
7 Conclusion
We performed far UV grating spectroscopy of eight AGN using AstroSat/UVIT observations, and derived intrinsic continuum emission after accounting for the Galactic and intrinsic extinction, contributions from the NLR/BLR including Fe II complex, etc. We then investigate the shape of the intrinsic continuum in the context of accretion disk emission. The main results of our work are as follows. The far UV spectral slopes of the intrinsic continua of the eight AGN are in the range of to . For most AGN, these slopes are redder than that expected from the standard disk models in the optical/UV band. The limited-band far UV data are consistent with the accretion disk models. The derived temperatures are generally lower than the highest possible disk temperatures expected for accretion disks around maximally spinning SMBHs accreting at the Eddington limit. Observed peak effective temperatures indicate the possibility of truncated disks if the SMBHs are spinning at the maximal rate. Irrespective of the spin parameter, we find possible evidence for truncated disks in NGC 7469 and Mrk 352. The bolometric fraction of the disk emission ranges from (SWIFT1835) to (SWIFT1921). A number of effects such as the X-ray reprocessing, Thermal Comptonisation, soft X-ray excess may affect the shape of the UV continuum. Joint spectral modeling of the simultaneous acquired UV/X-ray data, which we plan in a future paper, may be necessary to further investigate the emission from the innermost disk/corona regions.
Facility: AstroSat, HST.
Software: CCDLAB (Postma & Leahy, 2017), Sherpa (Freeman et al., 2001), SAOImageDS9 (Joye & Mandel, 2003), Julia (Bezanson et al., 2017), Astropy (Collaboration et al., 2013).
References
- Andonie et al. (2022) Andonie, C., Bauer, F. E., Carraro, R., et al. 2022, arXiv preprint arXiv:2204.09469
- Antia et al. (2017) Antia, H., Yadav, J., Agrawal, P., et al. 2017, The Astrophysical Journal Supplement Series, 231, 10
- Arnaud (1996) Arnaud, K. A. 1996, in Astronomical Society of the Pacific Conference Series, Vol. 101, Astronomical Data Analysis Software and Systems V, ed. G. H. Jacoby & J. Barnes, 17
- Bentz & Katz (2015) Bentz, M. C., & Katz, S. 2015, PASP, 127, 67, doi: 10.1086/679601
- Berk et al. (2001) Berk, D. E. V., Richards, G. T., Bauer, A., et al. 2001, The Astronomical Journal, 122, 549
- Bezanson et al. (2017) Bezanson, J., Edelman, A., Karpinski, S., & Shah, V. B. 2017, SIAM review, 59, 65
- Bohlin et al. (1978) Bohlin, R. C., Savage, B. D., & Drake, J. F. 1978, ApJ, 224, 132, doi: 10.1086/156357
- Bollimpalli et al. (2020) Bollimpalli, D., Mahmoud, R., Done, C., et al. 2020, Monthly Notices of the Royal Astronomical Society, 496, 3808
- Brunner et al. (1997) Brunner, H., Mueller, C., Friedrich, P., et al. 1997, arXiv preprint astro-ph/9706118
- Canizares et al. (1978) Canizares, C. R., McClintock, J. E., & Ricker, G. R. 1978, ApJ, 226, L1, doi: 10.1086/182817
- Cardelli et al. (1989) Cardelli, J. A., Clayton, G. C., & Mathis, J. S. 1989, The Astrophysical Journal, 345, 245
- Cohen (1983) Cohen, R. D. 1983, ApJ, 273, 489, doi: 10.1086/161386
- Collaboration et al. (2013) Collaboration, A., Robitaille, T., Tollerud, E., et al. 2013, Astropy: A community Python package for astronomy. 558, A33
- Czerny et al. (2004) Czerny, B., Li, J., Loska, Z., & Szczerba, R. 2004, Monthly Notices of the Royal Astronomical Society, 348, L54
- Dewangan (2021) Dewangan, G. C. 2021, Journal of Astrophysics and Astronomy, 42, doi: 10.1007/s12036-021-09691-w
- Dewangan et al. (2021) Dewangan, G. C., Tripathi, P., Papadakis, I., & Singh, K. 2021, Monthly Notices of the Royal Astronomical Society, 504, 4015
- Domínguez et al. (2013) Domínguez, A., Siana, B., Henry, A., et al. 2013, The Astrophysical Journal, 763, 145
- Done et al. (2012) Done, C., Davis, S., Jin, C., Blaes, O., & Ward, M. 2012, Monthly Notices of the Royal Astronomical Society, 420, 1848
- Done et al. (2007) Done, C., Gierliński, M., & Kubota, A. 2007, The Astronomy and Astrophysics Review, 15, 1
- Dovčiak et al. (2022) Dovčiak, M., Papadakis, I. E., Kammoun, E. S., & Zhang, W. 2022, A&A, 661, A135, doi: 10.1051/0004-6361/202142358
- Duras et al. (2020) Duras, F., Bongiorno, A., Ricci, F., et al. 2020, Astronomy & Astrophysics, 636, A73
- Esin et al. (1997) Esin, A. A., McClintock, J. E., & Narayan, R. 1997, The Astrophysical Journal, 489, 865
- Fabian et al. (2000) Fabian, A., Iwasawa, K., Reynolds, C., & Young, A. 2000, Publications of the Astronomical Society of the Pacific, 112, 1145
- Francis et al. (1991) Francis, P. J., Hewett, P. C., Foltz, C. B., et al. 1991, ApJ, 373, 465, doi: 10.1086/170066
- Freeman et al. (2001) Freeman, P., Doe, S., & Siemiginowska, A. 2001, in Society of Photo-Optical Instrumentation Engineers (SPIE) Conference Series, Vol. 4477, Astronomical Data Analysis, ed. J.-L. Starck & F. D. Murtagh, 76–87, doi: 10.1117/12.447161
- Freeman et al. (2011) Freeman, P., Nguyen, D., Doe, S., & Siemiginowska, A. 2011, Astrophysics Source Code Library, ascl
- Gaskell (2017) Gaskell, C. M. 2017, Monthly Notices of the Royal Astronomical Society, 467, 226
- George et al. (1993) George, I., Nandra, K., Fabian, A., et al. 1993, Monthly Notices of the Royal Astronomical Society, 260, 111
- Ghosh et al. (2021) Ghosh, S., Joseph, P., Kumar, A., et al. 2021, Journal of Astrophysics and Astronomy, 42, 1
- Gondoin et al. (2003) Gondoin, P., Orr, A., & Lumb, D. 2003, Astronomy & Astrophysics, 398, 967
- Grandi (1982) Grandi, S. A. 1982, apj, 255, 25, doi: 10.1086/159799
- Grandi (1983) —. 1983, ApJ, 268, 591, doi: 10.1086/160982
- Green et al. (2011) Green, J. C., Froning, C. S., Osterman, S., et al. 2011, The Astrophysical Journal, 744, 60
- Güver & Özel (2009) Güver, T., & Özel, F. 2009, Monthly Notices of the Royal Astronomical Society, 400, 2050, doi: 10.1111/j.1365-2966.2009.15598.x
- Haardt & Maraschi (1991) Haardt, F., & Maraschi, L. 1991, The Astrophysical Journal, 380, L51
- Ho (1999) Ho, L. C. 1999, The Astrophysical Journal, 516, 672
- Jiang et al. (2019) Jiang, J., Fabian, A. C., Dauser, T., et al. 2019, Monthly Notices of the Royal Astronomical Society, 489, 3436
- Joye & Mandel (2003) Joye, W. A., & Mandel, E. 2003, in Astronomical data analysis software and systems XII, Vol. 295, 489
- Keyes et al. (1995) Keyes, C. D., Koratkar, A. P., Dahlem, M., et al. 1995, HST Instrument Handbook, 47
- Kinney et al. (1996) Kinney, A. L., Calzetti, D., Bohlin, R. C., et al. 1996, The astrophysical journal. Chicago. Vol. 467, no. 1, pt. 1 (Aug. 1996), p. 38-60
- Koratkar & Blaes (1999) Koratkar, A., & Blaes, O. 1999, Publications of the Astronomical Society of the Pacific, 111, 1
- Kubota & Done (2018) Kubota, A., & Done, C. 2018, MNRAS, 480, 1247, doi: 10.1093/mnras/sty1890
- Kuraszkiewicz et al. (2003) Kuraszkiewicz, J. K., Green, P. J., Crenshaw, D. M., et al. 2003, arXiv e-prints, astro. https://arxiv.org/abs/astro-ph/0310165
- Kuraszkiewicz et al. (2004) Kuraszkiewicz, J. K., Green, P. J., Crenshaw, D. M., et al. 2004, To appear in ApJS
- Laor (1991) Laor, A. 1991, in Iron Line Diagnostics in X-ray Sources (Springer), 205–208
- Li et al. (2005) Li, L.-X., Zimmerman, E. R., Narayan, R., & McClintock, J. E. 2005, ApJS, 157, 335, doi: 10.1086/428089
- Lu et al. (2019) Lu, K.-X., Zhao, Y., Bai, J.-M., & Fan, X.-L. 2019, Monthly Notices of the Royal Astronomical Society, 483, 1722
- Mao et al. (2022) Mao, J., Kriss, G., Landt, H., et al. 2022, The Astrophysical Journal, 940, 41
- Marchesini et al. (2004) Marchesini, D., Celotti, A., & Ferrarese, L. 2004, Monthly Notices of the Royal Astronomical Society, 351, 733, doi: 10.1111/j.1365-2966.2004.07822.x
- Mauder et al. (1994) Mauder, W., Weigelt, G., Appenzeller, I., & Wagner, S. 1994, Astronomy and Astrophysics, 285, 44
- McHardy et al. (2014) McHardy, I., Cameron, D., Dwelly, T., et al. 2014, Monthly Notices of the Royal Astronomical Society, 444, 1469
- Mehdipour et al. (2018) Mehdipour, M., Kaastra, J., Costantini, E., et al. 2018, Astronomy & Astrophysics, 615, A72
- Miranda et al. (2021) Miranda, B. R., Doddamani, V. H., & Vedavathi, P. 2021, Mapana Journal of Sciences, 1
- Mitsuda et al. (1984) Mitsuda, K., Inoue, H., Koyama, K., et al. 1984, PASJ, 36, 741
- Nandra et al. (1997) Nandra, K., George, I., Mushotzky, R., Turner, T., & Yaqoob, T. 1997, The Astrophysical Journal, 477, 602
- Nandra et al. (1995) Nandra, K., Turner, T., George, I., et al. 1995, Monthly Notices of the Royal Astronomical Society, 273, 85
- Nardini et al. (2014) Nardini, E., Reeves, J. N., Porquet, D., et al. 2014, Monthly Notices of the Royal Astronomical Society, 440, 1200, doi: 10.1093/mnras/stu333
- Netzer (2013) Netzer, H. 2013, Accretion disks (Cambridge University Press), 43–69, doi: 10.1017/CBO9781139109291.005
- Nguyen et al. (2021) Nguyen, D. D., Izumi, T., Thater, S., et al. 2021, Monthly Notices of the Royal Astronomical Society, 504, 4123
- Novikov & Thorne (1973) Novikov, I. D., & Thorne, K. S. 1973, in Black Holes (Les Astres Occlus), 343–450
- O’Brien et al. (1988) O’Brien, P. T., Gondhalekar, P. M., & Wilson, R. 1988, Monthly Notices of the Royal Astronomical Society, 233, 801, doi: 10.1093/mnras/233.4.801
- O’Brien et al. (1998) O’Brien, P. T., Dietrich, M., Leighly, K., et al. 1998, The Astrophysical Journal, 509, 163
- Osterbrock (1977) Osterbrock, D. E. 1977, ApJ, 215, 733, doi: 10.1086/155407
- Patrick et al. (2011) Patrick, A., Reeves, J., Porquet, D., et al. 2011, Monthly Notices of the Royal Astronomical Society, 411, 2353
- Peterson & Wandel (1999) Peterson, B. M., & Wandel, A. 1999, The Astrophysical Journal, 521, L95
- Peterson et al. (2004) Peterson, B. M., Ferrarese, L., Gilbert, K. M., et al. 2004, Apj, 613, 682, doi: 10.1086/423269
- Petrucci et al. (2004) Petrucci, P., Maraschi, L., Haardt, F., & Nandra, K. 2004, Astronomy & Astrophysics, 413, 477
- Piotrovich et al. (2020) Piotrovich, M. Y., Afanasiev, V., Buliga, S., & Natsvlishvili, T. 2020, International Journal of Modern Physics A, 35, 2040054
- Popović (2003) Popović, L. Č. 2003, The Astrophysical Journal, 599, 140
- Porquet et al. (2004) Porquet, D., Reeves, J., O’brien, P., & Brinkmann, W. 2004, Astronomy & Astrophysics, 422, 85
- Postma & Leahy (2017) Postma, J. E., & Leahy, D. 2017, Publications of the Astronomical Society of the Pacific, 129, 115002, doi: 10.1088/1538-3873/aa8800
- Pottasch (1960) Pottasch, S. 1960, The Astrophysical Journal, 131, 202
- Reichert et al. (1994) Reichert, G., Rodriguez-Pascual, P., Alloin, D. M., et al. 1994, The astrophysical journal. Chicago. Vol. 425, no. 2, pt. 1 (Apr. 1994), p. 582-608
- Richards et al. (2003) Richards, G. T., Hall, P. B., Berk, D. E. V., et al. 2003, The Astronomical Journal, 126, 1131
- Rudy et al. (2000) Rudy, R. J., Mazuk, S., Puetter, R., & Hamann, F. 2000, The Astrophysical Journal, 539, 166
- Sambruna et al. (2011) Sambruna, R., Tombesi, F., Reeves, J., et al. 2011, The Astrophysical Journal, 734, 105
- Seaton (1979) Seaton, M. 1979, Monthly Notices of the Royal Astronomical Society, 187, 73P
- Shakura & Sunyaev (1973) Shakura, N. I., & Sunyaev, R. A. 1973, A&A, 24, 337
- Shull et al. (2012) Shull, J. M., Stevans, M., & Danforth, C. W. 2012, The Astrophysical Journal, 752, 162
- Singh et al. (2017) Singh, K., Stewart, G., Westergaard, N., et al. 2017, Journal of Astrophysics and Astronomy, 38, 1
- Singh et al. (2014) Singh, K. P., Tandon, S., Agrawal, P., et al. 2014, in Space Telescopes and Instrumentation 2014: Ultraviolet to Gamma Ray, Vol. 9144, SPIE, 517–531
- Singh et al. (2016) Singh, K. P., Stewart, G. C., Chandra, S., et al. 2016, in Space Telescopes and Instrumentation 2016: Ultraviolet to Gamma Ray, Vol. 9905, International Society for Optics and Photonics, 99051E
- Stevans et al. (2014) Stevans, M. L., Shull, J. M., Danforth, C. W., & Tilton, E. M. 2014, The Astrophysical Journal, 794, 75
- Tanaka et al. (1995) Tanaka, Y., Nandra, K., Fabian, A., et al. 1995, Nature, 375, 659
- Tandon et al. (2017) Tandon, S., Subramaniam, A., Girish, V., et al. 2017, The Astronomical Journal, 154, 128
- Tandon et al. (2020) Tandon, S., Postma, J., Joseph, P., et al. 2020, The Astronomical Journal, 159, 158
- Tilton & Shull (2013) Tilton, E. M., & Shull, J. M. 2013, The Astrophysical Journal, 774, 67
- Vadawale et al. (2016) Vadawale, S. V., Rao, A. R., Bhattacharya, D., et al. 2016, SPIE Proceedings, 9905, 409, doi: 10.1117/12.2235373
- Vestergaard & Peterson (2006) Vestergaard, M., & Peterson, B. M. 2006, The Astrophysical Journal, 641, 689, doi: 10.1086/500572
- Vestergaard & Wilkes (2001) Vestergaard, M., & Wilkes, B. J. 2001, The Astrophysical Journal Supplement Series, 134, 1, doi: 10.1086/320357
- Wang et al. (2011) Wang, H., Wang, T., Zhou, H., et al. 2011, The Astrophysical Journal, 738, 85
- Wang & Zhang (2007) Wang, J.-M., & Zhang, E.-P. 2007, The Astrophysical Journal, 660, 1072, doi: 10.1086/513685
- Wilkins et al. (2021) Wilkins, D., Gallo, L., Costantini, E., Brandt, W., & Blandford, R. 2021, Nature, 595, 657
- Winter et al. (2008) Winter, L. M., Mushotzky, R. F., Tueller, J., & Markwardt, C. 2008, The Astrophysical Journal, 674, 686
- Winter et al. (2012) Winter, L. M., Veilleux, S., McKernan, B., & Kallman, T. R. 2012, The Astrophysical Journal, 745, 107, doi: 10.1088/0004-637x/745/2/107
- Woo & Urry (2002) Woo, J.-H., & Urry, C. M. 2002, The Astrophysical Journal, 579, 530
- Yadav et al. (2016) Yadav, J., Agrawal, P., Antia, H., et al. 2016, in Space Telescopes and Instrumentation 2016: Ultraviolet to Gamma Ray, Vol. 9905, SPIE, 374–388
- Zdziarski et al. (2022) Zdziarski, A. A., You, B., & Szanecki, M. 2022, The Astrophysical Journal Letters, 939, L2, doi: 10.3847/2041-8213/ac9474
- Zheng et al. (1997) Zheng, W., Kriss, G. A., Telfer, R. C., Grimes, J. P., & Davidsen, A. F. 1997, ApJ, 475, 469, doi: 10.1086/303560
Appendix A Absorption lines used in the HST spectra
| Mrk 841 | MR 2251-178 | PG0804 | |||||||||
|---|---|---|---|---|---|---|---|---|---|---|---|
| Strength | Strength | Strength | |||||||||
| (Å) | (eV) | (keV) | (keV) | (Å) | (eV) | (keV) | (keV) | (Å) | (eV) | (keV) | (keV) |
| 1204 | 9.935 | 1206.2 | 9.659 | 1183.6 | 9.522 | ||||||
| 1206.5 | 9.914 | 1214 | 9.598 | 1185.6 | 9.506 | ||||||
| 1208.8 | 9.895 | 1215 | 9.587 | 1213 | 9.292 | ||||||
| 1209.6 | 9.889 | 1221 | 9.539 | 1214 | 9.283 | ||||||
| 1211.5 | 9.874 | 1224 | 9.516 | 1217.9 | 9.254 | ||||||
| 1213 | 9.861 | 1226.7 | 9.499 | 1218 | 9.252 | ||||||
| 1215 | 9.845 | 1238 | 9.409 | 1266.8 | 8.897 | ||||||
| 1216 | 9.838 | 1242.6 | 9.377 | 1275 | 8.84 | ||||||
| 1216.7 | 9.831 | 1255 | 9.284 | 1387.6 | 8.122 | ||||||
| 1258 | 9.507 | 1311 | 8.888 | 1407 | 8.01 | ||||||
| 1287 | 9.292 | 1435.8 | 8.116 | 1409 | 7.996 | ||||||
| 1288 | 9.284 | 1456 | 7.999 | 1518.6 | 7.422 | ||||||
| 1344 | 8.897 | 1545.7 | 7.538 | 1551.2 | 7.265 | ||||||
| 1353 | 8.840 | 1548 | 7.525 | 1553.8 | 7.253 | ||||||
| 1472.8 | 8.122 | 1569 | 7.424 | ||||||||
| 1493 | 8.01 | 1650.8 | 7.058 | ||||||||
| 1496 | 7.996 | ||||||||||
| 1551.7 | 7.709 | ||||||||||
| 1611.8 | 7.422 | ||||||||||
| NGC 7469 | I Zw 1 | SWIFT1921 | |||||||||
|---|---|---|---|---|---|---|---|---|---|---|---|
| Strength | Strength | Strength | |||||||||
| (Å) | (eV) | (keV) | (keV) | (Å) | (eV) | (keV) | (keV) | (Å) | (eV) | (keV) | (keV) |
| 1231.6 | 9.908 | 1207.7 | 9.675 | 1205.9 | 9.914 | ||||||
| 1235.8 | 9.874 | 1227 | 9.522 | 1209 | 9.888 | ||||||
| 1240.6 | 9.836 | 1229 | 9.505 | 1213 | 9.855 | ||||||
| 1282 | 9.514 | 1257 | 9.291 | 1215 | 9.836 | ||||||
| 1313 | 9.2911 | 1258.8 | 9.282 | 1231.6 | 9.707 | ||||||
| 1503 | 8.118 | 1261 | 9.265 | 1234 | 9.685 | ||||||
| 1524 | 8.007 | 1303 | 8.967 | 1287 | 9.29 | ||||||
| 1539.6 | 7.926 | 1313 | 8.896 | 1288 | 9.282 | ||||||
| 1542 | 7.913 | 1394.7 | 8.378 | 1321 | 9.049 | ||||||
| 1438.7 | 8.122 | 1344 | 8.895 | ||||||||
| 1458.9 | 8.01 | 1352.6 | 8.838 | ||||||||
| 1515.8 | 7.709 | 1472 | 8.121 | ||||||||
| 1538 | 7.595 | 1492.8 | 8.008 | ||||||||
| 1574.6 | 7.421 | 1495 | 7.995 | ||||||||
| 1504.6 | 7.946 | ||||||||||
| 1551 | 7.707 | ||||||||||
| 1597.7 | 7.482 | ||||||||||
| 1611 | 7.420 | ||||||||||
Note. — We did not use any absorption line for Mrk 352.