![[Uncaptioned image]](/html/2303.11854/assets/x1.png)
![[Uncaptioned image]](/html/2303.11854/assets/x2.png)
The SLAM Hive Benchmarking Suite
\@IEEEauthorblockconfadjspace {@IEEEauthorhalign}Yuanyuan Yang, Bowen Xu, Yinjie Li and Sören Schwertfeger
Accepted for:
IEEE Conference on Robotics and Automation (ICRA) 2023
Citation:
Yuanyuan Yang, Bowen Xu, Yinjie Li and Sören Schwertfeger, ”The SLAM Hive Benchmarking Suite”, IEEE Conference on Robotics and Automation (ICRA) 2023: IEEE Press, 2023.
This is a publication from the Mobile Autonomous Robotic Systems Lab (MARS Lab), School of Information Science and Technology (SIST) of ShanghaiTech University. For this and other publications from the MARS Lab please visit:
https://robotics.shanghaitech.edu.cn/publications
© 2023 IEEE. Personal use of this material is permitted. Permission from IEEE must be obtained for all other uses, in any current or future media, including reprinting/republishing this material for advertising or promotional purposes, creating new collective works, for resale or redistribution to servers or lists, or reuse of any copyrighted component of this work in other works.
The SLAM Hive Benchmarking Suite
Abstract
Benchmarking Simultaneous Localization and Mapping (SLAM) algorithms is important to scientists and users of robotic systems alike. But through their many configuration options in hardware and software, SLAM systems feature a vast parameter space that scientists up to now were not able to explore. The proposed SLAM Hive Benchmarking Suite is able to analyze SLAM algorithms in 1000’s of mapping runs, through its utilization of container technology and deployment in a cluster. This paper presents the architecture and open source implementation of SLAM Hive and compares it to existing efforts on SLAM evaluation. Furthermore, we highlight the function of SLAM Hive by exploring some open source algorithms on public datasets in terms of accuracy. We compare the algorithms against each other and evaluate how parameters effect not only accuracy but also CPU and memory usage. Through this we show that SLAM Hive can become an essential tool for proper comparisons and evaluations of SLAM algorithms and thus drive the scientific development in the research on SLAM.
I INTRODUCTION
Simultaneous Localization and Mapping (SLAM) is an essential capability for many robotic systems. Consequently, there is lots of research work on SLAM, utilizing various types of sensors and algorithms and employing these to various application scenarios [1]. In order to scientifically evaluate the performance of SLAM systems, experiments with them must be reproducible, repeatable and properly compared to other solutions. Running SLAM algorithms with pre-recorded datasets is essential for this, as it allows to repeatedly perform mapping runs with the exact same data. Using ground-truth path information for said datasets it is possible to quantitatively evaluate the localization error of the mapping run, which is generally considered a sufficient measure for the performance of SLAM algorithms [2].
SLAM is a complex topic and the performance of an approach depends on various factors, including the type of environment, the path the robot took in that environment, sensor types, sensor placement on the robot, settings for the sensor data like frame rate, resolution or maximum range, as well as various configuration parameters for the algorithm like number of particles, number of features or various other thresholds and settings. Furthermore, methods should not only be evaluated against the Absolute Trajectory Error (ATE) and Relative Pose Error (RPE) w.r.t. the ground truth path, but memory consumption, processing time or map quality can also be important factors to consider.
A robotics engineer who wants to deploy a SLAM system for a specific application should be able to select the best SLAM algorithm, given the number and quality of sensors and computing resources his scenario allows for. Likewise, scientists developing SLAM software should be able to evaluate the performance of their solution under various aspects and configurations. But the number of mapping runs needed to exhaustively test an algorithm under many permutations of configurations is very big - e.g. comparing 10 algorithms with 5 different configuration each, 10 sensor combinations (e.g. front camera or back camera or both, etc.), 4 different resolutions, 4 different frame rates and 10 different datasets with different environments and amounts of loops, requires 80,000 mapping runs. So currently papers on SLAM only test with and against very few mapping runs.
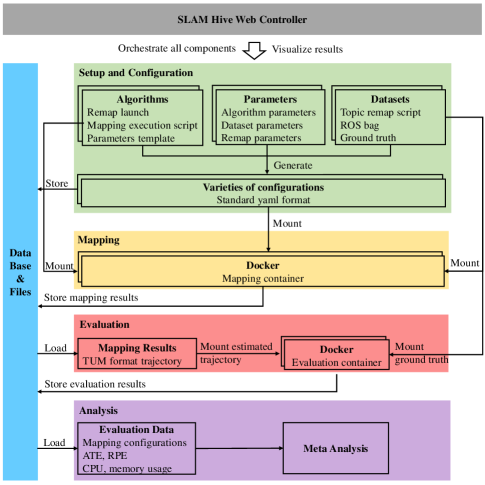
Thus we propose the SLAM Hive Benchmarking Suite. This suite makes use of Docker containers to run algorithms, evaluation and the whole system itself. It is intended to be deployed in a cluster in order to be able to perform and evaluate 1000’s of mapping runs, but can also be used stand-alone on a workstation. Fig. 1 shows an overview of the functionality of the system. The suite is still under development, but already ready for evaluating algorithms. Missing components are: the automated creation of many mapping run configurations, the Kubernetes orchestration for deployment in a cluster and the Meta Analysis for analyzing the results of the 1000’s of mapping run evaluations. We invite interested researcher to contribute to the development of SLAM Hive, which is available on GitHub 111https://github.com/SLAM-Hive.
The key contributions of the (to be completed) SLAM Hive Benchmarking Suite are:
-
•
Defining and implementing a framework performing mapping runs of various SLAM Algorithms in Docker containers, using various configurations and datasets.
-
•
Implementing a framework for evaluation of the results of these mapping runs using (different) evaluation algorithms implemented in Docker containers.
-
•
Providing a Web interface, implemented as a Docker container, to view, configure and run the SLAM Hive system and mapping runs.
-
•
Configure and run thousands of such mapping runs with different permutations of configurations automatically in a cluster.
-
•
Perform meta analysis of these mapping runs to evaluate them under various aspects (e.g. influence of frame rate, resolution, sensor selection, algorithm parameters, etc.).
II Related work
Datasets are essential for evaluating SLAM systems. There are many well-known public datasets, such as the KITTI dataset [3], which is widely used in the field of autonomous driving; EuRoC MAV dataset collected by UAV [4]; TUM RGB-D with depth values [5], etc. Among the recently published datasets, [6] published a service robot dataset that contains some dynamic and daily changing environments scenarios. [7] presents a challenging data: TartanAir, which is collected in a realistic simulated environment with moving objects, changing light and various weather conditions.
An ideal dataset for SLAM Hive should have many sensors of many different types and pointing in various directions. It should be very high resolution (so it can be down-scaled to simulate low resolution sensors), very high frame rate (which can also simulate low frame-rate systems), hardware synchronized, well calibrated and provide ground truth path data. In [8] a survey on available robotics-related datasets was conducted, listing the properties of various datasets. It reveals that so far no comprehensive SLAM dataset is available. In [8] we made first steps towards creating such a dataset, which will be concluded with our ShanghaiTech Mapping Robot II soon. This robot, which is already outlined in our paper ”Cluster on Wheels” [9], and the datasets it will create will be integral to fully utilize the capabilities of SLAM Hive.
There are already some SLAM evaluation systems, for which we show an overview in Table I. The famous KITTI Vision Benchmark Suite [10] provides a set of tools that can evaluate the accuracy of the stereo, optical flow, odometry and object recognition, but it can only use the KITTI dataset of the autonomous driving scenarios they provide and only evaluates the path provided by the user, so it doesn’t run the SLAM algorithm itself.
| System | Dataset Support | Data Types | Run any alg. in Docker | Monitor CPU & Memory | Automated Evaluation | Meta Analysis | Year |
| KITTI Vision [10] | KITTI dataset[3] | mono, stereo, IMU, LiDAR | 2012 | ||||
| TUM RGB-D [5] | TUM RGB-D dataset | RGB-D, IMU | 2012 | ||||
| EVO [11] | Trajectories meet specific formats* | mono, stereo, RGB-D, IMU, LiDAR, etc. | 2017 | ||||
| SLAMBench [12, 13, 14] | 9 public datasets | mono, stereo, RGB-D, IMU | ✓ | ✓ | 2019 | ||
| VINSEval [2] | Simulation data | mono, stereo, RGB-D, IMU | ✓ | ✓ | 2021 | ||
| SLAM Hive | any ROS bag | mono, stereo, RGB-D, IMU, LiDAR, etc. | ✓ | ✓ | ✓ | ✓ | 2022 |
-
*
EVO is to evaluate the trajectory output by the algorithm. The supported trajectory formats are: ’TUM’ trajectory files, ’KITTI’ pose files, ’EuRoC MAV’, ROS and ROS2 bagfile with geometry_msgs/PoseStamped, geometry_msgs/TransformStamped, geometry_msgs/PoseWithCovarianceStamped or nav_msgs/Odometry topics or TF messages. .
In addition to providing the RGB-D dataset, [5] also provides automatic evaluation tools both for the evaluation of drift of visual odometry systems and the global pose error of SLAM systems. In that paper, they evaluate the quality of the estimated trajectory instead of the resulting map and accurate ground truth maps. The two well known metrics: RPE and ATE were defined. For both evaluation metrics, they provided easy-to-use evaluation scripts for the users. On this basis, EVO provides executables and a small library for handling, evaluating and comparing the trajectory output of odometry and SLAM algorithms [11]. It supports different trajectory formats and it’s easy to output some nice comparison charts.
A series of papers [12, 13, 14] analyzes and compares existing SLAM evaluation systems. SLAMBench proposed that contrast accuracy alone is not enough, it presented a SLAM performance benchmark that combined a framework for quantifying quality-of-result with instrumentation of execution time and energy consumption [12]. SLAMBench2 proposed that different SLAM applications can have different functional and non-functional requirements. This benchmarking framework evaluates eight existing SLAM systems that are lined as a library, over ICL-NUIM, TUM-RGDB and EuRoC MAV datasets, while using a comparable and clearly specified list of performance metrics [13] . SLAMBench3 added new support for scene understanding and non-rigid environments (dynamic SLAM), and put forward the corresponding accuracy metrics [14] . Although SLAMBench, SLAMBench2 and SLAMBench3 are as comprehensive as possible and support plug and play, it is not as general SLAM Hive w.r.t. adding algorithms, as those need to be linked against SLAMBench, while SLAM Hive runs them in their environment in a container - SLAM Hive could theoretically even support algorithms coded in MatLab and/ or other operating systems. Moreover, SLAMBench only supports camera (and IMU) data, no LiDAR or other data.
The TUM VI benchmark published a novel dataset with a diverse set of sequences in different scenes for evaluating visual-inertial odometry (VIO). To verify that the dataset is suitable for benchmarking, it provides the results of three open-source state-of-the-art methods: ROVIO, OKVIS and VINS-Mono, which shows that even the best performing algorithms have significant drift in long (magistrale, outdoors) and visually challenging (slides) sequences [15]. It can be seen that the development of SLAM urgently needs more challenging datasets for SLAM systems evaluation.
Lastly, VINSEval presented a unified framework for statistical relevant evaluation of consistency and robustness of Visual-Inertial Navigation System (VINS) algorithms with fully automated scoreboard generation over a set of selectable attributes [2]. VINSEval uses FlightGoggles, a development environment envisioned to allow the design, implementation, testing and validation of autonomous super vehicles, to generate simulation data with different IMU noisy, amount features, illumination and time delay instead of the real dataset.
According to the studies mentioned above, it can be found that KITTI Vision Bnechmark Suite [10], RGB-D SLAM systems benchmark [5] and the TUM VI benchmark [15] all publish a dataset and provide tools or easy-to-use scripts for evaluating the output of existing SLAM methods. All of them only support using the dataset they provide, which limits the breadth of evaluation of different SLAM algorithms. The SLAMBench series [12, 13, 14] provided more evaluation metrics, supported many algorithms and datasets, but is limited to SLAM algorithms linked against it. Also, it does not support Meta Analysis of many mapping runs, nor performing or creating them automatically. VINSEval [2] provides a robust evaluation method for the visual SLAM community, however it is difficult to ensure the correlation of simulated data with real data and they don’t support other sensor data like LiDARs.
III SLAM Hive
SLAM Hive is a benchmarking framework that supports mapping execution, evaluation, and performance Meta analysis presentation on webpages with different SLAM methods, datasets and varieties of configurations. All mapping and evaluation functions are executed in standard Docker containers. For users, it is convenient to reproduce and create some mapping and evaluation tasks. Moreover, many configurations can be customized for comprehensive benchmarks.
III-A Overview
To the best of our knowledge, SLAM Hive is the first SLAM benchmark framework that has a graphical user interface and automatically presents evaluation results reports. Our system supports custom configurations and some performance metrics to fully evaluate the algorithm. In addition, all task parameters are recorded in the database, which facilitates analysis based on historical tasks and their corresponding parameter values. At the same time, SLAM Hive has a strong scalability, as it can be deployed in a cluster.
III-A1 Easy-to-use GUI
All operations of SLAM Hive are based on a web GUI. We provide some ready-made Docker images of SLAM methods, generic mapping execution scripts, datasets scripts and some configurations. What users need to do is just select the algorithm and dataset they are interested in, input the desired parameter values, then a new mapping task is created by clicking the button. For systematic evaluations we will support the automated generation of thousands of permutations of mapping run configurations.
III-A2 Custom Configurations
SLAM Hive already supports many different SLAM methods and datasets that can be seen in Table II, and more will be added in the future. These methods could also be closed-source solutions or systems not using ROS, as long as they adhere to the scripting and output standards defined on github. The system supports custom configurations including algorithm parameters, datasets parameters and topic remap.
III-A3 Comprehensive Evaluation Metrics
The accuracy of estimated trajectory is an important metric for evaluating SLAM methods. The evaluation module compares the estimated trajectory from mapping task with the groundtruth, which can plot and compute the trajectory, ATE and RPE. While the CPU and memory usage is monitored during mapping by a monitoring tool called cAdvisor. It can perform real-time monitoring and performance data collection of Docker containers, including CPU usage, memory usage etc.
III-A4 Meta Analysis
Since the task information created every time are stored in the database, we can load all historical data from the database, including all parameters value, Min, Max, Mean, Standard Deviation, RMSE of ATE and RPE, CPU and memory usage etc. The system can automatically generate and display various evaluation indicators in the form of tables and pictures. Examples include: ”Resolution vs. ATE”, ”Frame Rate vs. Computation Time”, ”Number of loops in dataset vs. ATE”, ”Front camera ATE vs. Back camera ATE”, ”LiDAR vs. RGB-D”.
III-A5 Scalability
Our system has the standard API, and since all mapping and evaluation tasks are performed in standard Docker containers, whether to expand new algorithms, datasets or even evaluation methods, only the corresponding scripts need to be provided according to the API.
III-B Workflow
SLAM Hive is composed of six modules: web controller, database, configuration generator, mapping container, evaluation container, and meta analysis.
The web controller is responsible for responding to the user’s request to create various tasks and presenting a list of algorithms, datasets, parameters, configurations and evaluations. Thousands of configurations can be generated with different algorithms, datasets and parameters by configurations generator. When a new mapping task is executed, the web controller mounts algorithm execution scripts, parameters and datasets to the corresponding Docker image, and controls the starting and closing of the container. At the same time, the controller records the CPU and memory usage during mapping. After the mapping finishes, the estimated trajectory as well as usage information are saved to database or file system for accuracy evaluation.
Evaluation tasks can also be created by web controller and are executed in standard Docker containers. The evaluated results including estimated trajectory, ATE, RPE are stored in the database after evaluation. Finally, in the future the user will be able to use the meta analysis tool, which loads the required data from the database and aggregates and displays it on the web controller. The workflow of SLAM Hive is shown in the Fig 1.
IV Main Components of SLAM Hive
| MH_01_easy1 | MH_02_easy1 | MH_03_medium1 | MH_04_difficult1 | MH_05_difficult1 | ||||||||||||
| RMSE2 | CPU3 | RAM4 | RMSE | CPU | RAM | RMSE | CPU | RAM | RMSE | CPU | RAM | RMSE | CPU | RAM | ||
| Monocular | ORB-SLAM2 | 0.043 | 1.36/1.90 | 978 | 0.038 | 1.38/1.94 | 954 | 0.038 | 1.36/1.86 | 896 | 0.165 | 1.24/1.71 | 921 | 0.079 | 1.29/1.79 | 947 |
| ORB-SLAM3 | 0.044 | 1.25/1.67 | 2422 | 0.037 | 1.24/1.63 | 2225 | 0.041 | 1.21/1.53 | 2168 | 0.054 | 1.12/1.58 | 1972 | 0.057 | 1.30/2.51 | 2200 | |
| Monocular Inertial | VINS-Mono | 0.120 | 1.98/2.56 | 1905 | 0.294 | 1.93/2.57 | 1762 | 0.111 | 1.85/2.50 | 1585 | 0.250 | 1.56/2.40 | 1332 | 0.184 | 1.65/2.50 | 1477 |
| VINS-Fusion | 0.066 | 1.50/2.30 | 2507 | 0.049 | 1.41/2.23 | 1375 | 0.050 | 1.45/2.25 | 1575 | 0.083 | 1.26/2.15 | 1305 | 0.175 | 1.30/2.19 | 2138 | |
| ORB-SLAM3 | 0.051 | 1.41/1.85 | 1746 | 0.065 | 1.31/1.81 | 2202 | 0.050 | 1.20/1.66 | 2364 | 0.055 | 1.31/1.79 | 2036 | 0.053 | 1.09/1.55 | 2088 | |
| Stereo | ORB-SLAM2 | 0.038 | 3.24/4.10 | 1387 | 0.027 | 3.25/3.97 | 1392 | 0.052 | 3.35/4.52 | 1242 | 0.153 | 3.14/3.92 | 931 | 0.067 | 3.14/4.20 | 1599 |
| VINS-Fusion | 0.053 | 1.69/2.60 | 1265 | 0.054 | 1.69/2.46 | 1393 | 0.082 | 1.72/2.79 | 1547 | 0.125 | 1.52/2.40 | 1581 | 0.115 | 1.52/2.39 | 1423 | |
| ORB-SLAM3 | 0.036 | 1.83/2.55 | 2731 | 0.034 | 1.77/2.45 | 2478 | 0.044 | 1.90/2.62 | 2643 | 0.062 | 1.59/2.37 | 2145 | 0.070 | 1.76/3.21 | 2282 | |
| Stereo Inertial | VINS-Fusion | 0.043 | 1.84/2.66 | 1535 | 0.031 | 1.81/2.78 | 2306 | 0.068 | 1.85/2.88 | 2833 | 0.093 | 1.61/2.55 | 2045 | 0.090 | 1.59/2.59 | 2038 |
| ORB-SLAM3 | 0.041 | 1.91/2.41 | 3154 | 0.052 | 1.85/2.40 | 2712 | 0.047 | 1.98/2.50 | 2415 | 0.046 | 1.98/2.45 | 2307 | 0.054 | 1.99/2.46 | 2377 | |
-
1
They are five sequences of varying difficulty on the EuRoC dataset. MH_01_easy and MH_02_easy are with good texture and bright scene, MH_03_medium is with fast motion and bright scene, MH_04_difficult and MH_05_difficult are with fast motion and dark scene.
-
2
RMSE is the root mean square error of the ATE, the unit is meter.
-
3
The calculation of CPU usage is the sum of all core usage. CPU in the above table is average/maximum CPU usage during mapping, its unit is core.
-
4
RAM is the maximum memory usage during mapping, its unit is MB.
IV-A Visual Web Controller
The web controller provides the graphical user interface, which is built by the lightweight web application called Flask. It is the control center responsible for the creation of mapping and evaluation tasks, as well as the addition of new algorithms, datasets, parameters, configurations. Since the system includes a database, all historical information can be saved. The front end of the system can display the existing data of all modules.
Once a new task is created by the web controller, all of the information including the selection of algorithm and dataset, and configurations with many parameter values are recorded to database. Then a thread can be created at the back end of the controller to start the mapping task and monitor the completion of the task at all times. In the future we will optionally support Kubernetes to deploy the mapping container in a cluster. When the task is completed, a completed notification will be displayed on the front end. In addition, users can add their own new algorithms, datasets and parameters on the web controller by easy step. The evaluation results can be displayed in the form of pictures, tables on the web controller, making it clear to compare the benchmark results.
IV-B Standard Interface
Standard interface is an important guarantee that the system has the ability to expand. Our interface consists of standard containers, unified configuration format, algorithm execution scripts, dataset component and standard trajectory format, which are documented on github.
IV-B1 Standard Containers
It’s difficult to create an unified environment for all algorithms, since different SLAM software require different system environments. Docker is an open source application container engine that can package applications and dependencies into lightweight containers. Using the same Docker image repeatedly will not modify the image itself, ensuring that the same Docker image will be the exact same environment. We provide many SLAM methods and an evaluation Docker image, all mappings and evaluation on SLAM Hive are executed in standard Docker containers. In order to ensure the validity of already performed mapping runs, containers may not be modified after being added to SLAM Hive - if changes are needed one will have to add a new algorithm container. Currently all our algorithms support ROS 1.0, either out of the box or through slight modifications by us. But if needed, the algorithm script (which is included with the algorithm docker) might also extract the data from the ROS datastream to feed it to the algorithm in the format it requires.
IV-B2 Unified Configuration Format
When a mapping task is created, a unified configuration is automatically generated in the form of a yaml file, including algorithm selection, dataset selection, algorithm parameters, dataset parameters and ROS remap configuration. The algorithm and dataset execution scripts will extract the required information from the configuration for automated mapping run.
IV-B3 Algorithm Execution Scripts
Algorithm execution scripts includes parameters template and execution script. Before starting the mapping, the execution script gets algorithm parameter values, dataset parameter values and remap information from the configuration file, then generates custom mapping configuration files according to parameters template and the requirements of the algorithm software, which will be read at the beginning of mapping.
IV-B4 Dataset component
The dataset component consists of dataset in the form of ROS bag, groundtruth, and dataset play script. In order to realize custom remap topic, the dataset play script can extract the dataset remap topic from configuration file and generate corresponding dataset play and remap command.
IV-B5 Standard Trajectory Format
Most of SLAM algorithms publish the topics information by ROS. So all algorithms containers are built based on ROS in order to replay dataset and record the topic of the estimated pose. For later evaluation, we convert estimated trajectories and groundtruth to the TUM format: .
IV-C Multiple Configurations Mechanism
Our system has a unified configuration format, varieties of configurations can be easily generated by selecting algorithms, datasets and inputting algorithm parameter values, dataset parameter values and remap topic from scratch or just copying an existing configuration and modifying some of its parameters. These configurations are recorded in database for further performance analysis. The same algorithm and dataset with different algorithm parameters, or the same algorithm and parameters with different datasets may yield interesting results. Nondeterministic algorithms may even be executed several times with the exact same parameters to evaluate their stability.
V Benchmarking Experiments
The video accompanying this paper demos how to deploy SLAM Hive on your PC, how to download algorithm containers and datasets with the easy to use scripts, and how to configure, run and analyze a mapping task.
In this section, we used SLAM Hive to complete two sets of benchmark comparison experiments in terms of accuracy, CPU and memory usage. This highlights the capabilities and practicality of SLAM Hive. One is the performance comparison of multiple SLAM methods, the other is the impact of the specific algorithm parameter on the performance of the SLAM method.
Due to the lack of public datasets rich in various sensors, it is somewhat difficult to compare visual SLAM methods with LiDAR SLAM methods. In the future we will use the ShanghaiTech Mapping Robot II to create such datasets [9]. Therefore, we evaluated the visual SLAM solutions currently supported by the system under different configurations. All tests are on the same device, which is configured as: 16 G memory, Intel Core i7-6700 CPU @ 3.40GHz 8.
V-A Performance Comparison of SLAM Methods
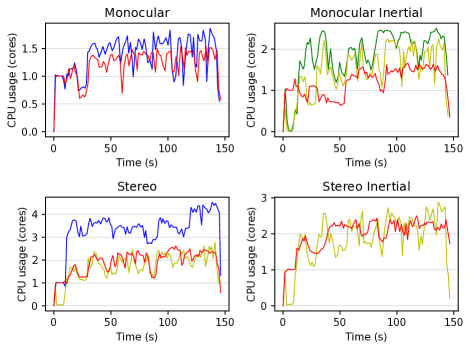
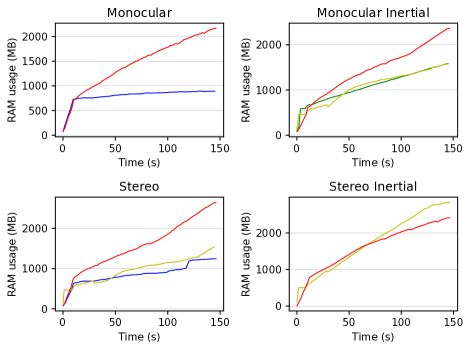
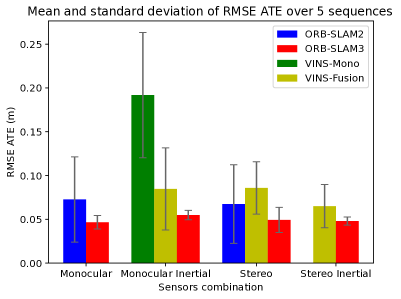
Fig. 3 shows the comparison of different methods under the same sensor combination on 5 different sequences from the EuRoC dataset. They are increasingly difficult to process in terms of flight dynamics and lighting conditions. For each algorithm, we used the default parameters. The results of each method in each sensor mode are summarized in Table III.
As shown in Fig. 2, in the 4 modes, the CPU usage of ORB-SLAM3 is smaller, while the memory usage is larger. In both monocular and stereo modes, the memory usage of ORB-SLAM3 is almost twice that of ORB-SLAM2. Fig. 3 shows the mean ATE of these methods on 5 sequences in different modes, it is obvious that ORB-SLAM3 performs more stable and has the highest accuracy.
Whether the number of sensor fusion pairs means higher accuracy and more resource consumption is also a topic worth exploring. The CPU usage of ORB-SLAM2 stereo mode is almost twice that of monocular mode. There is no obvious difference in the memory usage of ORB-SLAM3 in the 4 modes, and there is no significant difference in CPU consumption with or without the fusion of the IMU when the number of cameras is the same.
V-B Correlation of Parameters to Performance
Each SLAM method has some parameters of its own and it is difficult to determine how much the change of the parameter value will affect the system. This experiment explores the impact of the number of ORB feature points extracted per image on accuracy, CPU and memory usage. All tests were performed on the freiburg2/desk sequence of the TUM-RGBD dataset, a 99.36s, 18.88m, sequence with loop closure.
As shown in the Table IV, as the number of feature points increases, the ATE and RPE tend to decrease, while the CPU and memory usage tend to increase. When only 250 feature points are extracted, the algorithm fails, indirectly indicating that if the scene has too few features, the performance of ORB-SLAM2 may no longer be robust.
| The number of ORB features | RMSE ATE1 (cm) | RMSE RPE1 (cm) | CPU1 (core) | RAM1 (MB) |
| 2502 | - | - | - | - |
| 500 | 0.807 | 1.32 | 1.26/1.99 | 941 |
| 750 | 0.750 | 1.25 | 1.28/2.00 | 768 |
| 1000 | 0.768 | 1.23 | 1.42/2.38 | 880 |
| 1250 | 0.693 | 1.16 | 1.64/3.18 | 955 |
| 1500 | 0.698 | 1.17 | 1.89/3.37 | 1392 |
| 1750 | 0.645 | 1.24 | 2.02/3.42 | 1640 |
| 2000 | 0.625 | 1.12 | 2.29/3.75 | 1314 |
| 2250 | 0.650 | 1.12 | 2.33/3.87 | 1644 |
| 2500 | 0.623 | 1.11 | 2.31/3.85 | 1879 |
-
1
Our values are the average of 5 executions. RMSE ATE and RMSE RPE are obtained by aligning with the ground truth trajectory, where RPE is the error of translation per meter.
-
2
ORB-SLAM2 RGB-D fails when extracting 250 ORB feature points.
VI Conclusions
The SLAM Hive Benchmarking suite is a containerized system to systematically test and evaluate SLAM algorithms under various configurations using datasets. The system is very scalable and flexible, supporting software using different standards, operating systems and also closed source solutions, as long as scripts can be written to interface with them. The system, for the first time, will be able to explore and analyze the vast space of possible permutations of configurations, datasets and algorithms, when deployed in a cluster. It is also flexible towards the evaluation by implementing these themselves as programs running in their docker container. Our experiments showed that the suite is already able to properly evaluate SLAM algorithms.
In the future we plan to complete the feature set presented here. Furthermore, we also plan to explore the real-time performance of algorithms by recording their localization and path estimate on the fly. Systems using GPUs may also be supported, if the cluster is equipped with such. We will also add a user management system and then be able to allow unregistered visitors to use the Meta Analysis function, while registered users with according permissions may add algorithms, datasets and evaluation containers and configure and initiate more mapping runs.
Through the great flexibility of the SLAM Hive system we may also apply SLAM Hive to similar problems, like benchmarking for extrinsic sensor calibration, or various computer vision tasks like segmentation, object recognition or even prediction. SLAM Hive is available for testing and developing on github and we invite interested programmers to contribute to it.
ACKNOWLEDGMENT
This work was supported by Science and Technology Commission of Shanghai Municipality (STCSM), project 22JC1410700 “Evaluation of real-time localization and mapping algorithms for intelligent robots”.
References
- [1] Cesar Cadena, Luca Carlone, Henry Carrillo, Yasir Latif, Davide Scaramuzza, José Neira, Ian Reid, and John J Leonard. Past, present, and future of simultaneous localization and mapping: Toward the robust-perception age. IEEE Transactions on robotics, 32(6):1309–1332, 2016.
- [2] Alessandro Fornasier, Martin Scheiber, Alexander Hardt-Stremayr, Roland Jung, and Stephan Weiss. Vinseval: Evaluation framework for unified testing of consistency and robustness of visual-inertial navigation system algorithms. In 2021 IEEE International Conference on Robotics and Automation (ICRA), pages 13754–13760. IEEE, 2021.
- [3] Andreas Geiger, Philip Lenz, Christoph Stiller, and Raquel Urtasun. Vision meets robotics: The kitti dataset. International Journal of Robotics Research (IJRR), 2013.
- [4] Michael Burri, Janosch Nikolic, Pascal Gohl, Thomas Schneider, Joern Rehder, Sammy Omari, Markus W Achtelik, and Roland Siegwart. The euroc micro aerial vehicle datasets. The International Journal of Robotics Research, 35(10):1157–1163, 2016.
- [5] Jürgen Sturm, Nikolas Engelhard, Felix Endres, Wolfram Burgard, and Daniel Cremers. A benchmark for the evaluation of rgb-d slam systems. In 2012 IEEE/RSJ international conference on intelligent robots and systems, pages 573–580. IEEE, 2012.
- [6] Xuesong Shi, Dongjiang Li, Pengpeng Zhao, Qinbin Tian, Yuxin Tian, Qiwei Long, Chunhao Zhu, Jingwei Song, Fei Qiao, Le Song, et al. Are we ready for service robots? the openloris-scene datasets for lifelong slam. In 2020 IEEE international conference on robotics and automation (ICRA), pages 3139–3145. IEEE, 2020.
- [7] Wenshan Wang, Delong Zhu, Xiangwei Wang, Yaoyu Hu, Yuheng Qiu, Chen Wang, Yafei Hu, Ashish Kapoor, and Sebastian Scherer. Tartanair: A dataset to push the limits of visual slam. In 2020 IEEE/RSJ International Conference on Intelligent Robots and Systems (IROS), pages 4909–4916. IEEE, 2020.
- [8] Hongyu Chen, Zhijie Yang, Xiting Zhao, Guangyuan Weng, Haochuan Wan, Jianwen Luo, Xiaoya Ye, Zehao Zhao, Zhenpeng He, Yongxia Shen, et al. Advanced mapping robot and high-resolution dataset. Robotics and Autonomous Systems, 131:103559, 2020.
- [9] Yuanyuan Yang, Delin Feng, and Sören Schwertfeger. Cluster on wheels. In 2022 International Conference for Advancement in Technology (ICONAT), pages 1–8. IEEE, 2022.
- [10] Andreas Geiger, Philip Lenz, and Raquel Urtasun. Are we ready for autonomous driving? the kitti vision benchmark suite. In Conference on Computer Vision and Pattern Recognition (CVPR), 2012.
- [11] Michael Grupp. evo: Python package for the evaluation of odometry and slam. https://github.com/MichaelGrupp/evo, 2017.
- [12] Luigi Nardi, Bruno Bodin, M Zeeshan Zia, John Mawer, Andy Nisbet, Paul HJ Kelly, Andrew J Davison, Mikel Luján, Michael FP O’Boyle, Graham Riley, et al. Introducing slambench, a performance and accuracy benchmarking methodology for slam. In 2015 IEEE international conference on robotics and automation (ICRA), pages 5783–5790. IEEE, 2015.
- [13] Bruno Bodin, Harry Wagstaff, Sajad Saecdi, Luigi Nardi, Emanuele Vespa, John Mawer, Andy Nisbet, Mikel Luján, Steve Furber, Andrew J Davison, et al. Slambench2: Multi-objective head-to-head benchmarking for visual slam. In 2018 IEEE International Conference on Robotics and Automation (ICRA), pages 3637–3644. IEEE, 2018.
- [14] Mihai Bujanca, Paul Gafton, Sajad Saeedi, Andy Nisbet, Bruno Bodin, Michael FP O’Boyle, Andrew J Davison, Paul HJ Kelly, Graham Riley, Barry Lennox, et al. Slambench 3.0: Systematic automated reproducible evaluation of slam systems for robot vision challenges and scene understanding. In 2019 International Conference on Robotics and Automation (ICRA), pages 6351–6358. IEEE, 2019.
- [15] David Schubert, Thore Goll, Nikolaus Demmel, Vladyslav Usenko, Jörg Stückler, and Daniel Cremers. The tum vi benchmark for evaluating visual-inertial odometry. In 2018 IEEE/RSJ International Conference on Intelligent Robots and Systems (IROS), pages 1680–1687. IEEE, 2018.
- [16] Raúl Mur-Artal and Juan D. Tardós. ORB-SLAM2: an open-source SLAM system for monocular, stereo and RGB-D cameras. IEEE Transactions on Robotics, 33(5):1255–1262, 2017.
- [17] Tong Qin, Peiliang Li, and Shaojie Shen. Vins-mono: A robust and versatile monocular visual-inertial state estimator. IEEE Transactions on Robotics, 34(4):1004–1020, 2018.
- [18] Tong Qin, Jie Pan, Shaozu Cao, and Shaojie Shen. A general optimization-based framework for local odometry estimation with multiple sensors. CoRR, abs/1901.03638, 2019.
- [19] Carlos Campos, Richard Elvira, Juan J. Gómez Rodríguez, José M. M. Montiel, and Juan D. Tardós. Orb-slam3: An accurate open-source library for visual, visual–inertial, and multimap slam. IEEE Transactions on Robotics, 37(6):1874–1890, 2021.
- [20] Tixiao Shan, Brendan Englot, Drew Meyers, Wei Wang, Carlo Ratti, and Rus Daniela. Lio-sam: Tightly-coupled lidar inertial odometry via smoothing and mapping. In IEEE/RSJ International Conference on Intelligent Robots and Systems (IROS), pages 5135–5142. IEEE, 2020.
- [21] Sören Schwertfeger and Andreas Birk. Map evaluation using matched topology graphs. Autonomous Robots, 40(5):761–787, 2016.
- [22] Jiawei Hou, Yijun Yuan, Zhenpeng He, and Sören Schwertfeger. Matching maps based on the area graph. Intelligent Service Robotics, 15(1):69–94, 2022.