The bar rotation rate as a diagnostic of dark matter content in the centre of disc galaxies
Abstract
We investigate the link between the bar rotation rate and dark matter content in barred galaxies by concentrating on the cases of the lenticular galaxies NGC 4264 and NGC 4277. These two gas-poor galaxies have similar morphologies, sizes, and luminosities. But, NGC 4264 hosts a fast bar, which extends to nearly the corotation, while the bar embedded in NGC 4277 is slow and falls short of corotation. We derive the fraction of dark matter within the bar region from Jeans axisymmetric dynamical models by matching the stellar kinematics obtained with the MUSE integral-field spectrograph and using SDSS images to recover the stellar mass distribution. We build mass-follows-light models as well as mass models with a spherical halo of dark matter, which is not tied to the stars. We find that the inner regions of NGC 4277 host a larger fraction of dark matter () with respect to NGC 4264 () in agreement with the predictions of theoretical works and the findings of numerical simulations, which have found that fast bars live in baryon-dominated discs, whereas slow bars experienced a strong drag from the dynamical friction due to a dense DM halo. This is the first time that the bar rotation rate is coupled to derived from dynamical modelling.
keywords:
galaxies: bar — galaxies: formation — galaxies: individual: NGC 4264 — galaxies: individual: NGC 4277 — galaxies: kinematics and dynamics — galaxies: structure1 Introduction
About two-thirds of disc galaxies, including the Milky Way, have a bar which is tumbling at the centre of the disc (Aguerri et al., 2009; Buta et al., 2015). The bar is an efficient agent for redistributing the stars by exchanging angular momentum, energy, and mass among the different galactic components including the dark matter (DM) halo (Athanassoula et al., 2013; Sellwood, 2014).
The main properties of bars are the radius , which defines the elongation of the stellar orbits in the bar, strength , which quantifies the non-axisymmetric contribution of the bar to the gravitational potential, pattern speed , which is the angular frequency of the bar figure rotation, and the rotation rate . The latter is defined as the dimensionless ratio between the length of the corotation radius , where stars circle the galactic centre at , and bar radius. The rotation rate does not depend on galaxy distance and distinguishes between fast () and slow bars () (Athanassoula, 1992; Debattista & Sellwood, 2000).
The two main mechanisms which trigger the formation of a bar are internal gravitational instabilities of the stellar disc (Sellwood, 1981) and external tidal interactions (Noguchi, 1987). Spontaneously-formed bars are usually thin, long, and fast (Athanassoula et al., 2013), whereas tidally-induced bars are thick, short, and slow (Martinez-Valpuesta et al., 2017). The bar properties evolve with time reshaping the morphology, orbital structure, mass distribution, star formation, and stellar population properties of their host galaxies (Laurikainen et al., 2007; Fragkoudi et al., 2016). Once formed, the bar becomes longer and stronger and it slows down on timescales, which depend on the DM content in the disc region (Debattista & Sellwood, 1998, 2000; Athanassoula & Misiriotis, 2002; Petersen et al., 2019).
In the last decade, the systematic investigation of the pattern speeds of large samples of barred galaxies with integral-field spectroscopy has shown that almost all bars are fast (Aguerri et al., 2015; Guo et al., 2019; Cuomo et al., 2020; Garma-Oehmichen et al., 2020, 2022) confirming the early findings based on long-slit spectroscopy of few selected objects (Corsini, 2011). This supports the idea that the central regions of lenticular and spiral galaxies host maximal (or nearly maximal) stellar discs with a low content of DM.
These observationally-driven findings are in conflict with the predictions of some hydro-dynamical cosmological simulations, for which galaxies are embedded in centrally-concentrated DM halos required by the CDM paradigm. Algorry et al. (2017) measured the bar properties in the galaxies extracted from the EAGLE simulation (Schaye et al., 2015) and found a reasonable agreement with the bar radii and strengths measured for real galaxies. However, the simulated bars experienced an intense slowdown due to the dynamical friction of the DM halo and many of them ended up slow at . Similarly, Roshan et al. (2021) found that the bars in the TNG50 simulation (Pillepich et al., 2018; Nelson et al., 2018) are much slower () with respect to the observed ones. More recently, the discrepancy between observations and simulations has been attenuated by the findings of Fragkoudi et al. (2021) and Marioni et al. (2022). Fragkoudi et al. (2021) analysed the barred galaxies in the AURIGA simulation suite (Grand et al., 2017) and showed that they have fast bars because they are more baryon-dominated with respect to those in the TNG simulation. Marioni et al. (2022) investigated the evolution of barred galaxies in the CLUES simulation (Gottloeber et al., 2010), which have shorter, but not slower, bars with respect to their observed counterparts. A possible explanation for these findings could reside in the different ingredients of the simulations so far analysed, including the resolution of the simulation and the gas fraction, disc thickness, stellar and AGN feedback, and baryonic content of the simulated galaxies.
Dynamical models of barred galaxies with accurate measurements of and are needed to rigorously test the predictions of numerical simulations regarding the bar properties as a function of gas content, luminosity and DM distribution. In this paper, we derive the mass distribution of two barred galaxies, NGC 4264 and NGC 4277, for which the values of are amongst the best-constrained ones ever obtained with direct measurements (Tremaine & Weinberg, 1984). This will allow us to investigate the link between and the DM content in the bar region because NGC 4264 hosts a fast bar (, Cuomo et al. 2019a) while the bar in NGC 4277 is slow (, Buttitta et al. 2022). We aim at understanding whether a larger value of results from the effective bar braking due to the dynamical friction exerted by the DM halo and therefore is a diagnostic of a large content of DM in the bar region.
2 Main properties of NGC 4264 and NGC 4277
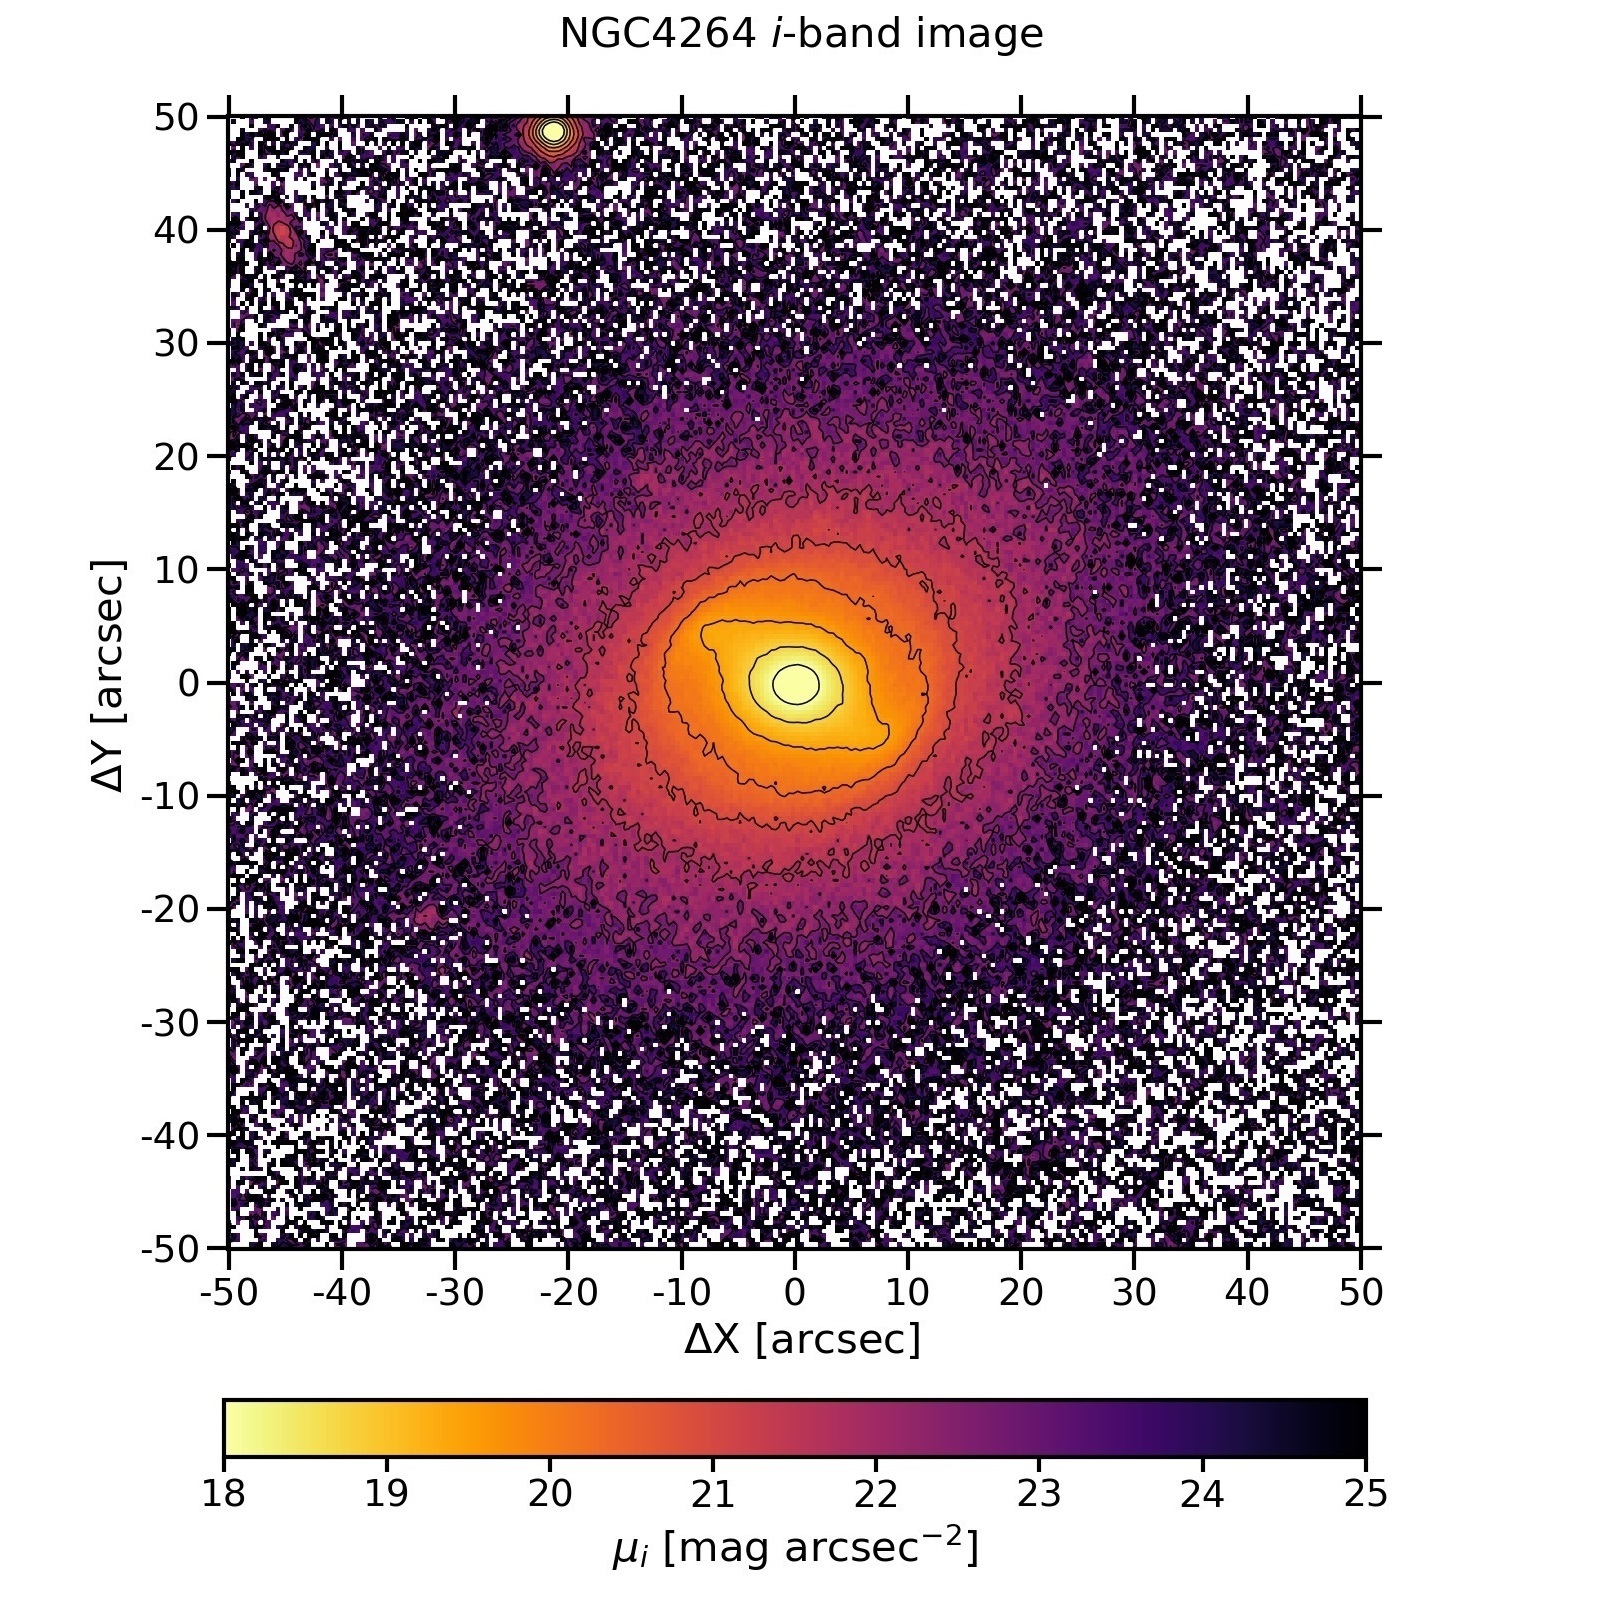
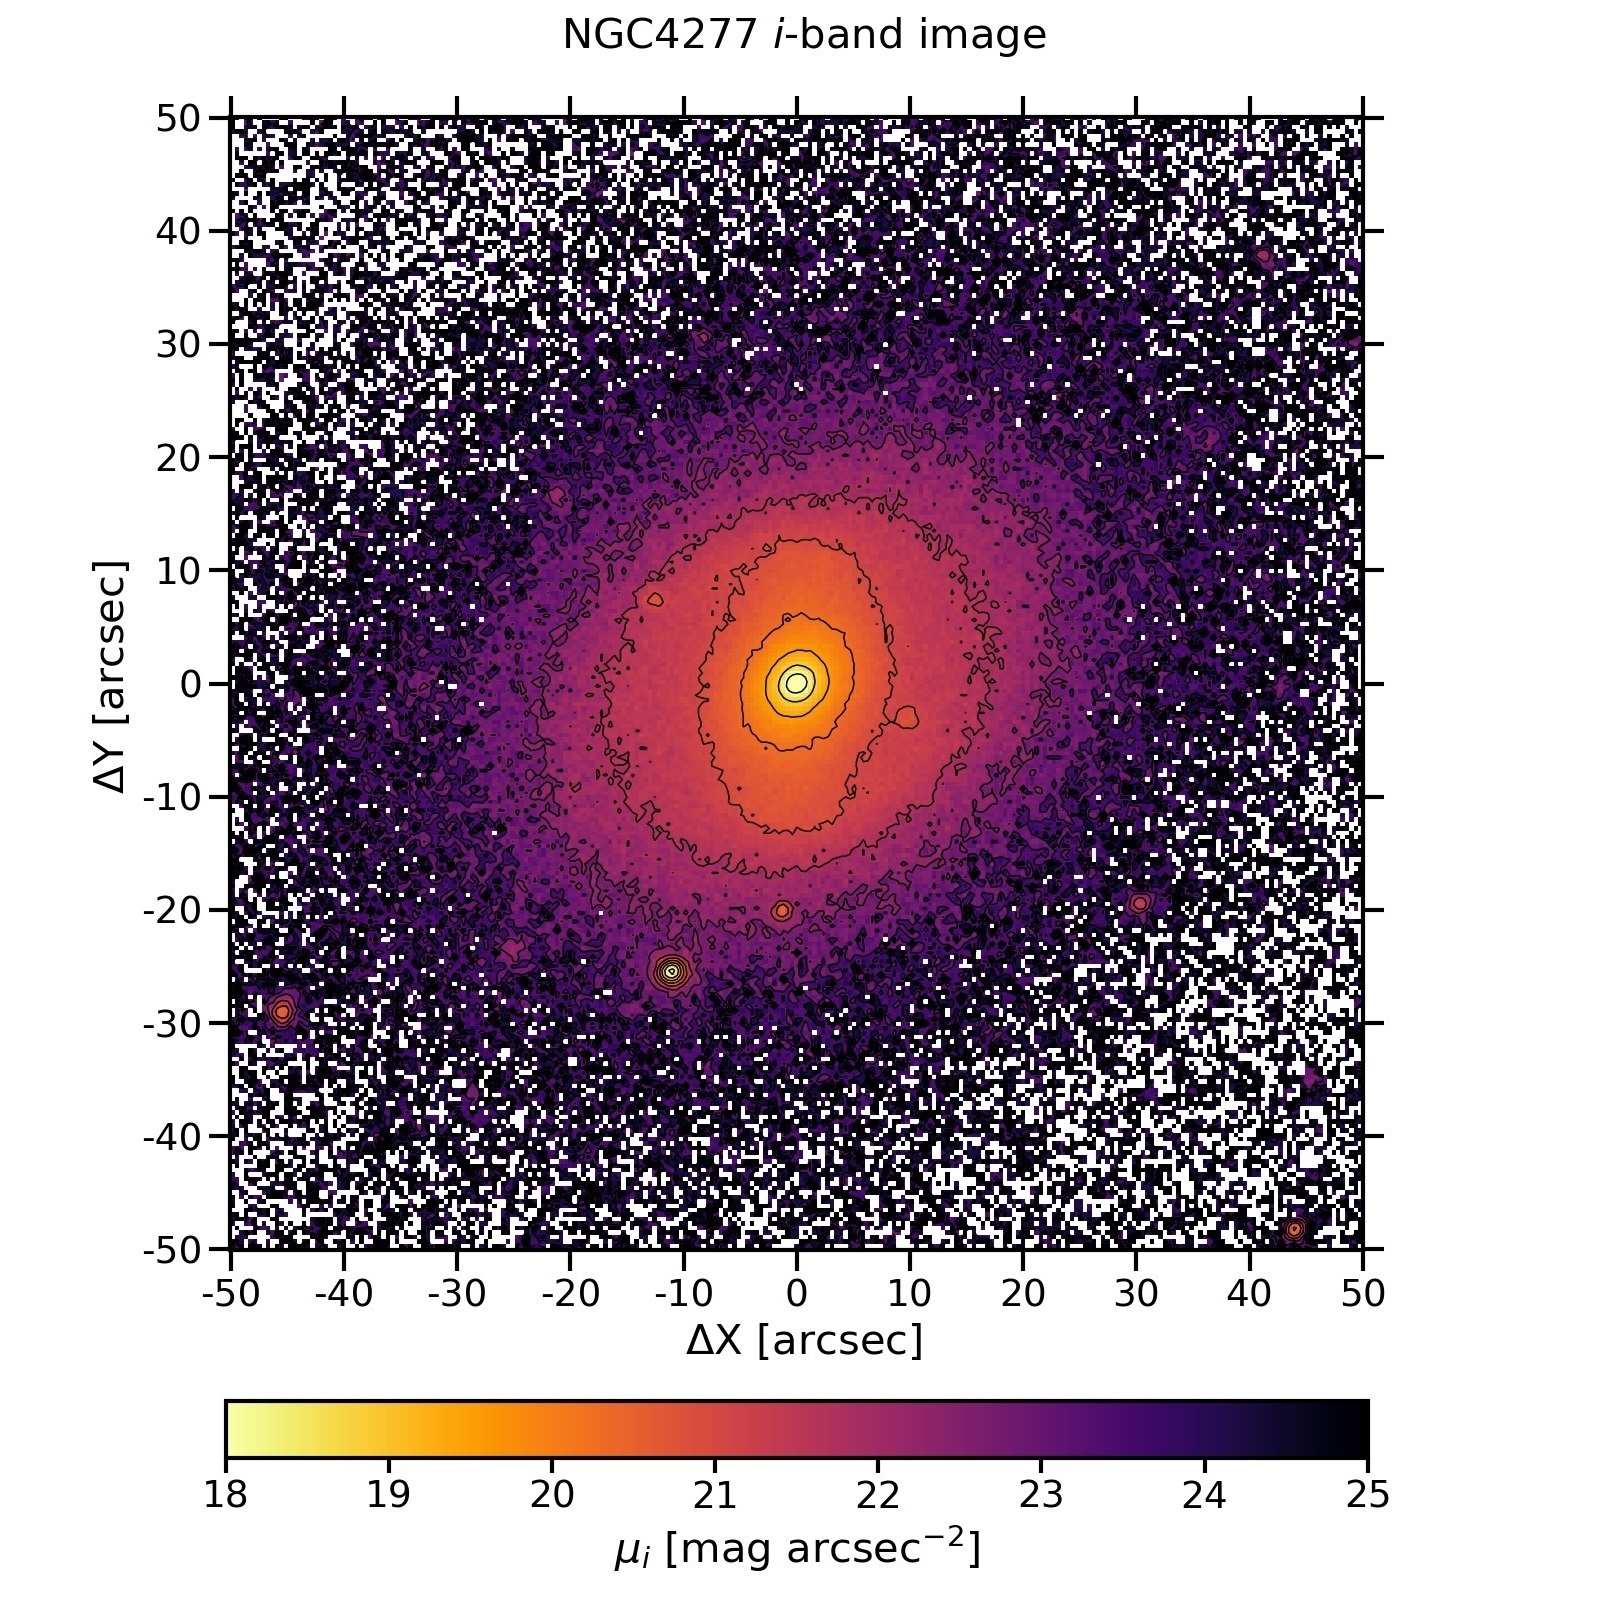
NGC 4264 and NGC 4277 are two early-type disc galaxies classified as SB0+(rs) and SAB(rs)0/a respectively by de Vaucouleurs et al. (1991, hereafter RC3). They have a quite similar morphology (Fig. 1) with a well-defined bar surrounded by a pseudo-ring and oriented at an intermediate position angle with respect to the major and minor axes of the disc (). The bar region appears to be mostly free of dust and star formation and the disc has an intermediate inclination (). NGC 4264 and NGC 4277 have similar luminosity and size, as calculated from the apparent corrected magnitude (RC3) and galaxy diameters and (RC3) by adopting the distance obtained from the radial velocity with respect to the cosmic microwave background reference frame (Fixsen et al., 1996). NGC 4264 and NGC 4277 are located behind the Virgo cluster. They likely form an interacting couple with the giant elliptical galaxy NGC 4261 (Schmitt, 2001) and with the spiral galaxy NGC 4273 (Kim et al., 2014), respectively. The main properties of both galaxies are given in Table 1.
| Property | NGC 4264 | NGC 4277 | ||
| (1) | Morph. Type | SB0+(rs) | SAB(rs)0/a | |
| (2) | [mag] | |||
| (3) | [Mpc] | |||
| (4) | [kpc2] | |||
| (5) | PAdisc | [∘] | ||
| (6) | [∘] | |||
| (7) | PAbar | [∘] | ||
| (8) | [kpc] | |||
| (9) | ||||
| (10) | [km s-1] | |||
| (11) | [km s-1 kpc-1] | |||
| (12) | [kpc] | |||
| (13) |
3 Properties of the bars
Cuomo et al. (2019a) and Buttitta et al. (2022) analysed the surface photometry and integral-field spectroscopy of NGC 4264 and NGC 4277, respectively, to characterise the properties of their bars. They measured the bar radius and strength from the surface photometry obtained from broad-band imaging of the Sloan Digital Sky Survey (SDSS). They derived the bar pattern speed from the stellar kinematics obtained from integral-field spectroscopy performed with the Multi Unit Spectroscopic Explorer (MUSE) at the Very Large Telescope (VLT). They also estimated the co-rotation radius from the circular velocity, which they constrained by correcting the stellar streaming motions for asymmetric drift. Finally, they derived the bar rotation rate. Here, we provide a concise description of the acquisition and analysis of the photometric and kinematic data and a summary of the results. The properties of the bars of both galaxies are given in Table 1.
3.1 Bar radius and strength
Cuomo et al. (2019a) and Buttitta et al. (2022) analysed the flux-calibrated -band images of both galaxies available in the science archive of the SDSS Data Release 14 (Abolfathi et al., 2018). They were obtained with a spatial sampling of arcsec pixel-1, total exposure time of 53.9 s, and seeing . The images were sky subtracted and trimmed selecting a field of view (FOV) of pixel2 centred on the galaxies corresponding to arcmin2.
The isophotal analysis recovered the geometric parameters PAdisc and of the galaxy disc, which were adopted to deproject the galaxy image. The photometric decomposition was performed to estimate the position angle, PAbar, of the bar and its contribution to the galaxy surface brightness.
For both galaxies, the radius of the bar was derived as the mean of the estimates obtained from the analysis of the radial profile of the position angle of the interpolated isophotes on the deprojected image as in Aguerri et al. (2003), of the intensity contrast between the bar and interbar regions following Aguerri et al. (2000), and of the photometric decomposition adopting a Ferrers bar as in Méndez-Abreu et al. (2017). The strength of the bar was derived as the mean of the values obtained from the Fourier analysis of the deprojected image as in Athanassoula & Misiriotis (2002) and from the bar axial ratio as in Aguerri et al. (2009). The errors on and were estimated by calculating the difference between the adopted value and the highest/lowest measure. The two bars have lengths consistent with the median value found for SB0 galaxies (Aguerri et al., 2009) and are both weak according to the classification of Cuomo et al. (2019b).
3.2 Bar pattern speed and rotation rate
The integral-field spectroscopy was carried out with the wide field mode of MUSE (Prog. Id. 094.B-0241(A); P.I.: E.M. Corsini) mapping a nominal FOV of arcmin2 with a spatial sampling of arcsec pixel-1 and covering the wavelength range of Å with a spectral sampling of 1.25 Å pixel-1 and a nominal spectral resolution of Å. The mean value of the seeing during the observations was arcsec. The observations were split into different observing blocks which were mosaiced to fully map the galaxies along their photometric major axis for an actual FOV coverage of arcmin2.
Cuomo et al. (2019a) and Buttitta et al. (2022) measured the stellar and ionised-gas kinematics of the two galaxies by using the ppxf (Cappellari & Emsellem, 2004) and gandalf (Sarzi et al., 2006) codes. The spaxels in the datacube were spatially binned with the Voronoi tessellation algorithm (Cappellari & Copin, 2003) to ensure a target signal-to-noise ratio per bin. In each bin, the galaxy spectrum was fitted by convolving the spectra extracted from the ELODIE stellar library ( km s-1, Prugniel & Soubiran 2001) with a line-of-sight velocity distribution (LOSVD) modelled with a truncated Gauss-Hermite series (van der Marel & Franx, 1993; Gerhard, 1993) in the wavelength range Å. The circular velocity was derived by correcting the stellar streaming motion for the asymmetric drift (Binney & Tremaine, 1987).
The pattern speed of both bars was obtained by applying the Tremaine-Weinberg method (Tremaine & Weinberg, 1984) on the reconstructed image and stellar velocity field of the host galaxies. The value of is given by . It depends on the disc inclination and on the luminosity-weighted position and LOS velocity of the stellar component within apertures parallel to the disc major axis and crossing the bar. Finally, the corotation radius and the rotation rate values were estimated calculating = and , respectively. The errors on and were estimated by using Monte Carlo simulations. We generated a distribution of and by accounting for the errors on , , and . The adopted errors for and are calculated as the 16th and 84th percentiles of the distributions.
The two galaxies have similar properties in terms of bar size and strength, but not in terms of bar pattern speed: NGC 4264 hosts a fast bar () while the bar in NGC 4277 is slow (). The different bar rotation rates could be due to a different bar formation mechanism and/or a different DM content in the bar region.
Although NGC 4264 possibly forms an interacting pair with NGC 4261, which is located at a projected distance of 3.5 arcmin (Schmitt, 2001), which corresponds to a quite large physical distance of 4.9 Mpc, it lacks a strongly disturbed morphology. According to Cuomo et al. (2019a), this suggests that the interaction is weak and not responsible for have triggered the bar formation in NGC 4264. NGC 4277 is likely paired with NGC 4273, which is located at a projected distance of 1.9 arcmin (van Driel et al., 2000) corresponding to a physical distance of 2.5 Mpc. Buttitta et al. (2022) argued that the bar formation in NGC 4277 could have been triggered by their tidal interaction or alternatively, the bar could have been braked by the dynamical friction of a dense DM halo (Debattista et al., 2006; Athanassoula et al., 2013).
4 Stellar dynamical model
4.1 Jeans dynamical models
Reconstructing the mass distribution of a disc galaxy using unresolved stars as tracers of the gravitational potential is a challenging task due to the non-uniqueness of the light deprojection (Rybicki, 1987; Gerhard & Binney, 1996). The bar introduces a further complication since its characterisation requires two additional parameters: the orientation and figure rotation (Lablanche et al., 2012). This increases the degeneracy between the model parameters with different combinations able to reproduce the observed photometric and kinematic properties of the galaxy.
Several methods have been developed to recover the dynamical structure of a galaxy from broad-band imaging and long-slit/integral-field spectroscopy, but the dynamical modelling of barred galaxies is still at an early stage. The recently developed orbit-superposition Schwarzschild models by Vasiliev & Valluri (2020) and Tahmasebzadeh et al. (2022), which to date have been applied only to data from N-body simulations, considered the bar pattern speed. Portail et al. (2016) built a dynamical model of the Milky Way to recover its bar pattern speed by using the made-to-measure method as implemented by de Lorenzi et al. (2007).
In general, barred galaxies have been modelled with axisymmetric dynamical models, including the Jeans Anisotropic Modelling (JAM, Cappellari, 2008, 2020), which has been extensively applied to spectroscopic surveys of nearby lenticular and spiral galaxies (e.g., Williams et al., 2009; Cappellari et al., 2013; Guo et al., 2019). It models the LOS second velocity moment for galaxies with an axisymmetric mass distribution, including a DM halo, to be compared with the root-mean-square velocity derived from the observed velocity and velocity dispersion . JAM requires the surface-brightness distribution of the galaxy to be described through a Multi-Gaussian Expansion (MGE, Cappellari, 2002) parameterisation, which simplifies the solution of Jeans equations to recover the galaxy inclination , mass-to-light ratio of the matter following the light (which may include DM as well as stars), and anisotropy parameter , where and are the radial and vertical components of the velocity dispersion, respectively, in a cylindrical coordinate system with the origin in the centre of the galaxy and symmetry axis aligned with its rotation axis.
Cappellari (2008) compared the JAM and orbit-superposition Schwarzschild models of six fast-rotating lenticular galaxies from the SAURON survey (de Zeeuw et al., 2002). They have HST and ground-based photometry and SAURON integral-field spectroscopy. The values of from JAM are consistent within the uncertainties with those obtained with the Schwarzschild modelling. Since fast rotators show a slightly positive value of , the inclination-anisotropy degeneracy was removed, constraining . Although there is a small dependence on the anisotropy parameter, overall the values and mass models obtained with the two approaches are also in agreement. This means that the JAM model, with simple and well-motivated assumptions, provides a reasonable description of the mass distribution of lenticular galaxies.
Cappellari et al. (2013) applied the JAM algorithm to 260 nearby early-type galaxies of the ATLAS3D survey (Cappellari et al., 2011), whose surface-brightness distribution was measured from SDSS and Isaac Newton Telescope imaging and the stellar kinematics were traced out to roughly one effective radius with SAURON integral-field spectroscopy. This volume-limited sample was composed of galaxies with a distance Mpc, absolute magnitude mag, and stellar mass M⊙. The stellar kinematics of most of the sample galaxies are reasonably well reproduced by mass-follows-light models, suggesting that early-type galaxies have a simple internal structure within , and that the DM halo is not dominant. By adding the contribution of a NFW (Navarro et al., 1995) DM halo, Cappellari et al. (2013) estimated a median DM fraction within the effective radius of . About one-third of the sample galaxies host a bar and for some of them, the quality of the fit was poor due to the low and/or twisted stellar kinematics or the presence of a strong bar. The recovered values of for the whole sample have an accuracy of 6 per cent, which falls to 15 per cent for the barred galaxies.
Lablanche et al. (2012) analysed realistic simulations of two SB0 galaxies to explore the reliability of the JAM approach in recovering the dynamical parameters of a barred galaxy. The simulated galaxies mimicked NGC 4442 and NGC 4754 and were projected at different disc inclinations (, and ) and with different bar orientation (, and ). In general, can be recovered with JAM although this result is biased by the non-uniqueness of the mass deprojection in nearly face-on or edge-on barred systems (with a maximum error for edge-on systems). The value of is not well recovered for any disc inclination and bar orientation, because the bar produces a deprojected mass density which is flatter or rounder with respect to the azimuthally averaged one when the bar is viewed side-on or end-on, respectively. This issue is not unique to JAM, but is expected to affect also the axisymmetric dynamical models based on orbit superposition. The recovered depends on the disc inclination and bar orientation. The uncertainty is smaller than 1.5 per cent for systems with and and it never exceeds 3 per cent for the other inclinations. The recovered is underestimated (overestimated) if PA (PA). In their tests, they found that the maximum systematic error of 15 per cent on occurs when the bar is seen nearly end-on (PA) or side-on (PA). They also investigated how the size of the FOV affects the recovered parameters, and concluded that if the FOV extends out to the bar radius, the systematic uncertainty on decreases and tends to a limiting value of 10 per cent. However, the mass models of Lablanche et al. (2012) did not include DM halos.
We adopted the JAM method to recover the mass distribution of NGC 4264 and NGC 4277, since we are confident that applying such an axisymmetric dynamical model gives a reliable estimate of and DM fraction even in barred galaxies. Both objects are ideal targets according to Lablanche et al. (2012), because they have an intermediate inclination (), are not substantially affected by dust, and host a weak bar with an intermediate orientation with respect to the disc major and minor axis (). According to Lablanche et al. (2012), in this configuration, we expect to systematically overestimate the by a factor of 10 per cent. This translates into a larger overestimate of the DM fraction in galaxies with a larger content of luminous matter. In addition, the fine spatial sampling, wide FOV, and high spectral resolution of the MUSE integral-field spectrograph made it possible to accurately map the stellar kinematics throughout the galaxy disc. The kinematic maps do not show strong perturbed features as prescribed to minimise the biases in the estimation of the dynamical parameters. Finally, we notice that NGC 4264 and NGC 4277 have similar luminosities to those of NGC 4442 and NGC 4754. This gives us confidence in extending the findings of Lablanche et al. (2012) to our galaxies.
4.2 Multi-Gaussian expansion
To obtain a model for the luminosity volume density of both NGC 4264 and NGC 4277, we started by parameterising the -band surface brightness of the sky-subtracted image of each galaxy as the sum of a set of Gaussian components by using the MGE Python code, which is based on Cappellari (2002). The MGE method allows for a simple reconstruction of the intrinsic surface brightness distribution provided that the point spread function (PSF) can be approximated as a sum of Gaussian components. The intrinsic surface brightness distribution is then easily deprojected into the luminosity volume density, which is also parameterised as the sum of a set of Gaussian components.
We adopted the centre coordinates derived for the two galaxies by Cuomo et al. (2019a) and Buttitta et al. (2022). We estimated the root mean square of the sky surface brightness by performing a statistical analysis on different regions of the images containing exclusively the sky contribution. These areas were selected in empty regions, which were free of objects and far from the target galaxy to avoid the contamination of the light of field stars and background galaxies, as well as of the galaxy itself. Finally, we modelled the PSF by applying the MGE algorithm on a bright, isolated, and round-shaped field star constraining the best-fitting Gaussians to have a perfect circular shape. The surface brightness distribution of NGC 4264 is characterised by an isophotal twist in the outermost regions. The internal (PA) and external regions (PA) of the disc have different orientations but the same shape () as found by Cuomo et al. (2019a). They argued that the isophotal outer twist is not representative of the actual orientation of the disc. We decided to constrain the Gaussians with the geometric parameters of the internal disc which is mapped by the measured stellar kinematics. The radial profiles of PA and derived by Buttitta et al. (2022) from the surface brightness distribution of NGC 4277 show a clear disc-dominated region with a well-defined orientation (PA) and shape ().
We obtained the MGE best-fitting model to the galaxy surface brightness by keeping constant the centre and position angle of the Gaussians derived by Cuomo et al. (2019a) and Buttitta et al. (2022), while further restricting the range of the resulting axial ratios of the Gaussian components to [, 1] where . This ensured that the permitted galaxy inclinations were not limited to a narrower range than that allowed by the data (e.g., Scott et al., 2013; Pagotto et al., 2019).
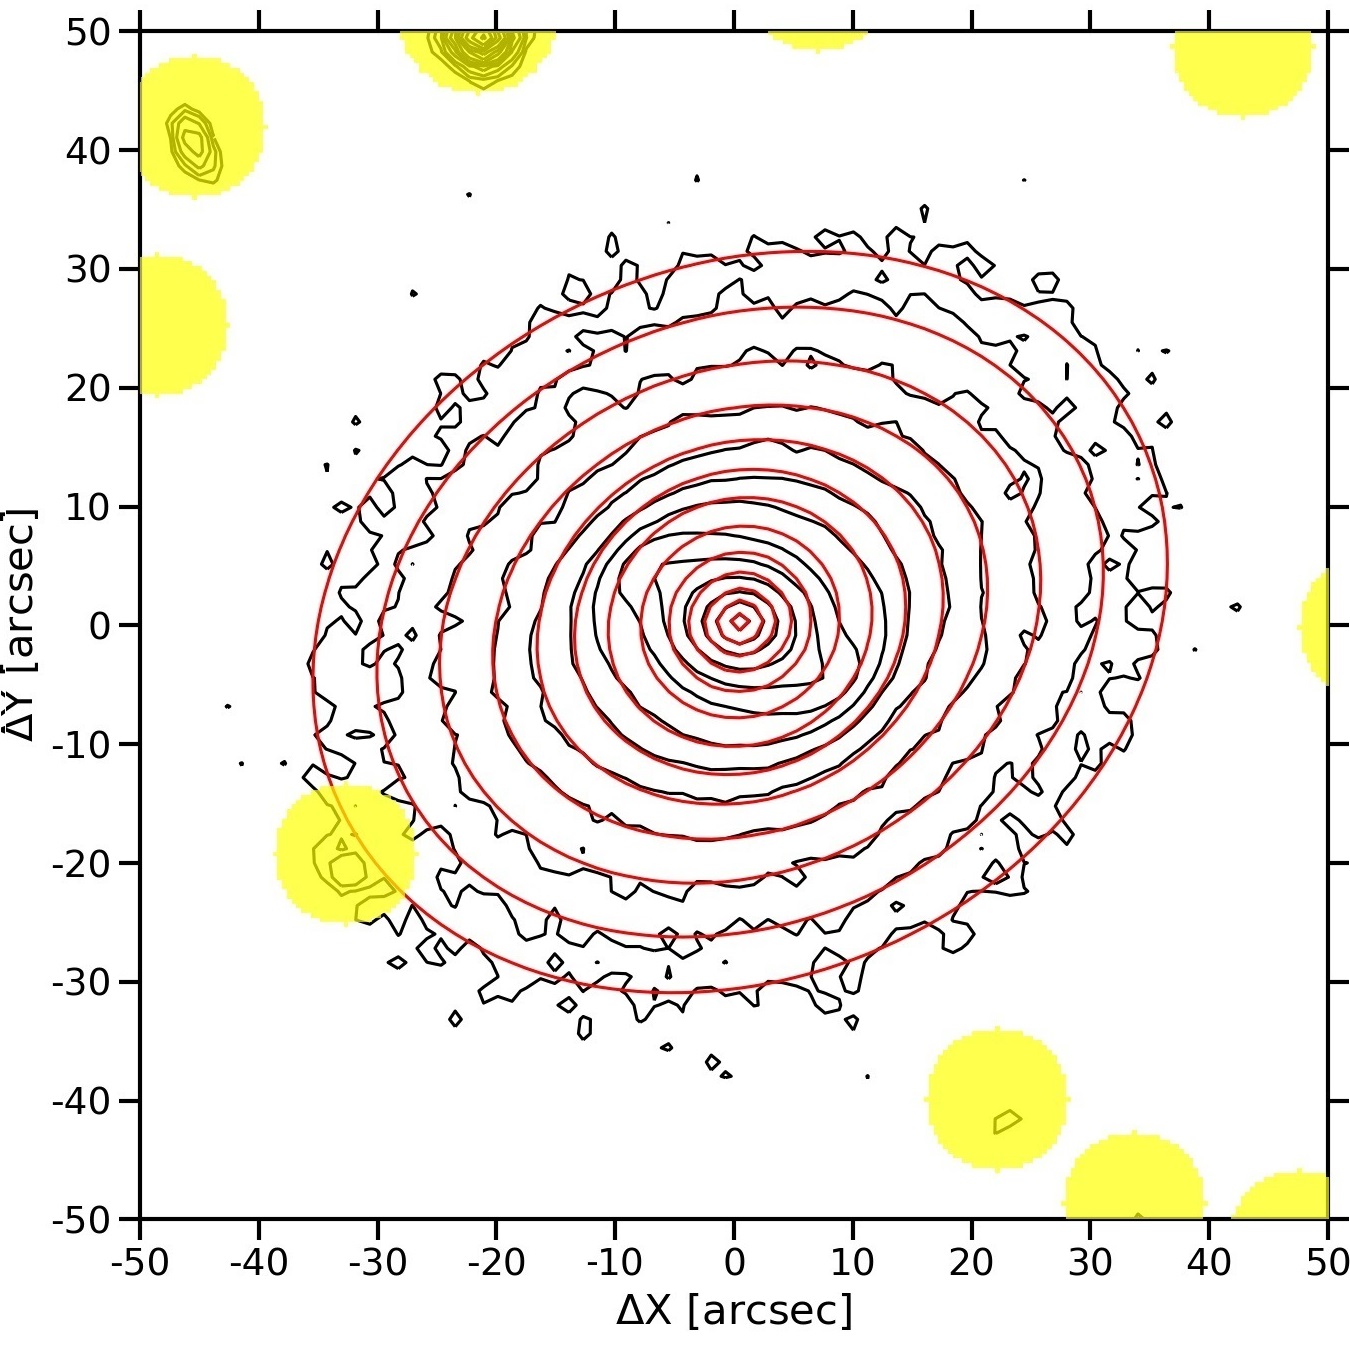
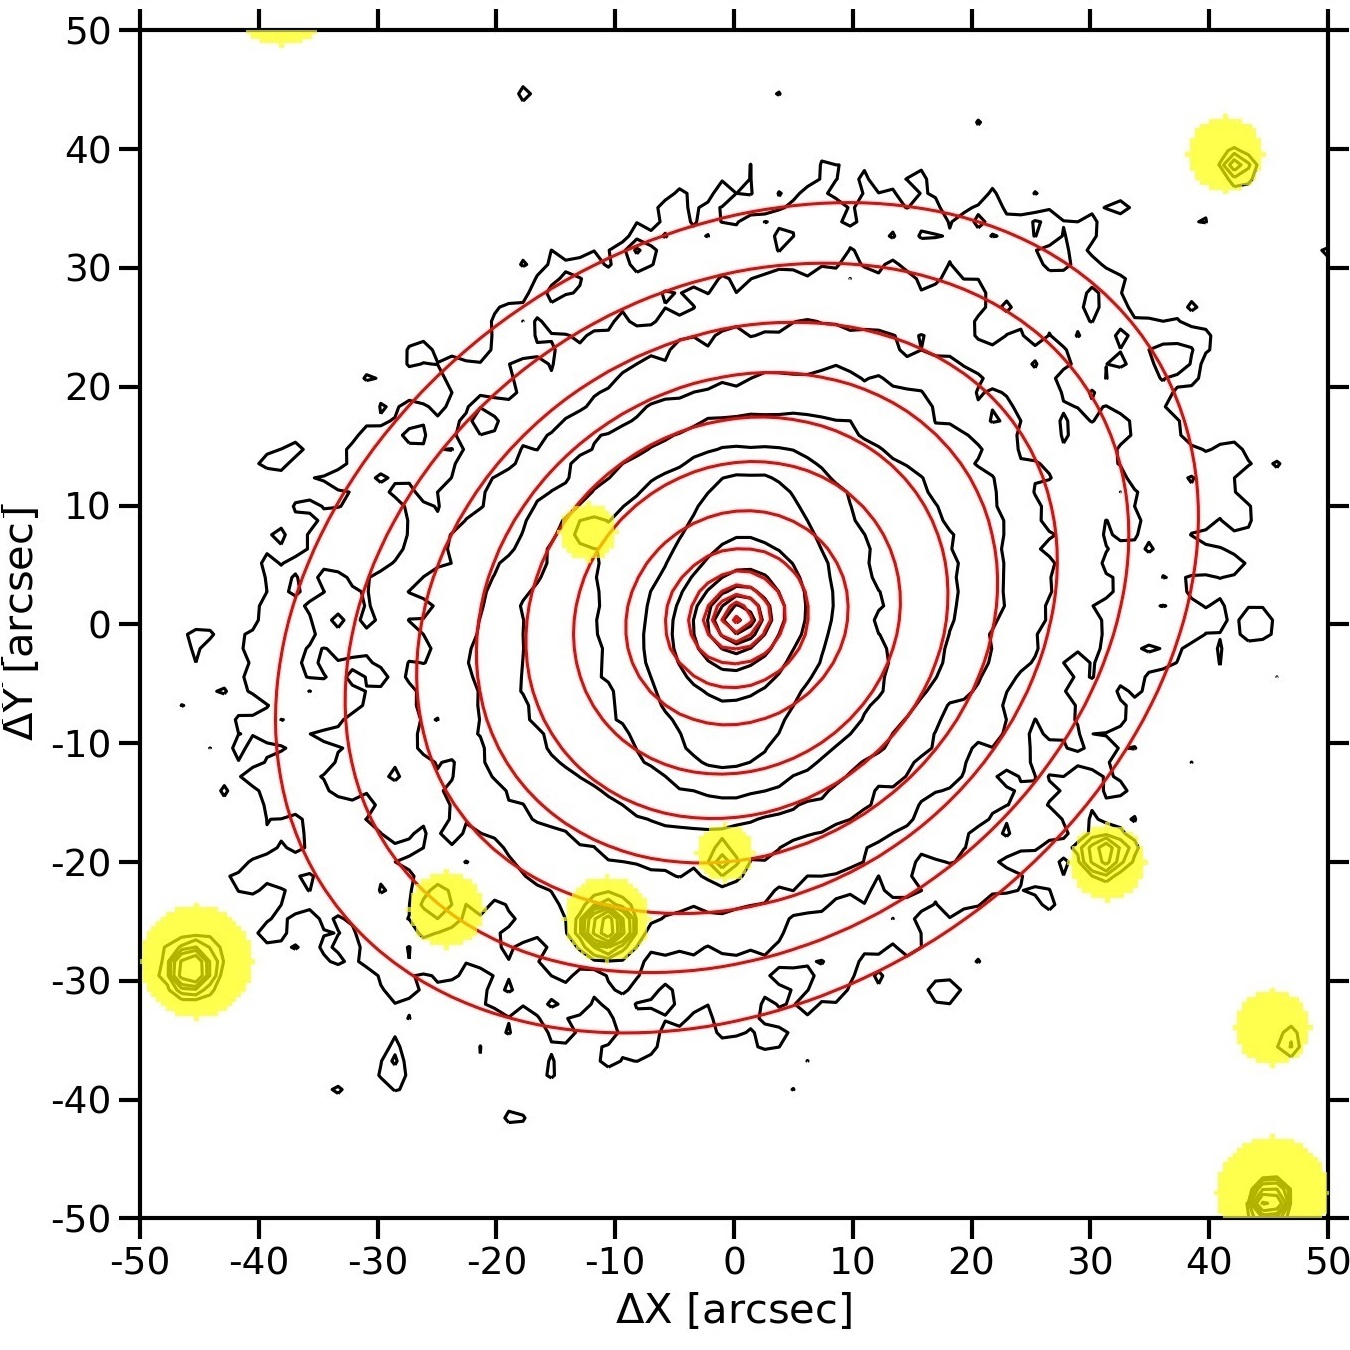
We show a few representative isophotes of the -band images of NGC 4264 and NGC 4277 and compare these to the corresponding MGE best-fitting contours in Fig. 2. The MGE algorithm provided the total luminosity in counts, root mean square in pixels, and axial ratio for each best-fitting Gaussian parameterising the intrinsic surface brightness distribution. We converted the output parameters into physical units by using the flux calibration and spatial scale of the images given by Cuomo et al. (2019a) and Buttitta et al. (2022) and correcting for cosmological dimming, -correction (Chilingarian & Zolotukhin, 2012), and Galactic extinction (Schlafly & Finkbeiner, 2011). We adopted mag as the absolute magnitude of the Sun in the SDSS -band (Willmer, 2018). We list the MGE best-fitting parameters of the intrinsic surface brightness distribution of NGC 4264 and NGC 4277 in Table 2.
| NGC 4264 | NGC 4277 | ||||
|---|---|---|---|---|---|
| (1) | (2) | (3) | (1) | (2) | (3) |
| 15427.0 | 0.04 | 0.80 | 5106.5 | 0.08 | 0.88 |
| 4309.5 | 0.13 | 0.80 | 1023.8 | 0.20 | 0.85 |
| 691.4 | 0.34 | 0.80 | 353.5 | 0.48 | 0.92 |
| 1141.1 | 0.43 | 1.00 | 158.6 | 1.52 | 0.91 |
| 443.8 | 1.01 | 1.00 | 41.9 | 3.78 | 0.76 |
| 219.3 | 1.72 | 0.80 | |||
| 64.8 | 3.86 | 0.81 | |||
4.3 Axisymmetric Jeans anisotropic model
With the MGE models at hand, we proceeded to use the JAM Python code based on Cappellari (2008) to build Jeans axisymmetric dynamical models for NGC 4264 and NGC 4277 in order to derive the DM content within the bar region.
We selected the best-fitting JAM model by minimising the difference between the predicted second moment of the velocity field and MUSE stellar kinematics measured by Cuomo et al. (2019a) and Buttitta et al. (2022). To this aim, we obtained, for each spatial bin, the observed as
and its corresponding error
We discarded the bins with values of and with relative uncertainties and . In both galaxies, the maximum uncertainty on never exceeds km s-1. Finally, we symmetrised the resulting values with respect to the disc major axis by means of the Python algorithm plotbin. We show the maps of NGC 4264 and NGC 4277 in the top-left panels of Fig. 3 and 4, respectively.
We modelled the total mass distribution of both galaxies as the sum of two components
where is the mass volume density of matter (either luminous or dark) that is distributed like the stars and is the mass volume density of DM distributed in a spherical halo. We built a set of mass-follows-light models by assuming that the mass volume density follows the luminosity volume density derived by deprojecting the intrinsic surface brightness distribution obtained from the MGE
These models have three free parameters that are optimised while matching the observed . They are , , and . We adopted radially constant values for both and .
Then, we included the contribution of the DM halo , for which we considered
-
1.
a quasi-isothermal (QI, Binney & Tremaine, 1987) radial profile of the mass volume density
where and are the central mass volume density and core radius, respectively.
-
2.
a NFW radial profile of the mass volume density
where and are the scale mass volume density and scale radius, respectively. We reduced the number of free parameters by adopting the following parameterisation
where the virial mass and coefficient are respectively given by
with M⊙ pc-3, and , and
where is the concentration parameter. We followed the relation by Klypin et al. (2011) to derive
In this way, the mass model has only a free parameter .
-
3.
a generalised NFW (gNFW, Barnabè et al., 2012) radial profile of the mass volume density
where and are the scale mass volume density and scale radius, respectively, while the parameter gives the inner slope of the radial profile. We constrained it in the range , with corresponding to a cored profile and to a NFW profile.
For each mass model, we computed the radial profiles of the enclosed mass and circular velocity for the stars, DM in the halo, and their sum. We used Monte Carlo simulations to estimate the confidence intervals. At each radius, we generated a distribution of enclosed mass and circular velocity taking into account the errors on the best-fitting parameters of the mass model. The adopted errors of enclosed mass and circular velocity for the stars, DM in the halo, and their sum are calculated as the 16th and 84th percentiles of the distributions.
For the three mass models with a DM halo, we calculated the fraction of DM within the bar region as
We calculated the corresponding errors as the 16th and 84th percentiles of the distribution of that we built from the same Monte Carlo simulations previously generated.
The JAM code allows the inclusion of the contribution of a central supermassive black hole (SMBH), which is modelled through the MGE formalism as a Gaussian having mass , axial ratio and , with defined as the smallest distance from the SMBH that can be chosen (Cappellari, 2008, 2020). Due to the limited spatial resolution of the available ground-based kinematic observations, we can not constrain the mass of the central SMBH. Therefore, we decided to adopt the SMBH mass value given by the relation (Kormendy & Ho, 2013). We estimated the bulge effective velocity dispersion from the MUSE kinematic map and the reconstructed image as the luminosity-weighted average of the observed inside an elliptical region with a semi-major axis equal to half of the bulge effective radius and the same axial ratio of the bulge. We adopted the values obtained by Cuomo et al. (2019a) and Buttitta et al. (2022) with a parametric photometric decomposition of the SDSS images of NGC 4264 ( arcsec, ) and NGC 4277 ( arcsec, ).
5 Results
For both galaxies, we obtained the best-fitting parameters for all the mass models without and with a DM halo. We analysed the mass-follows-light models as well as the models with a QI, NFW, and gNFW DM halo to constrain the DM fraction within the bar region of NGC 4264 and NGC 4277.
5.1 NGC 4264
We construct a starting set of mass models by considering the galaxy inclination as a free parameter. The mass models with a DM halo return the same value (QI, gNFW) or a value consistent within errors (NFW) with that obtained by Cuomo et al. (2019a) from the isophotal analysis of NGC 4264 (), whereas the mass-follows-light model gives a much larger value ().
We repeat the analysis after masking the kinematic bins within a circular region of radius arcsec, which corresponds to the bar radius projected onto the sky plane. In this way, we consider only the kinematic data measured in the disc region. But, all the mass models converge to an edge-on solution with as a consequence of the inclination-anisotropy degeneracy (Krajnović et al., 2005; Lablanche et al., 2012). We verify that this result is not driven by the twisted structure of the disc of NGC 4264. The kinematic bins in the external disc ( arcsec) account for less than 1 per cent of the data and the mass models based on a different MGE decomposition of the SDSS image, where we mask the external disc, do not improve the fit. We perform a further sanity check by masking the kinematic bins in the central circular region of radius arcsec to minimise biases due to an uncorrected estimation of the PSF and/or the SMBH mass. Then, we decide to fix the inclination to build the final set of mass models. We adopt which corresponds to the photometric value of Cuomo et al. (2019a). An intrinsic flattening is adopted in JAM modelling to derive from the observed axial ratio, whereas is obtained by Cuomo et al. (2019a) assuming an infinitesimally thin disc. The choice of a fixed inclination allows a straightforward comparison between the best-fitting parameters of the different mass models, which we list in Table 3 together with their reduced .
We find a slightly larger mass-to-light ratio for the mass-follows-light model ( M⊙ L) with respect to the mass models with a DM halo ( M⊙ L). This is expected if there is a small amount of DM, which is not distributed like the stars. Since we are interested in recovering the mass distribution of NGC 4264 and not in its orbital structure, we were not concerned by the fact that the mass-follows-light model was not able to constrain and the mass models with the DM halo returned a remarkably negative value of anisotropy ().
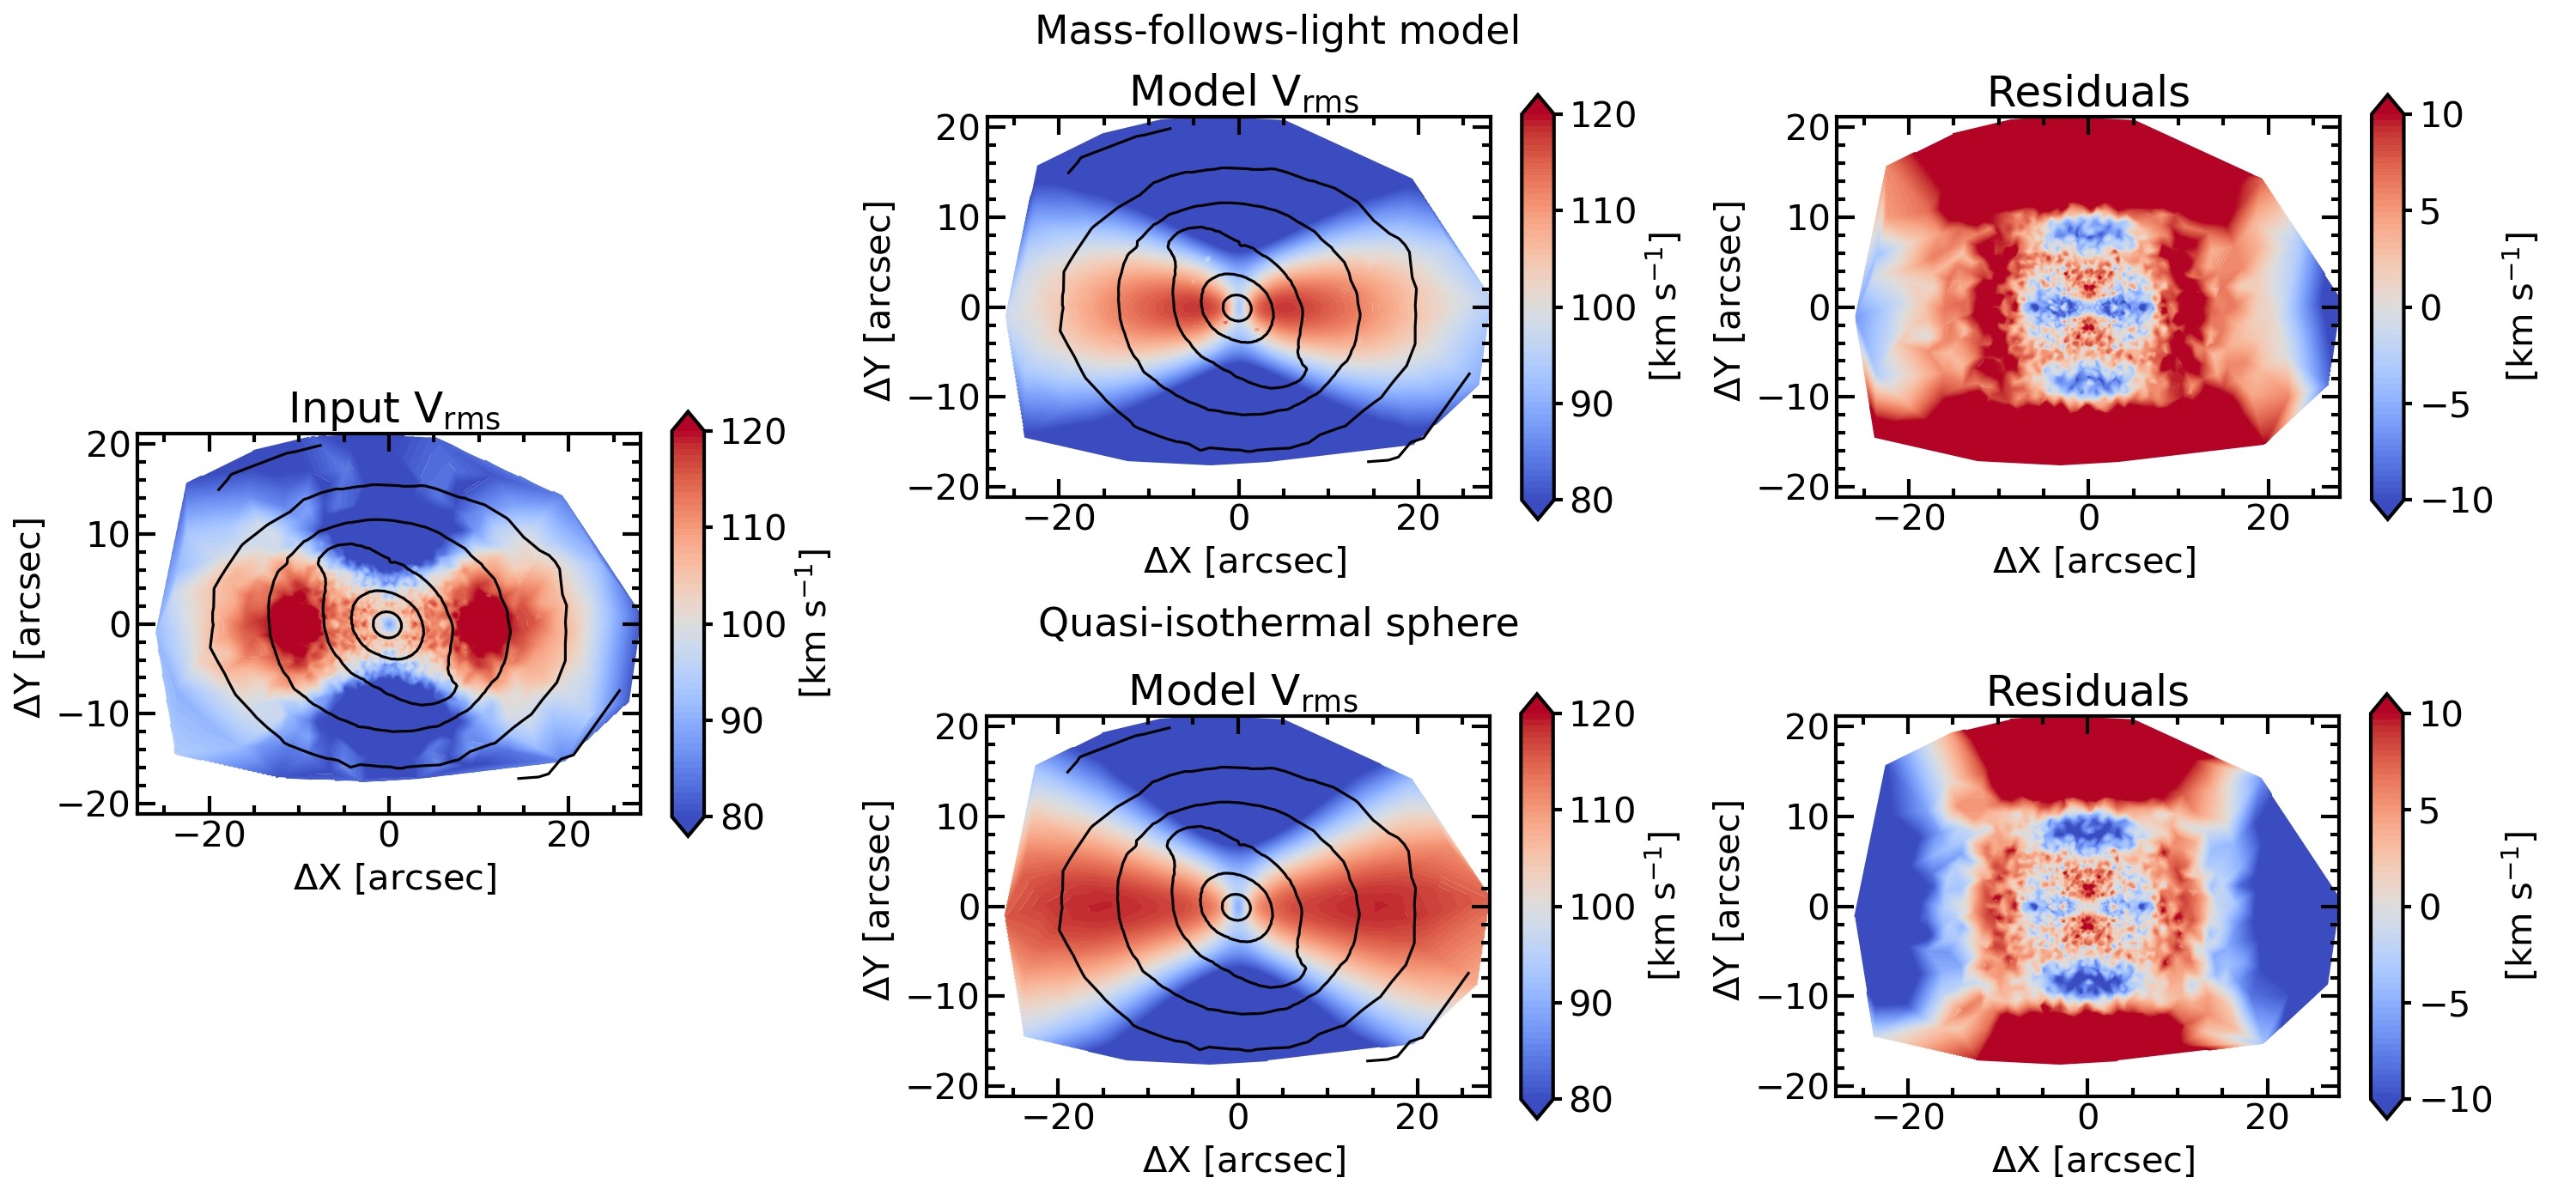
The observed is characterised by a central local minimum of km s-1 with a remarkable double-peaked structure with a maximum of km s-1 at arcsec along the galaxy major axis decreasing to km s-1 at arcsec (Fig. 3, left panel). Although the overall shape of the iso-velocity contours is reproduced by the mass-follows-light model (Fig. 3, top-centre panel), it fails to match the location and amplitude of the double peak of (Fig. 3, top-right panel). The mass models with a DM halo provide a better fit to the observed (Fig. 3, bottom-centre panel), although they do not correctly reproduce the decrease measured at large radii along the galaxy major axis (Fig. 3, bottom-right panel). At face value, the mass model with the QI halo is marginally better than those with the NFW () and gNFW halo ().
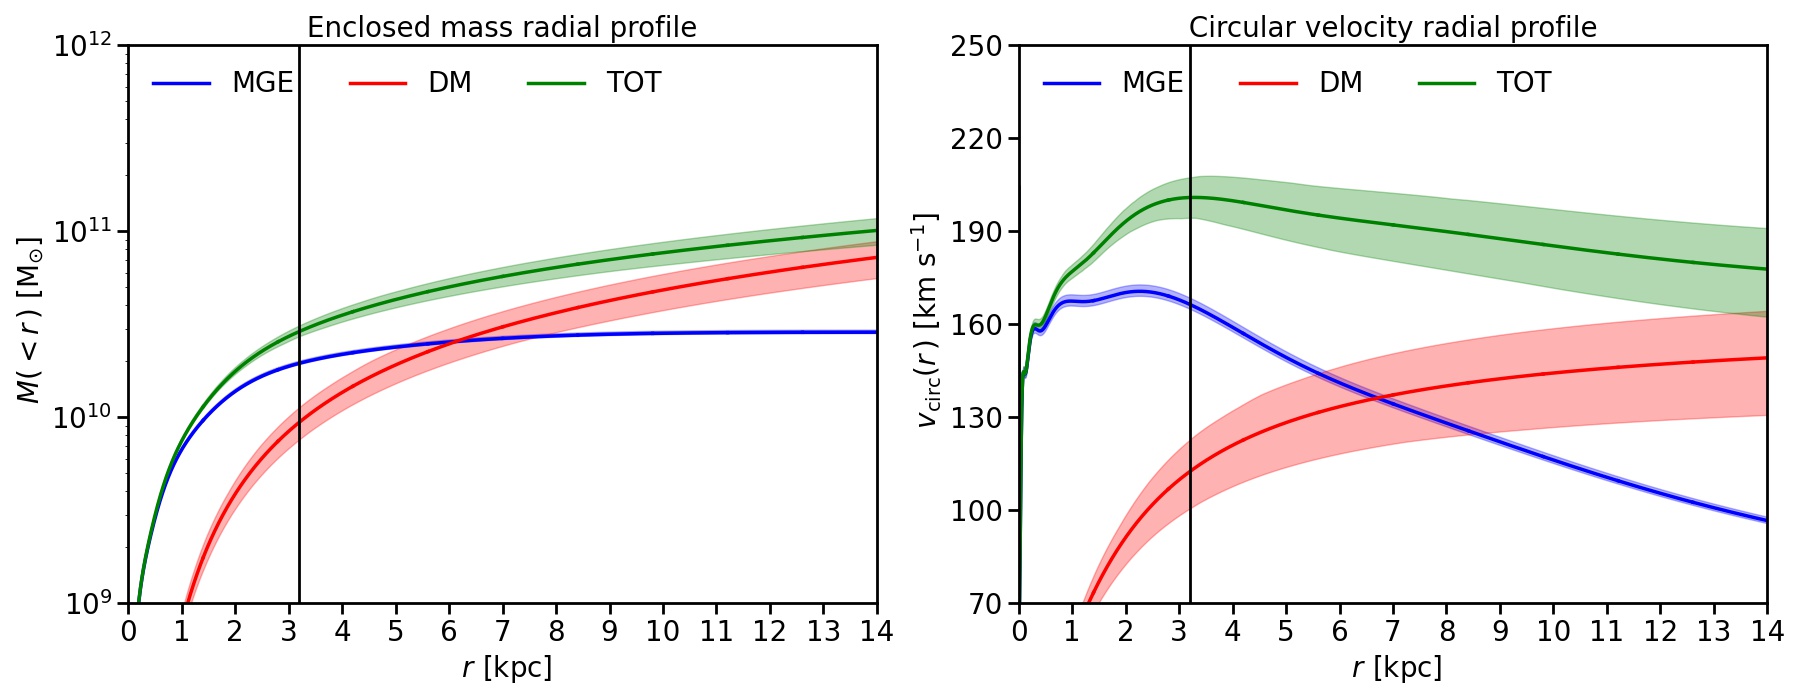
The DM fraction within the bar of the best-fit model is , which is compatible, within 1 uncertainty, with that predicted by the mass models with a NFW () and gNFW halo (). This suggests that the mass budget of NGC 4264 is baryon-dominated in the radial range mapped by the kinematic data. We show in the top panels of Fig. 3 the maps of the second velocity moments predicted of the best-fitting mass models of NGC 4264 without and with a QI halo to be compared with the map of observed . The corresponding radial profile of the enclosed mass and circular velocity for the stars, DM, and their sum are given in the bottom panels of Fig. 3 for the best-fitting mass model with the QI halo.
The circular velocity profile in the region between the bar end and the edge of the kinematic data ( kpc) is characterised by a weak decline. This means that, in this radial range, the DM halo does not play a dominant role with respect to the luminous component. This is a local trend which has been commonly observed in galaxies with massive bulges, with more luminous galaxies having on average more strongly declining rotation curves. At large radii, however, all declining rotation curves flatten out, indicating that substantial amounts of DM must be present in these galaxies too (Noordermeer et al., 2007; Kalinova et al., 2017; Frosst et al., 2022).
| Model | Parameter | NGC 4264 | NGC 4277 | |
| mass-follows-light | [M⊙ L] | |||
| (36.5) | (40.6) | |||
| unc. | unc. | |||
| 5.54 | 5.81 | |||
| QI | [M⊙ L] | |||
| logM⊙ pc-3) | ||||
| [kpc] | ||||
| (36.5) | (40.6) | |||
| 3.98 | 1.54 | |||
| NFW | [M⊙ L] | |||
| log) | ||||
| (36.5) | (40.6) | |||
| 4.07 | 1.62 | |||
| gNFW | [M⊙ L] | |||
| logM⊙ pc-3) | ||||
| [kpc] | ||||
| (0) | ||||
| (36.5) | (40.6) | |||
| 3.99 | 1.55 | |||
For the QI model, the contribution of DM starts to dominate the mass budget far beyond the bar region at a galactocentric distance kpc). As a further check of our dynamical modelling, we derive the mean circular velocity of the inner disc in the radial range ( kpc) adopted by Cuomo et al. (2019a) to estimate the circular velocity by correcting the stellar streaming motion for asymmetric drift. We find km s-1 which is consistent within 2 error with the asymmetric drift estimate km s-1 by Cuomo et al. (2019a).
We compare our results with those obtained by Cappellari et al. (2013), who modelled NGC 4264 using a JAM mass model with a NFW halo. Their stellar kinematics maps were obtained with the SAURON integral-field spectrograph, covering a smaller FOV ( arcmin2) and having a lower angular resolution (FWHM arcsec) with respect to ours. Nevertheless, Cappellari et al. (2013) reported that the DM fraction within the galaxy’s effective radius ( arcsec) is with a maximum circular velocity of km s-1. We find a consistent value of , but a larger value of km s-1 for the mass model with a NFW halo. The discrepancy between the two values of the circular velocity could due to the different extensions of the adopted data.
5.2 NGC 4277
As done for NGC 4264, we construct a starting set of mass models by considering the galaxy inclination as a free parameter. Considering the intrinsic flattening, the mass models with a DM halo return a consistent value () with that obtained by Buttitta et al. (2022) from the isophotal analysis of NGC 4277 (), whereas the mass-follows-light model gave . We verify that all the mass models recovered the photometric inclination after masking the kinematic bins belonging to the bar-dominated region ( arcsec). In this way, we rely only on the kinematic bins of the disc. We perform a further check by masking the central kinematic bins ( arcsec) to avoid issues related to the wrong PSF and/or the SMBH mass and we find the same model parameters. Finally, we decide to fix the inclination to build the final set of mass models. We adopt the value consistent with the photometric estimate to allow a straightforward comparison between the best-fitting parameters of the different mass models, which are given in Table 3 together with the reduced of the mass models.
We find a much larger mass-to-light ratio for the mass-follows-light model ( M⊙ L) with respect to the mass models with a DM halo ( M⊙ L). This is expected if there is DM in addition to the stars. We are not able to constrain with the mass-follows-light model, whereas all the mass models with a DM halo returned the same negative value within errors for the anisotropy ().
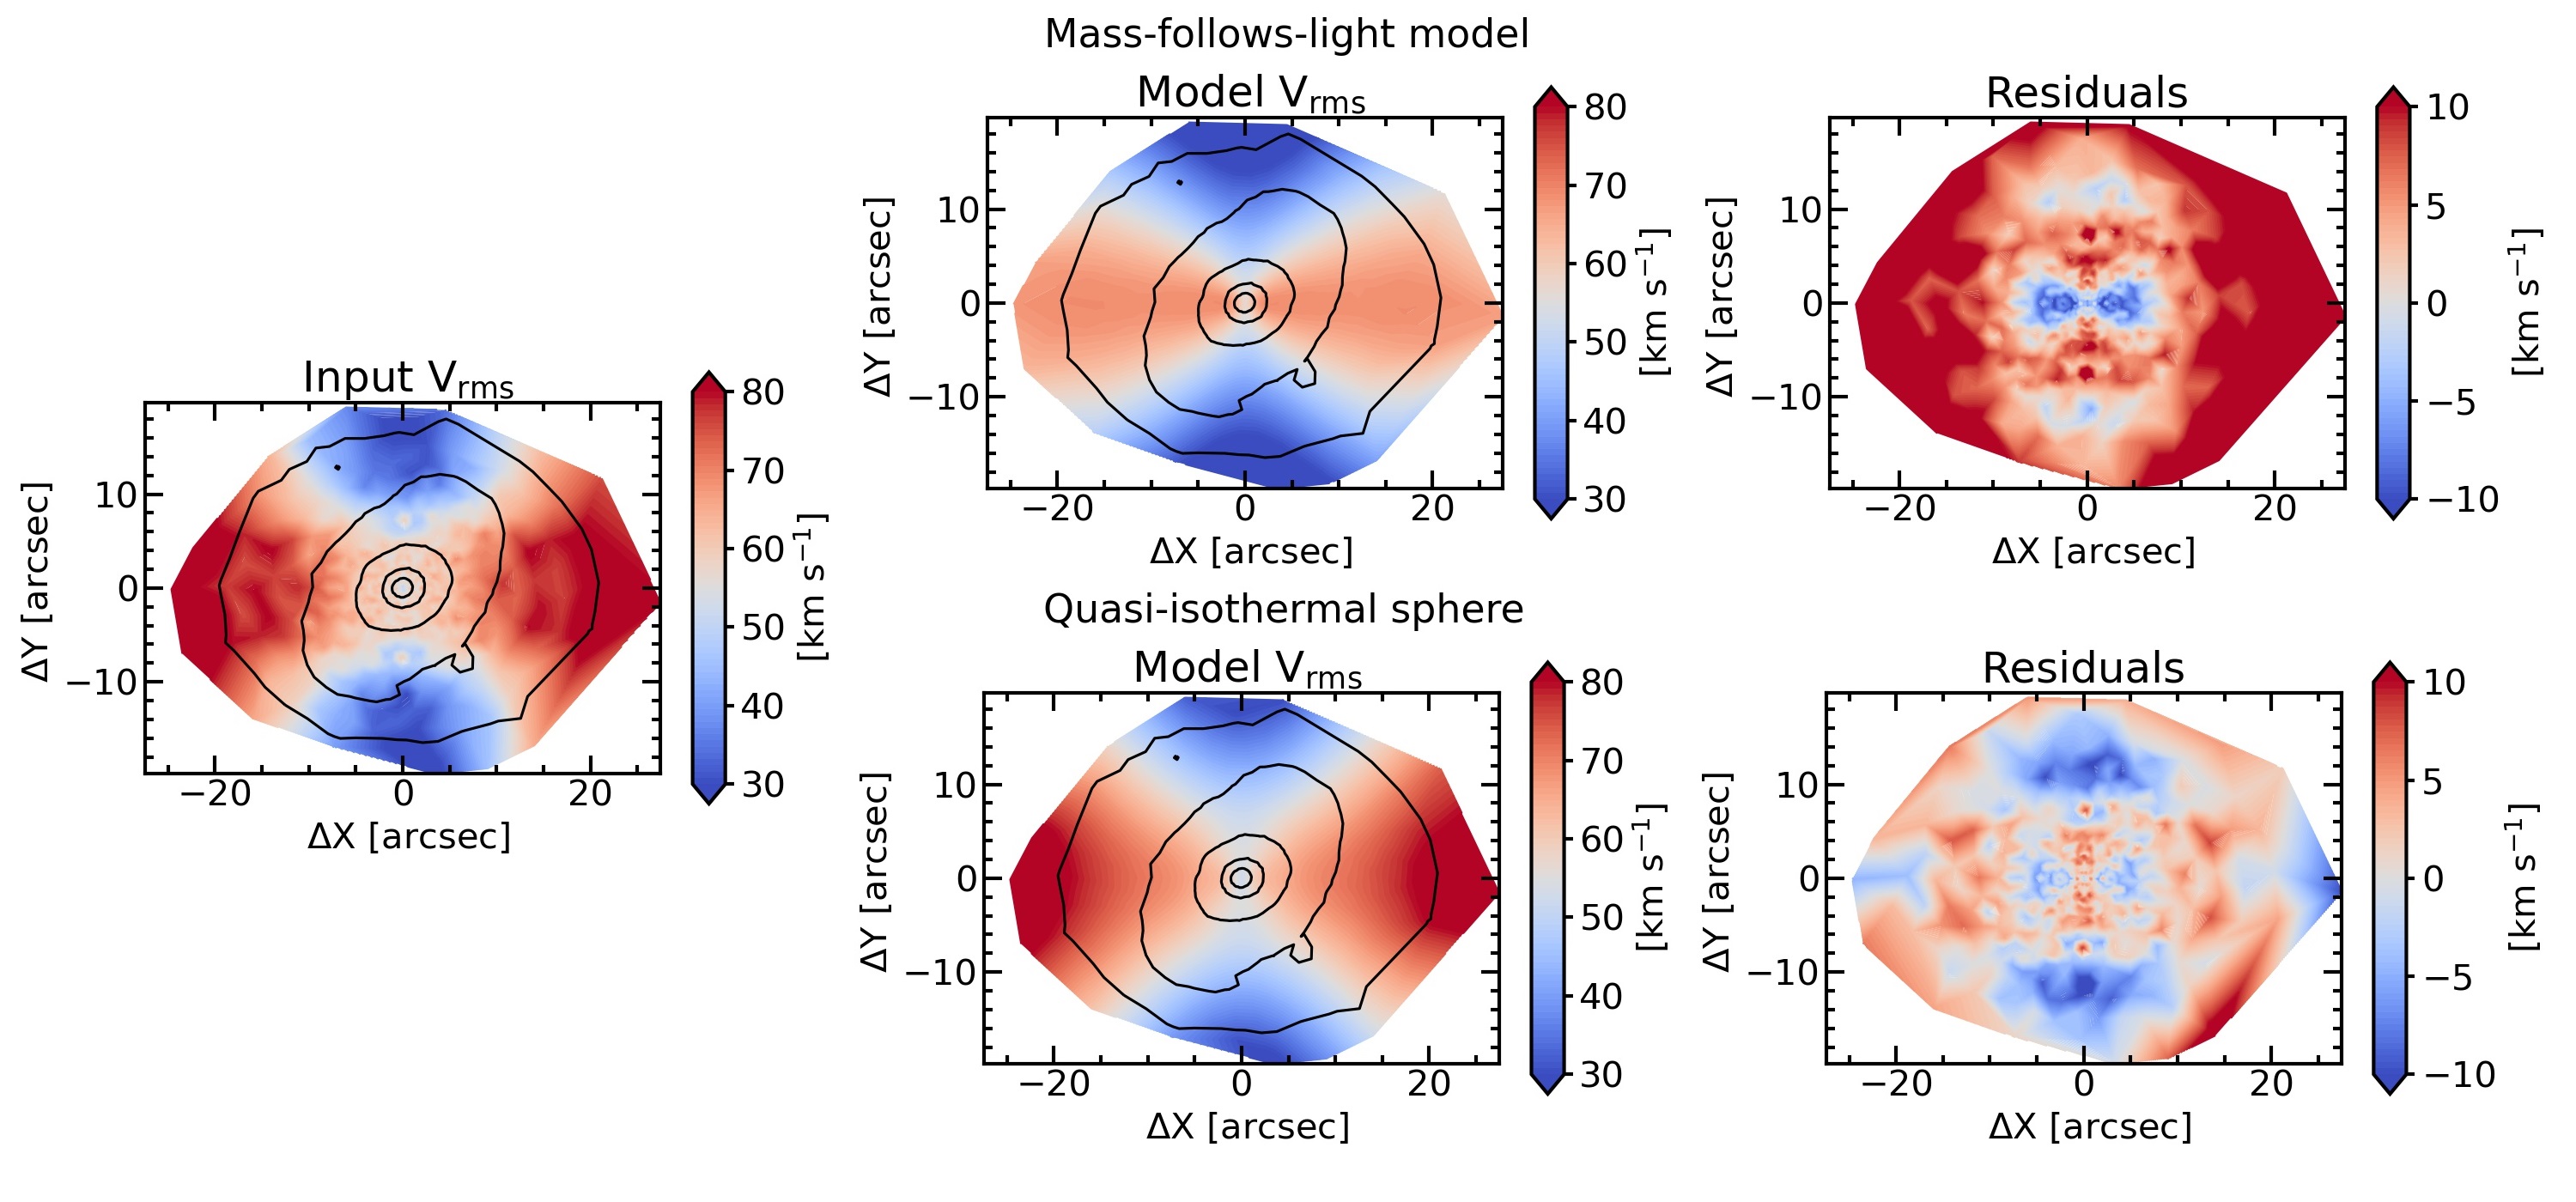
Although more than 60 per cent of the kinematic bins of NGC 4277 are located in the bar-dominated region, where the stars are expected to dominate the galaxy mass (Fig. 4, left panel), the predicted second velocity moment of the mass-follows-light model does not match the observed in terms of amplitude ( km s-1 for arcsec) and shape of the iso-velocity contours (Fig. 4, top-centre panel), contrary to the models with a DM halo (Fig. 4, bottom-centre panel). Therefore, we conclude that the best-fitting mass model of NGC 4277 requires a DM halo. As for NGC 4264, the mass model with the QI halo fits slightly better than those with the NFW () and gNFW halo (). The DM fraction within the bar is which is fully consistent with the fractions predicted by the mass models with a NFW () and gNFW DM halo (). These findings suggest that NGC 4277 hosts a considerable amount of DM, which is not tied to the stars, within the radial range mapped by the kinematic data. This holds no matter the adopted radial profile of the DM mass volume density. We argue that the large amount of DM in the inner regions of NGC 4277 is responsible for the slowdown of its bar.
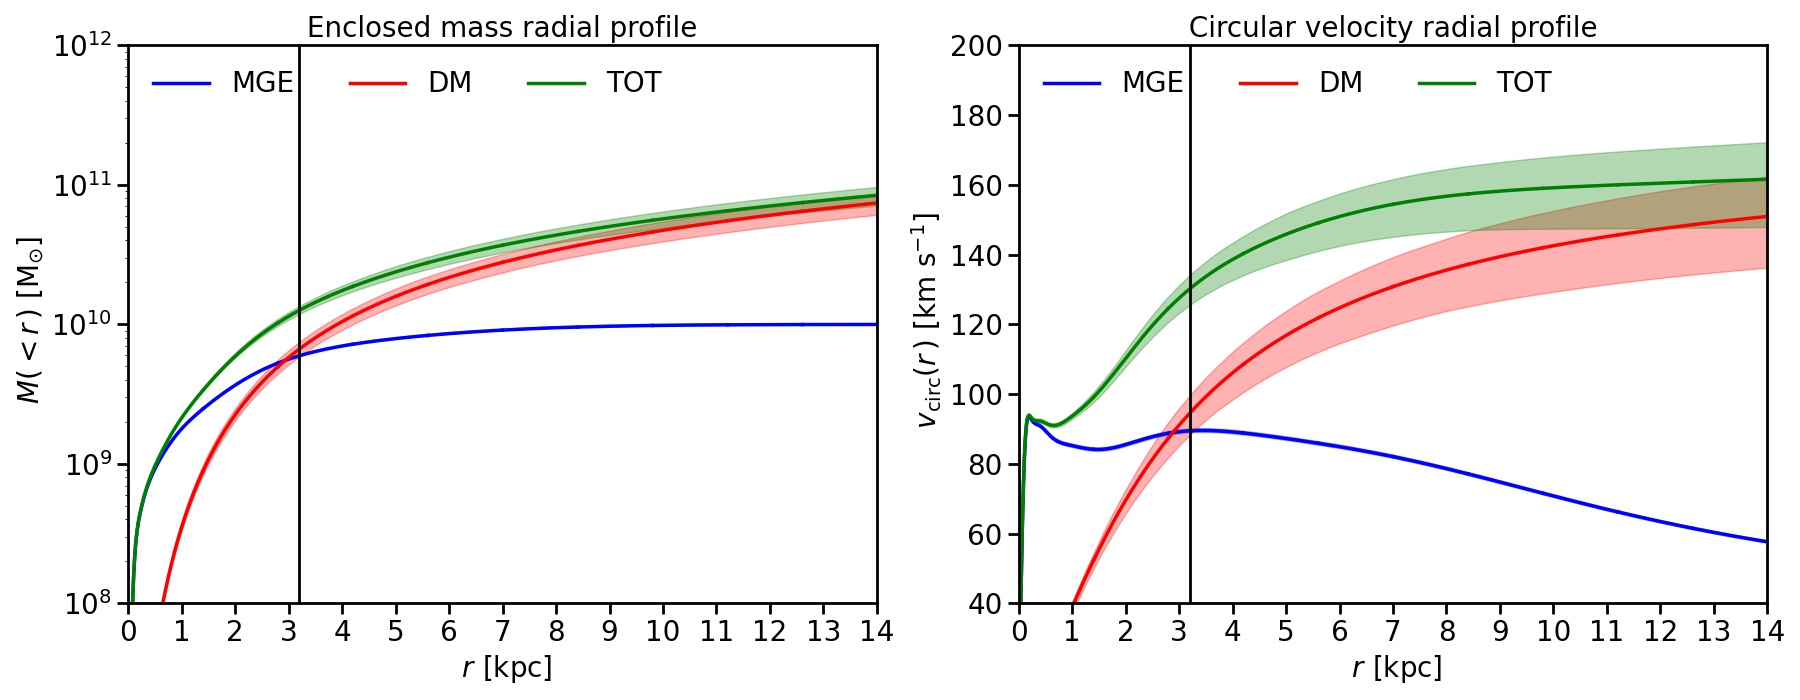
We show in the top panels of Fig. 4 the maps of the second velocity moments predicted by the best-fitting mass models of NGC 4277 without and with the QI halo to be compared with the map of observed . The corresponding radial profile of the enclosed mass and circular velocity for the stars, DM, and their sum of the best-fitting mass model with the QI halo are shown in the bottom panels of Fig. 4.
The contribution of the DM starts to dominate the mass budget just outside the bar region ( kpc) and the circular velocity flattens out at a larger galactocentric distance ( kpc) as expected for a DM-dominated region. We derive the mean value km s-1 of the circular velocity in the same radial range ( kpc) adopted by Buttitta et al. (2022) to estimate the circular velocity by correcting the stellar streaming motion for asymmetric drift. They found km s-1. The two values are consistent with each other within errors.
6 Conclusions
We have built Jeans axisymmetric dynamical models for the two barred lenticular galaxies NGC 4264 and NGC 4277. They are very similar in terms of morphology, size, and luminosity. But NGC 4264 hosts a fast bar, which nearly extends out to its corotation (, Cuomo et al. 2019a), while the bar embedded in NGC 4277 is slow and falls short of the corotation (, Buttitta et al. 2022). We focused on these galaxies because their bar pattern speeds are amongst the best-constrained ones obtained with direct measurements through the Tremaine-Weinberg method (Tremaine & Weinberg, 1984). We considered both mass-follows-light models and mass models with a spherical halo of DM, which is not tied to the stars, by matching the stellar kinematics obtained with the MUSE integral-field spectrograph and using SDSS images to recover the stellar mass distribution.
For both galaxies, the best-fitting mass model has a quasi-isothermal halo for which we derived the fraction of dark matter within the bar region. This is the first time that is measured along with obtained from dynamical modelling. We found that the inner regions of NGC 4277 host a larger amount of dark matter () with respect to NGC 4264 () in agreement with the predictions of theoretical works and the findings of numerical simulations. Indeed, fast bars are expected to live in baryon-dominated discs, whereas slow bars have experienced a strong drag from the dynamical friction due to a dense halo of dark matter. First, Weinberg (1985) predicted that a DM halo with a significant central mass density exerts a dynamical torque on the bar causing its slowdown. Similar results were later confirmed by several works based on N-body simulations (Debattista & Sellwood, 1998, 2000; Athanassoula & Misiriotis, 2002; Martinez-Valpuesta et al., 2017; Petersen et al., 2019). The bar in a less massive DM halo could require a longer timescale to be slowed down. Tailoring numerical simulations to well-studied galaxies like NGC 4264 and NGC 4277 will make it possible to track the decrease of the bar pattern speed as a function of the DM content and to predict the present value of to be compared with observations.
According to the results of numerical simulations, tidally induced bars are typically slower than those spontaneously formed by internal instabilities (Miwa & Noguchi, 1998; Martinez-Valpuesta et al., 2017; Łokas, 2018). Martinez-Valpuesta et al. (2017) found that bars formed after coplanar flybys with massive companions typically have a rotation rate . Similarly, large rotation rates characterise the bars formed in the numerical experiments of Łokas (2018), which explored the case of retrograde encounters of two galaxies with comparable mass. Buttitta et al. (2022) argued that the formation of the slow bar in NGC 4277 could be induced by the close companion NGC 4273. NGC 4277 does not present strong evidence of tidal interaction with the nearby galaxy, therefore it is not possible to confirm this scenario. However, we can conclude that the large DM fraction in its inner regions influenced the evolution of the bar driving it to an even slower regime. On the other hand, Cuomo et al. (2019a) pointed out that the mild interaction with NGC 4261 favours the spontaneous formation of the fast bar of NGC 4264. We conclude that the low DM fraction in the bar-dominated region was not enough to efficiently slow down the bar to the slow regime.
Following theoretical results (e.g. Athanassoula et al., 2013; Sellwood, 2014) angular momentum is exchanged at resonances, but it is emitted at the inner resonances and absorbed at the outer ones. However, the estimate of the amount of angular momentum exchanged at the resonances would require tracking the temporal evolution of the bar parameters of NGC 4264 and NGC 4277 through tailored N-body simulations. Nevertheless, it is possible to estimate the amount of DM enclosed within the corotation radius. The location of the corotation and bar radius of NGC 4264 are consistent with each other within errors, whereas the corotation radius of NGC 4277 is about twice as large as the bar radius. For NGC 4264, the DM fraction enclosed within the corotation radius () is the same within errors as that enclosed within the bar radius (). On the contrary, for NGC 4277 the DM fraction enclosed within the corotation radius () is much larger than that inside the bar radius () further supporting our conclusions.
A systematic application of the JAM algorithm to simulated barred galaxies with bars of different orientations, lengths, strengths, and pattern speeds is required to extend the parameter space explored by Lablanche et al. (2012). This is needed to understand the uncertainties and biases on the dynamical parameters, including the DM content in the bar-dominated region, for a given galaxy configuration. In particular, the regimes of weakly-barred galaxies and dwarf-barred galaxies, which give a major contribution to the galaxy population, are yet to be explored.
This is a crucial step to extend this dynamical analysis to all the barred galaxies with a measured bar rotation rate from integral-field spectroscopic data, like those targeted by CALIFA (Sánchez et al., 2012; Aguerri et al., 2015; Cuomo et al., 2019b), MANGA (Bundy et al., 2015; Guo et al., 2019; Garma-Oehmichen et al., 2020, 2022), and PHANGS-MUSE (Emsellem et al., 2022; Williams et al., 2021). With a large set of modelled galaxies, it will be possible to look for a quantitative relationship between and with the aim of using as a diagnostic of the DM content in galaxy disks.
Finally, NGC 4264 and NGC 4277 are amongst the barred galaxies with the best-studied bar properties in terms of surface-brightness distribution, stellar kinematics, and mass modelling. For this reason, they are ideal candidates to be adopted as a test bench in applying the orbit-superposition Schwarzschild dynamical models, which have been recently developed for tumbling bars by Vasiliev & Valluri (2020) and Tahmasebzadeh et al. (2022) but which have been applied to date only to mock galaxies created from N-body simulations.
Acknowledgements
We thank the referee for a very constructive report that helped to improve the manuscript. CB, EMC, and AP are supported by MIUR grant PRIN 2017 20173ML3WW-001 and Padua University grants DOR2019-2021. JALA and LC are supported by the Spanish Ministerio de Ciencia e Innovación y Universidades by the grants PID2020-119342GB-I00 and PGC2018-093499-B-I00, respectively. LC acknowledges financial support from Comunidad de Madrid under Atracción de Talento grant 2018-T2/TIC-11612. VC is supported by Fondecyt Postdoctoral programme 3220206-2022 and by ESO-Chile Joint Committee programme ORP060/19. The analysis in this paper was realised with the use of the Python packages astropy (Astropy Collaboration et al., 2018), matplotlib (Hunter, 2007), numpy (McKinney, 2010), and scipy (van der Walt et al., 2011). The MGE decomposition and JAM dynamical models were performed with the Python packages mgefit (Cappellari, 2002) and jampy (Cappellari, 2008).
Data Availability
The data underlying this article will be shared on reasonable request to CB.
References
- Abolfathi et al. (2018) Abolfathi B., et al., 2018, ApJS, 235, 42
- Aguerri et al. (2000) Aguerri J. A. L., Muñoz-Tuñón C., Varela A. M. e. a., 2000, A&A, 361, 841
- Aguerri et al. (2003) Aguerri J. A. L., Debattista V. P., Corsini E. M., 2003, MNRAS, 338, 465
- Aguerri et al. (2009) Aguerri J. A. L., Méndez-Abreu J., Corsini E. M., 2009, A&A, 495, 491
- Aguerri et al. (2015) Aguerri J. A. L., et al., 2015, A&A, 576, A102
- Algorry et al. (2017) Algorry D. G., et al., 2017, MNRAS, 469, 1054
- Astropy Collaboration et al. (2018) Astropy Collaboration et al., 2018, AJ, 156, 123
- Athanassoula (1992) Athanassoula E., 1992, MNRAS, 259, 345
- Athanassoula & Misiriotis (2002) Athanassoula E., Misiriotis A., 2002, MNRAS, 330, 35
- Athanassoula et al. (2013) Athanassoula E., Machado R. E. G., Rodionov S. A., 2013, MNRAS, 429, 1949
- Barnabè et al. (2012) Barnabè M., et al., 2012, MNRAS, 423, 1073
- Binney & Tremaine (1987) Binney J., Tremaine S., 1987, Galactic Dynamics. Princeton: Princeton University Press
- Bundy et al. (2015) Bundy K., et al., 2015, ApJ, 798, 7
- Buta et al. (2015) Buta R. J., et al., 2015, ApJS, 217, 32
- Buttitta et al. (2022) Buttitta C., et al., 2022, A&A, 664, L10
- Cappellari (2002) Cappellari M., 2002, MNRAS, 333, 400
- Cappellari (2008) Cappellari M., 2008, MNRAS, 390, 71
- Cappellari (2020) Cappellari M., 2020, MNRAS, 494, 4819
- Cappellari & Copin (2003) Cappellari M., Copin Y., 2003, MNRAS, 342, 345
- Cappellari & Emsellem (2004) Cappellari M., Emsellem E., 2004, PASP, 116, 138
- Cappellari et al. (2011) Cappellari M., et al., 2011, MNRAS, 413, 813
- Cappellari et al. (2013) Cappellari M., et al., 2013, MNRAS, 432, 1709
- Chilingarian & Zolotukhin (2012) Chilingarian I. V., Zolotukhin I. Y., 2012, MNRAS, 419, 1727
- Corsini (2011) Corsini E. M., 2011, Mem. Soc. Astron. It. Sup., 18, 23
- Cuomo et al. (2019a) Cuomo V., et al., 2019a, MNRAS, 488, 4972
- Cuomo et al. (2019b) Cuomo V., Lopez Aguerri J. A., Corsini E. M., Debattista V. P., Méndez-Abreu J., Pizzella A., 2019b, A&A, 632, A51
- Cuomo et al. (2020) Cuomo V., Aguerri J. A. L., Corsini E. M., Debattista V. P., 2020, A&A, 641, A111
- Debattista & Sellwood (1998) Debattista V. P., Sellwood J. A., 1998, ApJL, 493, L5
- Debattista & Sellwood (2000) Debattista V. P., Sellwood J. A., 2000, ApJ, 543, 704
- Debattista et al. (2006) Debattista V. P., Mayer L., Carollo C. M., Moore B., Wadsley J., Quinn T., 2006, ApJ, 645, 209
- Emsellem et al. (2022) Emsellem E., et al., 2022, A&A, 659, A191
- Fixsen et al. (1996) Fixsen D. J., Cheng E. S., Gales J. M., Mather J. C., Shafer R. A., Wright E. L., 1996, ApJ, 473, 576
- Fragkoudi et al. (2016) Fragkoudi F., Athanassoula E., Bosma A., 2016, MNRAS, 462, L41
- Fragkoudi et al. (2021) Fragkoudi F., Grand R. J. J., Pakmor R., Springel V., White S. D. M., Marinacci F., Gomez F. A., Navarro J. F., 2021, A&A, 650, L16
- Frosst et al. (2022) Frosst M., Courteau S., Arora N., Stone C., Macciò A. V., Blank M., 2022, MNRAS, 514, 3510
- Garma-Oehmichen et al. (2020) Garma-Oehmichen L., Cano-Díaz M., Hernández-Toledo H., Aquino-Ortíz E., Valenzuela O., Aguerri J. A. L., Sánchez S. F., Merrifield M., 2020, MNRAS, 491, 3655
- Garma-Oehmichen et al. (2022) Garma-Oehmichen L., et al., 2022, MNRAS,
- Gerhard (1993) Gerhard O. E., 1993, MNRAS, 265, 213
- Gerhard & Binney (1996) Gerhard O. E., Binney J. J., 1996, MNRAS, 279, 993
- Gottloeber et al. (2010) Gottloeber S., Hoffman Y., Yepes G., 2010, in Wagner S., Steinmetz M., Bode A., Muller M., eds, High Performance Computing in Science and Engineering. Springer. p. 309
- Grand et al. (2017) Grand R. J. J., et al., 2017, MNRAS, 467, 179
- Guo et al. (2019) Guo R., Mao S., Athanassoula E., Li H., Ge J., Long R. J., Merrifield M., Masters K., 2019, MNRAS, 482, 1733
- Hunter (2007) Hunter J. D., 2007, Computing in Science & Engineering, 9, 90
- Kalinova et al. (2017) Kalinova V., et al., 2017, MNRAS, 469, 2539
- Kim et al. (2014) Kim S., et al., 2014, ApJS, 215, 22
- Klypin et al. (2011) Klypin A. A., Trujillo-Gomez S., Primack J., 2011, ApJ, 740, 102
- Kormendy & Ho (2013) Kormendy J., Ho L. C., 2013, ARA&A, 51, 511
- Krajnović et al. (2005) Krajnović D., Cappellari M., Emsellem E., McDermid R. M., de Zeeuw P. T., 2005, MNRAS, 357, 1113
- Lablanche et al. (2012) Lablanche P.-Y., et al., 2012, MNRAS, 424, 1495
- Laurikainen et al. (2007) Laurikainen E., Salo H., Buta R., Knapen J. H., 2007, MNRAS, 381, 401
- Łokas (2018) Łokas E. L., 2018, ApJ, 857, 6
- Marioni et al. (2022) Marioni O. F., Abadi M. G., Gottlöber S., Yepes G., 2022, MNRAS, 511, 2423
- Martinez-Valpuesta et al. (2017) Martinez-Valpuesta I., Aguerri J. A. L., González-García A. C., Dalla Vecchia C., Stringer M., 2017, MNRAS, 464, 1502
- McKinney (2010) McKinney 2010, in Stéfan van der Walt Jarrod Millman eds, Proceedings of the 9th Python in Science Conference. pp 56 – 61, doi:10.25080/Majora-92bf1922-00a
- Méndez-Abreu et al. (2017) Méndez-Abreu J., et al., 2017, A&A, 598, A32
- Miwa & Noguchi (1998) Miwa T., Noguchi M., 1998, ApJ, 499, 149
- Navarro et al. (1995) Navarro J. F., Frenk C. S., White S. D. M., 1995, MNRAS, 275, 56
- Nelson et al. (2018) Nelson D., et al., 2018, MNRAS, 475, 624
- Noguchi (1987) Noguchi M., 1987, MNRAS, 228, 635
- Noordermeer et al. (2007) Noordermeer E., van der Hulst J. M., Sancisi R., Swaters R. S., van Albada T. S., 2007, MNRAS, 376, 1513
- Pagotto et al. (2019) Pagotto I., Corsini E. M., Sarzi M., Pagani B., Dalla Bontà E., Morelli L., Pizzella A., 2019, MNRAS, 483, 57
- Petersen et al. (2019) Petersen M. S., Weinberg M. D., Katz N., 2019, MNRAS, 490, 3616
- Pillepich et al. (2018) Pillepich A., et al., 2018, MNRAS, 475, 648
- Portail et al. (2016) Portail M., Gerhard O., Wegg C., Ness M., 2016, Monthly Notices of the Royal Astronomical Society, 465, 1621
- Prugniel & Soubiran (2001) Prugniel P., Soubiran C., 2001, A&A, 369, 1048
- Roshan et al. (2021) Roshan M., Ghafourian N., Kashfi T., Banik I., Haslbauer M., Cuomo V., Famaey B., Kroupa P., 2021, MNRAS, 508, 926
- Rybicki (1987) Rybicki G. B., 1987, in de Zeeuw P. T., ed., Vol. 127, Structure and Dynamics of Elliptical Galaxies. p. 397
- Sánchez et al. (2012) Sánchez S. F., et al., 2012, A&A, 538, A8
- Sarzi et al. (2006) Sarzi M., et al., 2006, MNRAS, 366, 1151
- Schaye et al. (2015) Schaye J., et al., 2015, MNRAS, 446, 521
- Schlafly & Finkbeiner (2011) Schlafly E. F., Finkbeiner D. P., 2011, ApJ, 737, 103
- Schmitt (2001) Schmitt H. R., 2001, AJ, 122, 2243
- Scott et al. (2013) Scott N., et al., 2013, MNRAS, 432, 1894
- Sellwood (1981) Sellwood J. A., 1981, A&A, 99, 362
- Sellwood (2014) Sellwood J. A., 2014, Reviews of Modern Physics, 86, 1
- Tahmasebzadeh et al. (2022) Tahmasebzadeh B., Zhu L., Shen J., Gerhard O., Ven G. v. d., 2022, ApJ, 941, 109
- Tremaine & Weinberg (1984) Tremaine S., Weinberg M. D., 1984, ApJL, 282, L5
- Vasiliev & Valluri (2020) Vasiliev E., Valluri M., 2020, ApJ, 889, 39
- Weinberg (1985) Weinberg M. D., 1985, MNRAS, 213, 451
- Williams et al. (2009) Williams M. J., Bureau M., Cappellari M., 2009, MNRAS, 400, 1665
- Williams et al. (2021) Williams T. G., et al., 2021, AJ, 161, 185
- Willmer (2018) Willmer C. N. A., 2018, ApJS, 236, 47
- de Lorenzi et al. (2007) de Lorenzi F., Debattista V. P., Gerhard O., Sambhus N., 2007, MNRAS, 376, 71
- de Vaucouleurs et al. (1991) de Vaucouleurs G., de Vaucouleurs A., Corwin Jr. H. G., Buta R. J., Paturel G., Fouqué P., 1991, Third Reference Catalogue of Bright Galaxies. New York: Springer
- de Zeeuw et al. (2002) de Zeeuw P. T., et al., 2002, MNRAS, 329, 513
- van Driel et al. (2000) van Driel W., Ragaigne D., Boselli A., Donas J., Gavazzi G., 2000, A&AS, 144, 463
- van der Marel & Franx (1993) van der Marel R. P., Franx M., 1993, ApJ, 407, 525
- van der Walt et al. (2011) van der Walt S., Colbert S. C., Varoquaux G., 2011, Computing in Science and Engineering, 13, 22