Short-lived radioisotope enrichment in star-forming regions from stellar winds and supernovae
Abstract
The abundance of the short-lived radioisotopes 26Al and 60Fe in the early Solar system is usually explained by the Sun either forming from pre-enriched material, or the Sun’s protosolar disc being polluted by a nearby supernova explosion from a massive star. Both hypotheses suffer from significant drawbacks: the former does not account for the dynamical evolution of star-forming regions, while in the latter the time for massive stars to explode as supernovae can be similar to, or even longer than, the lifetime of protoplanetary discs. In this paper, we extend the disc enrichment scenario to include the contribution of 26Al from the winds of massive stars before they explode as supernovae. We use -body simulations and a post-processing analysis to calculate the amount of enrichment in each disc, and we vary the stellar density of the star-forming regions. We find that stellar winds contribute to disc enrichment to such an extent that the Solar system’s 26Al/60Fe ratio is reproduced in up to 50 per cent of discs in dense ( M⊙ pc-3) star-forming regions. When winds are a significant contributor to the SLR enrichment, we find that Solar system levels of enrichment can occur much earlier (before 2.5 Myr) than when enrichment occurs from supernovae, which start to explode at later ages (4 Myr). We find that Solar system levels of enrichment all but disappear in low-density star-forming regions ( M⊙ pc-3), implying that the Solar system must have formed in a dense, populous star-forming region if 26Al and 60Fe were delivered directly to the protosolar disc from massive-star winds and supernovae.
keywords:
methods: numerical – protoplanetary discs – photodissociation region (PDR) – open clusters and associations: general.1 Introduction
Placing our Solar system in the context of other planetary systems is one of the great challenges in astrophysics (Queloz, 2020). Do planetary systems and the forming planets themselves retain signatures of their birth star-forming environments, and what are the implications for the climate diversity among extrasolar planets (Wordsworth & Kreidberg, 2021; Lichtenberg et al., 2022) and the emergence of Earth-like planetary environments (Mojzsis, 2021)?
Observations over the past two decades have determined that stars form in groups, often referred to as ‘clusters’ if they are gravitationally bound/long-lived (Kruijssen, 2012), or ‘associations’ if they are unbound/short-lived (Wright et al., 2022). There is significant uncertainty and degeneracy when assessing which environments are either conducive or repellent to planet formation. This complication mainly arises because planets are observed to form contemporaneously with their host stars (Haisch et al., 2001; ALMA Partnership et al., 2015; Andrews et al., 2018; Alves et al., 2020; Segura-Cox et al., 2020), often whilst still contained within dense, obscured star-forming regions.
Indirect evidence that the Sun formed in a populous star-forming region is present in the oldest objects in the Solar system, the chondritic meteorites (Lee et al., 1976; Cameron & Truran, 1977), which contain the decay products of the short-lived radioisotopes (SLRs) 26Al and 60Fe. Whilst there are several astrophysical mechanisms for creating 26Al (Lugaro et al., 2018; Diehl et al., 2021), the most likely scenarios are that the Sun either formed from pre-enriched material (Boss, 1995, 2019; Gaidos et al., 2009; Gounelle & Meynet, 2012; Young, 2014; Gounelle, 2015; Kuffmeier et al., 2016; Fujimoto et al., 2018; Côté et al., 2019; Forbes et al., 2021) or its planet-forming disc was polluted by supernova and/or wind ejecta from massive stars (Ouellette et al., 2007, 2010; Fatuzzo & Adams, 2015; Parker et al., 2014a; Lichtenberg et al., 2016b; Nicholson & Parker, 2017; Portegies Zwart et al., 2018; Fatuzzo & Adams, 2022).
The disc pollution scenario usually assumes that the disc is only enriched by supernovae explosions of the most massive star(s). Aside from issues around coupling hot ejecta to cold disc material (Wijnen et al., 2017), even the most massive stars ( M⊙) do not explode as supernovae until after 4 Myr (Limongi & Chieffi, 2006). At these (relatively) later ages, the disc may have depleted (Haisch et al., 2001; Richert et al., 2018), been destroyed by encounters (Vincke et al., 2015) and/or photoevaporation (Johnstone et al., 1998; Scally & Clarke, 2001; Adams et al., 2004; Nicholson et al., 2019; Winter et al., 2018; Parker et al., 2021), or already formed planets (ALMA Partnership et al., 2015; Andrews et al., 2018). In the latter scenario, we might expect to see a much greater inhomogeneity in the injected 26Al than is observed. However, the massive stars that explode as supernovae also produce winds rich in 26Al during their main sequence phase (Limongi & Chieffi, 2006), meaning that disc enrichment could occur much earlier than the timescales for supernovae explosions (i.e. 4 Myr).
In this paper, we determine the amount of enrichment of protoplanetary discs in 26Al and 60Fe from supernovae, which produce both SLRs, and from massive-star winds, which solely produce 26Al. From these we determine – based on the amount of 26Al and 60Fe capture versus decay over time – the internal radioactive heating in forming planetesimals that acts to differentiate and devolatilize them (Lichtenberg et al., 2019; Lichtenberg et al., 2022). We do this for star-forming regions with different initial densities, and contrast the results to the values measured in the Solar system.
Much of the recent literature has focused on 26Al and 60Fe enrichment in sequential (e.g. Gounelle & Meynet, 2012; Gounelle, 2015) or extended star formation events (e.g. Young, 2014; Fatuzzo & Adams, 2022). In this paper we incorporate the dynamical evolution of the star-forming regions, but focus on enrichment in individual star-forming regions, rather than the summed enrichment in multiple regions. Portegies Zwart (2019) focuses on reproducing the enrichment history of the Solar system (including wind enrichment from Wolf Rayet stars), and also examines the dynamical truncation history of the Solar system. Here, we provide more generalised simulations to infer the amount of 26Al and 60Fe enrichment from both Wolf Rayet winds and supernovae for different density star-forming regions.
The paper is organised as follows. We describe our simulations, and our calculations of the capture of SLRs and consequent radiogenic heating in Section 2. We present our results as cumulative distributions of the SLR ratios and heating in Section 3 and we provide a discussion in Section 4. We conclude in Section 5.
2 Method
In this Section we describe the set-up of the -body simulations, how we calculate the enrichment of protoplanetary discs by both massive star winds and supernovae, before describing the method to derive radioactive heating values to determine whether planetary systems would experience Solar system-like internal heating of planetesimals.
2.1 -body simulations of star-forming regions
Our star-forming regions all have stars, which is roughly the expectation value (1000 M⊙) for the mass of a star-forming region, based on the observations of Galactic star clusters and associations (Lada & Lada, 2003). Additionally, for our chosen , all versions of the initial mass function (IMF) in the literature will produce some massive ( M⊙) stars that could contribute 26Al and 56Fe through both supernovae and/or winds.
We select stellar masses from the Maschberger (2013) IMF, which has a probability distribution function of the form
| (1) |
In Eqn. 1 M⊙ is the scale parameter, or ‘peak’ of the IMF (Bastian et al., 2010; Maschberger, 2013), is the Salpeter (1955) power-law exponent for higher mass stars, and describes the slope of the IMF for low-mass objects. We randomly sample this distribution in the mass range 0.1 – 50 M⊙, such that brown dwarfs are not included in the simulations, and 26Al- and 60Fe-producing stars are present in each star-forming region.
Observations (Larson, 1981; Cartwright & Whitworth, 2004; Peretto et al., 2006; Sánchez & Alfaro, 2009; Hacar et al., 2018; Buckner et al., 2019) and simulations (Schmeja & Klessen, 2006; Bate, 2009; Girichidis et al., 2011; Dale et al., 2015) show that star-forming regions form with both spatial and kinematic substructure. This is likely to be an imprint of the turbulent conditions of the Giant Molecular Clouds in which stars form, although the correlation between the properties of the gas, and the stars that subsequently form, are unlikely to be linked in a trivial manner (Parker & Dale, 2015).
To mimic the spatial and kinematic substructure in the early phases of star formation, we set up our -body simulations using a box-fractal generator (Goodwin & Whitworth, 2004), which uses a given fractal dimension, , as an input to set both the degree of spatial structure, and the degree of kinematic structure. For full details of the method, we refer the interested reader to Goodwin & Whitworth (2004); Allison et al. (2010); Lomax et al. (2011); Daffern-Powell & Parker (2020), but we briefly summarise the method below.
The fractals are set up by placing a ‘parent’ particle at the centre of a cube of side , which spawns subcubes. Each of these subcubes contains a ‘child’ particle at its centre, and the fractal is constructed by determining how many successive generations of ‘children’ are produced. The likelihood of each successive generation producing their own children is given by , where is the fractal dimension.
The actual star particles are placed at the locations of the final generation of children. Fewer generations are produced when the fractal dimension is lower, leading to a less uniform appearance and hence more substructure. Star-forming regions with a low fractal dimension (e.g. ) have a high degree of substructure, whereas regions with higher values (e.g. ) have less structure and regions with are approximately uniform.
The velocities of the parent particles are drawn from a Gaussian distribution of mean zero, and the velocities of the child particles inherit this velocity plus a small random component which scales as , where is the number of generations in the fractal and therefore the random component becomes progressively smaller with each generation. This means that physically close particles have very similar velocities, but more distant particles can have very uncorrelated velocites, similar to the observations within GMCs (Larson, 1981).
We adopt for all our simulations, which gives a moderate amount of spatial and kinematic substructure. We scale the velocities to a virial ratio , where and are the total kinetic and potential energies, respectively. The velocities of young stars are often observed to be subvirial along filaments (André et al., 2014; Foster et al., 2015), so we adopt a subvirial ratio () in all of our simulations.
We then scale the physical size of the fractals to produce the required stellar density. Observations of star-forming regions present a range of densities (Lada & Lada, 2003; Bressert et al., 2010), most of which are more than a factor of ten higher than the stellar density in the disc of the Milky Way (0.1 M⊙ pc-3, Korchagin et al., 2003), and some are several 100s M⊙ pc-3 (King et al., 2012). However, dynamical models postulate that the initial densities of star-forming regions may be even higher, perhaps 1000s M⊙ pc-3 (Marks & Kroupa, 2012; Farias et al., 2020; Schoettler et al., 2020, 2022).
The observed present-day densities in star-forming regions are likely to be lower limits to the initial densities (Parker, 2014), so we set up simulations with the full range of possible initial densities for star-forming regions by adjusting the radii of the box fractals accordingly. A summary of the simulations is given in Table 1.
We run ten versions of each simulation in order to gauge the amount of stochasticity in the results. We evolve the star-forming regions for 10 Myr using the kira integrator in the Starlab package (Portegies Zwart et al., 1999, 2001). We do not implement mass-loss from the massive stars due to stellar evolution (although a stellar evolution module, SeBa is available in Starlab), but instead use the models from Limongi & Chieffi (2006) to determine when a massive star leaves the main sequence and explodes as a supernova.
| 1500 | 1 pc | M⊙ pc-3 |
|---|---|---|
| 1500 | 2.5 pc | M⊙ pc-3 |
| 1500 | 5.5 pc | M⊙ pc-3 |
| 1500 | 20 pc | M⊙ pc-3 |
2.2 Enrichment from massive stars
We track the position of each 5 M⊙ star and the relative positions of all low-mass (3 M⊙) stars. All low-mass stars are assigned a disc with radius au. In two sets of simulations we randomly remove discs from the enrichment calculation if a random number between 0 and 1 obeys the following relation
| (2) |
where is the time in Myr. This relation ensures that the discs deplete on an exponential timescale commensurate with the Richert et al. (2018) fit to disc fractions in star-forming regions, which in turn is a refinement of the Haisch et al. (2001) results.
The mass of the disc is fixed, i.e. it does not deplete (apart from when the disc is removed altogether in some simulations, as described above), and is proportional to the host star mass,
| (3) |
We assume the usual gas-to-dust ratio of 100:1, so the total dust mass, , in the disc is
| (4) |
The amount of 26Al is expressed in terms of the stable version of the element, 27Al, and we determine the mass of 27Al in the disc, , from the fraction of Al in chondrites, (Lodders, 2003)
| (5) |
Similarly, the amount of 60Fe is expressed in terms of its stable version, 56Fe, and we determine the mass of 56Fe in the disc, , from the fraction of Fe in chondrites, (Lodders, 2003)
| (6) |
In order to calculate both the location of, and the 26Al and 60Fe yields from, supernovae in the star-forming regions, for each massive star we perform a linear interpolation using its mass to estimate the time at which it explodes as a supernova, and its SLR yields, based on the models in Limongi & Chieffi (2006).
For each 3 M⊙ star at each snapshot in time, we calculate the geometric cross section of the disc for capturing material from a supernova thus
| (7) |
where is the distance to the massive star(s) at the instant of supernova (from the models of Limongi & Chieffi, 2006) and is the inclination of the disc. Following Lichtenberg et al. (2016b), for each star we adopt as the likely average inclination between the disc and the ejecta for a random distribution.
Similarly, to calculate the SLR yield from the massive star winds, we use the main sequence lifetimes from Limongi & Chieffi (2006) as well as the total yield from the winds, to determine the yield per Myr. In Appendix A we calculate the yields using more recent models (Limongi & Chieffi, 2018), but find no major differences compared with the models from Limongi & Chieffi (2006), especially when realistic estimates of stellar rotation are included in the calculations (de Mink et al., 2013).
The cross section for capture of wind material is calculated as the volume of material swept out by a low-mass star as it traverses a distance through a wind bubble of radius
| (8) |
We implement two different regimes for the density of the wind bubbles. First, we assume a very compact bubble around each massive star with a radius pc. Secondly, we assume the bubble(s) disperse rapidly, and the bubble has a radius , where is the half-mass radius of the star-forming region (i.e. the radius within which half the total stellar mass in the region is enclosed). Previous work (e.g. Parker & Quanz, 2012; Schoettler et al., 2019) has shown this to be a reasonable estimate of the extent of these simulated star-forming regions without including distant outliers and/or ejected stars.
We use the total mass of 26Al and 60Fe captured/swept up by each low mass star and divide this by the mass in stable isotopes, and , to determine the 26Al and 60Fe ratios:
| (9) |
and
| (10) |
For each low-mass star, we calculate three times; for supernovae only, for supernovae and local winds ( pc), and then finally for supernovae and dispersed winds (). The contribution of 60Fe comes from supernovae only.
We then compare each of the calculated , and the calculated to the respective measured Solar system values, (Thrane et al., 2006) and (Tang & Dauphas, 2012) or (Mishra et al., 2016). Different literature sources are in reasonable agreement on the measurement of (see also Jacobsen et al., 2008; Kita et al., 2013, who find a slightly lower value, around ), but the measurement of 60Fe is far more controversial (see Trappitsch et al., 2018; Kodolányi et al., 2022, for recently quoted values toward the lower end of the range), and so we will compare our results to the full range of values quoted in the literature.
2.3 Internal radioactive heating in planetesimals
We then use the and ratios to calculate the potential radioactive heating in forming planetesimals (Moskovitz & Gaidos, 2011; Lichtenberg et al., 2016b) due to these SLRs. We calculate the radiogenic heating for each star, at each snapshot in time , taking into account the radioactive decay of both 26Al and 60Fe from the current and previous snapshots using
| (11) |
where is the fraction of Al in chondrites (Lodders, 2003), as defined earlier, MeV is the decay energy of 26Al, Myr is the radioactive half-live of 26Al (Castillo-Rogez et al., 2009). Similarly, is the fraction of Fe in chondrites (Lodders, 2003), MeV is the decay energy of 60Fe (Castillo-Rogez et al., 2009) and Myr is the half-life of 60Fe (Wallner et al., 2015). The initial Solar system heating value is calculated from these values to be W kg-1.
3 Results
In this Section we present the short-lived isotope ratios, and for star-forming regions with different initial densities. For each density regime, we also use the SLR ratios to calculate the long-term internal heating of the planetesimals that form in the discs, .
3.1 High stellar density
We first calculate the SLR ratios and internal heating of planetesimals for discs in inititally very dense (M⊙ pc-3) star-forming regions. The details of the evolution of these regions is documented elsewhere (Allison et al., 2010; Parker et al., 2014b; Lichtenberg et al., 2016b), but we briefly outline it again here.
The star-forming regions are initially out of equilibrium. First, the spatial and kinematic substructure is erased before the star-forming regions undergo violent relaxation (Lynden-Bell, 1967; Spitzer, 1969) in which the stars fall into the potential well of the star-forming region, leading to the formation of a smooth, centrally concentrated star cluster.
This violent relaxation facilitates mass segregation, whereby the most massive stars become more spatially concentrated than the average mass stars in the cluster (McMillan et al., 2007; Allison et al., 2010; Parker et al., 2014b). In some cases the massive star(s) are ejected (Schoettler et al., 2019), but are replaced in the central region by the next most massive star(s) (Parker et al., 2016). In these dense regions we expect low-mass stars to be in close proximity to massive stars (Parker et al., 2021), thereby maximising the likelihood of enrichment occurring (Parker et al., 2014a).
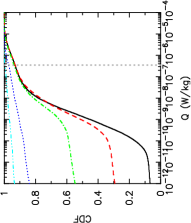
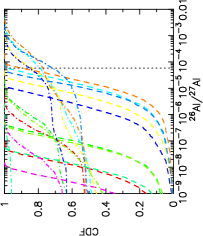
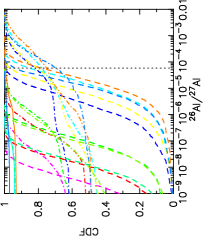
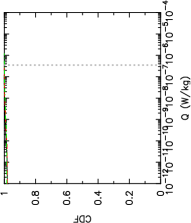
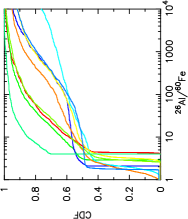
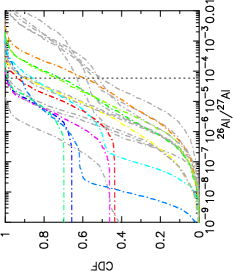
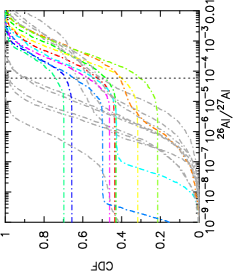
In Fig. 1 we show the enrichment calculations for these high density regions, assuming that all the protoplanetary discs have a fixed radius of 100 au. In the top row we show the 26Al abundance ratios, , calculated after 10 Myr for supernovae only (panel a), supernovae and dispersed winds (i.e. where the winds fill the volume of the clusters, panel b) and supernovae and localised winds (i.e. where the wind material remains in a small [ pc] volume around the massive stars, panel c). Each individual line is one simulation (there are ten versions of the same simulation, identical apart from the random number seed used to set up the initial conditions).
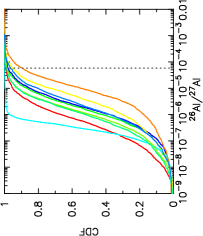
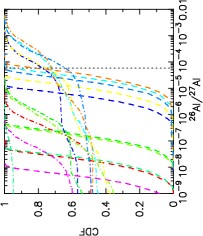
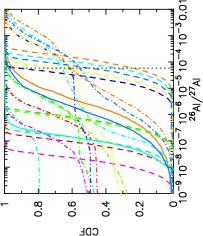
In the bottom row we show all three different in each panel, but calculated at 1, 2.5 and 5 Myr (panels d, e, and f, respectively). At 1 and 2.5 Myr, no supernovae have occurred yet, and only the most massive stars (40 M⊙) have exploded after 5 Myr, so the winds dominate the enrichment budget.
Our first notable result is that the amount of 26Al enrichment from supernovae alone (Fig. 1(a)) is only at Solar system levels (or higher, i.e. Thrane et al., 2006) for a few stars (less than 10 per cent) in the majority of simulations. However, when discs are also enriched by wind material, the fraction of stars with Solar system levels of enrichment is more than 50 per cent in some regions (Figs. 1(b) and 1(c)). In five simulations (the three blue lines, the yellow line, the brown line in Fig. 1(c)) the dispersed winds provide a level of enrichment far in excess of Solar system levels. For the same simulations, more localised winds also provide significant enrichment, with higher ratios possible (Fig. 1(b)).
Secondly, the ratios at early ages (1 Myr, panel d) can reach Solar system values for the localised wind bubbles, and after 2.5 (panel e) and 5 Myr (panel f) the enrichment ratios increase further (recall that this is before most supernovae have ocurred).
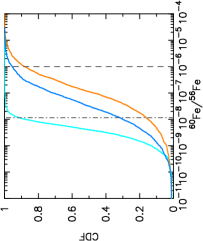
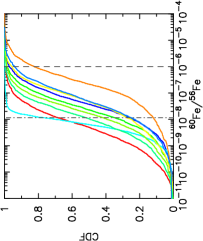
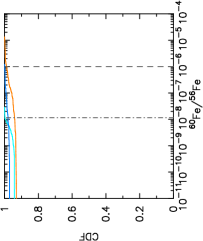
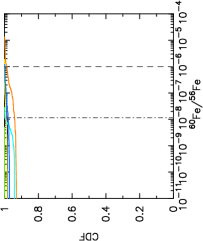
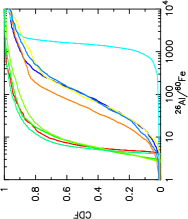
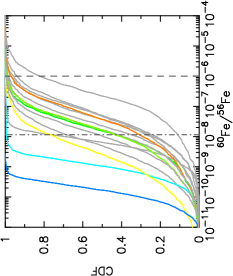
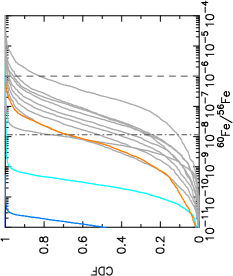
In Fig. 2 we show the 60Fe abundance ratios at 5 Myr (panel (a)) and after 10 Myr (panel b). Again, after 5 Myr few stars have exploded as supernovae, and in fact this only occurs in three out of ten simulations (Fig 2(a)). However, after 10 Myr (Fig 2(b)) all simulations have stars that produce 60Fe on exploding as supernovae, and the values lie within the range of measured ratios for the Solar system (Tang & Dauphas, 2012; Mishra et al., 2016).
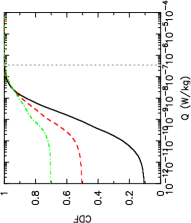
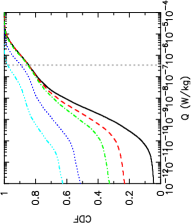
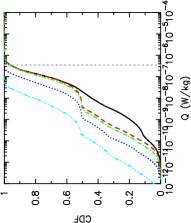
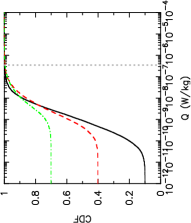
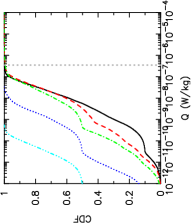
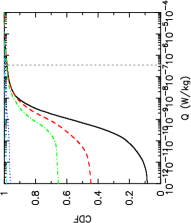
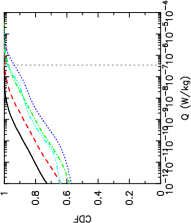
We now plot the radioactive heating of planetesimals from these SLRs in Fig. 3, following the method in Moskovitz & Gaidos (2011). We show the heating from supernovae only (Fig. 3(a)), from supernovae and dispersed winds (Fig. 3(b)) and from supernovae and local winds (Fig. 3(c)). Each line represents the distribution of values calculated at 10 Myr (the solid black line), 7.5 Myr (dashed red line), 5 Myr (dot-dashed green line), 2.5 Myr (dotted blue line) and at 1 Myr (dot-dot-dashed cyan line). The latter two lines are not present in Fig. 3(a) because there are no supernovae before 4 Myr. The value calculated for the Solar system is shown by the vertical dotted line. Clearly, very few systems obtain Solar system-levels of heating from supernovae alone, or to frame it in terms independent of the assumptions about disc radius/evolution, enrichment is enhanced by the presence of winds, especially if the material remains in localised bubbles.
3.2 Moderate stellar densities
The high stellar density star-forming regions shown in Figs. 1–3 are likely to be representative of some regions, e.g. the ONC (Allison & Goodwin, 2011; Parker, 2014; Schoettler et al., 2020), Carina (Reiter & Parker, 2019) and NGC 2264 (Schoettler et al., 2022; Parker & Schoettler, 2022), but not all. Many star-forming regions local to the Sun have much lower postulated initial densities, likely to be in the range 100 – 1 M⊙ pc-3 (Lada & Lada, 2003; Bressert et al., 2010; Parker & Alves de Oliveira, 2017).
When we reduce the stellar density, the amount of enrichment (unsurprisingly) decreases. At moderate stellar densities (M⊙ pc-3), depending on the amount of enrichment from winds, up to 50 per cent of stars attain Solar system-like (or higher) ratios after 10 Myr, and 10 per cent of stars attain Solar sytem-like (or higher) ratios.
In terms of the internal heating of planetesimals, however, only the simulations in which the 26Al is captured from localised stellar winds reach Solar system-levels of heating (the middle panel of Fig. 4(b)).
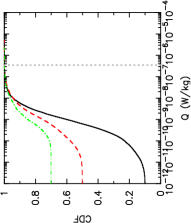
3.3 Low- and Field-like stellar densities
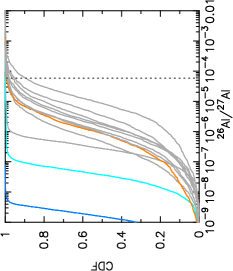
If we reduce the density further, so that the regions have low densities (M⊙ pc-3) then the amount of enrichment begins to fall below Solar system levels for all stars. In Fig. 5 we show the and ratios for these low-density regions at 10 Myr. Fig. 5(a) shows the ratios for the combination of supernovae and localised winds, and some stars do attain Solar system-like values. However, when the winds are more dispersed the distribution of ratios falls short of Solar system-values (Fig. 5(b)), as do the ratios (Fig. 5(c)).
When we use the and ratios to calculate the SLR heating, we find that almost no stars have values commensurate with the early Solar system (Fig. 6).
If we reduce the density further, to values similar to the Sun’s present-day location (0.1 M⊙ pc-3 Korchagin et al., 2003), then no stars have Solar system levels of enrichment.
3.4 Enrichment during disc depletion
Up to this point we have assumed that the discs remain extant for the duration of the simulation (10 Myr), and as this is roughly the main sequence lifetime of many of the enriching (massive) stars, the discs can capture material from the winds of these stars, and then their supernovae ejecta when they explode.
We have not allowed the discs to expand through viscous evolution (Hartmann et al., 1998; Lichtenberg et al., 2016a), but also we have not factored in any disc destruction mechanisms, such as truncation from encounters and/or photoevaporation from the massive stars (Johnstone et al., 1998; Scally & Clarke, 2001; Adams et al., 2004; Vincke et al., 2015; Nicholson et al., 2019; Parker et al., 2021).
We have also not accounted for planet formation in the discs, which although does not remove material from the disc, it may mean the composition of the disc (and distribution of SLRs within) is no longer homogeneous.
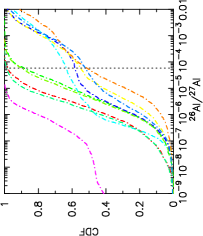
In Figs. 7–9 we repeat the calculations for the high density star-forming regions (M⊙ pc-3) but ‘deplete’ our discs using the exponential function in Eqn. 2. At a given time, if a random number exceeds the value in Eqn. 2 we do not add any further 26Al or 60Fe to the disc (either from winds, or supernovae).
The effect of this is clearly demonstrated in Fig. 7. In panel (a) we show the ratios for discs for enrichment from supernovae only. Only three out of ten simulations have any discs remaining at this age, and very few of these discs have any notable enrichment.
In the simulations where wind enrichment occurs (panels (b) and (c)), then after 10 Myr five simulations have enrichment commensurate with the Solar system if the wind enrichment occurs in small, localised bubbles. Fewer simulations (three) have Solar system levels of enrichment if the winds expand into large bubbles.
However, despite the early depletion of discs (the discs have a ‘half-life’ of 2 Myr, Richert et al., 2018), enrichment does occur early on, as shown in panels (c)–(f) in Fig. 7. Here, the enrichment is dominated by winds, and the majority occurs in the first few Myr when the star-forming regions are more dense (the dashed, and dot-dashed lines, representing enrichment from dispersed, and more local winds, respectively, creep rightwards in these plots over time, but many stars obtain most of their enrichment in the first 2 Myr).
We find a similar pattern in the ratios, as shown in Fig. 8. Recall that the enrichment in 60Fe comes only from supernovae, and the majority of the discs have depleted by the time of the supernovae. Panel (a) in this figure shows the ratios at 5 Myr, where there are more discs, but fewer massive stars have exploded as supernovae, whereas panel (b) shows the ratios at 10 Myr, where there are fewer discs, but more supernovae have occurred. Clearly, the ratios are low, or non-existent, for most stars at both times.
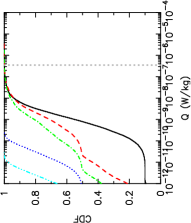
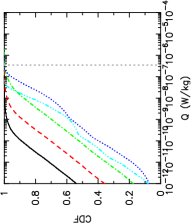
Finally, we plot the amount of heating due to 26Al and 60Fe when the discs are depleted and the results are shown in Fig. 9. We see that if enrichment occurs from supernovae alone (panel a), or from dispersed winds (panel c) then planetesimals will not attain Solar system-levels of heating. However, panel (b) shows that if the winds are entrained in smaller, localised bubbles, then Solar system levels of heating can still occur. This is because the 26Al and 60Fe are added to the discs earlier; in this plot the distribution with the highest values is at 2.5 Myr (the dark blue dotted line), whereas in similar simulations when we do not deplete the discs (Fig. 3) the heating after 5 – 10 Myr is greatest.
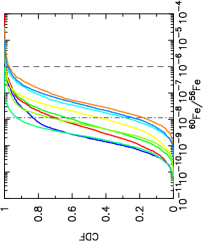
3.5 Relative abundances of 26Al to 60Fe
A further issue with the disc enrichment from supernovae scenario is that the relative abundance of 26Al to 60Fe is usually too low in simulations, at around unity. The ratio of 26Al/60Fe is affected by the uncertainty in the measurements of 60Fe, but for example, Gounelle & Meynet (2012) quote 26Al/60Fe = 8.2, and Lugaro et al. (2018) quote 26Al/60Fe 3–25. This ratio is sensitively dependent on the measured value of 60Fe.
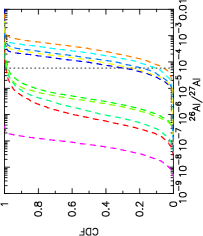
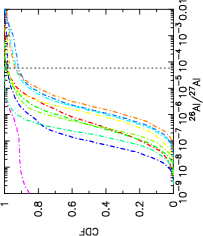
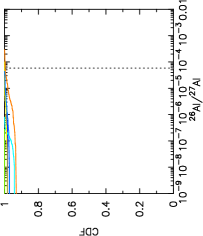
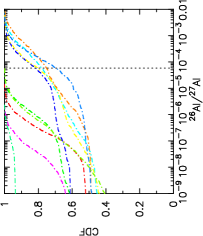
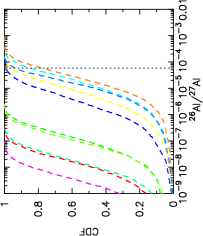
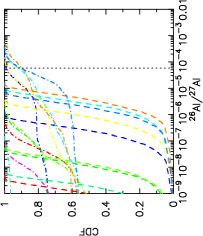
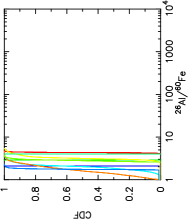
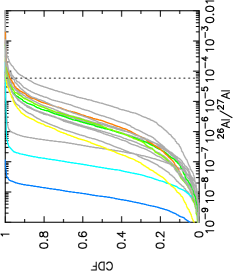
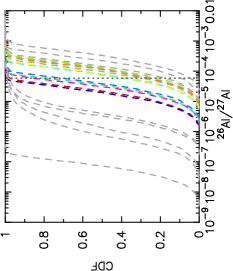
We plot the 26Al/60Fe ratio from our dense simulations (M⊙ pc-3) in Fig. 10. In panel (a) we show the ratios for simulations where the 26Al comes from supernovae alone, in panel (b) we show the ratios where the 26Al also comes from winds that disperse through the star cluster, and in panel (c) we show the ratios where the 26Al also comes from winds that are entrained in local bubbles.
Clearly, when the 26Al comes from supernovae alone, the 26Al/60Fe ratio is close to unity in many cases, but when the 26Al comes from winds this ratio can span a much larger range in values and is within the measured values for the Solar system. In strongly wind-enriched systems, the 26Al/60Fe can even exceed the likely range in the Solar system by more than an order of magnitude.
4 Discussion
Our results show that protoplanetary discs can be enriched in the SLRs 26Al and 60Fe to Solar system levels and beyond by capturing the material ejected in the winds of massive stars.
As one might expect, the amount of enrichment is dependent on the initial stellar density, with more enrichment, to higher levels, occurring in dense star-forming regions where the average stellar density is M⊙ pc-3 compared to moderately dense ( M⊙ pc-3) star-forming regions.
While Solar system-like levels of 26Al enrichment can be reproduced in an appreciable number of cases, we find a high degree of 26Al variability in young planetary systems. This suggests that internal radiogenic heating can be anticipated to vary substantially between planetary systems, with potentially significant implications for the distribution of atmosphere-forming volatile elements, such as water (Lichtenberg et al., 2019) and carbon compounds (Lichtenberg & Krijt, 2021). Enrichment on a level of a few per cent to a few tens of per cent is consistent with the amount of differentiated debris in polluted white dwarfs (Bonsor et al., 2020; Curry et al., 2022), which suggests that internal heating by short-lived radioactive isotopes chemically differentiates and thus alters a significant fraction of planetary bodies during planetary formation (Jura & Young, 2014; Lichtenberg et al., 2022).
However, at densities M⊙ pc-3 the amount of enrichment does not result in planetessimal heating to Solar system levels. It is worth highlighting that many star-forming regions, from Taurus (Güdel et al., 2007) to Cyg OB2 (Wright et al., 2014), have densities of this order, and if they were not more dense in the past, it is difficult to see how these regions could enrich protoplanetary discs to Solar system levels.
When we implement a disc depletion algorithm, many of the discs are gone before the stars explode as supernovae, and so the enrichment is dominated by the massive stars’ winds. If – as appears to be the case in the Solar system – enrichment happens early on, then our results suggest this can only happen in the most dense star-forming regions.
We have also demonstrated that the relative abundance of 26Al/60Fe is consistent with a contribution of 26Al from massive star winds, and negates the need for multiple phases, or sequential star formation, to be required for solar system formation (as postulated by Gounelle & Meynet, 2012; Young, 2014).
The most significant caveat in our work is the omission of disc evolution, both internal viscous evolution and mass-loss due to external photoevaporation due to Far/Extreme Ultraviolet (FUV/EUV) radiation from massive stars. Discs undergo significant spreading due to viscous evolution (Concha-Ramírez et al., 2019), which would increase the cross section of the discs and potentially lead to higher levels of enrichment. It is likely that the implementation of viscous evolution in the models of Lichtenberg et al. (2016b) is the reason why some of their simulations display higher ratios and heating values.
However, our discs could also be significantly altered by photoevaporation and the subsequent inward evolution of the discs. Whilst external photoevaporation is thought to remove very little of the dust content of discs (Haworth et al., 2018), it may drive the dust radii inwards (Sellek et al., 2020), which – if dominant over viscous spreading – would reduce the cross section of the disc for capturing wind and supernovae ejecta.
Furthermore, whilst little dust is lost from discs due to photoevaporation, significant amounts of the gas – sometimes all – is removed on very short (1 Myr) timescales (Scally & Clarke, 2001; Winter et al., 2018; Nicholson et al., 2019; Parker et al., 2021; Concha-Ramírez et al., 2019). This means that gas giant planet formation can be hindered or suppressed altogether. In a follow-up paper, we will determine how many Solar system analogues can be enriched yet retain gas in their discs in these star-forming regions, and compare the destruction of discs due to FUV radiation with those that may be enriched but truncated by dynamical encounters, e.g. Portegies Zwart (2019).
A further caveat to our results is that we have only modelled subvirial star-forming regions undergoing collapse to form a star cluster. These initial conditions probably optimise the amount of enrichment, as opposed to e.g. a supervirial region undergoing expansion (though we note that these regions also develop dense (sub)clusters which are very similar in both appearance and physical processes to the subvirial clusters and do not preclude enrichment, Parker et al., 2014a, b; Rate et al., 2020).
We have also not varied the degree of spatial substructure, the number of stars (enrichment can occur in low- star-forming regions if there are massive stars present Nicholson & Parker, 2017) or included primordial binaries in our calculations.
5 Conclusions
We present -body simulations of star-forming regions and employ a post-processing analysis to determine the amount of enrichment in the short-lived radioisotopes (SLRs) 26Al and 60Fe that occurs in protoplanetary discs. Previous work on the dynamical evolution of young star-forming regions has usually only considered the contribution of 26Al from the supernovae explosions of massive stars, but in this work we have implemented enrichment from the winds of these massive stars. We then use the amount of 26Al and 60Fe to calculate the radioactive internal heating of planetesimals due to these SLRs. Our simulations results suggest the following:
(i) The contribution of 26Al from stellar winds is significant, and for many stars is the difference between enrichment at lower levels than the Solar system, and levels equal to or higher than the Solar system.
(ii) The amount of enrichment is slightly sensitive to the dispersal rate of the wind material; if the material disperses throughout the whole star-forming region, then more stars are enriched, but fewer at Solar system levels or higher. If the winds are entrained in local bubbles, then fewer stars overall are enriched, but more of those that are have Solar system or higher levels of enrichment.
(iii) The stellar density is the most important variable in determining the number of stars that are enriched. In the most dense regions ( M⊙ pc-3), up to 50 per cent of stars can attain Solar system levels of enrichment, whereas in regions with much lower densities ( M⊙ pc-3, similar to OB associations observed today), almost no enrichment occurs.
(iv) Our results are very sensitive to the lifetimes of the protoplanetary discs. In a set of simulations where we forbid enrichment if the disc has either been destroyed or already formed planets, enrichment can only occur in the most dense star-forming regions.
(v) When winds make a significant contribution to the enrichment, this occurs much earlier than in previous simulations that solely relied on supernovae (Solar system-levels of enrichment from winds occur from 2.5 Myr, rather than from beyond the times of the first supernovae at around 4 Myr).
(vi) Our simulations reproduce the amount of internal heating calculated for planetesimals in the early Solar system, and also produce a wide spread in the relative abundance of 26Al/60Fe.
However, for simplicity, our simulations do not include photoevaporation of the gas component of the discs due to the FUV/EUV radiation fields of massive stars (the same massive stars that are enriching the discs), nor are the radii of the protoplanetary discs evolving due to photoevaporation or viscous speading. In a follow-up paper we will implement both mechanisms to establish whether our Solar system could form, be enriched early, and retain a gas component in its disc that would enable Jupiter and Saturn to form.
Acknowledgements
We thank the anonymous referee for their comments and suggestions, which have improved the manuscript. RJP acknowledges support from the Royal Society in the form of a Dorothy Hodgkin Fellowship. TL acknowledges support from the Simons Foundation (SCOL Award No. 611576), and the Branco Weiss foundation. This work benefitted from information exchange within the program ‘Alien Earths’ (NASA grant No. 80NSSC21K0593) for NASA’s Nexus for Exoplanet System Science (NExSS) research coordination network, and the AEThER project, funded by the Alfred P. Sloan Foundation under grant No. G202114194. We are grateful to Marco Limongi for clarifying an aspect of the models from Limongi & Chieffi (2018) during the refereeing process.
Data availability statement
The data used to produce the plots in this paper will be shared on reasonable request to the corresponding author.
References
- ALMA Partnership et al. (2015) ALMA Partnership et al., 2015, ApJ, 808, L3
- Adams et al. (2004) Adams F. C., Hollenbach D., Laughlin G., Gorti U., 2004, ApJ, 611, 360
- Allison & Goodwin (2011) Allison R. J., Goodwin S. P., 2011, MNRAS, 415, 1967
- Allison et al. (2010) Allison R. J., Goodwin S. P., Parker R. J., Portegies Zwart S. F., de Grijs R., 2010, MNRAS, 407, 1098
- Alves et al. (2020) Alves F. O., Cleeves L. I., Girart J. M., Zhu Z., Franco G. A. P., Zurlo A., Caselli P., 2020, ApJ, 904, L6
- André et al. (2014) André P., Di Francesco J., Ward-Thompson D., Inutsuka S.-I., Pudritz R. E., Pineda J. E., 2014, Protostars and Planets VI, pp 27–51
- Andrews et al. (2018) Andrews S. M., et al., 2018, ApJL, 869, L41
- Bastian et al. (2010) Bastian N., Covey K. R., Meyer M. R., 2010, ARA&A, 48, 339
- Bate (2009) Bate M. R., 2009, MNRAS, 392, 590
- Bonsor et al. (2020) Bonsor A., Carter P. J., Hollands M., Gänsicke B. T., Leinhardt Z., Harrison J. H. D., 2020, MNRAS, 492, 2683
- Boss (1995) Boss A. P., 1995, ApJ, 439, 224
- Boss (2019) Boss A. P., 2019, ApJ, 870, 3
- Bressert et al. (2010) Bressert E., et al., 2010, MNRAS, 409, L54
- Buckner et al. (2019) Buckner A. S. M., et al., 2019, A&A, 622, A184
- Cameron & Truran (1977) Cameron A. G. W., Truran J. W., 1977, Icarus, 30, 447
- Cartwright & Whitworth (2004) Cartwright A., Whitworth A. P., 2004, MNRAS, 348, 589
- Castillo-Rogez et al. (2009) Castillo-Rogez J., Johnson T. V., Lee M. H., Turner N. J., Matson D. L., Lunine J., 2009, Icarus, 204, 658
- Concha-Ramírez et al. (2019) Concha-Ramírez F., Wilhelm M. J. C., Portegies Zwart S., Haworth T. J., 2019, MNRAS, 490, 5678
- Côté et al. (2019) Côté B., Yagüe A., Világos B., Lugaro M., 2019, ApJ, 887, 213
- Curry et al. (2022) Curry A., Bonsor A., Lichtenberg T., Shorttle O., 2022, MNRAS, 515, 395
- Daffern-Powell & Parker (2020) Daffern-Powell E. C., Parker R. J., 2020, MNRAS, 493, 4925
- Dale et al. (2015) Dale J. E., Ercolano B., Bonnell I. A., 2015, MNRAS, 451, 987
- Diehl et al. (2021) Diehl R., et al., 2021, Publ. Astron. Soc. Australia, 38, e062
- Farias et al. (2020) Farias J. P., Tan J. C., Eyer L., 2020, ApJ, 900, 14
- Fatuzzo & Adams (2015) Fatuzzo M., Adams F. C., 2015, ApJ, 813, 55
- Fatuzzo & Adams (2022) Fatuzzo M., Adams F. C., 2022, ApJ, 925, 56
- Forbes et al. (2021) Forbes J. C., Alves J., Lin D. N. C., 2021, Nature Astronomy, 5, 1009
- Foster et al. (2015) Foster J. B., et al., 2015, ApJ, 799, 136
- Fujimoto et al. (2018) Fujimoto Y., Krumholz M. R., Tachibana S., 2018, MNRAS, 480, 4025
- Gaidos et al. (2009) Gaidos E., Krot A. N., Williams J. P., Raymond S. N., 2009, ApJ, 696, 1854
- Girichidis et al. (2011) Girichidis P., Federrath C., Banerjee R., Klessen R. S., 2011, MNRAS, 413, 2741
- Goodwin & Whitworth (2004) Goodwin S. P., Whitworth A. P., 2004, A&A, 413, 929
- Gounelle (2015) Gounelle M., 2015, A&A, 582, A26
- Gounelle & Meynet (2012) Gounelle M., Meynet G., 2012, A&A, 545, A4
- Güdel et al. (2007) Güdel M., et al., 2007, A&A, 468, 353
- Hacar et al. (2018) Hacar A., Tafalla M., Forbrich J., Alves J., Meingast S., Grossschedl J., Teixeira P. S., 2018, A&A, 610, A77
- Haisch et al. (2001) Haisch Jr. K. E., Lada E. A., Lada C. J., 2001, ApJL, 553, L153
- Hartmann et al. (1998) Hartmann L., Calvet N., Gullbring E., D’Alessio P., 1998, ApJ, 495, 385
- Haworth et al. (2018) Haworth T. J., Clarke C. J., Rahman W., Winter A. J., Facchini S., 2018, MNRAS, 481, 452
- Jacobsen et al. (2008) Jacobsen B., Yin Q.-z., Moynier F., Amelin Y., Krot A. N., Nagashima K., Hutcheon I. D., Palme H., 2008, Earth and Planetary Science Letters, 272, 353
- Johnstone et al. (1998) Johnstone D., Hollenbach D., Bally J., 1998, ApJ, 499, 758
- Jura & Young (2014) Jura M., Young E. D., 2014, Annual Review of Earth and Planetary Sciences, 42, 45
- King et al. (2012) King R. R., Parker R. J., Patience J., Goodwin S. P., 2012, MNRAS, 421, 2025
- Kita et al. (2013) Kita N. T., et al., 2013, Meteoritics and Planetary Science, 48, 1383
- Kodolányi et al. (2022) Kodolányi J., Hoppe P., Vollmer C., Berndt J., Müller M., 2022, ApJ, 940, 95
- Korchagin et al. (2003) Korchagin V. I., Girard T. M., Borkova T. V., Dinescu D. I., van Altena W. F., 2003, AJ, 126, 2896
- Kruijssen (2012) Kruijssen J. M. D., 2012, MNRAS, 426, 3008
- Kuffmeier et al. (2016) Kuffmeier M., Frostholm Mogensen T., Haugbølle T., Bizzarro M., Nordlund Å., 2016, ApJ, 826, 22
- Lada & Lada (2003) Lada C. J., Lada E. A., 2003, ARA&A, 41, 57
- Larson (1981) Larson R. B., 1981, MNRAS, 194, 809
- Lee et al. (1976) Lee T., Papanastassiou D. A., Wasserburg G. J., 1976, Geophys. Res. Lett., 3, 109
- Lichtenberg & Krijt (2021) Lichtenberg T., Krijt S., 2021, ApJ, 913, L20
- Lichtenberg et al. (2016a) Lichtenberg T., Golabek G. J., Gerya T. V., Meyer M. R., 2016a, Icarus, 274, 350
- Lichtenberg et al. (2016b) Lichtenberg T., Parker R. J., Meyer M. R., 2016b, MNRAS, 462, 3979
- Lichtenberg et al. (2019) Lichtenberg T., Golabek G. J., Burn R., Meyer M. R., Alibert Y., Gerya T. V., Mordasini C., 2019, Nature Astronomy, 3, 307
- Lichtenberg et al. (2022) Lichtenberg T., Schaefer L. K., Nakajima M., Fischer R. A., 2022, arXiv e-prints, p. arXiv:2203.10023
- Limongi & Chieffi (2006) Limongi M., Chieffi A., 2006, ApJ, 647, 483
- Limongi & Chieffi (2018) Limongi M., Chieffi A., 2018, ApJS, 237, 13
- Lodders (2003) Lodders K., 2003, ApJ, 591, 1220
- Lomax et al. (2011) Lomax O., Whitworth A. P., Cartwright A., 2011, MNRAS, 412, 627
- Lugaro et al. (2018) Lugaro M., Ott U., Kereszturi Á., 2018, Progress in Particle and Nuclear Physics, 102, 1
- Lynden-Bell (1967) Lynden-Bell D., 1967, MNRAS, 136, 101
- Marks & Kroupa (2012) Marks M., Kroupa P., 2012, A&A, 543, A8
- Maschberger (2013) Maschberger T., 2013, MNRAS, 429, 1725
- McMillan et al. (2007) McMillan S. L. W., Vesperini E., Portegies Zwart S. F., 2007, ApJL, 655, L45
- Mishra et al. (2016) Mishra R. K., Marhas K. K., Sameer 2016, Earth and Planetary Science Letters, 436, 71
- Mojzsis (2021) Mojzsis S. J., 2021, arXiv e-prints, p. arXiv:2112.04309
- Moskovitz & Gaidos (2011) Moskovitz N., Gaidos E., 2011, Meteorit. Planet. Sci., 46, 903
- Nicholson & Parker (2017) Nicholson R. B., Parker R. J., 2017, MNRAS, 464, 4318
- Nicholson et al. (2019) Nicholson R. B., Parker R. J., Church R. P., Davies M. B., Fearon N. M., Walton S. R. J., 2019, MNRAS, 485, 4893
- Ouellette et al. (2007) Ouellette N., Desch S. J., Hester J. J., 2007, ApJ, 662, 1268
- Ouellette et al. (2010) Ouellette N., Desch S. J., Hester J. J., 2010, ApJ, 711, 597
- Parker (2014) Parker R. J., 2014, MNRAS, 445, 4037
- Parker & Alves de Oliveira (2017) Parker R. J., Alves de Oliveira C., 2017, MNRAS, 468, 4340
- Parker & Dale (2015) Parker R. J., Dale J. E., 2015, MNRAS, 451, 3664
- Parker & Quanz (2012) Parker R. J., Quanz S. P., 2012, MNRAS, 419, 2448
- Parker & Schoettler (2022) Parker R. J., Schoettler C., 2022, MNRAS, 510, 1136
- Parker et al. (2014a) Parker R. J., Church R. P., Davies M. B., Meyer M. R., 2014a, MNRAS, 437, 946
- Parker et al. (2014b) Parker R. J., Wright N. J., Goodwin S. P., Meyer M. R., 2014b, MNRAS, 438, 620
- Parker et al. (2016) Parker R. J., Goodwin S. P., Wright N. J., Meyer M. R., Quanz S. P., 2016, MNRAS, 459, L119
- Parker et al. (2021) Parker R. J., Nicholson R. B., Alcock H. L., 2021, MNRAS, 502, 2665
- Peretto et al. (2006) Peretto N., André P., Belloche A., 2006, A&A, 445, 979
- Portegies Zwart (2019) Portegies Zwart S., 2019, A&A, 622, A69
- Portegies Zwart et al. (1999) Portegies Zwart S. F., Makino J., McMillan S. L. W., Hut P., 1999, A&A, 348, 117
- Portegies Zwart et al. (2001) Portegies Zwart S. F., McMillan S. L. W., Hut P., Makino J., 2001, MNRAS, 321, 199
- Portegies Zwart et al. (2018) Portegies Zwart S., Pelupessy I., van Elteren A., Wijnen T. P. G., Lugaro M., 2018, A&A, 616, A85
- Queloz (2020) Queloz D., 2020, Reviews of Modern Physics, 92, 030503
- Rate et al. (2020) Rate G., Crowther P. A., Parker R. J., 2020, arXiv e-prints, p. arXiv:2005.02533
- Reiter & Parker (2019) Reiter M., Parker R. J., 2019, MNRAS, 486, 4354
- Richert et al. (2018) Richert A. J. W., Getman K. V., Feigelson E. D., Kuhn M. A., Broos P. S., Povich M. S., Bate M. R., Garmire G. P., 2018, MNRAS, 477, 5191
- Salpeter (1955) Salpeter E. E., 1955, ApJ, 121, 161
- Sánchez & Alfaro (2009) Sánchez N., Alfaro E. J., 2009, ApJ, 696, 2086
- Scally & Clarke (2001) Scally A., Clarke C., 2001, MNRAS, 325, 449
- Schmeja & Klessen (2006) Schmeja S., Klessen R. S., 2006, A&A, 449, 151
- Schoettler et al. (2019) Schoettler C., Parker R. J., Arnold B., Grimmett L. P., de Bruijne J., Wright N. J., 2019, MNRAS, 487, 4615
- Schoettler et al. (2020) Schoettler C., de Bruijne J., Vaher E., Parker R. J., 2020, MNRAS, 495, 3104
- Schoettler et al. (2022) Schoettler C., Parker R. J., de Bruijne J., 2022, MNRAS, 510, 3178
- Segura-Cox et al. (2020) Segura-Cox D. M., et al., 2020, Nature, 586, 228
- Sellek et al. (2020) Sellek A. D., Booth R. A., Clarke C. J., 2020, MNRAS, 492, 1279
- Spitzer (1969) Spitzer Jr. L., 1969, ApJL, 158, L139
- Tang & Dauphas (2012) Tang H., Dauphas N., 2012, Earth and Planetary Science Letters, 359, 248
- Thrane et al. (2006) Thrane K., Bizzarro M., Baker J. A., 2006, ApJL, 646, L159
- Trappitsch et al. (2018) Trappitsch R., et al., 2018, ApJ, 857, L15
- Vincke et al. (2015) Vincke K., Breslau A., Pfalzner S., 2015, A&A, 577, A115
- Wallner et al. (2015) Wallner A., et al., 2015, Phys. Rev. Lett., 114, 041101
- Wijnen et al. (2017) Wijnen T. P. G., Pols O. R., Pelupessy F. I., Portegies Zwart S., 2017, A&A, 604, A91
- Winter et al. (2018) Winter A. J., Clarke C. J., Rosotti G., Ih J., Facchini S., Haworth T. J., 2018, MNRAS, 478, 2700
- Wordsworth & Kreidberg (2021) Wordsworth R., Kreidberg L., 2021, arXiv e-prints, p. arXiv:2112.04663
- Wright et al. (2014) Wright N. J., Parker R. J., Goodwin S. P., Drake J. J., 2014, MNRAS, 438, 639
- Wright et al. (2022) Wright N. J., Goodwin S., Jeffries R. D., Kounkel M., Zari E., 2022, arXiv e-prints, p. arXiv:2203.10007
- Young (2014) Young E. D., 2014, Earth and Planetary Science Letters, 392, 16
- de Mink et al. (2013) de Mink S. E., Langer N., Izzard R. G., Sana H., de Koter A., 2013, ApJ, 764, 166
Appendix A Comparison with different yield models
The stellar evolution models we use to calculate the yields are from Limongi & Chieffi (2006), which assume that stars 25 M⊙ produce 26Al and 60Fe (in addition to other heavy elements) in supernovae. However, the most recent models (e.g. Limongi & Chieffi, 2018) assume that 25 M⊙ stars collapse directly to a black hole and these new models produce different yields, especially for the supernovae.
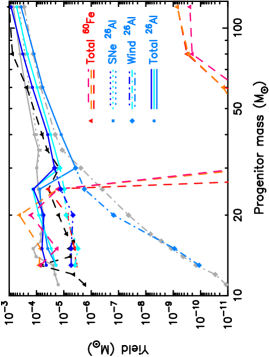
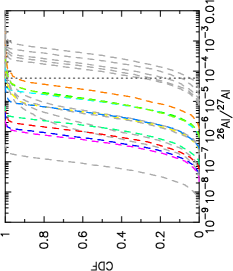
In Fig. 11 we show the yields from Limongi & Chieffi (2006) by the grey lines (26Al, for supernovae only, winds only, and total yield) and the black dashed line (60Fe). The new models from Limongi & Chieffi (2018) are shown by the coloured lines (different shades of blue for 26Al and different shades of red for 60Fe). The different shades of colour indicate different rotation velocities for the massive stars; for 26Al the powder blue, cyan and royal blue lines show yields for rotation velocities of 0, 150 and 300 km s-1, respectively, and for 60Fe the crimson, raspberry and orange lines show yields for rotation velocities of 0, 150 and 300 km s-1, respectively.
Two major differences between the two sets of models are apparent in Fig. 11. The Limongi & Chieffi (2018) models produce almost no 60Fe in stars 25 M⊙, due to the direct collapse to a black hole. For stars 25 M⊙, the 60Fe production is completely dominated by the supernovae, and only at masses 50 M⊙ is there a non-negligible contribution from stellar winds (though still six orders of magnitude smaller than the contribution from supernovae from lower mass stars). We also note here that our simulations do not contain any stars 50 M⊙, so the 60Fe is only produced in supernovae.
The second major difference is that the models that include stellar rotatation produce far more 26Al and 60Fe for stars 25 M⊙.
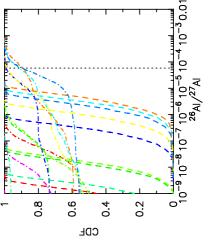
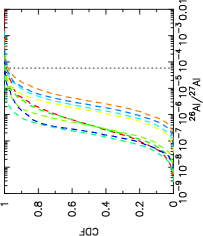
We repeat the calculations for our first set of simulations (a high density star-forming region where the discs all have radii au, shown in Figs. 1 and 2 in the main paper) and use the yields from the non-rotating (0 km s-1) and fast rotating (300 km s-1) models in Limongi & Chieffi (2018) to calculate the the SLR ratios for each star.
We show the results for the non-rotating models in Fig. 12 and the fast rotating models in Fig. 13. The coloured lines show the results using these Limongi & Chieffi (2018) models, whereas the grey lines show the results using the older models of Limongi & Chieffi (2006), which we presented in Figs. 1 and 2.
The main differences between the two sets of models are in the lack of supernovae from stars 25 M⊙, which means that far fewer star-forming regions have SLR ratios commensurate with Solar system values, when only considering enrichment from supernovae. The reason for this is that stars with masses 20 M⊙ explode after the end time of our models (10 Myr) but those with masses 20 M⊙ do not explode during the simulations. Interestingly, in the fast-rotating models (Fig. 13) there are fewer supernovae than in the non-rotating models, which results in less enrichment from supernovae in the rotating models.
The models with rotation produce far more 26Al via the winds of stars than supernovae, and in some cases produce more enrichment than the older models in Limongi & Chieffi (2006), especially when we assume the ejected wind material remains in local bubbles, rather than being dispersed throughout the star-forming region.
In summary, whilst the yield calculations using the data in Limongi & Chieffi (2018) are different from those in Limongi & Chieffi (2006), the uncertainties in stellar rotation rates (and the other missing physics and approximations in our simulations) suggest using the older models is not overestimating the SLR yields in our simulated star-forming regions. de Mink et al. (2013) show that the rotation rates of massive stars are at least 200 km s-1, so the wind enrichment models using yields from fast-rotating stars are likely to be the most appropriate for our simulations.