Magnetic order in 2D antiferromagnets revealed by spontaneous anisotropic magnetostriction
Abstract
The temperature dependent order parameter provides important information on the nature of magnetism. Using traditional methods to study this parameter in two-dimensional (2D) magnets remains difficult, however, particularly for insulating antiferromagnetic (AF) compounds. Here, we show that its temperature dependence in AF MPS3 (M(II) = Fe, Co, Ni) can be probed via the anisotropy in the resonance frequency of rectangular membranes, mediated by a combination of anisotropic magnetostriction and spontaneous staggered magnetization. Density functional calculations followed by a derived orbital-resolved magnetic exchange analysis confirm and unravel the microscopic origin of this magnetization inducing anistropic strain. We further show that the temperature and thickness dependent order parameter allows to deduce the material’s critical exponents characterising magnetic order. Nanomechanical sensing of magnetic order thus provides a future platform to investigate 2D magnetism down to the single-layer limit.
Layered two-dimensional (2D) magnetic materials offer an emerging platform for fundamental studies of magnetism in the 2D limit. Their stackability into van der Waals heterostructures opens pathways to non-trivial magnetic phases and technological applications, including sensors, memories and spintronic logic devices [Mak2019]. In addition to ferromagnetism, first observed in CrI3 [Huang2017] and Cr2Ge2Te6 [DiscoveryGong2017], antiferromagnetism in 2D materials has also been studied in FePS3 [Lee2016] and CrSBr [Telford2020]. Antiferromagnetic (AF) materials are of particular technological interest due to their high spin-wave propagation speed and lack of macroscopic stray fields, making them strong candidates for spintronic and magnonic applications [Nemec2018, Rahman2021, Mertens2022, Boix-Constant2022, Esteras2022].
For insulating, thin AF materials, such as MPS3 (M(II) = Fe, Co, Ni), few methods are available to study their intrinsic magnetism. Conventional techniques, such as neutron scattering, magnetization measurement by a superconducting quantum interference device (SQUID) or vibrating sample magnetometry are challenging, due to the small volumes of exfoliated 2D materials. Other methods, suited to 2D materials, require electrical conductance, the presence of specific optical modes or ferromagnetic order; they are therefore difficult to apply [Mak2019]. In contrast, strain applied to 2D magnetic materials was shown to be extremely powerful, inducing magnetization reversal [FengStrainReversal], reorientating the easy-axis [NeelVectorNi2021], or reversing the exchange interaction [cenker_reversible_2022]. In addition, the direct coupling between strain, resonance frequency and magnetization in membranes of 2D magnets, makes nanomechanical resonance a sensitive method for studying their phase transitions [Siskins2020, siskins_nanomechanical_2022, FaiMakJiang2020]. Here, we show, guided by density functional theory (DFT), that the magnetic order parameter of MPS3 AF membranes can be quantified through the anisotropy in their magneto-elastic response; from its temperature dependence the critical exponents are determined, and their thickness dependence is investigated.
Results and Discussion
First principles analysis of spontaneous magnetostriction in MPS3
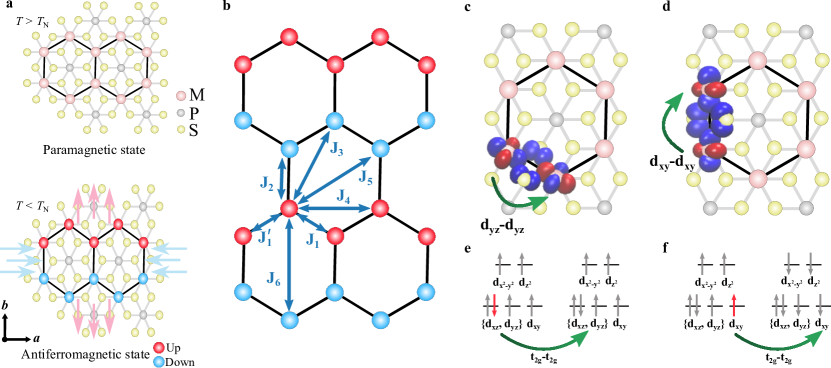
Transition-metal phosphorus trisulphides, with general formula MPS3, are layered materials stacked in a monoclinic lattice with symmetry group C2/m [Chittari2016], as shown in the top view of a single-layer in the paramagnetic phase, Fig. 1a, top panel. The spins of FePS3 point out-of-plane, whereas both CoPS3 and NiPS3 are in-plane systems with their spins preferentially aligned along the axis. The intralayer AF order forms a zigzag configuration, as shown in bottom panel of Fig. 1a, leading to two opposite aligned magnetic sub-latices. The difference of the magnetisation between these sub-latices is the Néel vector. In bulk CoPS3 and NiPS3, these layers with this staggered magnetism are stacked in a ferromagnetic (FM) fashion with Néel transition temperatures, , around 119 and 155 K, respectively [Wildes2017, Joy1992]. The interlayer magnetic interactions in FePS3 are AF with a transition around 118 K [Takano2004].
To analyse the effect of magnetic ordering on the lattice, we performed first principles structural optimizations of FePS3, CoPS3 and NiPS3 based on density functional theory (DFT). For the ground state zigzag magnetic configuration, the calculations predict a compression of the lattice parameter with respect to the crystallographic, non-magnetic structure of 2.545% and 1.328% for the Co and Fe derivatives respectively (see Table 1). In addition, the axis expands by 0.402% (Co) and 0.359% (Fe). In contrast, in NiPS3 the lattice parameters remain almost unchanged. The crystal and magnetic structures are strongly connected in these compounds, which is further corroborated by simulations of different spin configurations (see Supplementary Note 1).
The microscopic mechanism governing the spontaneous magnetostriction in these materials is studied using orbital-resolved magnetic exchange analyses based on maximally localized Wannier functions, (see Supplementary Note 1). The analysis shows that the spontaneous magnetostriction calculated in FePS3 and CoPS3 arises from isotropic magnetic exchange interactions between t2g-t2g orbitals. Specifically, for FePS3 the main magnetic exchange channels, substantially affected by the compression of the and expansion of the lattice parameters, are the ones involving t2g-t2g interactions of FM nature. The changes in the lattice parameters result in an increase in J1 and J due to a decrease in distance between the dyz-dyz and dxz-dxz orbitals, respectively (Fig. 1c). Simultaneously, these changes cause a decrease of J2 due to a larger separation of the dxy-dxy orbitals (Fig. 1d). This is compatible with the electron configuration of Fe2+ (d6), which has these orbitals partially filled and allows FM hopping between them (Fig. 1e,f).
This hopping effect also occurs for Co2+ (d7) although the additional electron present for Co blocks the dxy-dxy pathway (Supplementary Note 1, Fig. S2). This results in a stronger effect along J1 and J for the optimized structure, maximizing FM interactions in the zigzag chain, which involve the dyz-dyz and dxz-dxz orbitals, respectively. For the Ni2+ derivative (d8), the t2g energy levels are fully occupied (Supplementary Note 1, Fig. S3), which results in a blocking of the t2g-t2g magnetic super-exchange channels. This leads to an almost negligible modification in the lattice parameters of the optimized structure with respect to the crystallographic non-magnetic one.
| CoPS3 | FePS3 | NiPS3 | ||||
|---|---|---|---|---|---|---|
| Lattice parameter (Å) | a | b | a | b | a | b |
| NM | 5.895 | 10.19 | 5.947 | 10.301 | 5.812 | 10.07 |
| AF-zigzag | 5.745 | 10.231 | 5.868 | 10.338 | 5.817 | 10.061 |
| Change () | -2.545 | +0.402 | -1.328 | +0.359 | +0.086 | -0.089 |
Resonance frequency changes due to spontaneous magnetostrictive strain
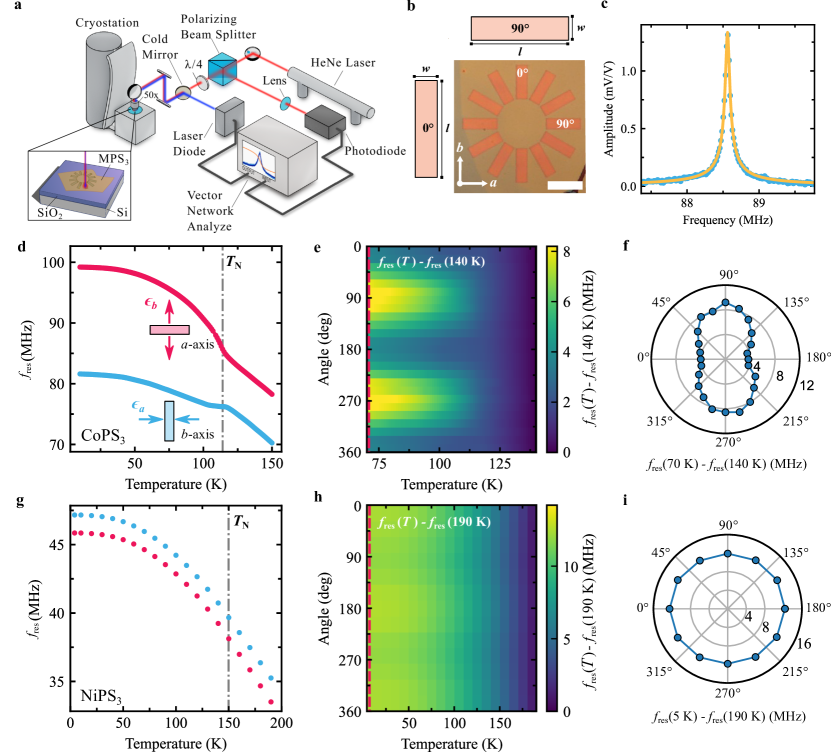
The predicted anisotropic change of lattice parameters when going from the paramagnetic to the AF phase, causes compressive stress, , and tensile stress, , along the a axis and b axis respectively, as illustrated in Fig. 1a, bottom pannel. To quantify this anisotropy appearing at the phase transition, we use rectangular membranes, shown in Fig. 2b, to nanomechanically probe stress variations, along a specific crystallographic axis [SiskinsAs2S32019] (see Supplementary Note 2). In the following analysis, we neglect the stress contribution from the thermal expansion of the substrate, as this is small compared to that of the MPS3 compounds [Siskins2020].
The resonance frequency of the fundamental mode of a rectangular membrane, , is approximately given by [Leissa2011]:
| (1) |
where is the mass density, and are respectively the width and length of the membrane, as indicated in Fig. 2b, and are the stresses parallel to these directions. For high-aspect-ratio membranes (), the mechanical resonance frequency is mostly determined by the stress along the shortest direction, .
We study the resonance frequency of thin MPS3 flakes suspended over star-shaped cavities with angular resolution, as shown in an example device in Fig. 2b. When the longest side of the cavity is aligned along a crystallographic axis (a or b) and , its fundamental resonance frequency ( or ) is determined by the stress along the perpendicular axis ( or ):
| (2) |
On cavities oriented at an intermediate angle, , (defined with respect to the axis), the resonance frequency is:
| (3) | |||||
where we have used the constitutive equations for a magnetostrictive membrane with plane stress [Landau1984], while only keeping the anisotropy in the magnetostriction coefficient, Supplementary Note 2. Here, is the Young’s modulus and is Poisson’s ratio of the material. Moreover, we have , with the residual fabrication strain and the phononic thermal expansion induced strain variation. The magnetostrictive strain along the and -axes is given by , respectively (see Supplementary Note 3 for a detailed derivation of Eq. (3)), where are magnetostriction coefficients and is the AF order parameter squared.
The temperature dependence of the resonance frequency comprises two contributions: one due to the phononic thermal expansion coefficient , given by , where is a reference temperature and the integration variable, and the magnetostrictive contribution . The former contribution is a slowly varying function of , while the latter term contains the staggered magnetization, which increases abruptly near the phase transition; it thus can be used to determine , as we will show below. We assume to be independent, as its temperature dependence will be negligible when compared to that of .
Nanomechanical determination of the order parameter
To quantify the anisotropy in the magnetic membranes, a laser interferometry technique is used to measure their resonance frequency as a function of temperature [Bunch490]. A MPS3 flake, suspended over holes in a patterned Si/SiO2 chip, Fig. 2b, is placed inside a cryostat with optical access as shown in Fig. 2a. Both actuation and detection are done optically, by means of a power-modulated blue laser which opto-thermally excites the fundamental resonance, and a constant red laser which measures the change in the reflected signal resulting from the membrane’s motion [Siskins2020]. A typical resonance is shown in Fig. 2c, along with the damped harmonic oscillator model fit defining the resonance frequency. Figure 2d shows that in CoPS3 and exhibit a similar temperature dependence for , while opposite behaviour below the phase transition is visible, namely an increase of and a relative decrease of . This sudden change in for the perpendicular cavities, occurring near , constitutes, in accordance with the DFT calculations, the central result of this work as it shows that the magnetic ordering in MPS3 leads to anisotropic strain and thus spontaneous magnetostriction. We further note that strictly speaking, should be replaced by which includes the effects of strain (see Supplementary Note 2). For simplicity, we here use the notation for the measured transition temperatures.
The anisotropic behavior of CoPS3 in the AF state is even more evident in Fig. 2e, where for the different cavities of the star-shaped sample are plotted as a function of and temperature. The polar plot in Fig. 2f shows the data along the red dashed line at K in Fig. 2e and results in a characteristic dumbbell-shape. Similar anisotropic behaviour is observed in FePS3 as shown in Supplementary Note 4. On the contrary, for NiPS3 negligible anisotropy is observed in the angle-resolved magnetostriction data in Fig. 2g-i.
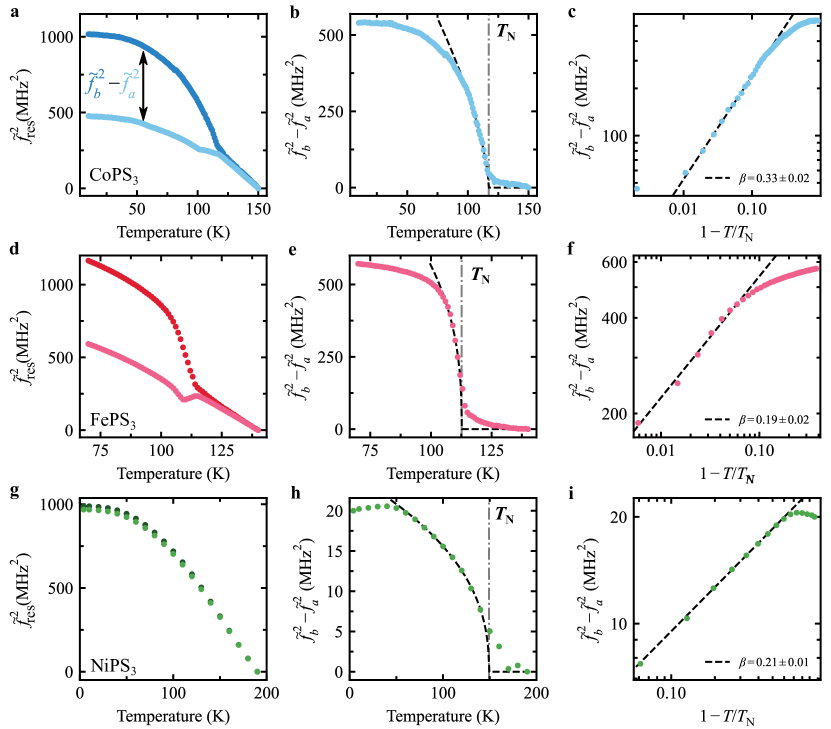
To obtain from the data, we first subtract the pretension contribution from the resonance frequency by calculating , for each angle, where K is the highest temperature in our measurements. The resulting values of along the crystalline axes and are shown in Fig. 3a,d,g for the three MPS3 compounds. With Eq. (3), we then calculate the difference which yields
| (4) |
We can now use Eq. (4) to access the critical behaviour of below by plotting as a function of temperature. As shown in Fig. 3b,e,h, the trend presents the typical critical behaviour with a non-zero order parameter appearing in the ordered state for . Figures 3c,f,i show the same critical curve as Fig. 3b,e,h respectively, plotted on a logarithmic scale against the reduced temperature . Note that the difference for NiPS3, is substantially smaller than that of the Fe/CoPS3 membranes indicative of a weaker anisotropic magnetostrictive behaviour.
The angle dependence of the resonance frequencies allows us to estimate the ratio between the magnetostriction parameters, , (see Supplementary Note 3). This ratio we directly compare to DFT calculations: Experimentally, we find for FePS3, while from the DFT calculations we estimate . For CoPS3 (taking [Gui2021] ), the experimental value is and the DFT one . We conclude that although both the sign and order of magnitude of the magnetostrictive anisotropy in these compounds are well reproduced in the current work, more detailed studies will be needed to obtain full quantitative correspondence with theory.
Thickness dependence of critical behaviour
As follows from Landau’s theory of phase transitions (see Supplementary Note 2), near is given by
| (5) |
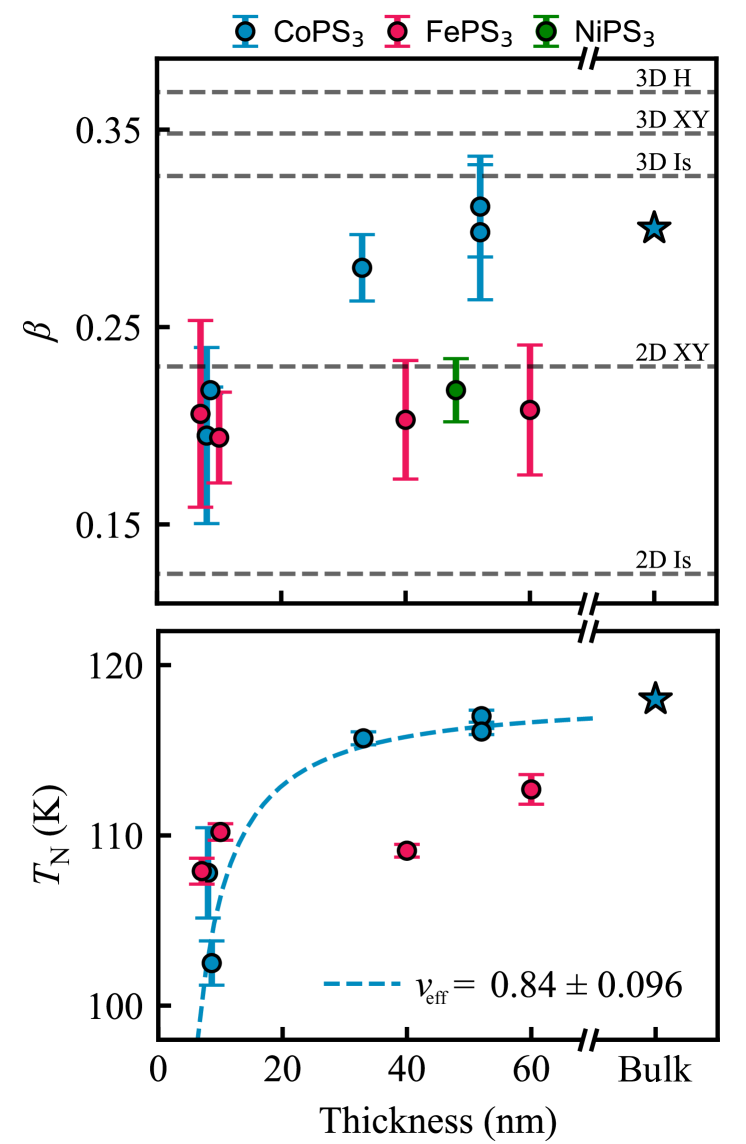
where and are constants and is a critical exponent representative of the magnetic order. We fit Eq. (5) to the data in Fig. 3b,e,h in the region close to (indicated by the black dashed line in Fig. 3b,e,h) to extract the critical exponent and for the three materials (see Supplementary Note 6 for more details on the fitting procedure). In the logarithmic plot of the critical curve the fitting of a straight line shows good agreement to the data points, consistent with the result of Eq. (5). The values for and are plotted in Fig. 4 as a function of thickness, , and listed in Supplementary Note 6, Table 49.
For the weakly anisotropic NiPS3, , comparable to the value () found in Ref. [Afanasiev2020], and consistent with the expected 2D XY magnetic dimensionality () of NiPS3 [Kim2019]. For FePS3 we find , comparable with literature values [yao2004mossbauer]. For both and no appreciable thickness dependence is observed, similar to what has previously been reported in Ref. [zhang_observation_2021], where changes in the critical behaviour mostly become visible in the monolayer limit.
For thicker CoPS3 samples ( nm) we find close to what is reported in literature for the bulk ( [Wildes2017]) and consistent with the 3D Ising model. For samples with nm the measured , on the other hand, is , closer to as shown in the top panel of Fig. 4. This constitutes a noticeable change in while going from bulk to thinner samples. Similarly, we observe for CoPS3 a decrease in from the bulk value of K down to K, similar to what was previously reported in Ref. [QiyeLiu2021]. We fit a power law to the dependence of on thickness,
| (6) |
where is a non-universal constant related to the interlayer coupling, and is an effective critical exponent related to the correlation length [Zhang2001]. Fitting the CoPS3 data points with K [QiyeLiu2021] yields nm and . This value of is intermediate between the expected values of for the 3D Ising and for the 2D Ising models, and indicative of a transition regime [Gibertini2019].
Conclusions
In conclusion, we provide a comprehensive analysis of the anisotropic magnetostriction effect in MPS3 compounds and its implications to the dynamics of membrane made from them. DFT calculations provide a microscopic explanation for the anisotropic lattice deformation in CoPS3, FePS3 and NiPS3 which are consistent with our measurements. We further demonstrate the relation between magnetic ordering and anisotropy in the mechanical resonance frequency of suspended MPS3 resonators, providing a direct measure of the AF order parameter in absence of an external magnetic field. We observe a thickness dependence in the critical behaviour of CoPS3 resonators [Wildes2017, QiyeLiu2021], which is absent in the case of FePS3. The presented technique is of particular interest for the study of 2D magnetism given the scarcity of methods available to investigate critical phenomena of van der Waals materials in the atomically thin limit.
Methods
Sample fabrication.
Substrates consist of thermal SiO2 of 285 nm thickness, grown on highly doped (Si++) silicon. The rectangular cavities are defined via e-beam lithography using AR-P 6200 resist. After development, the exposed SiO2 areas are fully etched via reactive ion etching. The AR-P 6200 resist is stripped in PRS-3000 and the sample is cleaned in an O2 plasma before stamping. The exfoliation and transfer of multi-layer MPS3 flakes is done using a polydimethylsiloxaan (PDMS) transfer method. First, MPS3 crystals are exfoliated onto the PDMS through scotch tape. Selected flakes are then transferred on the star-shaped cavities in the SiO2/Si substrate.
Laser interferometry. Samples are mounted on a heater stage which is cooled down to 4 K using a Montana Instruments Cryostation s50 cryostat with optical access. A blue diode laser ( nm) is used to excite the membrane optothermally via AC power-modulation from a vector network analyzer (VNA) [Steeneken_2021]. Displacements are detected by focusing a red He-Ne laser beam ( nm) on the cavity formed by the membrane and Si substrate. The reflected light, which is modulated by the position-dependent membrane motion, is recorded by a photodiode and processed by a phase-sensitive VNA. Laser spot size is m.
DFT calculations.
First principles spin-polarized DFT calculations in the plane wave formalism are preformed as implemented in the Quantum ESPRESSO package [QuanEssprGiannozzi2009]. The exchange-correlation energy is calculated using the generalized gradient approximation using the Perdew–Burke–Ernzerhof functional [Perdew1996] and standard Ultra-soft (USPP) solid-state pseudopotentials. The electronic wave functions are expanded with well-converged kinetic energy cut-offs for the wave functions (charge density) of (), () and () Ry for Fe, Co and Ni, respectively. The crystal structures are fully optimized using the Broyden-Fletcher-Goldfarb-Shanno (BFGS) algorithm [Head1985] until the forces on each atom are smaller than Ry/au and the energy difference between two consecutive relaxation steps is less than Ry. In order to avoid unphysical interactions between images along the non-periodic direction, we add a vacuum of 18 Å in the direction for the monolayer calculations. The Brillouin zone is sampled by a fine -centered -point Monkhorst–Pack [Monkhorst1976]. A tight-binding Hamiltonian derived from first-principles is constructed in the base of Maximally-localized Wannier functions, as implemented in the Wannier90 code [Mostofi2008]. For that, we select the d orbitals of the metal centre (Fe, Co, Ni) and the s and p orbitals of P and S to construct the connected subspace. Magnetic interactions are determined using the Green’s function method in the TB2J software [He2021]. The orbital resolved analysis is performed after rotating the coordinate system of the crystal to align the metal-sulfur bonds direction of the octahedra with the cartesian axes.
Crystal growth
Crystal growth of MPS3 (M(II) = Ni, Fe, Co) is performed following a solid-state reaction inside a sealed evacuated quartz tube (pressure mbar). I2 was used as a transport agent to obtain large crystals. A three-zone furnace is used, where a tube with the material was placed in the leftmost zone. This side is then heated up to ∘C in hours so that a temperature gradient of ∘C is established. The other two zones are heated up in hours from room temperature to ∘C and kept at that temperature for one day. The temperature is kept constant for days and cooled down naturally. With this process crystals with a length up to several centimeters are obtained. Detailed description of the crystal growth and characterization can be found in earlier work [Siskins2020].
Data availability
All data supporting the findings of this article and its Supplementary Information will be made available upon request to the authors.
Acknowledgments
M.Š., M.J.A.H., G.B., M.L., H.S.J.v.d.Z. and P.G.S. acknowledge funding from the European Union’s Horizon 2020 research and innovation program under grant agreement number 881603. Y.M.B and H.S.J.v.d.Z. acknowledge support from Dutch National Science Foundation (NWO). D.L.E., A.M.R., S.M.-V., C.B.-C., J.J.B., E.C. acknowledge funding from the European Union (ERC AdG Mol-2D 788222, ERC StG 2D-SMARTiES 101042680 and FET OPEN SINFONIA 964396), the Spanish MCIN (Project 2DHETEROS PID2020-117152RB-100 and Excellence Unit ”Maria de Maeztu”CEX2019-000919 -M), the Spanish MIU (FPU21/04195 to A.M.R.) and the Generalitat Valenciana (PROMETEO Program and APOST Grant CIAPOS/2021/215 to S.M.-V.) The computations were performed on the Tirant III cluster of the Servei d’Informàtica of the University of Valencia.
Author contributions
D.L.E., A.M.R. performed the DFT and orbital resolved tight-binding calculations, supervised by J.J.B. M.Š., M.J.A.H. and G.B. performed the laser interferometry measurements and fabricated and inspected the samples. M.L. and M.J.A.H. fabricated the substrates. S.M.-V., C.B.-C. and E.C. synthesized and characterized the FePS3, CoPS3 and NiPS3 crystals, supervised by E.c. M.Š., M.J.A.H. and G.B. analysed the experimental data. M.Š., M.J.A.H., Y.M.B., and P.G.S. modeled the experimental data. H.S.J.v.d.Z. and P.G.S. supervised the project. The paper was jointly written by all authors with a main contribution from M.J.A.H. All authors discussed the results and commented on the paper.
Competing interests
The authors declare no competing interests.