ESTIMATING THE REPERTOIRE SIZE IN BIRDS USING UNSUPERVISED CLUSTERING TECHNIQUES
Abstract
Birds produce multiple types of vocalizations that, together, constitute a vocal repertoire. For some species, the repertoire size is of importance because it informs us about their brain capacity, territory size or social behaviour. Estimating the repertoire size is challenging because it requires large amounts of data which can be difficult to obtain and analyse. From birds vocalizations recordings, songs are extracted and segmented as sequences of syllables before being clustered. Segmenting songs in such a way can be done either by simple enumeration, where one counts unique vocalization types until there are no new types detected, or by specific algorithms permitting reproducible studies. In this paper, we present a specific automatic method to compute a syllable distance measure that allows an unsupervised classification of bird song syllables. The results obtained from the segmenting of the bird songs are evaluated using the Silhouette metric score.
1 Introduction
According to [1] [1], bird vocalizations can be divided into five general categories: elements, syllables, phrases, calls and songs. These elements can be regarded as elementary sonic units in bird vocalizations. The syllables include one or more elements and are usually to a few hundred milliseconds in duration. The phrases are short groupings of syllables, while the calls are generally compact sequences of phrases. Songs, on the other hand, are long and complex vocalizations.

The song of the European Greenfinch (Chloris Chloris) is organized in a variation of elements which may go on for more than one minute. More precisely, the song of a male greenfinch has been characterized by having groups of tremolos, repetitions of tonal units, nasal chewlee and a buzzing nasal wheeze, which could be uttered on its own [2] and categorized into four phrases classes [3]:
-
1.
A trill
-
2.
A pure tone
-
3.
A nasal tone
-
4.
A nasal “tswee”
It is the “tswee” sound (a rough element, more specifically a vibrato) that characterizes the song of the greenfinch and which is an element repeated 10% of the time [4][5]. Some researchers consider the nasal “tswee” not to be learnt, but already being present in the bird’s genetic makeup. Most of the analysis found in [5] focuses on other elements and how they are combined (ex. the silent intervals between syllables in tours, length of tours, intervals between tours, size of the repertoire, the distance of syllables in tours among other acoustic characteristics).
Moreover, [3] [3] argues that the size of the repertoire can be determined by the number of phrases, where, most phrases of the greenfinch, or short group of syllables, are repeated after identical intervals, for a period, on the average, which lasts 0.5 seconds. Based on these observations, we propose to use Machine Learning techniques to design an unsupervised system able to estimate the size of the repertoire of the greenfinch. The proposed system receives as input a set of audio time series data downloaded from an online collaborative database111https://xeno-canto.org which is segmented and converted into a reduced representation set called a feature vector. Feature vector has the ability of discriminating among classes and is used to characterize the size of the bird song repertoire. The system is finally evaluated using clustering performance metrics to find the ideal number of syllables in the data set.
2 Related Work
Estimating the size of the repertoire can be quite challenging as it needs to perform syllable classification from audio recordings. While experts can manually annotate bird syllables using simple enumeration techniques (i.e. counting the number of types present in a sample of signal) [6], this becomes more challenging when the repertoire size is large, because counting all syllables requires large samples and a large investment of time and effort [7]. Previous studies used simple enumeration techniques, as well as curve-fitting [8], and capture–recapture analysis [9] to estimate the repertoire size. One of the bottle necks of these techniques is the segmentation of bird vocalisations into individual syllables. Simple segmentation in time domain proves difficult because of overlapping signals over different frequency bands. The common approach is to convert audio recordings into a spectrogram and apply image processing techniques to pick out the signal of interest [10].
Segmented audio signals of a specific bird species can be parameterized by a feature vector that can help discriminate between the syllables of a specific bird. Although single feature vector used for parametrization of bird song such as Mel-Frequency Cepstral Coefficients (MFCCs) [11], Linear Predictive Coefficients (LPC) [12], or wavelets [13] can provide good results for a small number of species [14]. It is noted that with the increase in the number of species, a single feature vector is not enough to be able to deal with the large diversity of sounds that different species can produce. In the same way, we assume that a similar observation can be made with the increase in the number of syllables in bird vocalization. Therefore, researchers have proposed different feature vectors in order to represent all the descriptive features [15][16].
The main drawback of this strategy is that it requires the computation of all candidate features during the classification stage to build the new feature space, which can be time-consuming. Therefore, selection of features is useful to select the most relevant original features as it just requires the computation of a reduced number of selected features during the classification stage [17]. Among the feature selection techniques, we were particularly interested in those based on individual ranking. These algorithms rank the candidate features with respect to a score which measures their relevance. In the unsupervised context, selection of features is usually done using Variance and Laplacian scores [18].
Furthermore, new estimation techniques based on automatic pattern recognition methods have been created to automate the detection of relevant structure in audio data [19][20]. These techniques are based on unsupervised learning methods, which do not require the data to be labeled. Thus, the literature reveals that researchers put great efforts into producing feature vectors to discriminate birdsong as well as new estimation techniques for pattern recognition in audio data. In this study, we propose an unsupervised method (Figure 2) to estimate the size of the repertoire with (1) a segmentation algorithm that extracts segments of bird audio from the recording (2) the extraction of combined vectors of descriptive features and Mel-Frequency Cepstral Coefficients, (3) the selection of features ranked with respect to a score which measures their relevance, (4) a clustering algorithm able to interpret the input data and find natural groups or clusters in the feature space.

3 Materials and methods
The estimation of the size of the repertoire starts with recording the vocalization of birds. This can rarely be done in isolation, especially when the recordings are made in a natural habitat. The recordings contain not only the sound of the intended target individual but also any combination of other individuals, such as noise from other animals including humans, environmental noise (e.g. wind, water, trees, man-made noise) and electronic noise in the recorder. Parts of the audio that contains bird songs need to be segmented from the background, as well as individual syllables need to be segmented from each other before they can be used as input for the clustering algorithm.
3.1 Pre-processing
In signal processing, wavelets have been widely investigated for use in filtering bio-electric signals, among many other applications. Bio-electric signals are good candidates for Multi-Resolution Analysis (MRA) [21] wavelet filtering over standard Fourier analysis, due to their non-stationary character. Filtering of signals using wavelets is based on the idea that as the Discrete Wavelet Transform (DWT) decomposes the signal into details and approximation parts, at some scale the details contain mostly the insignificant noise and can be removed or zeroed out using threshold without affecting the signal. This idea is discussed in more detail in the introductory paper of [22]. In this study, we propose to use a high pass filter with two basic filter design parameters:
-
1.
Wavelet type: Daubechies wavelet [23]
-
2.
Threshold: High part of the decomposition filter values in order to remove the background noise.
3.2 Segmentation
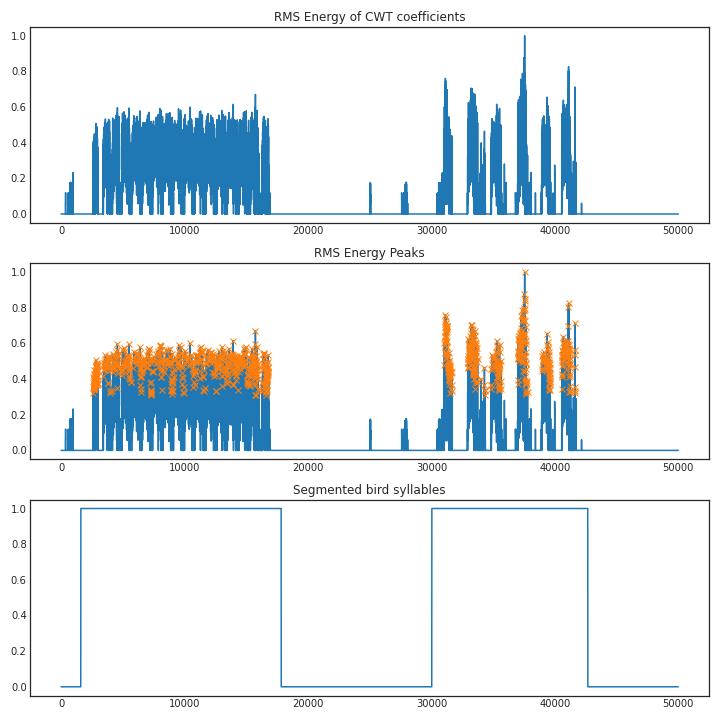
Segmentation typically refers to the process of partitioning a given document into multiple segments with the goal of simplifying the representation into something that is more meaningful and easier to analyze than the original document [24, Chapter 4.1.1]. In this study, Continuous Wavelet Transform (CWT) coefficients are calculated as inputs to the automatic segmentation algorithm as, unlike to the Fourier transform, the wavelet transform does not require to use a window function to avoid discontinuities, since wavelets are not continuous functions. Fourier Transform is used to extract frequencies from a signal as it uses a series of sine waves with different frequencies to analyze a signal. However, the main difficulty is to find the right window size. According to Heisenberg’s uncertainty principle: a narrow window will localize the signal in time but there will be significant uncertainty in frequency. If the window is wide enough, the time uncertainty increases. This is referred to as the tradeoff between time and frequency resolution. As mentioned above, one way to avoid this problem is to use MRA in order to analyze the signal at different resolution levels. In this study, we use the free library for the Python programming language 222https://pypi.org/project/PyWavelets to compute the CWT coefficients and calculate the energy envelope of each wavelet vector using Root Mean Square (RMS) energy function. That way, we isolate segments by finding high-energy peaks in the energy envelope and apply a threshold mask set to -20 dB (Figure 3).
3.3 Feature Extraction
Feature extraction is the process in which input data are converted into a reduced representation set called a feature vector. Feature vector has the ability of discrimination among classes. In this study, the features are computed on short-term frames and these frames are based on overlapped samples of audio signals [25, Chapter 6.1.2]. We transform the discrete signals into short-term frames of overlapped samples and then extract the audio features from these frames.
3.3.1 Descriptive features (DFs)
Spectral characteristics of different birds are varied and the signal model is not known. Since bird sounds are musical in nature, time and frequency-based features, called Descriptive Features, used in audio and music retrieval can be used for bird species recognition [16]. These features are extensively used and described by [26, Chapter 3] and [25, Chapter 6.2.2] for music and audio retrieval, and [14] and [27] for recognition of bird species. In this study, the following features are used.
-
1.
Energy (EN)
-
2.
Zero Crossing Rate (ZCR)
-
3.
Duration of the Syllable (DUR)
-
4.
Spectral Centroid (SC)
-
5.
Spectral Bandwidth (SB)
-
6.
Spectral Flux (SF)
-
7.
Spectral Roll Off (SR)
-
8.
Spectral Flatness (SF)
Except the duration (DUR), all the features are extracted on frame basis, and mean () and variance () of these features are computed over the entire syllable. This gives 14 features to which duration of the syllable is concatenated, thus yielding a feature vector of length 15.
3.3.2 Mel-Frequency Cepstral Coefficients (MFCCs)
Mel frequency cepstral coefficients (MFCCs) have their origin in speech processing but were also found to be suited to model timbre in music. The MFCC feature is calculated in the frequency domain, derived from the signal’s spectrogram [26, Chapter 3.2.1]. In this study, we use the MFCC FB-24 configuration proposed by Cambridge Hidden Markov Models (HMM) Toolkit known as HTK because of its wide use. The name HTK MFCC FB-24 denotes the number of filters recommended by Young for speech bandwidth [0, 8000] Hz. Owing to its widespread use, MFCC filter parameters are considered as the basis for the evaluation of other feature sets. For comparison, in this study we use 24 band filters, 13 cepstral coefficients for all feature extraction methods as well as a frequency range of [0 11025] Hz as we are dealing with bird songs which are higher in frequency than speech.
3.4 Classification
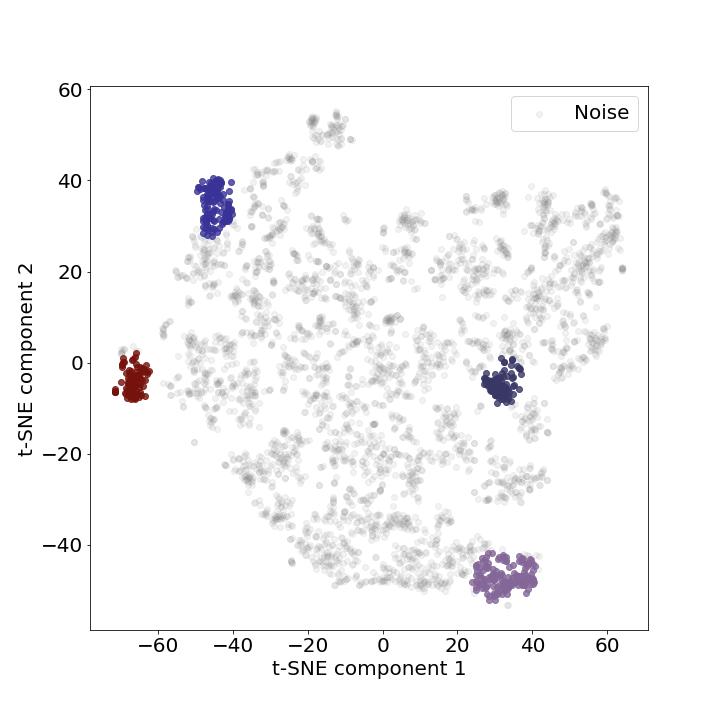
After features are extracted from augmented data, they are normalized using the max–min method, selected based on individual ranking, and fed into an unsupervised algorithm to automatically cluster bird syllables in the audio recordings. Because we are dealing with high-dimensional feature vector, we facilitate the classification process by applying a non-metric dimensionality reduction technique, namely the t-Distributed Stochastic Neighbor Embedding (t-SNE)[28], to project the data in two dimensions (Figure 4). Additionally, we group the samples rapidly and objectively using the DBSCAN algorithm [29]. This algorithm is useful to find core samples with high density and expand clusters from them. Moreover, one of the significant attributes of this algorithm is noise cancellation which is helpful to discard th noisy samples as well as the capacity to find the number of clusters while coping with unbalanced classes (Figure 5).

4 Dataset
The data set used to develop and validate the system is created using the Xeno-Canto database333https://xeno-canto.org/, a collaborative project dedicated to sharing bird sounds from all over the world. We use Xeno Canto’s web Application Programming Interface (API v2)444https://xeno-canto.org/explore/api to build the data set with data being organized according to the API documentation. Data can be used without restrictions with a rate limit of 10 requests per second and are accessible by sending query parameters (i.e. query and page) which return a JSON object containing details about the recordings found with the given query. In this study, we use an area-based query gathering European recordings of the greenfinch. We select only high quality recordings according to the Xeno-Canto quality ratings ranging from A (highest quality) to E (lowest quality)555https://xeno-canto.org/api/2/recordings?query=chloris+area:europe+q:a and remove recordings that have an other species referenced in the background. This allows us to build a data set with 339 audio recordings of an average duration of 48.64 seconds each. Audio recordings are accompanied with a detailed description of the fields of the object present in the recordings array. The following fields are kept for the study.
-
•
id: catalog number of the recording on xeno-canto
-
•
gen: generic name of the species
-
•
en: English name of the species
-
•
cnt: country where the recording was made
-
•
file-name: original file name of the audio file
-
•
type: the sound type of the recording (e.g. ’call’, ’song’, etc)
-
•
length: the length of the recording in minutes
5 Feature selection
Feature selection is a way of selecting the subset of the most relevant features from the original features set by removing the redundant, irrelevant, or noisy features. In this study, we compare two feature selection method: (1) Variance Threshold, and (2) Laplacian score, and evaluate them with the DBSCAN clustering algorithm. We select potential set of features by removing candidate features below the median score as it benefits from reduction in memory and computations, and can improve generalization and interpretability [30].
Selection of feature vectors are generated in four phases:
-
•
Calculation of the Descriptive Features and MFCCs
-
•
Normalization of the features values adjusted to the same dynamic range so that each feature has equal significance to the classification result
-
•
Ranking of candidate features with respect to a score which measures their relevance
-
•
Removing of candidate features below the median score to fasten the calculation
5.1 Variance Threshold
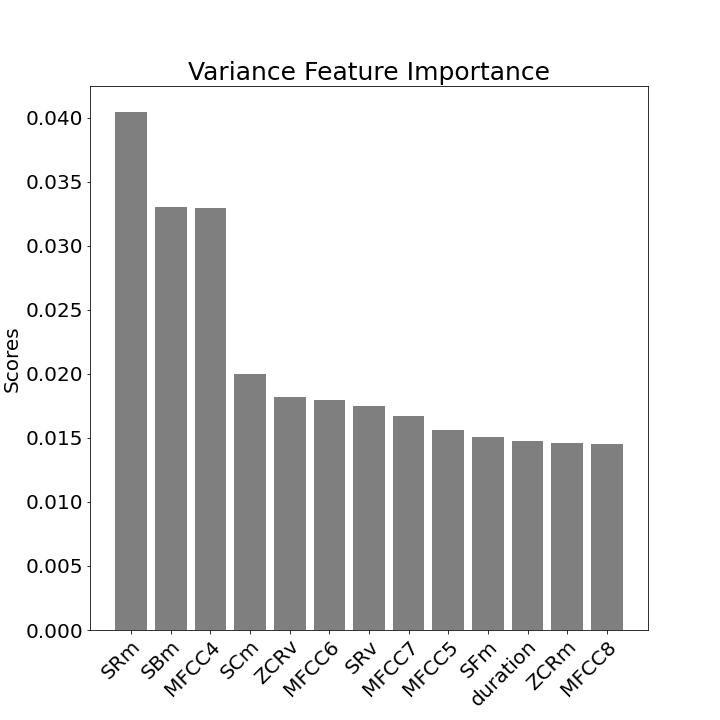
The Variance Threshold is a simple baseline approach to feature selection. It removes all features whose variance does not meet some threshold. By default, it removes all zero-variance features, i.e. features that have the same value in all samples. For each feature, , the Variance is computed as follows
| (1) |
The features with the highest values are ranked by order of importance in Figure 6.
5.2 Laplacian Score
The Laplacian score of a feature indicates its relevance to preserve locality. The Laplacian score is based on the observation that two instances that are close to each other generally belong to the same class. Laplacian score uses the nearest neighbor graph to obtain the local structure of the data and obtains the Laplacian score value of each feature according to the distance metric (euclidean).
For each feature, , the Laplacian score of the th feature is computed as follows
| (2) |
where the vector is
| (3) |
and and are defined in the spectral algorithm. Based on the assumption that the interesting
underlying structure of the data (e.g. clusters) depends on the slowly varying features in the data, [18] proposed to select the features with the smallest scores. The features are ranked by order of importance in Figure 7.

6 Results and discussion
After the selection of the feature vectors, we use the free software machine learning library for the Python programming language scikit-learn [31] to implement the unsupervised clustering techniques. We start by projecting the feature vectors in two dimensions using the t-SNE algorithm and save the following parameters as they represent the best visualization of the data.
-
•
perplexity = 45
-
•
n_iter = 1500
-
•
init = ’pca’
-
•
learning_rate = ’auto’
We then adjust the main parameters of the DBSCAN clustering algorithm (i.e. and ) using k-distance graph to find the optimal epsilon () distance between the samples, and Silhouette metric [32] to determine the minimum number of samples () needed to define the optimal number of clusters. Observations showed that there was never more than one big cluster. At most, there was one large cluster identified as noise and some small clusters identified as bird song syllables.
6.1 Evaluation
We evaluate the proposed system using the DBSCAN algorithm and the Silhouette metric score with euclidean distance calculation. Silhouette score always ranges between -1 to 1 with a high score suggesting that the objects are well matched to their own cluster and poorly matched to their neighborhood clusters. This is computed as follows.
| (4) |
Where:
-
= mean distance between a sample and all other points in the same class
-
= mean distance between a sample and all other points in the next nearest cluster
6.1.1 Euclidean distance method
The biggest challenge with the DBSCAN algorithm is to find the right parameters to model the algorithm. According to [29], the minimum number of samples in a neighborhood for a point to be considered as a core point should be greater than or equal to the dimensionality of the dataset multiply by 2. In this study, we start setting DBSCAN’s default value to 26 as our feature vector contains 13 dimensions.
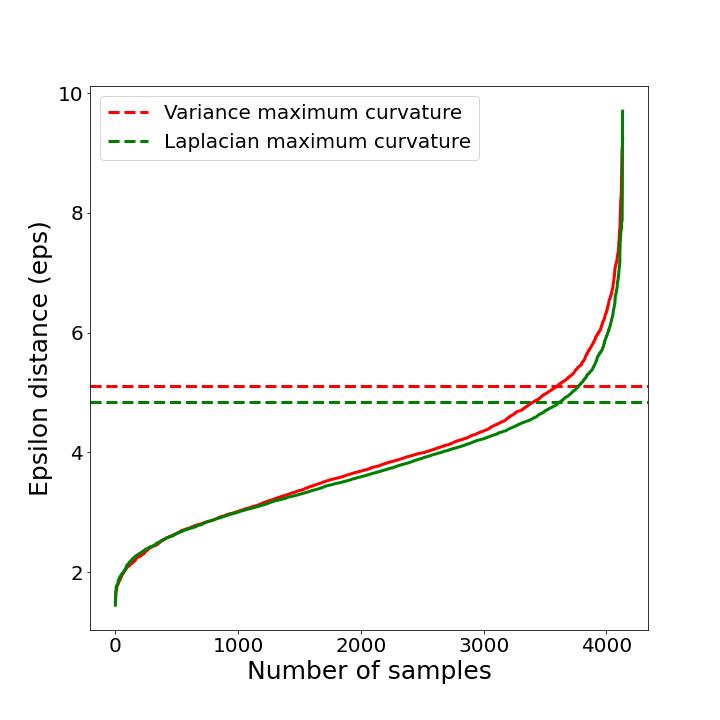
We then calculate the minimum euclidean distance among each data points and plot the result (Figure 8). The ideal value for is equal to the distance value at the ”knee” point, or the point of maximum curvature. This point represents the optimization point where diminishing returns are no longer worth the additional cost. This concept of diminishing returns applies here because while increasing the number of clusters will always improve the fit of the model, it also increases the risk that over fitting will occur. We compute the knee point of our function using the free library for the Python programming language 666https://pypi.org/project/kneed.
Finally, we set the DBSCAN algorithm with the optimal parameter through various ranges of minimum samples values (i.e. from 20 to 75). We find the right value according to the highest Silhouette score while comparing the two selected feature vectors. From Table 1, we can see that value should be set to 75 as it yields the number of clusters to the highest Silhouette score. Clustering performance evaluation isolate five clusters using Laplacian feature vector selection with four clusters of bird syllables (Figure 10) for a maximum Silhouette score of 0.88% and one cluster of outliers.

| Variance — Laplacian | ||
|---|---|---|
| min_sample | Clusters found | Silhouette scores |
| 20 | 1 — 4 | 0.105 — -0.177 |
| 25 | 4 — 4 | -0.093 — -0.165 |
| 30 | 4 — 11 | -0.086 — -0.043 |
| 35 | 10 — 15 | -0.055 — 0.131 |
| 40 | 14 — 24 | 0.270 — 0.269 |
| 45 | 21 — 25 | 0.288 — 0.336 |
| 50 | 26 — 27 | 0.403 — 0.491 |
| 55 | 22 — 20 | 0.549 — 0.541 |
| 60 | 19 — 14 | 0.605 — 0.679 |
| 65 | 12 — 11 | 0.671 — 0.734 |
| 70 | 10 — 4 | 0.696 — 0.870 |
| 75 | 8 — 4 | 0.781 — 0.878 |

7 Conclusions
As mentioned by [3] in [3], the size of the repertoire can be determined by the number of its phrases (short groupings of syllables). In this paper, we estimated the repertoire size of the greenfinch based on bird song data from different places in Europe. The method is based on (1) a segmentation algorithm that extracts segments of bird audio from the recording, (2) the extraction and (3) the selection of combined vectors of audio features. This study provided us with a repertoire size estimation distinguishing four clusters of syllables using unsupervised clustering techniques.
Most phrases of the greenfinch have been characterized into four classes by [3]:
-
1.
A trill
-
2.
A pure tone
-
3.
A nasal tone
-
4.
A nasal “tswee”
Based on the scores of the clustering performance evaluation of our system, we found a similar number of classes. This confirms [3]’s results despite the fact that his method is different from the one employed in this study.
The main benefits of the system are the visualization and the sonification of bird syllables clusters which turns out to be accurate for finding the presence of similar patterns in the data. Nevertheless, due to the strong presence of noisy samples detected by the DBSCAN algorithm in the data (3678 out of a total of 4133 samples), the proposed system can under or overestimate the repertoire size in birds. Consequently, this system is only useful for an experimental estimation of the repertoire size. Further improvements can focus on finding more robust techniques to denoise the audio recordings such as denoising auto-encoder neural networks as discussed in [33] or experimenting new feature extraction techniques such as those discussed in [19].
Furthermore, geographic variation between the greenfinches songs from Spain, France, Germany, Denmark, Britain and New Zealand have been found in [3]. Thus, new study can explore whether geographic variation is also observed in the data that has been selected, by focusing on the specific syllable clusters found by the unsupervised algorithm. However, selection of the data will have to be rethought in order to homogenize the number of recordings for each European country.
Data Accessibility
The audio recordings are accessible from the Xeno-Canto sound library (https://xeno-canto.org). Source codes (Python) are available at: https://github.com/joachimpoutaraud/estimating-repertoire-size-in-birds. A step by step instruction to run the study is provided in the notebooks of the repository.
References
- [1] John R Krebs and Donald E Kroodsma “Repertoires and geographical variation in bird song” In Advances in the Study of Behavior 11 Elsevier, 1980, pp. 143–177
- [2] S Cramp, CM Perrins and DJ Brooks “Vol. VIII: Crows to finches” Oxford [etc.]: Oxford University Press, 1994
- [3] Hans R. Güttinger “Variable and Constant Structures in Greenfinch Songs (Chloris chloris) in Different Locations” In Behaviour 60.3/4 Brill, 1977, pp. 304–318 URL: http://www.jstor.org/stable/4533805
- [4] KA. Shiovitz “The process of species-specific song recognition by the indigo bunting, Passerina cyanea, and its relationship to the organization of avian acoustical behavior” Behaviour, 1975, pp. 128–79 DOI: doi: 10.1163/156853975x00452
- [5] Hans R. Güttinger, Jochen Wolffgramm and Franz Thimm “The Relationship between Species Specific Song Programs and Individual Learning in Songbirds: A Study of Individual Variation in Songs of Canaries, Greenfinches, and Hybrids between the Two Species” In Behaviour 65.3/4 Brill, 1978, pp. 241–262 URL: http://www.jstor.org/stable/4533896
- [6] Miguel A. Acevedo et al. “Automated classification of bird and amphibian calls using machine learning: A comparison of methods” In Ecol. Informatics 4, 2009, pp. 206–214
- [7] Donald E. Kroodsma “Correlates of Song Organization Among North American Wrens” In The American Naturalist 111.981 [University of Chicago Press, American Society of Naturalists], 1977, pp. 995–1008 URL: http://www.jstor.org/stable/2460394
- [8] Joyce L Wildenthal “Structure in primary song of the mockingbird (Mimus polyglottos)” In The Auk JSTOR, 1965, pp. 161–189
- [9] Clive K Catchpole and Peter JB Slater “Bird song: biological themes and variations” Cambridge university press, 2003
- [10] Hendrik Vincent Koops, Jan van Balen and Frans Wiering “Automatic segmentation and deep learning of bird sounds” In International Conference of the Cross-Language Evaluation Forum for European Languages, 2015, pp. 261–267 Springer
- [11] Naomi Harte, Sadhbh Murphy, David J Kelly and Nicola M Marples “Identifying new bird species from differences in birdsong.” In INTERSPEECH, 2013, pp. 2900–2904
- [12] Wei Chu and Daniel T Blumstein “Noise robust bird song detection using syllable pattern-based hidden Markov models” In 2011 IEEE International Conference on Acoustics, Speech and Signal Processing (ICASSP), 2011, pp. 345–348 IEEE
- [13] T TanttuJuha “Wavelets in recognition of bird sounds” In EURASIP Journal on Advances in Signal Processing Hindawi Limited PUB1800 London, UK, United Kingdom, 2007
- [14] Panu Somervuo, Aki Harma and Seppo Fagerlund “Parametric representations of bird sounds for automatic species recognition” In IEEE Transactions on Audio, Speech, and Language Processing 14.6 IEEE, 2006, pp. 2252–2263
- [15] Sai-hua Zhang et al. “Automatic bird vocalization identification based on fusion of spectral pattern and texture features” In 2018 IEEE International Conference on acoustics, Speech and signal processing (ICASSP), 2018, pp. 271–275 IEEE
- [16] Arti V Bang and Priti P Rege “Evaluation of various feature sets and feature selection towards automatic recognition of bird species” In International Journal of Computer Applications in Technology 56.3 Inderscience Publishers (IEL), 2017, pp. 172–184
- [17] Mariam Kalakech, Alice Porebski, Nicolas Vandenbroucke and Denis Hamad “Unsupervised local binary pattern histogram selection scores for color texture classification” In Journal of Imaging 4.10 Multidisciplinary Digital Publishing Institute, 2018, pp. 112
- [18] Xiaofei He, Deng Cai and Partha Niyogi “Laplacian score for feature selection” In Advances in neural information processing systems 18, 2005
- [19] Juan Sebastian Ulloa et al. “Estimating animal acoustic diversity in tropical environments using unsupervised multiresolution analysis” In Ecological Indicators 90 Elsevier, 2018, pp. 346–355
- [20] Louis Ranjard and Howard A Ross “Unsupervised bird song syllable classification using evolving neural networks” In The Journal of the Acoustical Society of America 123.6 Acoustical Society of America, 2008, pp. 4358–4368
- [21] Stephane G Mallat “A theory for multiresolution signal decomposition: the wavelet representation” In IEEE transactions on pattern analysis and machine intelligence 11.7 Ieee, 1989, pp. 674–693
- [22] Amara Graps “An introduction to wavelets” In IEEE computational science and engineering 2.2 IEEE, 1995, pp. 50–61
- [23] J Zhu “Image compression using wavelets and JPEG2000: a tutorial” In Electronics & Communication Engineering Journal 14.3 IET, 2002, pp. 112–121
- [24] Meinard Müller “Fundamentals of music processing: Audio, analysis, algorithms, applications” Springer, 2015
- [25] Björn W Schuller “Intelligent audio analysis” Springer, 2013
- [26] Peter Knees and Markus Schedl “Music similarity and retrieval: an introduction to audio-and web-based strategies” Springer, 2016
- [27] Seppo Fagerlund “Bird species recognition using support vector machines” In EURASIP Journal on Advances in Signal Processing 2007 Springer, 2007, pp. 1–8
- [28] Laurens Van der Maaten and Geoffrey Hinton “Visualizing data using t-SNE.” In Journal of machine learning research 9.11, 2008
- [29] Martin Ester, Hans-Peter Kriegel, Jörg Sander and Xiaowei Xu “A density-based algorithm for discovering clusters in large spatial databases with noise.” In kdd 96.34, 1996, pp. 226–231
- [30] Ofir Lindenbaum et al. “Differentiable unsupervised feature selection based on a gated laplacian” In Advances in Neural Information Processing Systems 34, 2021
- [31] Fabian Pedregosa et al. “Scikit-learn: Machine learning in Python” In the Journal of machine Learning research 12 JMLR. org, 2011, pp. 2825–2830
- [32] Peter J Rousseeuw “Silhouettes: a graphical aid to the interpretation and validation of cluster analysis” In Journal of computational and applied mathematics 20 Elsevier, 1987, pp. 53–65
- [33] Dan Stowell and Richard E Turner “Denoising without access to clean data using a partitioned autoencoder” In arXiv preprint arXiv:1509.05982, 2015