Visualization of Photonic Band Structures via Far-field Measurements in SiNx Photonic Crystal Slabs
Abstract
The band structures of the photonic crystal slabs play a significant role in manipulating the flow of light and predicting exotic physics in photonics. In this letter, we show that the key features of photonic band structures can be achieved experimentally by the polarization- and momentum-resolved photoluminescence spectroscopy utilizing the light emission properties of SiNx. The two-dimensional spectra clearly reveal the energy-momentum dispersion of band structures which is in perfect agreement with the simulation results. The isofrequency contours can be measured easily by adding a bandpass filter with a desired photon energy. Furthermore, it is convenient to observe clearly and directly the optical singularity - the optical bound states in the continuum featured by dark point in three-dimensional photoluminescence spectra. The polarization-resolved isofrequency contours clearly show that this dark point is the center of an azimuthally polarized vortex. Finally, the helical topological edge states can be easily observed in photonic topological insulators with deformed hexagonal lattices. Our work provides a simple and effective approach for exploring topological photonics and other intriguing phenomena hidden in the photonic crystal slabs.
The photonic crystals offer the huge opportunities to manipulate the flow of lightJoannopoulos, Villeneuve, and Fan (1997); Joannopoulos et al. (2011). As a class of photonic crystals, the photonic crystal (PhC) slabs can be fabricated easily by the state-of-the-art semiconductor nanofabrication process and promotes significantly the rapid developments of the fundamental research and device application in photonics, especially topological photonicsLu, Joannopoulos, and Soljačić (2014); Ozawa et al. (2019). The numerous intriguing physical phenomena hidden in photonic crystals and advanced multi-functional photonic devices are revealed experimentally and predicted theoretically such as the unidirectional transport of light robust against scattering losses and arbitrarily large disorderWang et al. (2009); Poo et al. (2011), supercollimationRakich et al. (2006), bound states in the continuum (BICs)Marinica, Borisov, and Shabanov (2008); Plotnik et al. (2011); Hsu et al. (2013, 2016), large-area surface-emitting lasersMatsubara et al. (2008); Hirose et al. (2014); Yang et al. (2022), non-Hermitian physicsZhen et al. (2015); Zhou et al. (2018), the photonic analogues of the quantum (anomalous) Hall effectRaghu and Haldane (2008); Wang et al. (2009). All above-mentioned phenomena result from the special band structures of the photonic crystals. For instance, the supercollimation relies on the flatness isofrequency contours; the BICs singularity point and surface-emitting lasers are significantly related to the strongly confined electric fields and zero group velocities of electromagnetic waves.
The widely used technique to investigate the band structures of the photonic crystal slabs is the white light reflection/transmission spectra through the analysis of Fano features exhibited in spectraFan and Joannopoulos (2002); Zhang et al. (2018). The isofrequency contours can be also obtained by passive reflection or transmission modes based on 4f momentum space imaging systemZhang et al. (2018, 2021). Meanwhile, the technique of photon scattering was developed to directly observe the isofrequency contoursShi et al. (2010); Regan et al. (2016). The advantage of these techniques is that all of them are suitable for the most photonic crystals. As a complementary technology, the momentum-resolved photoluminescence (PL) spectroscopy can be explored to access the photonic band structures via the far-field measurements of the excitonic emissionHuang et al. (2019) or enhanced fluorescenceZhen et al. (2013); Seo et al. (2020) due to cavity-enhanced light emission. That the PL peak at a certain k point directly reveals a photonic state in the band structures is the superiority of far-field measurements although this technique relies on the light emission properties of the photonic crystals or the extra emitters.
The SiNx thin films, as the ideal optical materials with enough index contrast (optical index n2.2), are extensively explored to fabricate the various photonic crystals Lee et al. (2012); Hsu et al. (2013); Zhen et al. (2015); Zhou et al. (2018); Liu et al. (2019, 2020) through the mature nanofabrication technology in semiconductor industry. It is worth noticing that the SiNx exhibits the light emission properties with relatively larger bandwidths of more than 400 nm (See Fig.S1 in Supplementary Materials) induced by the quantum-size effects of Si nanoparticlesWang et al. (2003), SiNx matrixKistner et al. (2011) or defect-related statesWang et al. (2007) during fabrication.
Here, fully utilizing the light emission properties of the SiNx materialsDal Negro et al. (2006); Wang et al. (2007); Kistner et al. (2011); Amosov et al. (2022), we investigate experimentally the photonic band structures in the two-dimensional free-standing SiNx PhC slabs by the polarization- and momentum-resolved photoluminescence spectroscopy based on the 4f optical system. The detailed photonic band structures of PhC slabs can be visualized and achieved : 1) energy-momentum dispersion with the accurate energy level of photonic states at any direction in momentum space; 2) isofrequency contours at any energy level without changing the optical setup; 3) the degree of confinement and the distribution of the confined electromagnetic modes in photonic crystal slab through the analysis of PL intensities; 4) polarization of photonic states. More important, except for the fundamental information of photonic band structures, it is also convenient to directly observe the fascinating phenomena of PhC slabs, for instance, the optical bound states in the continuum (BICs) featured by dark point in dispersion relation curves and polarization vortex in isofrequency contours; the helical topological edge states in the photonic topological insulator. Our work provides a simple and effective approach for exploring the intriguing physical phenomena hidden in the photonic crystal slabs.
To evaluate the abilities of this advanced method, we select firstly the SiNx membrane to fabricate the two-dimensional photonic crystal. Figure 1(a) presents the schematic of the designed photonic crystal slab and its first Brillouin zone with high symmetry points. This PhC slab consists of a square lattice of cylindrical air holes with a radius of 180 nm and a period of 490 nm. Except for the general photonic states, the optical singularity, so-called the symmetry-protected BICs (-BICs), will be created because the mirror symmetry of PhC slab in out-of-plane direction was maintained naturally due to the key feature of a suspending SiNx membrane, which also can reduce the extra radiation channelsJoannopoulos et al. (2011); Liu et al. (2019) and allows us to classify the modes of transverse electric (TE)-like and transverse magnetic (TM)-like clearly. Figure 1(b) presents the schematic of our home-made 4f optical system, which is based on the optical Fourier transformation method achieved through the optical lenses to obtain the momentum-space information of photonic states of band structures Wagner et al. (2012); Zhang et al. (2021)(See Optical Characterization in Supplementary Materials).
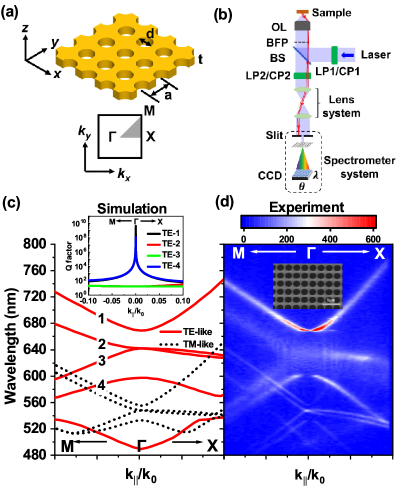
We first calculate the band structures of the designed PhC slab. Figure 1(c) presents the simulated TE-like (red solid line) and TM-like (black dash line) photonic bands along the X and M directions. For the sake of simplicity, the physical properties of the four TE-modes as labelled in Figure 1(c) will be focused on emphatically in the following main text. It is deserved to note that the TE-1 and TE-4 photonic bands exhibit the parabolic profiles with extreme points of photonic energies located at -points with the corresponding wavelengths 670 nm and 590 nm, respectively, in which the group velocities of electromagnetic waves for TE-1 and TE-4 modes are equal to zero through the equation . It is expected that the electromagnetic waves for TE-1 and TE-4 modes are completely confined in the PhC slab at -points, which will result in the high quality factor when this PhC slab acts as an optical cavity. The calculated quality factors of four labeled TE bands are shown in the inset of Figure 1(c). Both the TE-1 and TE-4 bands possess the extremely high quality factors at -points which are the unique signature of BICsZhen et al. (2014). Meanwhile, the quality factors are almost flat and lower in the whole k space for the TE-2 and TE-3 bands. Figure 1(d) presents the experimental results of photonic dispersion along the X and M directions by performing the measurements of the momentum-resolved photoluminescence spectroscopy on a fabricated PhC slab as shown in the inset of Figure 1(d) (see Methods for details of PhC slab fabrication in Supplementary Material). It is clear that the measured photonic dispersion is consistent with the simulation results very well. The whole TE- and TM-modes can be obtained from this two-dimensional PL spectra with a very clean background and without any data post-processing.
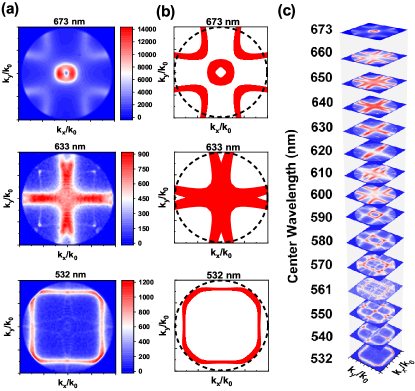
Another more comprehensive understanding of the optical properties of a PhC slab lies in its isofrequency contours which need to be achieved experimentally. Concerning to our approach, only fully opening the slit and setting the grating as a mirror (zero position), the isofrequency contours can be directly imaged through the insertion of a set of bandpass filters on the detection path. The simulated and experimental results of 532 nm, 633 nm (both bandwidths 4 nm), and 673 nm (bandwidth 10 nm) are presented in Figure 2(a) and (b), respectively. Again, it is obvious the consistency of both results is quite good. By replacing the bandpass filter, we can easily obtain the isofrequency contour at a desired photonic energy as shown in Figure 2(c).
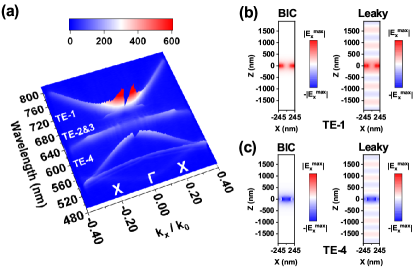
It is worth noting that our experimental data include the information of PL intensities as presented in Figure 1(d). Generally speaking, the presented experimental method belongs to the far-field measurements of leaky modes in photonic crystal slabs. Therefore, the information of PL intensities can reveal how much extent the electromagnetic modes are confined and where the electromagnetic energy is concentrated in photonic crystal slabs. We will elaborate the advantages of our experimental approach through the analysis of PL intensities in photonic dispersion along X, which can be directly visualized by plotting the experimental data as the 3D colormaps shown in Figure 3(a). Both TE-1 and TE-4 bands exhibit the minima of PL intensities (denoted as dark points ) at the point corresponding to the wavelength of 670 nm and 590 nm, respectively, in photonic dispersion along X. The dark points also can be observed in photonic dispersion along M (data not shown here). The dark points are the distinguished feature of the symmetry-protected BICs with extremely high quality factors as shown in the inset of Figure 1(c). Side views of simulated electric field profiles confirm that the BIC mode is completely confined in the photonic crystal slab compared to the off- leaky mode as shown in Figure 3(b, c). For TE-2 and TE-3 bands, there are no dark points in photonic dispersions due to the lower quality factors. Furthermore, it is noticed that the PL intensities around the point in TE-1 band are higher than that in TE-4 band although the quality factors at point are the same for those two bands. From Figure 3(b, c), we can see that the energy of electromagnetic modes, which can be represented by the magnitude of the electric field, is concentrated in SiNx slab (high- regions) and air hole (low- regions) for TE-1 and TE-4 bands, respectively. In our experiment, the SiNx slab also plays a role as the light emitter. Therefore, the stronger light-matter interaction in SiNx slab will result in the enhancement of PL intensities in TE-1 band compared to that in TE-4 band via Purcell effectPurcell (1946). This well-known feature that where the energy of electromagnetic modes is concentrated in low- or high- regionsJoannopoulos et al. (2011) can not be addressed by the traditional reflection measurements.
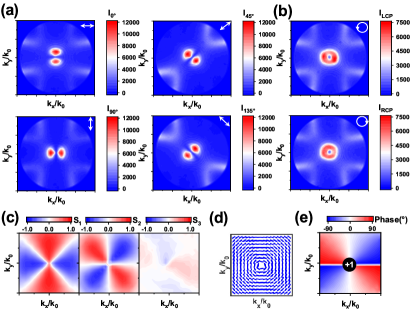
Now, we turn to characterize the optical properties of photonic states around BICs in the TE-1 band via this method. As an optical singularity, BICs is a vortex center characterized by the value of topological charge and polarization distribution of photonic states around BICsZhen et al. (2014), which can be extracted through the measurements of polarization-resolved isofrequency contours and the analysis of the Stokes phase distribution, benefiting from the very closed wavelength of BICs and the center wavelength of the filter. It is noted that the isofrequency contour labeled as 673 nm in Figure 2(a) exhibits a donut shape with a dark zone at the center, which is the typical signature of a vortex beam. Figure 4(a) and (b) present the polarization-resolved isofrequency contours. With linearly polarized detection, two lobes are observed as shown in Figure 4(a). With rotating the polarizer, the connection direction of the two lobes is still perpendicular to the polarization direction of the linear polarizer. For circularly polarized detection, the isofrequency contours in Figure 4(b) still exhibit a donut shape as a result of a coherent superposition of two orthogonally linear polarization. Those experimental observations demonstrate that BICs are the center of the azimuthal polarization vortexZhan (2009); Iwahashi et al. (2011); Shen et al. (2019) and the photonic states around BICs are linearly polarized. Next, we determine quantitatively the value of topological charge q defined as following:
| (1) |
where is a closed loop around the BICs in the counterclockwise direction, is the Stokes phase expressed as:
| (2) |
The Stokes parameters , and can be obtained through the measurements of six polarization components (, , , , , ) Gbur (2016). In general, the Stokes parameters and can fully describe the linear polarization characteristics of the measured photonic states. Figure 4(c) shows the two-dimensional (2D) maps of , and in momentum space around BICs ( point). Again, it is clear that the photonic states around BICs are almost linearly polarized as shown in Figure 4(d). At the point of , the polarization of photonic states cannot be defined. Now we calculate the Stokes phases in momentum space with the Stokes parameters and via Eq. (2). Figure 4(e) presents the 2D map of Stokes phases in momentum space. It is clear that the change of Stokes phase is 2 around BICs in the counterclockwise direction. Therefore, combined with the observations of the two spiral arms in equal-thickness interference and the bifurcation pattern in equal-inclination interference (See Figure S2 in Supplementary Material), the topological charge of = +1 can be deduced through Eq. (1), which is consistent with the former reportsWang et al. (2020); Mohamed et al. (2022); Salerno et al. (2022). Those results demonstrate that the experimental approach presented here can be employed to conveniently and effectively characterize not only the common features such as energy-momentum dispersion but also the optical singularity in photonic crystal slab, for instance, BICs, through the measurements of far-field radiationZhen et al. (2014); Wang et al. (2020).
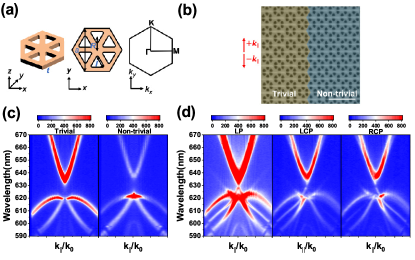
Finally, we apply this method to explore the helical topological edge states in photonic topological insulators which is the key feature in topological physics. Figure 5(a) shows the schematic of the unit cell of graphene-like topological photonic crystals with a hexagonal lattice of etched triangular air holes and its Brillouin zone. The thickness and lattice period of the PhC are =100 nm and =496 nm, respectively. All triangular air holes have a side length of =150 nm and a fillet of 25 nm. is the distance from the center of the triangular air hole to the center of the unit cell. When or , the lattice is called the trivial lattice or non-trivial latticeJi et al. (2022), respectively. Figure 5(b) presents the SEM image of the photonic topological insulator composed of trivial (=148 nm) and non-trivial (=175.5 nm) lattice regions connected by a zigzag domain wall, which results in the helical topological edge states. The energy-momentum dispersions are measured in trivial and non-trivial lattice regions along the - directions as presented in Figure 5(c), respectively. There exists the noticeable photonic band gaps between 620nm and 630nm in both lattice regions. When the detection position is put on the zigzag domain wall, the helical topological edge states, which connect the upper and lower branches of photonic bands with almost linear dispersion, can be conspicuously distinguished within the photonic band gap as shown in Figure 5(d).
In summary, we present a convenient and effective experimental method to investigate the photonic band structures in dielectric SiNx photonic crystal slabs combined with the well-known polarization- and momentum-resolved photoluminescence spectroscopy. The detailed photonic band structures such as energy-momentum dispersion, isofrequency contours, etc., can be fully accessed with a very clean background. Except for the general information of photonic band structures, the optical singularity-BICs and the helical topological edge states can be distinguished conveniently and clearly. We believe that this method can be easily exploited by other researchers in the community of photonics, especially topological photonics, and will boost significantly topological photonics.
See the supplementary material for the details of the numerical simulation, sample fabrication, optical characterization, and extended data for the photoluminescence spectra of SiNx membrane and interference measurement of vortex beam.
Acknowledgements.
This work was supported by the National Key Research and Development Program of China under Grant No. 2021YFA1400700, the Strategic Priority Research Program of Chinese Academy of Sciences (CAS) under Grant Nos. XDB28000000 and XDB33000000, the National Natural Science Foundation of China under Grant Nos. 11974386, 11904019, 12074033, the Beijing Municipal Science & Technology Commission, Administrative Commission of Zhongguancun Science Park under Grant No. Z211100004821009, the Key Research Program of Frontier Sciences of CAS under Grant Nos. QYZDJ-SSWSLH042.Author Declarations
Conflict of Interest
The authors have no conflicts to disclose.
Data Availability
The data that support the findings of this study are available from the corresponding author upon reasonable request.
References
- Joannopoulos, Villeneuve, and Fan (1997) J. D. Joannopoulos, P. R. Villeneuve, and S. Fan, “Photonic crystals: putting a new twist on light,” Nature 386, 143–149 (1997).
- Joannopoulos et al. (2011) J. D. Joannopoulos, S. G. Johnson, J. N. Winn, and R. D. Meade, Photonic Crystals: Molding the Flow of Light (Princeton University Press, 2011).
- Lu, Joannopoulos, and Soljačić (2014) L. Lu, J. D. Joannopoulos, and M. Soljačić, “Topological photonics,” Nature Photonics 8, 821–829 (2014).
- Ozawa et al. (2019) T. Ozawa, H. M. Price, A. Amo, N. Goldman, M. Hafezi, L. Lu, M. C. Rechtsman, D. Schuster, J. Simon, O. Zilberberg, and I. Carusotto, “Topological photonics,” Reviews of Modern Physics 91, 015006 (2019).
- Wang et al. (2009) Z. Wang, Y. Chong, J. D. Joannopoulos, and M. Soljačić, “Observation of unidirectional backscattering-immune topological electromagnetic states,” Nature 461, 772–775 (2009).
- Poo et al. (2011) Y. Poo, R.-x. Wu, Z. Lin, Y. Yang, and C. T. Chan, “Experimental realization of self-guiding unidirectional electromagnetic edge states,” Physical Review Letters 106, 093903 (2011).
- Rakich et al. (2006) P. T. Rakich, M. S. Dahlem, S. Tandon, M. Ibanescu, M. Soljačić, G. S. Petrich, J. D. Joannopoulos, L. A. Kolodziejski, and E. P. Ippen, “Achieving centimetre-scale supercollimation in a large-area two-dimensional photonic crystal,” Nature Materials 5, 93–96 (2006).
- Marinica, Borisov, and Shabanov (2008) D. Marinica, A. Borisov, and S. Shabanov, “Bound States in the Continuum in Photonics,” Physical Review Letters 100, 183902 (2008).
- Plotnik et al. (2011) Y. Plotnik, O. Peleg, F. Dreisow, M. Heinrich, S. Nolte, A. Szameit, and M. Segev, “Experimental Observation of Optical Bound States in the Continuum,” Physical Review Letters 107, 183901 (2011).
- Hsu et al. (2013) C. W. Hsu, B. Zhen, J. Lee, S.-L. Chua, S. G. Johnson, J. D. Joannopoulos, and M. Soljačić, “Observation of trapped light within the radiation continuum,” Nature 499, 188–191 (2013).
- Hsu et al. (2016) C. W. Hsu, B. Zhen, A. D. Stone, J. D. Joannopoulos, and M. Soljačić, “Bound states in the continuum,” Nature Reviews Materials 1, 1–13 (2016).
- Matsubara et al. (2008) H. Matsubara, S. Yoshimoto, H. Saito, Y. Jianglin, Y. Tanaka, and S. Noda, “GaN photonic-crystal surface-emitting laser at blue-violet wavelengths,” Science 319, 445–447 (2008).
- Hirose et al. (2014) K. Hirose, Y. Liang, Y. Kurosaka, A. Watanabe, T. Sugiyama, and S. Noda, “Watt-class high-power, high-beam-quality photonic-crystal lasers,” Nature Photonics 8, 406–411 (2014).
- Yang et al. (2022) L. Yang, G. Li, X. Gao, and L. Lu, “Topological-cavity surface-emitting laser,” Nature Photonics 16, 279–283 (2022).
- Zhen et al. (2015) B. Zhen, C. W. Hsu, Y. Igarashi, L. Lu, I. Kaminer, A. Pick, S.-L. Chua, J. D. Joannopoulos, and M. Soljačić, “Spawning rings of exceptional points out of dirac cones,” Nature 525, 354–358 (2015).
- Zhou et al. (2018) H. Zhou, C. Peng, Y. Yoon, C. W. Hsu, K. A. Nelson, L. Fu, J. D. Joannopoulos, M. Soljačić, and B. Zhen, “Observation of bulk fermi arc and polarization half charge from paired exceptional points,” Science 359, 1009–1012 (2018).
- Raghu and Haldane (2008) S. Raghu and F. D. M. Haldane, “Analogs of quantum-hall-effect edge states in photonic crystals,” Physical Review A 78, 033834 (2008).
- Fan and Joannopoulos (2002) S. Fan and J. D. Joannopoulos, “Analysis of guided resonances in photonic crystal slabs,” Physical Review B 65, 235112 (2002).
- Zhang et al. (2018) Y. Zhang, A. Chen, W. Liu, C. W. Hsu, B. Wang, F. Guan, X. Liu, L. Shi, L. Lu, and J. Zi, “Observation of Polarization Vortices in Momentum Space,” Physical Review Letters 120, 186103 (2018).
- Zhang et al. (2021) Y. Zhang, M. Zhao, J. Wang, W. Liu, B. Wang, S. Hu, G. Lu, A. Chen, J. Cui, W. Zhang, C. W. Hsu, X. Liu, L. Shi, H. Yin, and J. Zi, “Momentum-space imaging spectroscopy for the study of nanophotonic materials,” Science Bulletin 66, 824–838 (2021).
- Shi et al. (2010) L. Shi, H. Yin, X. Zhu, X. Liu, and J. Zi, “Direct observation of iso-frequency contour of surface modes in defective photonic crystals in real space,” Applied Physics Letters 97, 251111 (2010).
- Regan et al. (2016) E. C. Regan, Y. Igarashi, B. Zhen, I. Kaminer, C. W. Hsu, Y. Shen, J. D. Joannopoulos, and M. Soljačić, “Direct imaging of isofrequency contours in photonic structures,” Science Advances 2, e1601591 (2016).
- Huang et al. (2019) W. Huang, C. De-Eknamkul, X. Zhang, E. Leewong, M.-Q. Zhao, A. C. Johnson, and E. Cubukcu, “Monolayer Excitonic Emission for Imaging Spatial Dispersion of Photonic Crystals,” ACS Photonics 6, 2312–2319 (2019).
- Zhen et al. (2013) B. Zhen, S.-L. Chua, J. Lee, A. W. Rodriguez, X. Liang, S. G. Johnson, J. D. Joannopoulos, M. Soljačić, and O. Shapira, “Enabling enhanced emission and low-threshold lasing of organic molecules using special Fano resonances of macroscopic photonic crystals,” Proceedings of the National Academy of Sciences 110, 13711–13716 (2013).
- Seo et al. (2020) I. C. Seo, S. Kim, B. H. Woo, I.-S. Chung, and Y. C. Jun, “Fourier-plane investigation of plasmonic bound states in the continuum and molecular emission coupling,” Nanophotonics 9, 4565–4577 (2020).
- Lee et al. (2012) J. Lee, B. Zhen, S.-L. Chua, W. Qiu, J. D. Joannopoulos, M. Soljačić, and O. Shapira, “Observation and Differentiation of Unique High-Q Optical Resonances Near Zero Wave Vector in Macroscopic Photonic Crystal Slabs,” Physical Review Letters 109, 067401 (2012).
- Liu et al. (2019) W. Liu, B. Wang, Y. Zhang, J. Wang, M. Zhao, F. Guan, X. Liu, L. Shi, and J. Zi, “Circularly Polarized States Spawning from Bound States in the Continuum,” Physical Review Letters 123, 116104 (2019).
- Liu et al. (2020) W. Liu, M. Hwang, Z. Ji, Y. Wang, G. Modi, and R. Agarwal, “Z2 photonic topological insulators in the visible wavelength range for robust nanoscale photonics,” Nano Letters 20, 1329–1335 (2020).
- Wang et al. (2003) Y. Q. Wang, Y. G. Wang, L. Cao, and Z. X. Cao, “High-efficiency visible photoluminescence from amorphous silicon nanoparticles embedded in silicon nitride,” Applied Physics Letters 83, 3474–3476 (2003), https://doi.org/10.1063/1.1621462 .
- Kistner et al. (2011) J. Kistner, X. Chen, Y. Weng, H. P. Strunk, M. B. Schubert, and J. H. Werner, “Photoluminescence from silicon nitride—no quantum effect,” Journal of Applied Physics 110, 023520 (2011).
- Wang et al. (2007) M. Wang, D. Li, Z. Yuan, D. Yang, and D. Que, “Photoluminescence of Si-rich silicon nitride: Defect-related states and silicon nanoclusters,” Applied Physics Letters 90, 131903 (2007).
- Dal Negro et al. (2006) L. Dal Negro, J. H. Yi, J. Michel, L. C. Kimerling, T.-W. F. Chang, V. Sukhovatkin, and E. H. Sargent, “Light emission efficiency and dynamics in silicon-rich silicon nitride films,” Applied Physics Letters 88, 233109 (2006).
- Amosov et al. (2022) A. V. Amosov, Y. N. Kulchin, A. V. Dvurechenskii, and V. P. Dzyuba, “Photoluminescence and excitation energy transfer in non-stoichiometric silicon nitride,” Journal of Luminescence 243, 118615 (2022).
- Wagner et al. (2012) R. Wagner, L. Heerklotz, N. Kortenbruck, and F. Cichos, “Back focal plane imaging spectroscopy of photonic crystals,” Applied Physics Letters 101, 081904 (2012).
- Zhen et al. (2014) B. Zhen, C. W. Hsu, L. Lu, A. D. Stone, and M. Soljačić, “Topological Nature of Optical Bound States in the Continuum,” Physical Review Letters 113, 257401 (2014).
- Purcell (1946) E. M. Purcell, “Spontaneous emission probabilities at radio frequencies,” Physical Review 69, 681–681 (1946).
- Zhan (2009) Q. Zhan, “Cylindrical vector beams: from mathematical concepts to applications,” Advances in Optics and Photonics 1, 1–57 (2009).
- Iwahashi et al. (2011) S. Iwahashi, Y. Kurosaka, K. Sakai, K. Kitamura, N. Takayama, and S. Noda, “Higher-order vector beams produced by photonic-crystal lasers,” Optics Express 19, 11963–11968 (2011).
- Shen et al. (2019) Y. Shen, X. Wang, Z. Xie, C. Min, X. Fu, Q. Liu, M. Gong, and X. Yuan, “Optical vortices 30 years on: OAM manipulation from topological charge to multiple singularities,” Light: Science & Applications 8, 90 (2019).
- Gbur (2016) G. J. Gbur, Singular optics (CRC press, Boca Raton, 2016).
- Wang et al. (2020) B. Wang, W. Liu, M. Zhao, J. Wang, Y. Zhang, A. Chen, F. Guan, X. Liu, L. Shi, and J. Zi, “Generating optical vortex beams by momentum-space polarization vortices centred at bound states in the continuum,” Nature Photonics 14, 623–628 (2020).
- Mohamed et al. (2022) S. Mohamed, J. Wang, H. Rekola, J. Heikkinen, B. Asamoah, L. Shi, and T. K. Hakala, “Controlling topology and polarization state of lasing photonic bound states in continuum,” Laser & Photonics Reviews , 2100574 (2022).
- Salerno et al. (2022) G. Salerno, R. Heilmann, K. Arjas, K. Aronen, J.-P. Martikainen, and P. Törmä, “Loss-driven topological transitions in lasing,” Physical Review Letters 129, 173901 (2022).
- Ji et al. (2022) C.-Y. Ji, W. Lan, P. Fu, G. Wang, C. Gu, J. Li, Y. Yao, and B. Liu, “Probing phase transition of band topology via radiation topology,” (2022), arXiv:2210.17081 .