High-density reflection spectroscopy of black hole X-ray binaries in the hard state
Abstract
We present a high-density relativistic reflection analysis of 21 spectra of six black hole X-ray binaries in the hard state with data from NuSTAR and Swift. We find that 76% of the observations in our sample require a disk density higher than the 1015 cm-3 assumed in the previous reflection analysis. Compared with the measurements from active galactic nuclei, stellar mass black holes have higher disk densities. Our fits indicate that the inner disk radius is close to the innermost stable circular orbit in the luminous hard state. The coronal temperatures are significantly lower than the prediction of a purely thermal plasma, which can be explained with a hybrid plasma model. If the disk density is fixed at 1015 cm-3, the disk ionization parameter would be overestimated while the inner disk radius is unaffected.
Subject headings:
accretion, accretion disks — black hole physics — X-rays: binaries1. Introduction
Accreting black holes are efficient at converting gravitational energy into electromagnetic radiation (e.g. Shakura & Sunyaev, 1973; Thorne, 1974). The accretion process is believed to be responsible for many high energy phenomena in the Universe, i.e., active galactic nuclei (AGNs) and X-ray binaries (XRBs). Moreover, accretion is an important ingredient in understanding the growth of supermassive black holes (SMBHs) and galaxies (e.g. King, 2003; Alexander & Hickox, 2012; Fabian, 2012). The X-ray emission is a powerful probe to study the innermost regions of accreting black holes (e.g. Mushotzky et al., 1993; McHardy et al., 2006).
One of the primary components in the X-ray spectra of black holes is the power-law continuum with a high-energy cutoff. This component is thought to originate from inverse Compton scattering of seed photons by a hot plasma (the corona) near the black hole (e.g. Shapiro et al., 1976; Haardt & Maraschi, 1993). This coronal emission can illuminate the optically thick accretion disk and produce the reflected emission that is featured with fluorescent emission, photoelectric absorption and the Compton scattering hump (e.g. George & Fabian, 1991; García & Kallman, 2010). Due to strong relativistic effects near the black hole, the observed reflected features are significantly skewed (e.g. Fabian et al., 1989; Dauser et al., 2010; Bambi, 2017a) and contain rich information about the spacetime (e.g. Reynolds, 2014; Bambi, 2017b; Bambi et al., 2021; Reynolds, 2021) and disk-corona geometry (e.g. Fabian et al., 2009, 2012; Wilkins & Fabian, 2012). This technique has been successfully applied to many black hole XRBs and AGNs (e.g. García et al., 2015; Walton et al., 2016; Jiang et al., 2018; Liu et al., 2019)
Previous reflection models assume the disk electron density to be . This value is appropriate for very massive (e.g. ) black holes in AGNs (e.g. Jiang et al., 2019b) but the standard disk model (Shakura & Sunyaev, 1973) predicts a higher density for less massive black holes. For AGNs, reflection-based analysis has shown that a disk density larger than is sometimes required for SMBHs with and the measured densities are consistent with the prediction of a radiation pressure-dominated disk (e.g. Jiang et al., 2019c; Mallick et al., 2022). The high-density reflection model is able to explain the “soft excess” feature found in many Seyfert galaxies (e.g. Arnaud et al., 1985) without including an additional component (e.g. García et al., 2019). The soft X-ray reverberation signature also supports the reflection origin of the soft excess (e.g. De Marco et al., 2013; Kara et al., 2013).
Moreover, a higher disk density can also relieve the puzzle of super-solar iron abundance in some reflection spectral modelling (e.g. Tomsick et al., 2018; Jiang et al., 2019a). Since the standard disk model predicts an anti-correlation between the disk density and black hole mass times the square of the Eddington-scaled accretion rate () for a radiation pressure-dominated disk (e.g. Svensson & Zdziarski, 1994, and Eq. 1), we expect an even higher density for the accretion disk of XRBs (especially in the hard state). This has been confirmed with an analysis of individual sources but the measured disk densities are lower than theoretical predictions of a radiation pressure or gas pressure-dominated disk (see Fig. 8 of Jiang et al., 2019c).
Previous high-density reflection modelling of black hole XRBs has only been conducted for a few sources (e.g. Reis et al., 2008, 2009, 2011; Steiner et al., 2011; Reis et al., 2012b; Steiner et al., 2012b; Walton et al., 2012; Chiang et al., 2012; Tomsick et al., 2018; Jiang et al., 2019a, 2020; Connors et al., 2021; Chakraborty et al., 2021). Moreover, on the – diagram, there is still an obvious gap between the XRBs and AGNs sample (see Fig. 8 of Jiang et al., 2019c). In this work, we conduct a systematic analysis on the broadband X-ray spectra of six black hole XRBs in the hard state that have not been studied with high-density reflection models. The data selection and reduction are described in Sec. 2. Sec. 3 explains the spectral analysis. In Sec. 4 we discuss the results.
2. Observations and data reduction
We select six black hole XRBs from the BlackCAT catalog111https://www.astro.puc.cl/BlackCAT/transients.php (Corral-Santana et al., 2016). All the sources have measurements of their distances, enabling the estimation of their bolometric luminosities through broadband spectral fitting. We also require the sources to have been observed by NuSTAR so the Compton hump is captured. Tab. 1 shows information about the selected sources. For those sources that do not have measurements of their black hole mass, we assume a value of throughout this work to calculate the Eddington-scaled luminosity. For each source, we select the NuSTAR observations in the hard state that show relativistic reflection features. One of the main features of the reflection by high-density accretion disk is the enhanced soft X-ray emission (Jiang et al., 2019c). Therefore, we also include contemporaneous (on the same day) Swift data if possible. Details of the selected observations are listed in Tab. 2. Note that a few other sources may also match our selection criteria but they have already been studied with reflection models of variable electron density (e.g. GX 339–4, Jiang et al. 2019a; GRS 1716–249, Jiang et al. 2020; 4U 1630–47, King et al. 2014, Connors et al. 2021; MAXI J1348–630, Chakraborty et al. 2021). We do not include those sources in the analysis of this work. MAXI J1820+070 also matches the selection criteria, but there is still debate on its accretion geometry (e.g. Buisson et al., 2019; Zdziarski et al., 2022). We will explore this source in a future publication.
| Source | Distance (kpc) | Mass () | Inclination (∘) | Ref |
| MAXI J1535–571 | - | - | 1 | |
| GRS 1739–278 | 6–8.5 | - | - | 2 |
| GS 1354–64 | 25–61 | - | (binary) | 3 |
| IGR J17091–3624 | 11–17 | 8.7–15.6 | - | 4,5 |
| H 1743–322 | - | (jet) | 6 | |
| V404 Cyg | (binary) | 7,8 |
Note. Selected sources and their properties. For references about the measurements of the distance, mass and inclination angle: (1) Chauhan et al. (2019); (2) Greiner et al. (1996); (3) Casares et al. (2009); (4) Rodriguez et al. (2011); (5) Iyer et al. (2015); (6) Steiner et al. (2012a); (7) Miller-Jones et al. (2009); (8) Khargharia et al. (2010). Note that there is still debate on the distance of GS 1354–64 (also known as BW Cir). A smaller value has been reported by Gandhi et al. (2019).
2.1. NuSTAR
We produce cleaned event files for both FPMA and FPMB with the tool nupipeline v0.4.9 and the calibration version 20220301. The source spectra are then extracted from circular regions centered on the sources using the nuproducts task. The background spectra are extracted from source-free areas with polygon regions created with ds9. Note that for V404 Cyg, five flux-resolved spectra are extracted from the two observations (see details in Sec. B.4).
2.2. Swift
The Swift/XRT data are all in the Window Timing (WT) mode and are free from pile-up effects. The cleaned events files are produced using xrtpipeline v0.13.7 and the last calibration files as of September 2021. We extract the source spectra from circular regions centered on the source with a radius of 100 arcsec. The background regions are chosen to be annuli with an inner radius of 110 arcsec and an outer radius of 200 arcsec. We only include events with grade 0.
3. Spectral analysis
Spectral fittings are conducted with XSPEC v12.12.1 (Arnaud, 1996). The NuSTAR data are used in the 3–79 keV band and the Swift data in the 1–10 keV band. All data are grouped to ensure a minimum of 30 counts per bin. We implement element abundances of Wilms et al. (2000) and cross-sections of Verner et al. (1996). statistics is used to find the best-fit values and uncertainties (at 90% confidence level unless otherwise specified) of the model parameters.
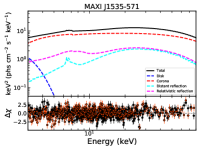
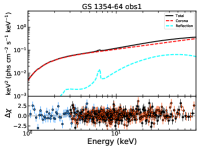
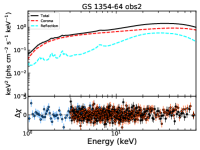
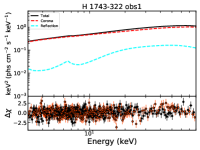
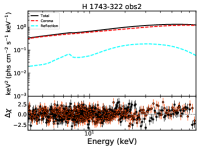
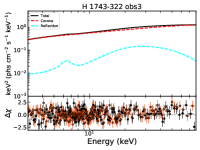
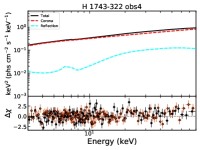
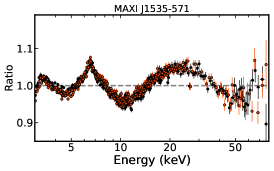
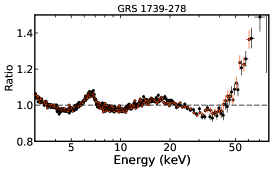
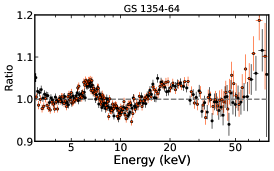
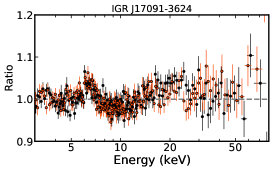
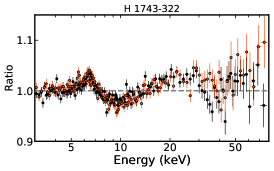
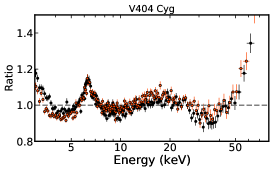
We first fit the broadband spectra from each source with a simple absorbed continuum model: constant * tbabs * ( diskbb + nthcomp ). The constant model is to fit the cross-normalization between instruments. The absorption by Galactic inter-stellar medium is modelled by tbabs (Wilms et al., 2000). The diskbb (Mitsuda et al., 1984) component is to fit the thermal emission from the multicolor accretion disk. The Comptonization model nthcomp (Zdziarski et al., 1996; Życki et al., 1999) fits the coronal emission. The data to model ratios for this test are shown in Fig. 1. Common features for the plots in Fig. 1 are a broad line feature around 6–7 keV and a hump above 20 keV. These features are known as indications of a relativistic reflection component in the spectra (e.g. Ross et al., 1999). In some cases, e.g. GRS 1739–278, we also see a strong tail above 50 keV. This high energy excess may result from extra emission of the jets. Another explanation could be that the corona is a hybrid plasma with both thermal and non-thermal particles (e.g. Parker et al., 2015, Jiang et al. submitted). The non-thermal component can reduce the coronal temperature and produce more hard X-ray photons compared to the pure-thermal model (e.g. Coppi, 1999; Fabian et al., 2017).
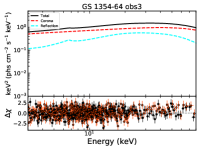
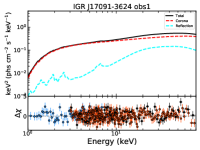
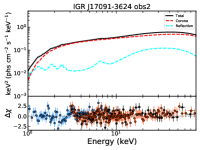
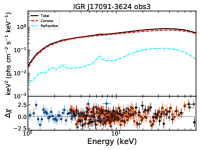
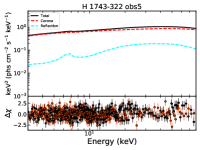
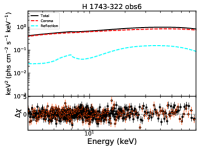
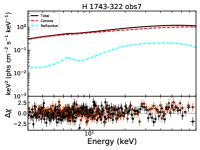
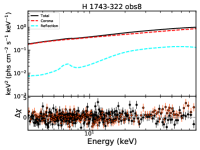
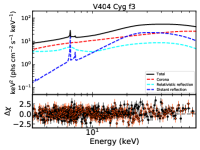
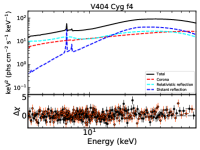
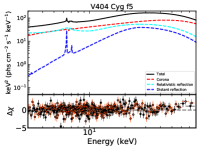
Then we model the reflection features with relativistic reflection models: constant * tbabs * ( cflux * nthcomp + cflux * relconv * reflionx_HD). In this model, reflionx_HD222The model is free to download from https://www.michaelparker.space/reflionx-models. The fits file used here is reflionx_HD_nthcomp_v2.fits. is a rest-frame disk reflection model calculated with the reflionx code (Ross & Fabian, 2005). The incident spectrum to the accretion disk is assumed to be described by nthcomp. Therefore, we link the photon index () and the coronal temperature () parameters between nthcomp and reflionx_HD. Other free parameters of the reflection model include the ionization parameter (where is the ionizing luminosity from the primary source, is the density and is the distance from the ionizing source), the iron abundance () and the electron density that can vary between 15-22. The convolution kernel relconv (Dauser et al., 2010, 2013) is required to include the relativistic effects. In this way, the model calculates the angle-averaged spectrum with only some minor bias (smaller than the statistical errors) in the estimates of some parameters for low disk viewing angles (Tripathi et al., 2020). This model has parameters like the black hole spin (), the disk inclination angle (), the inner disk radius () and the emissivity profile. In this work, we fix the spin parameter in order to constrain the . The spin is fixed at for H 1743-322 (Steiner et al., 2012a), for IGR J17091–3624 (see Sec. B.3) and at the maximum value (0.998) for the other sources (see Sec. B for details). The inclination angle and the inner disk radius are left free during the fit. For the emissivity profile, we implement a broken power-law profile (i.e., for and for where is the breaking radius). In cases that and are not constrained, a power-law emissivity () is used instead. We include a cflux model on each additive component to calculate the flux in the 0.1–100 keV band. Note that in some cases, a distant reflection component, a disk thermal emission component or additional absorption components are required to fit the data (see Fig. 10 and Sec. B for details).
To illustrate the impact on the measurements of spectral parameters after including a variable electron density, we also fit each spectrum with setting to 15, which is a value adopted by traditional reflection models. The best-fit parameters of the two sets of fittings are shown in Tab. 3 and Tab. 4. Moreover, we also test the relxill model (García et al., 2014) with (see Sec. A and Tab. 5).
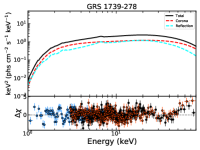
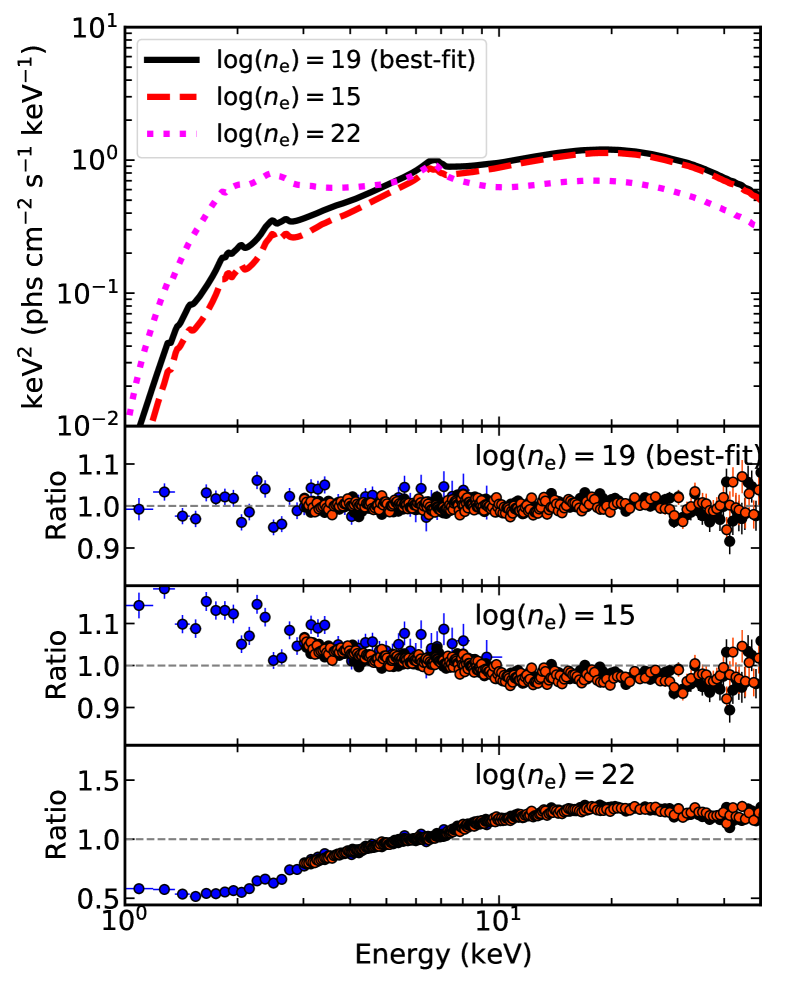
Fig. 2 shows an example of high-density reflection of GRS 1739–278. The best-fit electron density for this source is . Allowing the electron density to be a free parameter improves the by 60 with one more degree of freedom (see Tab. 3 and Tab. 4). If fixing the density at (without refitting the spectrum), the reflection component would be depressed in the soft X-ray band, and there appears to be an excess in the residuals below 2 keV (see the third panel of Fig. 2). On the contrary, if increasing the density to , the soft X-ray emission is apparently strengthened. This is a result of stronger free-free process on the disk when the density gets higher, which could also increase the disk surface temperature (see left panel of Fig. 6).
| Source | Obs ID | Exposure | Start date | Obs ID | Exp. (ks) |
| (NuSTAR) | (ks) | yyyy-mm-dd | (Swift) | (Swift) | |
| MAXI J1535–571 | 90301013002 | 10.3 | 2017-09-07 | ||
| GRS 1739–278 | 80002018002 | 29.7 | 2014-03-26 | 00033203003 | 1.9 |
| GS 1354–64 | 90101006002 | 24.0 | 2015-06-13 | 00033811005 | 2.0 |
| 90101006004 | 29.7 | 2015-07-11 | 00033811017 | 0.2 | |
| 90101006006 | 35.3 | 2015-08-06 | |||
| IGR J17091–3624 | 80001041002 | 43.3 | 2016-03-07 | 00031921099 | 1.5 |
| 80202014002 | 20.2 | 2016-03-12 | 00031921104 | 1.9 | |
| 80202014004 | 20.7 | 2016-03-14 | 00031921106 | 1.0 | |
| H 1743–322 | 80001044002 | 50.4 | 2014-09-18 | ||
| 80001044004 | 61.1 | 2014-09-23 | |||
| 80001044006 | 25.7 | 2014-10-09 | |||
| 80002040002 | 28.3 | 2015-07-03 | |||
| 80202012002 | 65.9 | 2016-03-13 | |||
| 80202012004 | 65.7 | 2016-03-15 | |||
| 90401335002 | 38.4 | 2018-09-19 | |||
| 80202012006 | 65.7 | 2018-09-26 | |||
| V404 Cyg | 90102007002 | 17.7 | 2015-06-24 | ||
| 90102007003 | 6.2 | 2015-06-25 |
4. Results and Discussion
4.1. Comparisons with the low density model
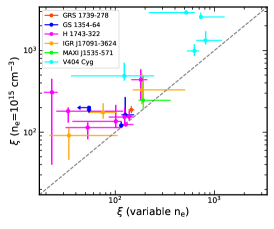
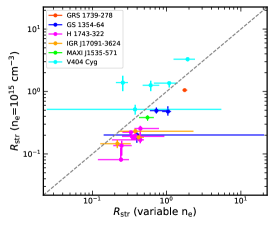
In this section, we discuss the impact of the high-density reflection model on spectral parameters compared to the traditional low density model. In Fig. 3, we show the measurements of the disk ionization parameter, the iron abundance and the reflection fraction. It is shown that when assuming a disk density of , the ionization parameter is systematically overestimated. This is likely because increasing the ionization parameter produces more soft X-ray emissions in the reflected spectrum (see Fig. 3 of García et al., 2013), which mimics the effect of high-density reflection (see Fig. 4 of García et al., 2016).
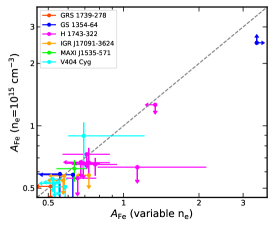
When fitting the relativistic reflection models to X-ray spectra of XRBs and AGNs, a super-solar iron abundance is commonly required (e.g. Jiang et al., 2018; García et al., 2018a). Some studies have shown that high-density models could lower the measured iron abundance (e.g. Tomsick et al., 2018; Jiang et al., 2019a). We do not see this effect in our sample (see the middle panel of Fig. 3) possibly because most of our observations do not need a super-solar iron abundance even in the case of .
We define the reflection strength parameter () to be the energy flux ratio between the reflected and coronal emission in the 0.1–100 keV band. Fig. 3 shows that, except for V404 Cyg, the model with variable always returns a higher reflection strength. As evident in Fig. 2, additional thermalized emission appearing in the soft bands contributes additional emission which may explain the correlated increase in reflection strength with density.
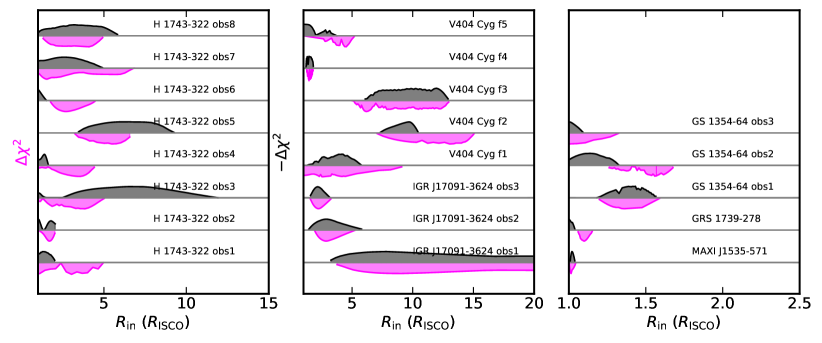
It is of crucial importance to see if the assumption of the electron density would affect measurements of the inner disk radius. One of the reasons is that the black spin measurements with X-ray reflection spectroscopy rely on accurate determination of the ISCO size (e.g. Reynolds, 2014). The constraints of of each observation are shown in Fig. 4 by plotting the distribution of as a function of the inner disk radius. It shows that allowing to be free to vary provides consistent measurements on compared to the case of fixed . This is expected since is mainly constrained by the red wing of the broad iron line as a result of the gravitational redshift effect, which does not depend on the disk density.
4.2. Disk densities
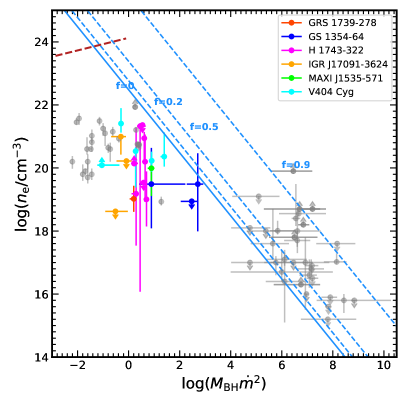
In the left panel of Fig. 5, we present our measurements of the disk density () versus . Previous studies in the literature of XRBs (the left cluster) and AGNs (the right cluster), which mainly cover the parameter space of and , are plotted in grey. Our data fit into the gap . Overall, we find that XRBs require a disk density significantly higher than AGNs. Moreover, 16 out of our 21 spectra show a disk density higher than .
According to Svensson & Zdziarski (1994), the density of radiation pressure-dominated standard disk (Shakura & Sunyaev, 1973) follows:
| (1) |
where is adopted for the viscosity parameter, is the Thomson cross-section, is the Schwarzschild radius, is the disc radius in units of , is the dimensionless mass accretion rate defined as ( is the accretion efficiency that can reach 0.32 for and 0.057 for , Thorne 1974), is the conversion factor in the radiative diffusion equation that is chosen to be unity by Shakura & Sunyaev (1973) and is the fraction of power transported from the disc to the corona. The solutions for different values of are also plotted in the left panel of Fig. 5. We can see that most of the AGN data (the lower right cluster) can be explained by these solutions, with a varying between 0.0 and 0.9 assuming . However, except for a few observations with the highest accretion rates, most disk density measurements of black hole XRBs are below the theoretical predictions.
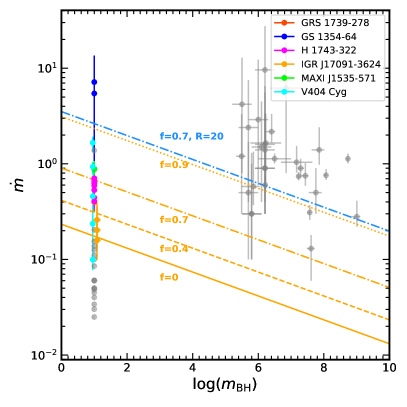
We note that a large fraction (13/21) of our samples are in the range of . In this case, the gas pressure may play a significant role on the disk, especially when is large (Svensson & Zdziarski, 1994). According to Svensson & Zdziarski (1994) the radius at which the radiation pressure () equals the gas pressure () is determined by:
| (2) |
The left-hand side of this equation reaches minimum when . Therefore, given certain values for , and , the left-hand side can be always larger than the right-hand side in which case the disk is dominated by gas pressure. In the right panel of Fig. 5, we plot the threshold as a function of for a few values of . By fitting the AGN sample, Mallick et al. (2022) found . We can see that the AGN sample is well above the threshold line for and the radiation pressure should be important. However, this is not the case for our XRB sample, which indicates the important role of gas pressure. In the left panel of Fig. 5 we are also showing the solution for a gas pressure-dominated disk, which still predicts a disk density larger than our measurements by two orders of magnitude. One of the explanations could be that the reflection model only measures the density of the disk surface. The current reflection models assume a uniform density in the vertical direction, which may not be the case in reality. Developing reflection models that consider the vertical density structure of the disk would be important to understand this problem.
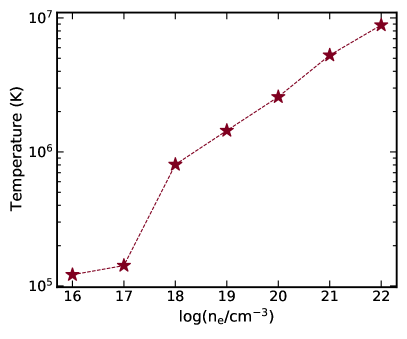
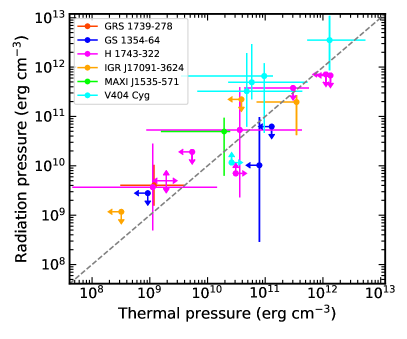
In Mallick et al. (2022), the authors find a balance between the incident radiation pressure ( where is the corona luminosity) and the disk gas thermal pressure (). We explore this possibility with our XRBs sample. The radiation pressure can be directly calculated from the measured spectral parameters. To calculate the gas thermal pressure, we run the reflionx code to obtain the temperature at the Thomson depth for (see the left panel of Fig. 6). The inputs for the reflection calculation are chosen to be the average on our sample, i.e., , =100 keV, =100 erg cm s-1 and =1. The results are shown in the right panel of Fig. 6, where the dashed line shows . We can see that there is indeed a balance between the incident radiation pressure and the gas thermal pressure. Note that in this comparison we are neglecting the role of the magnetic field and the radiation pressure from the disk.
4.3. Disk inner radius
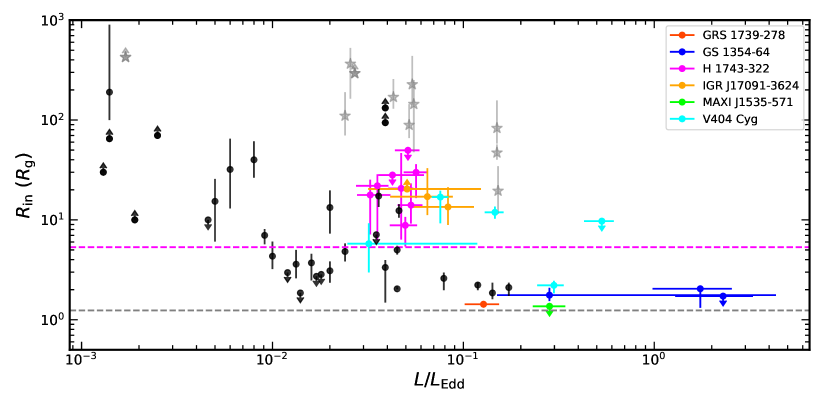
The inner disk radius () is an important parameter to understand the accretion process. The disk truncation scenario has been commonly used to explain the distinctive states of XRBs (e.g. Esin et al., 1997). It is generally believed that the standard cold disk is truncated at large radius in the low hard state when the source luminosity is low (e.g. Tomsick et al., 2009) and it reaches the innermost stable circular orbit (ISCO) in the high luminosity soft state (e.g. Gierliński & Done, 2004; Steiner et al., 2010). However, it is still under debate whether the disk is truncated in the bright hard state (e.g. Dziełak et al., 2019; Mahmoud et al., 2019). We plot our reflection-based measurement of the inner disk radius versus the Eddington-scaled luminosity in Fig. 7 along with previous measurements in the hard state of GX 339–4, which is one of the best-studied sources on (see also Fig. 8 of Wang-Ji et al., 2018). For GX 339–4, the measurements of from timing mode data of XMM-Newton EPIC/pn are systematically larger than those from NuSTAR or RXTE data. This may be due to the complex pile-up effects that are hard to eliminate (see the discussion in Wang-Ji et al., 2018).
Our measurements of from six black hole XRBs in the hard state are broadly consistent with the trend of GX 339–4 and we extend this tendency to the regime where . We can see that a small () is found when even though all the data in Fig. 7 are from the hard state. For , almost all measurements are consistent with being smaller than twice of the ISCO size (assuming ). These results support the idea that the inner disk radius can reach the ISCO in the bright hard state. Although it appears that the H 1743-322 disk is truncated at a large radius in the hard state, the black hole in this system has a low spin measured by the independent continuum-fitting method (, Steiner et al., 2012a) and thus the ISCO size is large (, see the magenta dashed line in Fig. 7). Things are more complicated for IGR J17091–3624 since its black hole spin parameter is still uncertain (see Sec. B.3).
4.4. Inclination angle
In this analysis, we always fit the inclination as a free parameter. It allows us to compare the inclination angle measured from reflection modelling with that from other methods (often for the jet inclination or the binary inclination). For GS 1354–64, only an upper limit of 79∘ has been obtained for its binary inclination through the absence of X-ray eclipses (Casares et al., 2009). There is a tight constraint on the binary inclination of V404 Cyg (()∘, Khargharia et al., 2010) while the reflection analysis gives a lower value.
Similar discrepancies also have been found in other sources, e.g. for Cygnus X-1 the reflection spectra always require an inclination around 40∘ (e.g. Tomsick et al., 2014; Walton et al., 2016; Liu et al., 2019) while its binary inclination is (Miller-Jones et al., 2021). We note that the relativistic reflection spectra are only sensitive to the inner part of the accretion disk while the inner disk inclination may not align with the orbital inclination, which leads to a warped disk (e.g. Pringle, 1996). Simulations have shown that the misalignment between the black hole spin axis and orbital angular momentum can be common for black hole XRBs (e.g. Brandt & Podsiadlowski, 1994; Fragos et al., 2010). Observational indications of a warped disk have been found in a few sources, e.g. MAXI J1535–571 (Miller et al., 2018) and MAXI J1820+070 (Poutanen et al., 2022; Thomas et al., 2022). The warped disk may have an impact on the relativistic reflection spectra (e.g. Abarr & Krawczynski, 2021) but a detailed analysis along this aspect is out of the scope of this work.
For H 1743–322, Steiner et al. (2012a) measured an inclination angle of for its large-scale ballistic jets, which are supposed to be aligned with the black hole spin axis. The inner disk region should also align with the spin axis due to the Bardeen-Petterson effect (Bardeen & Petterson, 1975) while the reflection model gives a lower measurement of . We note that the inclination angle measurements with reflection analysis can be affected by systematic uncertainties, e.g. the lack of knowledge of the corona geometry or simplifications in the model calculations (see discssuions in Bambi et al., 2021). In some cases, the systematic uncertainty can be as large as (e.g. García et al., 2018b; Connors et al., 2022). This might explain the discrepancy we are seeing.
4.5. Reflection strength
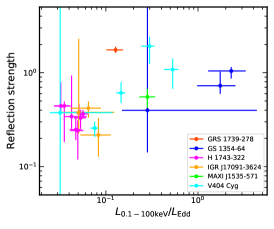
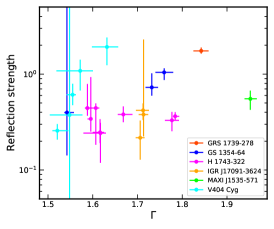
Note that the reflection strength () defined in this work is not the reflection fraction () parameter in Dauser et al. (2016) which is the ratio between the corona intensity that shines on the disk and that reaches infinity. is determined by the accretion geometry while could be affected by inclination between the line-of-sight and the black hole spin axis (Dauser et al., 2016). We note that, in our sample, most sources are consistent with an inclination in the range of 20∘-30∘ (except for MAXI J1535–571). Therefore, can still provide insight into the disk-corona geometry. In the left panel of Fig. 8, we are showing the relation between and the Eddington-scaled X-ray luminosity from our analysis. There is no strong correlation between the two parameters with a Pearson correlation coefficient () of 0.32 (). We also test the correlation between the photon index and the reflection strength (see the middle panel of Fig. 8) but still find no strong correlation ().
4.6. Photon index
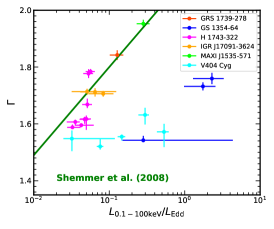
It is well known in the literature that there is a positive statistical correlation between the Eddington ratio () and X-ray photon index () at high accretion rates in AGNs (e.g. Shemmer et al., 2008; Risaliti et al., 2009; Brightman et al., 2013) and XRBs (e.g. Kubota & Makishima, 2004; Wu & Gu, 2008; You et al., 2023). At low accretion rates (e.g. , Yuan et al., 2007; Constantin et al., 2009), a negative correlation is often found (e.g. Gu & Cao, 2009; Díaz et al., 2022). In the regime of extremely low accretion rates (e.g. ), has been found to be saturated (e.g. Corbel et al., 2006; Sobolewska et al., 2011; Gültekin et al., 2012; Plotkin et al., 2013). This switch between correlation behaviors may suggest transition between different accretion modes (e.g. Cao et al., 2014; Yang et al., 2015). We test the correlation with our sample in the right panel of Fig. 8. Our data are all in the range of and divided into two branches on the - diagram. In the lower branch, the data of V404 Cyg are not from canonical outbursts but strong repeated flaring events that last less than 1 ks (see Sec. B.4). Moreover, the flaring events might be related to the transient jet activities instead of changes of the mass accretion rate (Walton et al., 2017). These may explain why stays stable even though the X-ray luminosity changes by more than one order of magnitude. Besides V404 Cyg, the data of GS 1354–64 are also deviating from the trend of other sources. If considering only the upper branch, there is a strong positive correlation between the two parameters (). Moreover, we plot in Fig. 8 the statistical relation found in AGNs by Shemmer et al. (2008), which is in good agreement with our upper branch. This indicates that the mass accretion rate changes the physical properties of the hot corona in a similar manner for XRBs and AGNs.
4.7. The corona properties in the compactness-temperature plane
The coronal properties can be studied on the compactness-temperature () plane. The compactness is defined as:
| (3) |
where is the luminosity, is the source radius assuming a spherical geometry, the Thomson cross section and the electron mass. By studying a sample of NuSTAR measurements AGNs and black hole XRBs on the, Fabian et al. (2015) find that most of the measurements are clustered close to the limit set by electron-positron pair production (see also Ricci et al., 2018). This supports the idea that pair production is an important ingredient in the corona. This process could lead to runaway pair production to share the energy and thus limits the coronal temperature below the pair line (e.g. Svensson, 1984; Zdziarski, 1985; Stern et al., 1995; Coppi, 1999). Moreover, the fact that many sources are above the electron-electron coupling line means that energetic electrons do not have enough time to thermalize, which suggests the possibility of a magnetized and hybrid plasma that contains both thermal and non-thermal particles (e.g. Zdziarski et al., 1993; Grove et al., 1998). The inclusion of a non-thermal component would tend to lower the temperature of the thermal component and produce a high-energy excess compared to the spectra of purely thermal Comptonization. This behavior matches well with the data of GRS 1739–278 which has the lowest observed coronal temperature in our sample. Fabian et al. (2017) investigated the hybrid plasma scenario with a sample of AGNs and found that a non-thermal fraction of 10%-30% could account for most of the objects.
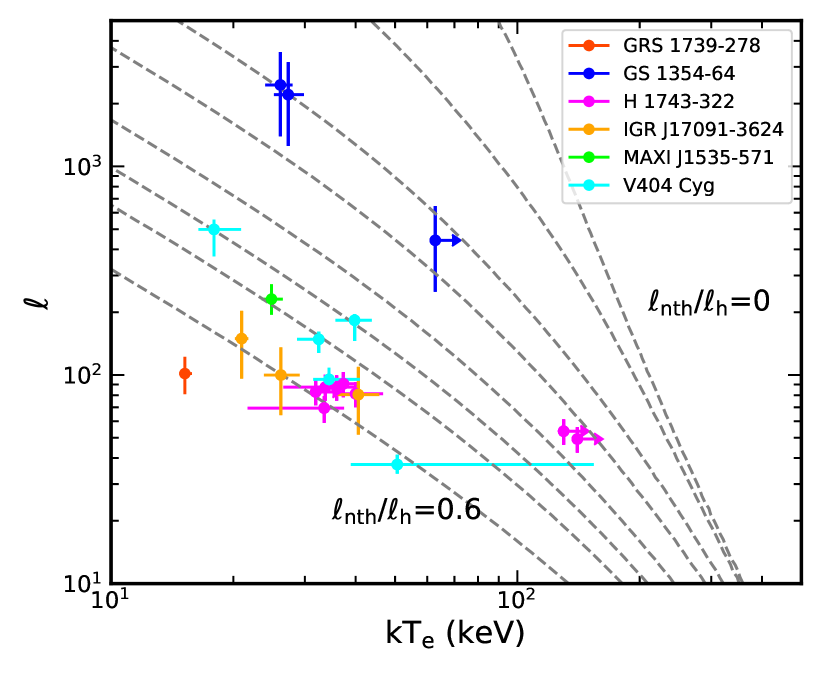
We plot the measurements of our sample on the compactness-temperature diagram along with the theoretical predictions of hybrid plasma to understand the physical properties of the corona in the hard state (Fig. 9). The calculations of the theoretical lines are done with the eqpair333The description of the model can be found here: http://www.astro.yale.edu/coppi/eqpair/eqpap4.ps. The model is available in XSPEC: https://heasarc.gsfc.nasa.gov/xanadu/xspec/manual/XSmodelEqpair.html. model (Coppi, 1999). The non-thermal fraction is defined as the ratio between the compactness parameter of non-thermal and the total heating power (). For a fixed heating power, a higher non-thermal fraction results in a lower equilibrium temperature. We assume a corona size of 10 , which is a reasonable value given existing measurements on AGNs with X-ray reflection modelling or reverberation analysis (e.g. Fabian et al., 2009; Wilkins & Fabian, 2011; Emmanoulopoulos et al., 2014).
Fig. 9 shows that all of our measurements are below the theoretical line of purely thermal plasma. A large fraction (15/21) of our data are below the line for which suggests an even higher non-thermal fraction. We note that the hybrid plasma model has been applied to a number of black hole XRBs (e.g. Gierliński et al., 1999; Zdziarski et al., 2001; Droulans et al., 2010; Parker et al., 2015; Zdziarski et al., 2021) and in some cases a significant non-thermal fraction is indeed required in the hard state (Wardziński et al., 2002; Nowak et al., 2011; Del Santo et al., 2016).
For individual sources, we can see that GS 1354–64 and IGR J17091–3624 follow the expected trend for a pair-dominated plasma that the coronal temperature drops when it gets radiatively more compact. This is even true for the flux-resolved data of V404 Cyg although the timescale of the flaring activities we analyze here is as short as ks (see Sec. B.4). For H 1743–322, there are two outliers with higher temperatures compared to the other six observations with a similar level of radiation compactness. This may suggest a lower non-thermal fraction but it is also possible that the assumption of 10 for the corona size is too small for the two observations. The latter may not be the main reason since the measurements of for the two observations are consistent with 10 . We also note that the two outliers are from the so-called “failed” outbursts (e.g. Stiele & Kong, 2021) during which the source stays in the low hard state only.
We further investigate these H 1743–322 outliers by considering the correlation between X-ray and radio luminosity. This source is known to switch between two different radio-X-ray correlations: the ‘radio loud’ and ‘radio quiet’ branches (Coriat et al., 2011). We therefore explore whether our inferred high/low non-thermal fraction corresponds to the source being on the radio loud/quiet branch, which may be expected if, for example, the non-thermal fraction is related to the jet properties. We find no such correspondance. Only one of our outliers has a simultaneous radio observation, and it belongs to the radio quiet branch (1.28 GHz flux density of mJy; Williams et al. 2020), as do several of the non-outliers.
5. Conclusion
In this work, we analyzed the broadband X-ray spectra of six stellar-mass black hole XRBs in the hard state with data from NuSTAR and Swift. The purpose is to test the effect of X-ray reflection by a high-density accretion disk. The main results are as follow:
-
•
The model with the disk electron density fixed at cm-3 systematically overestimates the ionization degree of the disk atmosphere. The measurement of the inner disk radius is not affected by the assumption of disk density.
-
•
The X-ray spectra of black hole XRBs require a higher disk density than that of AGNs. For the selected observations in this work, the accretion disk should be dominated by gas pressure. However, the measured densities are lower than either the prediction of gas or radiation pressure-dominated disk. The discrepancy might represent the vertical density structure of the disk.
-
•
From our analysis and previous measurements, we find that the inner disk radius can be close to the ISCO in the hard state.
-
•
We find that the reflection strength is not correlated to the Eddington ratio or photon index. There is a strong correlation between the Eddington ratio and photon index which is in good agreement with the statistical relation found in AGNs.
-
•
The coronal temperature is lower than the prediction of a purely thermal plasma and can be explained by a hybrid plasma with a non-thermal fraction around 30%.
Acknowledgments – This work was supported by the National Natural Science Foundation of China (NSFC), Grant No. 12250610185 and Grant No. 11973019, the Natural Science Foundation of Shanghai, Grant No. 22ZR1403400, the Shanghai Municipal Education Commission, Grant No. 2019-01-07-00-07-E00035, and Fudan University, Grant No. JIH1512604. JJ acknowledges support from the Leverhulme Trust, the Isaac Newton Trust and St Edmund’s College. JAT acknowledges partial support from NASA under Astrophysics Data Analysis Program (ADAP) grant 80NSSC19K0586.
References
- Abarr & Krawczynski (2021) Abarr, Q., & Krawczynski, H. 2021, ApJ, 906, 28
- Alexander & Hickox (2012) Alexander, D. M., & Hickox, R. C. 2012, New A Rev., 56, 93
- Altamirano et al. (2011) Altamirano, D., Belloni, T., Linares, M., et al. 2011, ApJ, 742, L17
- Arnaud (1996) Arnaud, K. A. 1996, in Astronomical Society of the Pacific Conference Series, Vol. 101, Astronomical Data Analysis Software and Systems V, ed. G. H. Jacoby & J. Barnes, 17
- Arnaud et al. (1985) Arnaud, K. A., Branduardi-Raymont, G., Culhane, J. L., et al. 1985, MNRAS, 217, 105
- Bambi (2017a) Bambi, C. 2017a, Black Holes: A Laboratory for Testing Strong Gravity, doi:10.1007/978-981-10-4524-0
- Bambi (2017b) —. 2017b, Reviews of Modern Physics, 89, 025001
- Bambi et al. (2021) Bambi, C., Brenneman, L. W., Dauser, T., et al. 2021, Space Sci. Rev., 217, 65
- Bardeen & Petterson (1975) Bardeen, J. M., & Petterson, J. A. 1975, ApJ, 195, L65
- Basak & Zdziarski (2016) Basak, R., & Zdziarski, A. A. 2016, MNRAS, 458, 2199
- Brandt & Podsiadlowski (1994) Brandt, W. N., & Podsiadlowski, P. 1994, arXiv e-prints, astro
- Brightman et al. (2013) Brightman, M., Silverman, J. D., Mainieri, V., et al. 2013, MNRAS, 433, 2485
- Buisson et al. (2019) Buisson, D. J. K., Fabian, A. C., Barret, D., et al. 2019, MNRAS, 490, 1350
- Cao et al. (2014) Cao, X.-F., Wu, Q., & Dong, A.-J. 2014, ApJ, 788, 52
- Casares et al. (2009) Casares, J., Orosz, J. A., Zurita, C., et al. 2009, ApJS, 181, 238
- Chakraborty et al. (2021) Chakraborty, S., Ratheesh, A., Bhattacharyya, S., et al. 2021, MNRAS, 508, 475
- Chand et al. (2020) Chand, S., Agrawal, V. K., Dewangan, G. C., Tripathi, P., & Thakur, P. 2020, ApJ, 893, 142
- Chauhan et al. (2019) Chauhan, J., Miller-Jones, J. C. A., Anderson, G. E., et al. 2019, MNRAS, 488, L129
- Chiang et al. (2012) Chiang, C.-Y., Reis, R. C., Walton, D. J., & Fabian, A. C. 2012, MNRAS, 425, 2436
- Connors et al. (2021) Connors, R. M. T., García, J. A., Tomsick, J., et al. 2021, ApJ, 909, 146
- Connors et al. (2022) —. 2022, ApJ, 935, 118
- Constantin et al. (2009) Constantin, A., Green, P., Aldcroft, T., et al. 2009, ApJ, 705, 1336
- Coppi (1999) Coppi, P. S. 1999, in Astronomical Society of the Pacific Conference Series, Vol. 161, High Energy Processes in Accreting Black Holes, ed. J. Poutanen & R. Svensson, 375
- Corbel et al. (2006) Corbel, S., Tomsick, J. A., & Kaaret, P. 2006, ApJ, 636, 971
- Coriat et al. (2011) Coriat, M., Corbel, S., Prat, L., et al. 2011, MNRAS, 414, 677
- Corral-Santana et al. (2016) Corral-Santana, J. M., Casares, J., Muñoz-Darias, T., et al. 2016, A&A, 587, A61
- Dauser et al. (2016) Dauser, T., García, J., Walton, D. J., et al. 2016, A&A, 590, A76
- Dauser et al. (2013) Dauser, T., Garcia, J., Wilms, J., et al. 2013, MNRAS, 430, 1694
- Dauser et al. (2010) Dauser, T., Wilms, J., Reynolds, C. S., & Brenneman, L. W. 2010, MNRAS, 409, 1534
- De Marco et al. (2013) De Marco, B., Ponti, G., Cappi, M., et al. 2013, MNRAS, 431, 2441
- Del Santo et al. (2016) Del Santo, M., Belloni, T. M., Tomsick, J. A., et al. 2016, MNRAS, 456, 3585
- Díaz et al. (2022) Díaz, Y., Hernández-García, L., Arévalo, P., et al. 2022, arXiv e-prints, arXiv:2210.15376
- Droulans et al. (2010) Droulans, R., Belmont, R., Malzac, J., & Jourdain, E. 2010, ApJ, 717, 1022
- Dziełak et al. (2019) Dziełak, M. A., Zdziarski, A. A., Szanecki, M., et al. 2019, MNRAS, 485, 3845
- El-Batal et al. (2016) El-Batal, A. M., Miller, J. M., Reynolds, M. T., et al. 2016, ApJ, 826, L12
- Emmanoulopoulos et al. (2014) Emmanoulopoulos, D., Papadakis, I. E., Dovčiak, M., & McHardy, I. M. 2014, MNRAS, 439, 3931
- Esin et al. (1997) Esin, A. A., McClintock, J. E., & Narayan, R. 1997, ApJ, 489, 865
- Fabian (2012) Fabian, A. C. 2012, ARA&A, 50, 455
- Fabian et al. (2017) Fabian, A. C., Lohfink, A., Belmont, R., Malzac, J., & Coppi, P. 2017, MNRAS, 467, 2566
- Fabian et al. (2015) Fabian, A. C., Lohfink, A., Kara, E., et al. 2015, MNRAS, 451, 4375
- Fabian et al. (1989) Fabian, A. C., Rees, M. J., Stella, L., & White, N. E. 1989, MNRAS, 238, 729
- Fabian et al. (2009) Fabian, A. C., Zoghbi, A., Ross, R. R., et al. 2009, Nature, 459, 540
- Fabian et al. (2012) Fabian, A. C., Zoghbi, A., Wilkins, D., et al. 2012, MNRAS, 419, 116
- Fragos et al. (2010) Fragos, T., Tremmel, M., Rantsiou, E., & Belczynski, K. 2010, ApJ, 719, L79
- Fürst et al. (2016) Fürst, F., Tomsick, J. A., Yamaoka, K., et al. 2016, ApJ, 832, 115
- Gandhi et al. (2019) Gandhi, P., Rao, A., Johnson, M. A. C., Paice, J. A., & Maccarone, T. J. 2019, MNRAS, 485, 2642
- García et al. (2013) García, J., Dauser, T., Reynolds, C. S., et al. 2013, ApJ, 768, 146
- García & Kallman (2010) García, J., & Kallman, T. R. 2010, ApJ, 718, 695
- García et al. (2014) García, J., Dauser, T., Lohfink, A., et al. 2014, ApJ, 782, 76
- García et al. (2016) García, J. A., Fabian, A. C., Kallman, T. R., et al. 2016, MNRAS, 462, 751
- García et al. (2018a) García, J. A., Kallman, T. R., Bautista, M., et al. 2018a, in Astronomical Society of the Pacific Conference Series, Vol. 515, Workshop on Astrophysical Opacities, 282
- García et al. (2015) García, J. A., Steiner, J. F., McClintock, J. E., et al. 2015, ApJ, 813, 84
- García et al. (2018b) García, J. A., Steiner, J. F., Grinberg, V., et al. 2018b, ApJ, 864, 25
- García et al. (2019) García, J. A., Kara, E., Walton, D., et al. 2019, ApJ, 871, 88
- George & Fabian (1991) George, I. M., & Fabian, A. C. 1991, MNRAS, 249, 352
- Gierliński & Done (2004) Gierliński, M., & Done, C. 2004, MNRAS, 347, 885
- Gierliński et al. (1999) Gierliński, M., Zdziarski, A. A., Poutanen, J., et al. 1999, MNRAS, 309, 496
- Greiner et al. (1996) Greiner, J., Dennerl, K., & Predehl, P. 1996, A&A, 314, L21
- Grove et al. (1998) Grove, J. E., Johnson, W. N., Kroeger, R. A., et al. 1998, ApJ, 500, 899
- Gu & Cao (2009) Gu, M., & Cao, X. 2009, MNRAS, 399, 349
- Gültekin et al. (2012) Gültekin, K., Cackett, E. M., Miller, J. M., et al. 2012, ApJ, 749, 129
- Haardt & Maraschi (1993) Haardt, F., & Maraschi, L. 1993, ApJ, 413, 507
- Iyer et al. (2015) Iyer, N., Nandi, A., & Mandal, S. 2015, ApJ, 807, 108
- Jiang et al. (2019a) Jiang, J., Fabian, A. C., Wang, J., et al. 2019a, MNRAS, 484, 1972
- Jiang et al. (2020) Jiang, J., Fürst, F., Walton, D. J., Parker, M. L., & Fabian, A. C. 2020, MNRAS, 492, 1947
- Jiang et al. (2019b) Jiang, J., Walton, D. J., Fabian, A. C., & Parker, M. L. 2019b, MNRAS, 483, 2958
- Jiang et al. (2018) Jiang, J., Parker, M. L., Fabian, A. C., et al. 2018, MNRAS, 477, 3711
- Jiang et al. (2019c) Jiang, J., Fabian, A. C., Dauser, T., et al. 2019c, MNRAS, 489, 3436
- Kallman & Bautista (2001) Kallman, T., & Bautista, M. 2001, ApJS, 133, 221
- Kallman et al. (2004) Kallman, T. R., Palmeri, P., Bautista, M. A., Mendoza, C., & Krolik, J. H. 2004, ApJS, 155, 675
- Kaluzienski & Holt (1977) Kaluzienski, L. J., & Holt, S. S. 1977, IAU Circ., 3099, 3
- Kara et al. (2013) Kara, E., Fabian, A. C., Cackett, E. M., et al. 2013, MNRAS, 428, 2795
- Khargharia et al. (2010) Khargharia, J., Froning, C. S., & Robinson, E. L. 2010, ApJ, 716, 1105
- King (2003) King, A. 2003, ApJ, 596, L27
- King et al. (2014) King, A. L., Walton, D. J., Miller, J. M., et al. 2014, ApJ, 784, L2
- Kolehmainen et al. (2014) Kolehmainen, M., Done, C., & Díaz Trigo, M. 2014, MNRAS, 437, 316
- Kubota & Makishima (2004) Kubota, A., & Makishima, K. 2004, ApJ, 601, 428
- Liu et al. (2019) Liu, H., Abdikamalov, A. B., Ayzenberg, D., et al. 2019, Phys. Rev. D, 99, 123007
- Liu et al. (2022) Liu, H., Bambi, C., Jiang, J., et al. 2022, arXiv e-prints, arXiv:2211.09543
- Mahmoud et al. (2019) Mahmoud, R. D., Done, C., & De Marco, B. 2019, MNRAS, 486, 2137
- Makino (1987) Makino, F. 1987, IAU Circ., 4342, 1
- Mallick et al. (2022) Mallick, L., Fabian, A. C., García, J. A., et al. 2022, MNRAS, 513, 4361
- McHardy et al. (2006) McHardy, I. M., Koerding, E., Knigge, C., Uttley, P., & Fender, R. P. 2006, Nature, 444, 730
- Miller et al. (2006) Miller, J. M., Homan, J., Steeghs, D., et al. 2006, ApJ, 653, 525
- Miller et al. (2015) Miller, J. M., Tomsick, J. A., Bachetti, M., et al. 2015, ApJ, 799, L6
- Miller et al. (2018) Miller, J. M., Gendreau, K., Ludlam, R. M., et al. 2018, ApJ, 860, L28
- Miller-Jones et al. (2009) Miller-Jones, J. C. A., Jonker, P. G., Dhawan, V., et al. 2009, ApJ, 706, L230
- Miller-Jones et al. (2021) Miller-Jones, J. C. A., Bahramian, A., Orosz, J. A., et al. 2021, Science, 371, 1046
- Mitsuda et al. (1984) Mitsuda, K., Inoue, H., Koyama, K., et al. 1984, PASJ, 36, 741
- Molla et al. (2017) Molla, A. A., Chakrabarti, S. K., Debnath, D., & Mondal, S. 2017, ApJ, 834, 88
- Mushotzky et al. (1993) Mushotzky, R. F., Done, C., & Pounds, K. A. 1993, ARA&A, 31, 717
- Negoro et al. (2017) Negoro, H., Kawase, T., Sugizaki, M., et al. 2017, The Astronomer’s Telegram, 10708, 1
- Nowak et al. (2011) Nowak, M. A., Hanke, M., Trowbridge, S. N., et al. 2011, ApJ, 728, 13
- Parker et al. (2015) Parker, M. L., Tomsick, J. A., Miller, J. M., et al. 2015, ApJ, 808, 9
- Paul et al. (1996) Paul, J., Bouchet, L., Churazov, E., & Sunyaev, R. 1996, IAU Circ., 6348, 1
- Petrucci et al. (2014) Petrucci, P. O., Cabanac, C., Corbel, S., Koerding, E., & Fender, R. 2014, A&A, 564, A37
- Plant et al. (2015) Plant, D. S., Fender, R. P., Ponti, G., Muñoz-Darias, T., & Coriat, M. 2015, A&A, 573, A120
- Plotkin et al. (2013) Plotkin, R. M., Gallo, E., & Jonker, P. G. 2013, ApJ, 773, 59
- Poutanen et al. (2022) Poutanen, J., Veledina, A., Berdyugin, A. V., et al. 2022, Science, 375, 874
- Pringle (1996) Pringle, J. E. 1996, MNRAS, 281, 357
- Rao & Vadawale (2012) Rao, A., & Vadawale, S. V. 2012, ApJ, 757, L12
- Reis et al. (2009) Reis, R. C., Fabian, A. C., Ross, R. R., & Miller, J. M. 2009, MNRAS, 395, 1257
- Reis et al. (2008) Reis, R. C., Fabian, A. C., Ross, R. R., et al. 2008, MNRAS, 387, 1489
- Reis et al. (2012a) Reis, R. C., Miller, J. M., King, A. L., & Reynolds, M. T. 2012a, The Astronomer’s Telegram, 4382, 1
- Reis et al. (2012b) Reis, R. C., Miller, J. M., Reynolds, M. T., Fabian, A. C., & Walton, D. J. 2012b, ApJ, 751, 34
- Reis et al. (2011) Reis, R. C., Miller, J. M., Fabian, A. C., et al. 2011, MNRAS, 410, 2497
- Reynolds (2014) Reynolds, C. S. 2014, Space Sci. Rev., 183, 277
- Reynolds (2021) —. 2021, ARA&A, 59, 117
- Ricci et al. (2018) Ricci, C., Ho, L. C., Fabian, A. C., et al. 2018, MNRAS, 480, 1819
- Risaliti et al. (2009) Risaliti, G., Young, M., & Elvis, M. 2009, ApJ, 700, L6
- Rodriguez et al. (2011) Rodriguez, J., Corbel, S., Caballero, I., et al. 2011, A&A, 533, L4
- Ross & Fabian (2005) Ross, R. R., & Fabian, A. C. 2005, MNRAS, 358, 211
- Ross et al. (1999) Ross, R. R., Fabian, A. C., & Young, A. J. 1999, MNRAS, 306, 461
- Shakura & Sunyaev (1973) Shakura, N. I., & Sunyaev, R. A. 1973, A&A, 24, 337
- Shapiro et al. (1976) Shapiro, S. L., Lightman, A. P., & Eardley, D. M. 1976, ApJ, 204, 187
- Shemmer et al. (2008) Shemmer, O., Brandt, W. N., Netzer, H., Maiolino, R., & Kaspi, S. 2008, ApJ, 682, 81
- Shidatsu et al. (2011) Shidatsu, M., Ueda, Y., Tazaki, F., et al. 2011, PASJ, 63, S785
- Sobolewska et al. (2011) Sobolewska, M. A., Papadakis, I. E., Done, C., & Malzac, J. 2011, MNRAS, 417, 280
- Steiner et al. (2012a) Steiner, J. F., McClintock, J. E., & Reid, M. J. 2012a, ApJ, 745, L7
- Steiner et al. (2010) Steiner, J. F., McClintock, J. E., Remillard, R. A., et al. 2010, ApJ, 718, L117
- Steiner et al. (2011) Steiner, J. F., Reis, R. C., McClintock, J. E., et al. 2011, MNRAS, 416, 941
- Steiner et al. (2012b) Steiner, J. F., Reis, R. C., Fabian, A. C., et al. 2012b, MNRAS, 427, 2552
- Stern et al. (1995) Stern, B. E., Poutanen, J., Svensson, R., Sikora, M., & Begelman, M. C. 1995, ApJ, 449, L13
- Stiele & Kong (2021) Stiele, H., & Kong, A. K. H. 2021, ApJ, 914, 93
- Svensson (1984) Svensson, R. 1984, MNRAS, 209, 175
- Svensson & Zdziarski (1994) Svensson, R., & Zdziarski, A. A. 1994, ApJ, 436, 599
- Thomas et al. (2022) Thomas, J. K., Charles, P. A., Buckley, D. A. H., et al. 2022, MNRAS, 509, 1062
- Thorne (1974) Thorne, K. S. 1974, ApJ, 191, 507
- Tomsick et al. (2009) Tomsick, J. A., Yamaoka, K., Corbel, S., et al. 2009, ApJ, 707, L87
- Tomsick et al. (2008) Tomsick, J. A., Kalemci, E., Kaaret, P., et al. 2008, ApJ, 680, 593
- Tomsick et al. (2014) Tomsick, J. A., Nowak, M. A., Parker, M., et al. 2014, ApJ, 780, 78
- Tomsick et al. (2018) Tomsick, J. A., Parker, M. L., García, J. A., et al. 2018, ApJ, 855, 3
- Tripathi et al. (2020) Tripathi, A., Liu, H., & Bambi, C. 2020, MNRAS, 498, 3565
- Verner et al. (1996) Verner, D. A., Ferland, G. J., Korista, K. T., & Yakovlev, D. G. 1996, ApJ, 465, 487
- Walton et al. (2012) Walton, D. J., Reis, R. C., Cackett, E. M., Fabian, A. C., & Miller, J. M. 2012, MNRAS, 422, 2510
- Walton et al. (2016) Walton, D. J., Tomsick, J. A., Madsen, K. K., et al. 2016, ApJ, 826, 87
- Walton et al. (2017) Walton, D. J., Mooley, K., King, A. L., et al. 2017, ApJ, 839, 110
- Wang et al. (2018) Wang, Y., Méndez, M., Altamirano, D., et al. 2018, MNRAS, 478, 4837
- Wang-Ji et al. (2018) Wang-Ji, J., García, J. A., Steiner, J. F., et al. 2018, ApJ, 855, 61
- Wardziński et al. (2002) Wardziński, G., Zdziarski, A. A., Gierliński, M., et al. 2002, MNRAS, 337, 829
- Wilkins & Fabian (2011) Wilkins, D. R., & Fabian, A. C. 2011, MNRAS, 414, 1269
- Wilkins & Fabian (2012) —. 2012, MNRAS, 424, 1284
- Williams et al. (2020) Williams, D. R. A., Motta, S. E., Fender, R., et al. 2020, MNRAS, 491, L29
- Wilms et al. (2000) Wilms, J., Allen, A., & McCray, R. 2000, ApJ, 542, 914
- Wu & Gu (2008) Wu, Q., & Gu, M. 2008, ApJ, 682, 212
- Xu et al. (2018a) Xu, Y., Nampalliwar, S., Abdikamalov, A. B., et al. 2018a, ApJ, 865, 134
- Xu et al. (2017) Xu, Y., García, J. A., Fürst, F., et al. 2017, ApJ, 851, 103
- Xu et al. (2018b) Xu, Y., Harrison, F. A., García, J. A., et al. 2018b, ApJ, 852, L34
- Yang et al. (2015) Yang, Q.-X., Xie, F.-G., Yuan, F., et al. 2015, MNRAS, 447, 1692
- You et al. (2023) You, B., Dong, Y., Yan, Z., et al. 2023, ApJ, 945, 65
- Yuan et al. (2007) Yuan, F., Taam, R. E., Misra, R., Wu, X.-B., & Xue, Y. 2007, ApJ, 658, 282
- Zdziarski (1985) Zdziarski, A. A. 1985, ApJ, 289, 514
- Zdziarski et al. (2001) Zdziarski, A. A., Grove, J. E., Poutanen, J., Rao, A. R., & Vadawale, S. V. 2001, ApJ, 554, L45
- Zdziarski et al. (1996) Zdziarski, A. A., Johnson, W. N., & Magdziarz, P. 1996, MNRAS, 283, 193
- Zdziarski et al. (1993) Zdziarski, A. A., Lightman, A. P., & Maciolek-Niedzwiecki, A. 1993, ApJ, 414, L93
- Zdziarski et al. (2022) Zdziarski, A. A., You, B., Szanecki, M., Li, X.-B., & Ge, M. 2022, ApJ, 928, 11
- Zdziarski et al. (2021) Zdziarski, A. A., Jourdain, E., Lubiński, P., et al. 2021, ApJ, 914, L5
- Życki et al. (1999) Życki, P. T., Done, C., & Smith, D. A. 1999, MNRAS, 309, 561
Appendix A Modeling with relxillcp
Besides the reflionx-based models, the relxill (García et al., 2014) model is also commonly used to fit relativistic reflection spectra. To compare our results with existed analysis in the literature, we replace the reflection component with the model relxillcp (Model 2), which is a flavor of the package relxill v1.4.3. This model assumes a electron density of the disk 15444Note that the latest version of relxillcp allows a variable electron density in the range = 15-20 (see http://www.sternwarte.uni-erlangen.de/~dauser/research/relxill/). Moreover, relativistic effects are properly taken into account by combining the rest-frame reflection code xillver (García & Kallman, 2010; García et al., 2013) and the relativistic broadening code relline (Dauser et al., 2010, 2013). The reflection fraction is set to -1 so the model returns only the reflection component. The best-fit parameters are shown in Tab. 5.
Appendix B Spectral analysis results for individual sources
B.1. GRS 1739–278
GRS 1739–278 is discovered in 1996 by Granat (Paul et al., 1996). It is located at a distance of 6–8.5 kpc (Greiner et al., 1996). The NuSTAR observation in the analysis has been studied by Miller et al. (2015) without including the Swift data. The authors tested both reflionx and relxill-based reflection models and found a high black hole spin (), an intermediate inclination (20∘–40∘) and an inner disk radius close to the ISCO. We obtain similar measurements with our reflection modelling (see Tab 4 and Tab 5). The very low temperature of the corona has already been revealed by Miller et al. (2015). There is another NuSTAR observation in the archive (obsID: 80101050002) from September 2015 but the reflection features are too weak (Fürst et al., 2016).
B.2. GS 1354–64
GS 1354–64 is a Galactic black hole candidate discovered in 1987 (Makino, 1987). Only a lower limit () has been determined for its black hole mass and its distance is also not well-constrained (25-61 kpc, Casares et al., 2009). The first two observations in June and July in our analysis have been studied by El-Batal et al. (2016) without including the Swift data. The authors found a large truncation of the accretion disk for the June observation with a low density relxill model, which is consistent with our results in Tab. 5. The high disk inclination and small inner disk radius measured from the July observation are also in agreement with previous studies (e.g. El-Batal et al., 2016; Xu et al., 2018a).
B.3. IGR J17091–3624
IGR J17091–3624 is a Galactic black hole candidate at a distance of 11 kpc to 17 kpc (Rodriguez et al. 2011, but see Altamirano et al. 2011 for debates on its distance.). The black hole spin parameter is still quite uncertain. Previous studies have reported both negative spin (Rao & Vadawale, 2012; Wang et al., 2018) and high spin (, Reis et al., 2012a) measurements. The three NuSTAR and Swift observations in this analysis have been studied by Xu et al. (2017) with relxill-based low density reflection models. By fixing , the authors found a truncated disk () and an intermediate disk inclination angle (), which are confirmed with our analysis (see Tab. 5).
B.4. V404 Cyg
V404 Cyg is a dynamically confirmed black hole XRB located at kpc (Miller-Jones et al., 2009). The black hole mass should be (Khargharia et al., 2010). The two observations of V404 Cyg analyzed in this work show strong flaring variability (see Fig. 2 of Walton et al., 2017) with the count rate (per FPM) changing from 100 to more than 104 ct s-1. It was shown by Walton et al. (2017) that there are strong relativistic reflection features in the X-ray spectra and it is possible to constrain the black hole spin parameter if dividing the data according to flux levels and neglecting the data with deep absorption edge. We process the data in the same way as Walton et al. (2017) and obtain the spectra for five flux levels (see Tab. 1 of Walton et al. (2017)).
To fit the spectra of V404 Cyg, it requires to include additional components: a neutral local absorption layer, an ionized absorption layer and a distant reflection component. The ionized absorption is modeled with a grid calculated with XSTAR (Kallman & Bautista, 2001; Kallman et al., 2004). The full model of our Model 2 for this source reads as: constant * tbabsgal * (tbabslocal * xstar * (cflux * nthcomp + cflux * relxillcp) + cflux * xillvercp). The column density for the Galactic absorption is fixed at 1022 cm-2 and the absorption column locally to the source is a free parameter. The ionization state of the distant reflection component (xillvercp) is fixed at and the other parameters are linked to the relativistic reflection component.
B.5. H 1743–322
H 1743–322 was discovered in 1977 (Kaluzienski & Holt, 1977). It is located at kpc and the jet inclination is (Steiner et al., 2012a). The continuum fitting method indicates a black hole spin around (Steiner et al., 2012a). Molla et al. (2017) estimated the black hole mass to be using the two-component advective flow (TCAF) solution and the correlation between photon index and frequency of the quasi-periodic oscillation (QPO).
There are eleven NuSTAR observation in the archive, three of which do not show reflection features. The other eight observations analyzed in this work are all in the hard state. The two observations from 2016 have been analyzed by Chand et al. (2020) and a truncated disk was found. However, our analysis with relxillcp model requires a disk extends to the ISCO. This difference is possibly due to the fact that we treat the inclination angle as a free parameter while in Chand et al. (2020) it is fixed at 75∘. The two 2018 observations have also been analyzed with reflection models assuming a fixed inclination angle (Stiele & Kong, 2021) and again their measurements on are larger than ours.
B.6. MAXI J1535–571
MAXI J1535–571 is a black hole candidate discovered in 2017 (Negoro et al., 2017). It is located at a distance of kpc (Chauhan et al., 2019). Previous reflection analysis indicates a high black hole spin and high inclination angle (e.g. Xu et al., 2018b; Miller et al., 2018). Following Xu et al. (2018b), we include a disk component and a distant reflection component to the full model to fit the NuSTAR data. The high inclination angle is well recovered with our fit (see Tab 5).
| Source | Date | nH | () | kTe (keV) | Incl (deg) | (solar) | ||||||
| GRS 1739-278 | 20140326 | 3431.9/3238 | ||||||||||
| GS 1354-64 | 20150613 | 2030.5/1872 | ||||||||||
| GS 1354-64 | 20150711 | 3115.3/2918 | ||||||||||
| GS 1354-64 | 20150806 | 2898.9/2821 | ||||||||||
| IGR J17091 | 20160307 | 2821.7/2751 | ||||||||||
| IGR J17091 | 20160312 | 2368.3/2409 | ||||||||||
| IGR J17091 | 20160314 | 2305.0/2321 | ||||||||||
| H 1743-322 | 20140918 | 3039.2/3006 | ||||||||||
| H 1743-322 | 20140923 | 3324.7/3187 | ||||||||||
| H 1743-322 | 20141009 | 2498.7/2605 | ||||||||||
| H 1743-322 | 20150703 | 2387.6/2416 | ||||||||||
| H 1743-322 | 20160313 | 3212.4/3088 | ||||||||||
| H 1743-322 | 20160315 | 3146.8/3060 | ||||||||||
| H 1743-322 | 20180919 | 2870.0/2814 | ||||||||||
| H 1743-322 | 20180926 | 3200.1/3019 | ||||||||||
| MAXI J1535 | 20170907 | 3481.1/3131 | ||||||||||
| V404 Cyg | 20150624 | 2027.1/2057 | ||||||||||
| V404 Cyg | 20150624 | 2578.3/2545 | ||||||||||
| V404 Cyg | 20150624 | 2632.8/2627 | ||||||||||
| V404 Cyg | 20150624 | 2284.1/2296 | ||||||||||
| V404 Cyg | 20150624 | 2209.8/2156 |
Note: The flux of the power-law and reflection component are estimated in the 0.1–100 keV band. The symbol denotes the lower or higher limits. Note that for V404 Cyg, the column density (nH) of the Galactic absorption is fixed at cm-2 and what shown in the table are for local absorption in the system (see Sec. B.4).
| Source | Date | nH | () | kTe (keV) | Incl (deg) | (solar) | |||||
| GRS 1739-278 | 20140326 | 3492.5/3239 | |||||||||
| GS 1354-64 | 20150613 | 2030.3/1873 | |||||||||
| GS 1354-64 | 20150711 | 3116.8/2919 | |||||||||
| GS 1354-64 | 20150806 | 2911.9/2822 | |||||||||
| IGR J17091 | 20160307 | 2824.3/2752 | |||||||||
| IGR J17091 | 20160312 | 2372.0/2410 | |||||||||
| IGR J17091 | 20160314 | 2305.7/2322 | |||||||||
| H 1743-322 | 20140918 | 3039.5/3007 | |||||||||
| H 1743-322 | 20140923 | 3325.4/3188 | |||||||||
| H 1743-322 | 20141009 | 2499.9/2606 | |||||||||
| H 1743-322 | 20150703 | 2389.9/2417 | |||||||||
| H 1743-322 | 20160313 | 3221.8/3089 | |||||||||
| H 1743-322 | 20160315 | 3151.4/3061 | |||||||||
| H 1743-322 | 20180919 | 2876.7/2815 | |||||||||
| H 1743-322 | 20180926 | 3203.5/3020 | |||||||||
| MAXI J1535 | 20170907 | 3483.5/3132 | |||||||||
| V404 Cyg | 20150624 | 2028.1/2058 | |||||||||
| V404 Cyg | 20150624 | 2589.0/2546 | |||||||||
| V404 Cyg | 20150624 | 2640.5/2628 | |||||||||
| V404 Cyg | 20150624 | 2288.2/2297 | |||||||||
| V404 Cyg | 20150624 | 2212.8/2157 |
Note: The flux of the power-law and reflection component are estimated in the 0.1–100 keV band. The symbol denotes the lower or higher limits. Note that for V404 Cyg, the column density (nH) of the Galactic absorption is fixed at cm-2 and what shown in the table are for local absorption in the system (see Sec. B.4).
| Source | Date | nH | () | kTe (keV) | Incl (deg) | (solar) | |||||
| GRS 1739-278 | 20140326 | 3409.5/3239 | |||||||||
| GS 1354-64 | 20150613 | 2049.0/1876 | |||||||||
| GS 1354-64 | 20150711 | 3117.3/2919 | |||||||||
| GS 1354-64 | 20150806 | 2901.7/2822 | |||||||||
| IGR J17091 | 20160307 | 2819.2/2752 | |||||||||
| IGR J17091 | 20160312 | 2367.5/2410 | |||||||||
| IGR J17091 | 20160314 | 2294.6/2322 | |||||||||
| H 1743-322 | 20140918 | 3042.7/3008 | |||||||||
| H 1743-322 | 20140923 | 3320.4/3189 | |||||||||
| H 1743-322 | 20141009 | 2503.7/2607 | |||||||||
| H 1743-322 | 20150703 | 2389.5/2417 | |||||||||
| H 1743-322 | 20160313 | 3212.6/3089 | |||||||||
| H 1743-322 | 20160315 | 3140.6/3061 | |||||||||
| H 1743-322 | 20180919 | 2878.5/2815 | |||||||||
| H 1743-322 | 20180926 | 3199.4/3020 | |||||||||
| MAXI J1535 | 20170907 | 3458.6/3132 | |||||||||
| V404 Cyg | 20150624 | 2030.6/2058 | |||||||||
| V404 Cyg | 20150624 | 2611.6/2546 | |||||||||
| V404 Cyg | 20150624 | 2720.0/2628 | |||||||||
| V404 Cyg | 20150624 | 2328.6/2297 | |||||||||
| V404 Cyg | 20150624 | 2222.3/2157 |
Note: The flux of the power-law and reflection component are estimated in the 0.1–100 keV band. The symbol denotes the lower or higher limits. Note that for V404 Cyg, the column density (nH) of the Galactic absorption is fixed at cm-2 and what shown in the table are for local absorption in the system (see Sec. B.4).