H.E.S.S. follow-up observations of GRB 221009A
Abstract
GRB 221009A is the brightest gamma-ray burst ever detected. To probe the very-high-energy (VHE, 100 GeV) emission, the High Energy Stereoscopic System (H.E.S.S.) began observations 53 hours after the triggering event, when the brightness of the moonlight no longer precluded observations. We derive differential and integral upper limits using H.E.S.S. data from the third, fourth, and ninth nights after the initial GRB detection, after applying atmospheric corrections. The combined observations yield an integral energy flux upper limit of above GeV. The constraints derived from the H.E.S.S. observations complement the available multiwavelength data. The radio to X-ray data are consistent with synchrotron emission from a single electron population, with the peak in the SED occurring above the X-ray band. Compared to the VHE-bright GRB 190829A, the upper limits for GRB 221009A imply a smaller gamma-ray to X-ray flux ratio in the afterglow. Even in the absence of a detection, the H.E.S.S. upper limits thus contribute to the multiwavelength picture of GRB 221009A, effectively ruling out an IC dominated scenario.
1 Introduction
In the last few years, several gamma-ray bursts (GRBs) have been detected in Very-High-Energy (VHE, GeV) gamma rays (Abdalla et al. (2019), H.E.S.S. Collaboration; MAGIC Collaboration et al., 2019; Abdalla et al. (2021), H.E.S.S. Collaboration). These explosive phenomena originate from the deaths of massive stars or the mergers of compact objects (e.g. Mészáros, 2002). GRBs are observed as bright flashes of gamma rays, referred to as the prompt emission, followed by long-lived and slowly evolving multiwavelength afterglow emission (see Noda & Parsons (2022) for a recent review of VHE observations of GRBs). The prompt emission is thought to come from interactions within the ultrarelativistic jet produced by the catastrophic progenitor event, though the development of accurate theoretical models of the physical mechanisms underlying the emission are challenging (Iyyani, 2022). In contrast, the afterglow is produced by the jet’s subsequent interactions with the surrounding environment, and during this time the jet is well described as a conical section of a decelerating spherical blast wave (see Dai et al., 2017, for a recent review of GRB theory). The GRB afterglow therefore provides a well-defined laboratory for studying particle acceleration under extreme conditions.
The primary emission mechanism of photons with energies GeV in the afterglow is well established as synchrotron emission by a population of accelerated charged particles. Assuming a homogeneous magnetic field, synchrotron photons can in principle extend up to a maximum energy MeV, where is the bulk Lorentz factor of the emission zone (de Jager et al., 1996; Abdalla et al. (2021), H.E.S.S. Collaboration). A second spectral component associated with inverse Compton scattering of either ambient or the synchrotron photons is expected at higher energies, though tension between observations and single-zone synchrotron self-Compton (SSC) models have been found in the VHE domain (Abdalla et al. (2021), H.E.S.S. Collaboration). The properties of any detected VHE emission therefore has important ramifications for GRB studies; the unambiguous detection of an SSC component would set constraints on the physical properties of the emission zone, while strong deviations from the expected SSC spectrum could indicate the need for a more complex set of assumptions. The two VHE-bright GRBs with the most complete data sets so far have not provided a firm conclusion on this issue (MAGIC Collaboration et al., 2019; Abdalla et al. (2021), H.E.S.S. Collaboration).
The recent GRB 221009A is the GRB with the brightest detected prompt emission, and its redshift of — corresponding to a luminosity distance of around 750 Mpc — implies an isotropic equivalent energy release in the prompt emission of the order of erg (de Ugarte Postigo et al., 2022), marking it as an extremely energetic GRB. The large and close proximity resulted in the potential detection for the first time of a GRB at energies above TeV and likely the very first detection of VHE photons during the prompt phase, by the Large High Altitude Air Shower Observatory (LHAASO) (Huang et al., 2022a). To further extend this picture and characterize the VHE emission in the afterglow, the High Energy Stereoscopic System (H.E.S.S.) observed GRB 221009A on the third night, as soon as it became possible following a period of bright moonlight. H.E.S.S. is sensitive to photons at energies above tens of GeV, and has so far detected VHE emission from two GRBs (Abdalla et al. (2019), H.E.S.S. Collaboration; Abdalla et al. (2021), H.E.S.S. Collaboration), including a detection more than 50 hours after the initial detection for GRB 190829A.
In this paper, we present the H.E.S.S. observations of GRB 221009A starting on the third night after the GRB detection. We discuss the observations themselves in Section 2, and the analysis of both H.E.S.S. data and multiwavelength data in Section 3. We find no significant emission from a source at the GRB position, and derive upper limits assuming an intrinsic spectrum. In order to place these into context, we discuss the multiwavelength modeling in Section 4, and conclude in Section 5. Throughout the paper we assume a flat CDM cosmology with H0 = 67.4 km s-1 Mpc-1 and (Planck Collaboration et al., 2020).
2 Observations
2.1 Initial detection
The detection of the prompt emission of GRB 221009A was first reported by the Fermi Gamma-Ray Burst Monitor (GBM), which triggered on the GRB on 2022-10-09 at 13:16:59 UTC (Veres et al., 2022); we refer to the GBM trigger time as T0. GeV emission was also reported by the Fermi Large Area Telescope (LAT) (Bissaldi et al., 2022). The GRB also triggered the Neil Gehrels Swift Observatory once it became visible to the Swift Burst Alert Telescope an hour later. This caused the satellite to automatically slew to the source, allowing for follow-up observations by the other instruments on Swift such as the X-Ray Telescope (XRT), which reported a localization of right ascension = 19h 13m 03s, declination = +19∘ 48’ 09” (J2000) with a positional uncertainty of 5.6” (Dichiara et al., 2022).
2.2 H.E.S.S. observations
H.E.S.S. is a system of five Imaging Atmospheric Telescopes located in the Khomas Highland of Namibia (, ) at 1800 m above sea level. Four 12-m telescopes (CT1-4) (Aharonian et al. (2006), H.E.S.S. collaboration), each with a mirror area of 108 m2, are placed in a square formation with 120 m side. A fifth, 28-m telescope (CT5) with a mirror area of m2 is placed in the center of the array (Holler et al., 2015).
| Calendar date | Interval | T [s] | T [s] | Average zenith angle [deg] | ATC |
|---|---|---|---|---|---|
| October 11 2022 | Night 3 | 49.3 | 0.46 | ||
| October 11 2022111taken under moderate moonlight | Night 3 | 52.7 | 0.44 | ||
| October 12 2022 | Night 4 | 49.6 | 0.49 | ||
| October 12 2022 | Night 4 | 52.6 | 0.45 | ||
| October 12 2022 | Night 4 | 57.0 | 0.41 | ||
| October 17 2022 | Night 9 | 51.7 | 0.47 | ||
| October 17 2022 | Night 9 | 56.9 | 0.65 |
On October 9 and 10, H.E.S.S. could not observe the GRB as the night-sky background was too high due to the full Moon. On October 11, H.E.S.S. started observations with its 12-m telescopes as soon as observing conditions allowed. During that night, an extended 32-minute observation run was taken in nominal conditions during dark time (when the Moon was still below the horizon) followed by a second run using settings optimised for observations under high levels of optical background light such as moonlight (Tomankova et al., 2022). H.E.S.S. continued observing GRB 221009A in the following nights. The observations were conducted under poor atmospheric conditions due to clouds and a higher aerosol content in the atmosphere due to the regular biomass-burning season (Formenti et al., 2019). The quality of the atmospheric conditions is quantified by the atmospheric transparency coefficient (Hahn et al., 2014) with lower values corresponding to lower transmission of Cherenkov light through the atmosphere (Table 1). Nominally accepted values of the atmospheric transparency coefficient are above 0.8. As the transparency coefficients were lower than this during the H.E.S.S. observations of this GRB, a correction procedure has been applied (discussed in the next section). Additional datasets, including ones taken on other nights, are excluded from the analysis due to further degradation of the atmospheric conditions by the presence of clouds. Unfortunately, CT5 data are not available for this study. The data taken with CT1-4 are used. Table 1 summarizes the H.E.S.S. observations used in this analysis.
3 Analysis and results
3.1 H.E.S.S. analysis
The H.E.S.S. data acquired during the follow-up period are analyzed using the ImPACT reconstruction procedure (Parsons & Hinton, 2014) which uses an image-template–based maximum likelihood fit. The hadronic background events produced by cosmic rays are rejected with a multivariate analysis scheme (Ohm et al., 2009). The results are independently cross-checked with a separate analysis chain based on the Model Analysis (de Naurois & Rolland, 2009) which performs a log-likelihood comparison between the recorded shower images and semianalytically generated templates. Moreover, in order to correct for atmospheric disturbances, we apply a scheme developed to assess the impact of the enhanced aerosol levels in the atmosphere on the instrument response functions derived from Monte-Carlo simulations. The scheme calculates a correction factor to the expected Cherenkov light by comparing the actual transmission profile with the ideal one used in the simulations. The correction is then applied by modifying a posteriori the instrument response functions and reconstructed event energies (Holch et al., 2022). These corrections are cross-checked by an analysis that uses dedicated runwise simulations taking into consideration the actual observation conditions and telescope configuration during the GRB 221009A H.E.S.S. observations following the method outlined in Holler et al. (2020). We use loose cuts (Aharonian et al. (2006), H.E.S.S. collaboration) for the selection of gamma-ray showers. In the high-level analysis, we converted our data into GADF format222https://gamma-astro-data-formats.readthedocs.io/en/latest/index.html (Deil et al., 2022), and use the open source analysis package GAMMAPY (Deil et al., 2017; Acero et al., 2022) (v1.0).
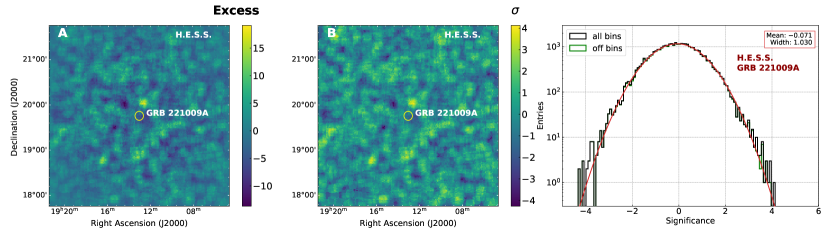
In order to search for a possible signal, and avoid accidentally including emission from other sources, we generate maps of excess gamma-ray counts and significances within a range of +/- 2.0 degrees from the expected emission position. These maps are generated using the ring background technique (Berge et al., 2007) with circular ON regions of centered at each point on the map, and corresponding annular OFF-source regions centered on the same positions with radii to deg to measure pure background. We exclude a circular region of around the expected emission region from the OFF-source regions. When computing the exposure ratio between the ON and OFF-source region at each test position, a radially-symmetric model for the background acceptance within the field of view of each observation was integrated spatially over the regions. For all three nights combined, we obtain on the position of the source events and events, with a ratio of on-source exposure to off-source exposure of 0.0638. Using the statistical formulation described in Li & Ma (1983) we calculate the excess counts to be and we find events to be in agreement with the expected background at level. The excess and significance maps are derived and shown in Figure 1.
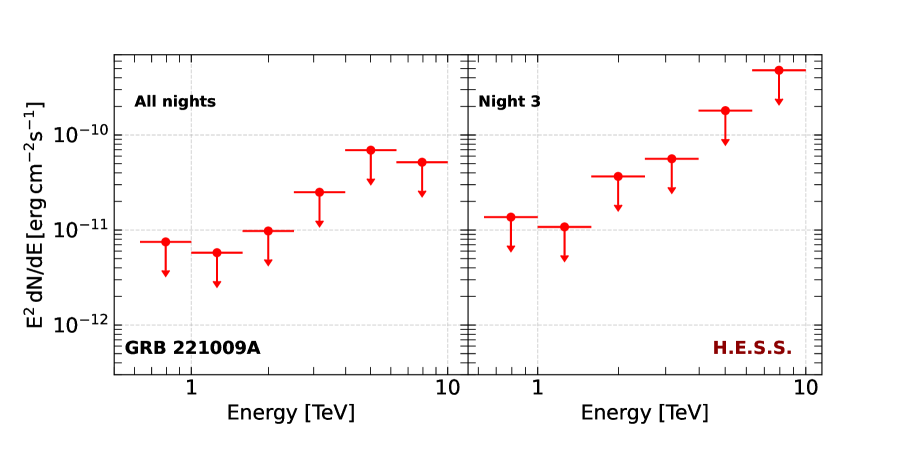
Following this analysis, we detect no significant emission of VHE gamma rays at the GRB location in the combined dataset nor for each night separately. We thus compute upper limits to constrain the VHE gamma-ray emission from the GRB at the time of H.E.S.S. observations using the Reflected Background method described in Berge et al. (2007) with same-size circular ON and OFF regions. The energy threshold sets the lower limit of the spectral analysis and is defined as the lowest energy at which the bias between reconstructed and simulated energies is below 10%. We find a value of GeV for the dataset combining all observations. We assume a generic intrinsic dN/dE spectrum, and use the redshift of the source and the model of the extragalactic background light described in Domínguez et al. (2011), and compute 95% confidence level (C.L.) flux upper limits using a Poisson likelihood method described in Rolke et al. (2005). The differential upper limits are shown in Figure 2. Detailed results are available on a dedicated webpage333https://www.mpi-hd.mpg.de/hfm/HESS/pages/publications/auxiliary/2023_GRB_221009A.
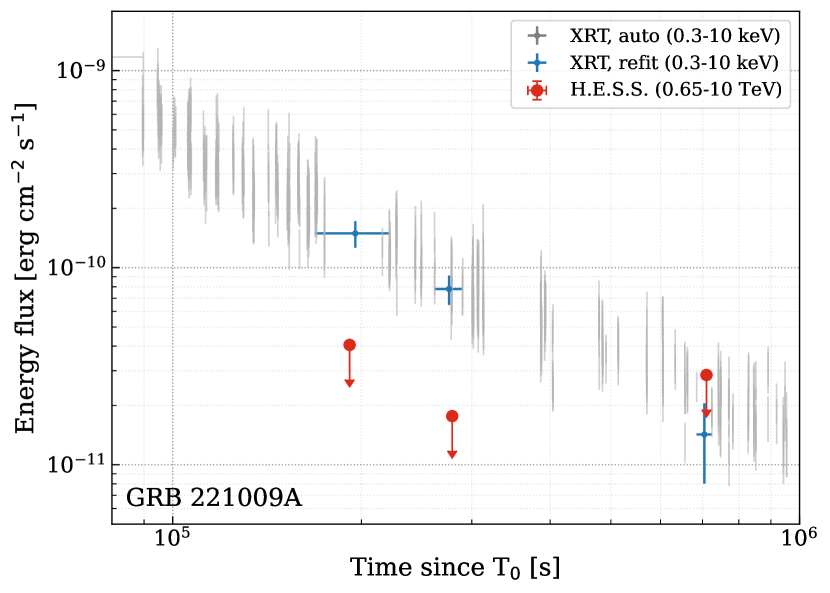
We compute integral flux upper limits between and 10 TeV for each night, where the upper bound is chosen to be the energy above which N. The upper limits of the integral energy flux are shown in Figure 7. The combined dataset yields an integral energy flux upper limit of , and per-night integral energy flux upper limits are given in Table 2. Systematic effects include uncertainties of the atmospheric corrections, the assumed intrinsic energy spectrum, differences in EBL absorption models and general uncertainties in the flux and energy scale. The systematic uncertainties are conservatively estimated to be about a factor of 2, with expected worsening of systematics with energy, for both the differential and integral upper limits on the gamma-ray flux.
3.2 Swift-XRT analysis
Swift-XRT is an X-ray imaging spectrometer with an energy range of 0.3 to 10 keV (Burrows et al., 2005). The XRT data are obtained using the Time-Sliced Spectra tool444https://www.swift.ac.uk/xrt_spectra/addspec.php?targ=01126853&origin=GRB (Evans et al., 2009). The time intervals are chosen to overlap with the H.E.S.S. observations. There are no simultaneous XRT observations on two of the three H.E.S.S. nights, so we instead define the time ranges in such a way that they encompass one set of contiguous XRT observations immediately before and after the H.E.S.S. observations. However, using this rule for the first night of H.E.S.S. observations resulted in a too-low XRT exposure time. Hence, for this night we extend the time range to include two sets of contiguous XRT observations on either side. (Note that, as we are using larger time bins for the XRT observations, we are underestimating what the true uncertainties would be for strictly contemporaneous observations.) In our analyses, we only include Photon Counting (PC) data. By using the data products from the Time-Sliced Spectra tool and selecting only the PC mode data, we avoid contamination from the dust rings (Tiengo et al., 2022; Evans, 2022).
| Interval | Time since T0 | XRT en. flux | H.E.S.S. en. flux UL | |||
|---|---|---|---|---|---|---|
| [s] | [ph keV-1 cm-2 s-1] | [erg cm-2 s-1] | [erg cm-2 s-1] | |||
| Night 3 | 4.06 | |||||
| Night 4 | 1.77 | |||||
| Night 9 | 2.85 | |||||
The XRT data are fit using XSPEC v12.13.0c with a power law of the form ( keV) and two absorption components (Evans et al., 2009). More specifically, we fit the data with the model TBabs * zTBabs * powerlaw with the Galactic column density cm-2 (Willingale et al., 2013). We simultaneously fit the three nights with the column density at the source tied across all spectra but free to vary, under the assumption that the intrinsic absorption does not vary on these timescales. We keep and free in each time interval. We define the fitting statistic to be the C-statistic555https://heasarc.gsfc.nasa.gov/xanadu/xspec/manual/XSappendixStatistics.html, suitable for XRT data. Assuming a constant , we obtain cm-2. The results are presented in Table 2 and plotted in Figure 7, and are compatible with those presented in Williams et al. (2023), which similarly reports a softening in the X-ray spectrum on these timescales.
The assumption of constant column density on these timescales has been challenged in other GRBs, recently by Campana et al. (2021) for GRB 190114C. For GRB 221009A, indications of a higher degree of absorption at earlier times have indeed been noted in the optical data (Fulton et al., 2023). Because there is some degeneracy between the effects of and (e.g., a larger value of can be somewhat compensated by a softer value of ) this also has an effect on the returned best-fit photon spectrum. If is indeed higher around Night 3 ( 2 days after T0) than the later nights, then the true value of for Night 3 should be softer than the returned 1.7 and therefore more similar to the value of 1.9 that we find for the other two H.E.S.S. nights (although we note that the indices are consistent within 2). A thorough study of this effect is beyond the scope of this paper, so for the purposes of the discussion in Section 4, we do not require that our modeling explain the XRT data on Night 3 very strictly.
3.3 Fermi-LAT analysis
The Fermi-LAT is a pair conversion telescope that detects gamma rays between tens of MeV and hundreds of GeV (Atwood et al., 2009). We perform an unbinned likelihood analysis of Fermi-LAT data over time ranges spanning each set of H.E.S.S. observations (Table 1) using gtBurst v. 03-00-00p5 (Vianello, 2016). We use the P8R3_SOURCE event class, recommended for analyses on these timescales, and the corresponding instrument response functions888https://fermi.gsfc.nasa.gov/ssc/data/analysis/documentation/Cicerone/Cicerone_LAT_IRFs/IRF_overview.html. We select events in the energy range 100 MeV and 10 GeV within 12∘ of the burst position and a zenith angle cut of 100∘. We use the PowerLaw2 model999https://fermi.gsfc.nasa.gov/ssc/data/analysis/scitools/source_models.html for the GRB spectrum, and the latest Galactic (fixed normalization) and isotropic templates for the background101010https://fermi.gsfc.nasa.gov/ssc/data/access/lat/BackgroundModels.html, and include all catalog sources (Abdollahi et al., 2020) within 20∘ of the GRB position. No significant emission from the GRB (Test Statistics ) is observed in the Fermi-LAT data during the H.E.S.S. observations, so 95% C.L. upper limits are computed assuming an spectrum. We find differential energy flux upper limits (between 100 MeV and 10 GeV) of and erg cm-2 s-1 during Night 3 and Night 4, respectively; the upper limit for Night 3 is shown in Figure 4.
4 Discussion
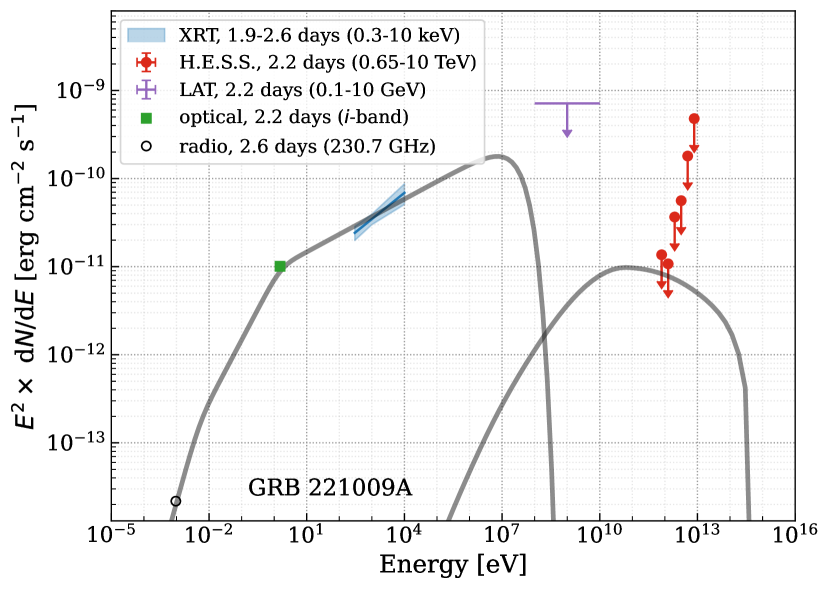
The H.E.S.S. upper limits, when combined with multiwavelength observations, can be used to constrain possible emission scenarios of GRB 221009A several days after the prompt event. Figure 4 shows the spectral energy distribution (SED) including the results of the H.E.S.S., XRT, and LAT analyses. Also included are the optical -band flux during the time of the H.E.S.S. observations (extracted from Figure 2 of Fulton et al., 2023) and a publicly available radio observation (Rhodes et al., 2022) that most closely matches the time window of the first night of H.E.S.S. observations.
The SEDs on all nights during which H.E.S.S. measurements took place are consistent with synchrotron emission from a single electron population. In such a model, the synchrotron spectrum peaks above the energy range covered by the XRT, implying Klein Nishina (KN) suppression of any inverse Compton (IC) component. For IC-dominated cooling, KN suppression could account for the hard cooled spectrum of electrons emitting in the XRT range (e.g. Agaronyan & Ambartsumyan, 1985; Nakar et al., 2009; Breuhaus et al., 2021). However, this is difficult to reconcile with the H.E.S.S. upper limits in the VHE range, as electrons producing X-ray photons via synchrotron emission should produce a comparable or greater gamma-ray flux via their IC emission. The energy density of optical photons was insufficient for internal absorption of TeV photons, while the LHAASO detection suggests that absorption on a local external field was unlikely. Ruling out IC-dominated cooling, we consider instead models in which synchrotron dominated cooling can account for the multiwavelength observations. We adopt a single-zone thin shell model (see Huang et al., 2022b), assuming self-similar expansion of a relativistic shock following an impulsive point-like explosion (Blandford & McKee, 1976).
Within this model, we assume the radio to X-ray emission is produced by single population of continuously injected electrons. The photon index of the XRT emission (see Table 2) was consistent with on all nights (see also Williams et al., 2023). Data from the Nuclear Spectroscopic Telescope Array (NuSTAR) indicate this spectrum continued unbroken above the XRT range (Laskar et al., 2023). These measurements imply either an uncooled electron population , or the cooled spectrum assuming continuous injection: . Here is the electron Lorentz factor in the fluid frame. For the cooling break to remain above the NuSTAR range (3-79 keV), requires specific conditions (see for example Huang et al., 2022b, eq. 14). This scenario was considered by Laskar et al. (2023), who modelled the synchrotron component assuming a wind profile. To match the measured flux, more than half of the downstream internal energy needs to be converted to non-thermal electrons and magnetic field energy, with these two components being in near equipartition. The SSC flux is negligible in such a scenario. To maintain the cooling break above the X-ray range requires a low mass loss rate, and though low mass loss rates are expected from the polar regions of low-metallicity stars (Muijres et al., 2012), it is unclear if such a wind profile can be sustained over a large distance from the progenitor.
We consider the alternative possibility of a cooled hard injection spectrum, comparing against the first night of H.E.S.S. observations. To match the flux levels, we introduce a parameter , the ratio of non-thermal particle density flux, to the particle density flux downstream. The injection energy is left as a free parameter, and since the total integrated energy for an injection spectrum with index is determined by the maximum electron energy, the is fixed by the energy efficiency. The model parameters provided in Table 3 were chosen to match the selected measurements, while just reaching the H.E.S.S. upper limits. The cooling break in the synchrotron component occurs between the radio and optical data points, at a flux level comparable to the H.E.S.S. upper limit. As synchrotron cooling dominates for the chosen parameters, the corresponding IC flux remains below the upper limits.
| Explosion energy | erg |
|---|---|
| External density | cm-3 |
| Injection fraction | |
| Electron equipartition fraction | |
| Magnetic equipartition fraction | (G) |
5 Summary and conclusion
H.E.S.S. began observing GRB 221009A approximately 53 hours after the initial Fermi-GBM detection. The observations were taken under less-than-optimal atmospheric conditions caused by clouds and aerosols. No significant VHE signal is detected on the third, fourth, and ninth nights after the detection, nor in the combined dataset of all three nights. When combining the data from all three nights, we find a 95% upper limit on the 0.65–10 TeV energy flux of .
The H.E.S.S. upper limits help constrain possible emission scenarios when compared with the multiwavelength observations. The X-ray spectra on the three H.E.S.S. nights were found to remain hard, with photon indices ranging from 1.7 to 1.9. Taken together with the approximately contemporaneous optical and radio data, these measurements suggest synchrotron emission from a single electron population, with continuous injection of either an uncooled soft spectrum, or a cooled hard spectrum. The photon energy spectrum peaks above the XRT range, (and also that of the NuSTAR, Laskar et al., 2023) and KN suppression of any inverse Compton emission is unavoidable. An IC-dominated loss scenario appears to be ruled out by the H.E.S.S. upper limits. In contrast, the multiwavelength SED of the nearby low-luminosity GRB 190829A, which was detected at TeV energies three nights after the prompt emission, was better described by a single component from X-rays to VHE gamma rays. Those data were consistent with photon indices for both the XRT and H.E.S.S. energy ranges on all nights (Abdalla et al. (2021), H.E.S.S. Collaboration). The results from GRB 221009A, potentially the brightest ever detected GRB, highlight the distinct character of these two bursts, both in terms of their non-thermal particle acceleration and emission properties. As discussed in Abdalla et al. (2021) (H.E.S.S. Collaboration) (see also Huang et al., 2022b; Salafia et al., 2022), an accurate reproduction of the MWL observations of GRB 190829A is challenging within a single-zone SSC framework. Other theoretical models put forward to account for the multiwavelength measurements of GRB 190829A, including external Compton (Zhang et al., 2021) or two-zone (Khangulyan et al., 2023) models serve to highlight the necessity for high quality spectral and temporal data of GRBs and their afterglows at all available wavelengths to understand the underlying physical mechanisms at play.
With upper-limits in the VHE band, we consider only a single-zone model for the first night of H.E.S.S. observations, assuming an electron population whose cooled spectrum is consistent with the inferred XRT spectrum. An alternative uncooled electron scenario was considered in Laskar et al. (2023) (see also Sato et al., 2022). The hard injection scenario requires a spectral index deviating substantially from that predicted from shock acceleration theory (e.g. Achterberg et al., 2001). Harder spectra have been predicted from other acceleration schemes such as relativistic shear acceleration (Rieger & Duffy, 2005) or converter mechanisms (Derishev et al., 2003; Stern, 2003; Derishev & Piran, 2019). A detailed consideration of the underlying acceleration process is however beyond the scope of the current paper, though the emerging multiwavelength dataset for GRB 221009A will provide a valuable data set for future theoretical studies. Our results highlight the role imaging atmospheric Cherenkov telescopes have in improving our understanding of these powerful transient events.
Acknowledgments
We thank Lauren Rhodes for discussions on the radio and optical data, and Phil Evans for assistance in analyzing XRT data. This work made use of data supplied by the UK Swift Science Data Centre at the University of Leicester.
The support of the Namibian authorities and of the University of Namibia in facilitating the construction and operation of H.E.S.S. is gratefully acknowledged, as is the support by the German Ministry for Education and Research (BMBF), the Max Planck Society, the German Research Foundation (DFG), the Helmholtz Association, the Alexander von Humboldt Foundation, the French Ministry of Higher Education, Research and Innovation, the Centre National de la Recherche Scientifique (CNRS/IN2P3 and CNRS/INSU), the Commissariat à l’énergie atomique et aux énergies alternatives (CEA), the U.K. Science and Technology Facilities Council (STFC), the Irish Research Council (IRC) and the Science Foundation Ireland (SFI), the Knut and Alice Wallenberg Foundation, the Polish Ministry of Education and Science, agreement no. 2021/WK/06, the South African Department of Science and Technology and National Research Foundation, the University of Namibia, the National Commission on Research, Science & Technology of Namibia (NCRST), the Austrian Federal Ministry of Education, Science and Research and the Austrian Science Fund (FWF), the Australian Research Council (ARC), the Japan Society for the Promotion of Science, the University of Amsterdam and the Science Committee of Armenia grant 21AG-1C085. We appreciate the excellent work of the technical support staff in Berlin, Zeuthen, Heidelberg, Palaiseau, Paris, Saclay, Tübingen and in Namibia in the construction and operation of the equipment. This work benefited from services provided by the H.E.S.S. Virtual Organisation, supported by the national resource providers of the EGI Federation.
References
- Abdalla et al. (2019) (H.E.S.S. Collaboration) Abdalla et al. (H.E.S.S. Collaboration). 2019, Nature, 575, 464
- Abdalla et al. (2021) (H.E.S.S. Collaboration) Abdalla et al. (H.E.S.S. Collaboration). 2021, Science, 372, 1081
- Abdollahi et al. (2020) Abdollahi, S., Acero, F., Ackermann, M., et al. 2020, ApJS, 247, 33
- Acero et al. (2022) Acero, F., Aguasca-Cabot, A., Buchner, J., et al. 2022, if you use this software, please cite it using the metadata from this file.
- Achterberg et al. (2001) Achterberg, A., Gallant, Y. A., Kirk, J. G., & Guthmann, A. W. 2001, MNRAS, 328, 393
- Agaronyan & Ambartsumyan (1985) Agaronyan, F. A. & Ambartsumyan, A. S. 1985, Astrophysics, 23, 650
- Aharonian et al. (2006) (H.E.S.S. collaboration) Aharonian et al. (H.E.S.S. collaboration). 2006, A&A, 457, 899
- Arnaud (1996) Arnaud, K. A. 1996, in Astronomical Society of the Pacific Conference Series, Vol. 101, Astronomical Data Analysis Software and Systems V, ed. G. H. Jacoby & J. Barnes, 17
- Astropy Collaboration et al. (2022) Astropy Collaboration, Price-Whelan, A. M., Lim, P. L., et al. 2022, ApJ, 935, 167
- Atwood et al. (2009) Atwood, W. B., Abdo, A. A., Ackermann, M., et al. 2009, ApJ, 697, 1071
- Berge et al. (2007) Berge, D., Funk, S., & Hinton, J. 2007, A&A, 466, 1219
- Bissaldi et al. (2022) Bissaldi, E., Omodei, N., Kerr, M., & Fermi-LAT Team. 2022, GRB Coordinates Network, 32637, 1
- Blandford & McKee (1976) Blandford, R. D. & McKee, C. F. 1976, Physics of Fluids, 19, 1130
- Breuhaus et al. (2021) Breuhaus, M., Hahn, J., Romoli, C., et al. 2021, ApJ, 908, L49
- Burrows et al. (2005) Burrows, D. N., Hill, J. E., Nousek, J. A., et al. 2005, Space Sci. Rev., 120, 165
- Campana et al. (2021) Campana, S., Lazzati, D., Perna, R., Grazia Bernardini, M., & Nava, L. 2021, A&A, 649, A135
- Dai et al. (2017) Dai, Z., Daigne, F., & Mészáros, P. 2017, Space Sci. Rev., 212, 409
- de Jager et al. (1996) de Jager, O. C., Harding, A. K., Michelson, P. F., et al. 1996, ApJ, 457, 253
- de Naurois & Rolland (2009) de Naurois, M. & Rolland, L. 2009, Astroparticle Physics, 32, 231
- de Ugarte Postigo et al. (2022) de Ugarte Postigo, A., Izzo, L., Pugliese, G., et al. 2022, GRB Coordinates Network, 32648, 1
- Deil et al. (2022) Deil, C., Wood, M., Hassan, T., et al. 2022, Data formats for gamma-ray astronomy - version 0.3
- Deil et al. (2017) Deil, C., Zanin, R., Lefaucheur, J., et al. 2017, in International Cosmic Ray Conference, Vol. 301, 35th International Cosmic Ray Conference (ICRC2017), 766
- Derishev & Piran (2019) Derishev, E. & Piran, T. 2019, ApJ, 880, L27
- Derishev et al. (2003) Derishev, E. V., Aharonian, F. A., Kocharovsky, V. V., & Kocharovsky, V. V. 2003, Phys. Rev. D, 68, 043003
- Dichiara et al. (2022) Dichiara, S., Gropp, J. D., Kennea, J. A., et al. 2022, GRB Coordinates Network, 32632, 1
- Domínguez et al. (2011) Domínguez, A., Primack, J. R., Rosario, D. J., et al. 2011, MNRAS, 410, 2556
- Evans (2022) Evans, P. A. 2022, private communication
- Evans et al. (2009) Evans, P. A., Beardmore, A. P., Page, K. L., et al. 2009, MNRAS, 397, 1177
- Evans et al. (2010) Evans, P. A., Willingale, R., Osborne, J. P., et al. 2010, A&A, 519, A102
- Formenti et al. (2019) Formenti, P., D’Anna, B., Flamant, C., et al. 2019, Bulletin of the American Meteorological Society, 100, 1277
- Fulton et al. (2023) Fulton, M. D., Smartt, S. J., Rhodes, L., et al. 2023, The optical light curve of GRB 221009A: the afterglow and detection of the emerging supernova SN 2022xiw, https://arxiv.org/abs/2301.11170
- Hahn et al. (2014) Hahn, J., de los Reyes, R., Bernlöhr, K., et al. 2014, Astroparticle Physics, 54, 25
- Harris et al. (2020) Harris, C. R., Millman, K. J., van der Walt, S. J., et al. 2020, Nature, 585, 357
- Holch et al. (2022) Holch, T. L., Leuschner, F., Schäfer, J., & Steinmassl, S. 2022, Journal of Physics: Conference Series, 2398, 012017
- Holler et al. (2020) Holler, M., Lenain, J. P., de Naurois, M., Rauth, R., & Sanchez, D. A. 2020, Astroparticle Physics, 123, 102491
- Holler et al. (2015) Holler, M. et al. 2015, PoS, ICRC2015, 847
- Huang et al. (2022a) Huang, Y., Hu, S., Chen, S., et al. 2022a, GRB Coordinates Network, 32677, 1
- Huang et al. (2022b) Huang, Z.-Q., Kirk, J. G., Giacinti, G., & Reville, B. 2022b, ApJ, 925, 182
- Hunter (2007) Hunter, J. D. 2007, Computing in Science & Engineering, 9, 90
- Iyyani (2022) Iyyani, S. 2022, Journal of Astrophysics and Astronomy, 43, 37
- Khangulyan et al. (2023) Khangulyan, D., Taylor, A. M., & Aharonian, F. 2023, arXiv e-prints, arXiv:2301.08578
- Laskar et al. (2023) Laskar, T., Alexander, K. D., Margutti, R., et al. 2023, arXiv e-prints, arXiv:2302.04388
- Li & Ma (1983) Li, T.-P. & Ma, Y. 1983, ApJ, 272, 317
- MAGIC Collaboration et al. (2019) MAGIC Collaboration, Acciari, V. A., Ansoldi, S., et al. 2019, Nature, 575, 455
- Mészáros (2002) Mészáros, P. 2002, ARA&A, 40, 137
- Muijres et al. (2012) Muijres, L., Vink, J. S., de Koter, A., et al. 2012, A&A, 546, A42
- Nakar et al. (2009) Nakar, E., Ando, S., & Sari, R. 2009, ApJ, 703, 675
- Noda & Parsons (2022) Noda, K. & Parsons, R. D. 2022, Galaxies, 10, 7
- Ohm et al. (2009) Ohm, S., van Eldik, C., & Egberts, K. 2009, Astroparticle Physics, 31, 383
- Parsons & Hinton (2014) Parsons, R. D. & Hinton, J. A. 2014, Astroparticle Physics, 56, 26
- Planck Collaboration et al. (2020) Planck Collaboration, Aghanim, N., Akrami, Y., et al. 2020, A&A, 641, A6
- Rhodes et al. (2022) Rhodes, L., Huang, K., & Cendes, Y. 2022, GRB Coordinates Network, 32707, 1
- Rieger & Duffy (2005) Rieger, F. M. & Duffy, P. 2005, ApJ, 632, L21
- Rolke et al. (2005) Rolke, W. A., López, A. M., & Conrad, J. 2005, Nuclear Instruments and Methods in Physics Research A, 551, 493
- Salafia et al. (2022) Salafia, O. S., Ravasio, M. E., Yang, J., et al. 2022, ApJ, 931, L19
- Sato et al. (2022) Sato, Y., Murase, K., Ohira, Y., & Yamazaki, R. 2022, arXiv e-prints, arXiv:2212.09266
- Stern (2003) Stern, B. E. 2003, MNRAS, 345, 590
- Tiengo et al. (2022) Tiengo, A., Pintore, F., Mereghetti, S., Salvaterra, R., & a larger Collaboration. 2022, GRB Coordinates Network, 32680, 1
- Tomankova et al. (2022) Tomankova, L., Yusafzai, A., Kostunin, D., et al. 2022, Zenodo, https://doi.org/10.5281/zenodo.7400326
- Veres et al. (2022) Veres, P., Burns, E., Bissaldi, E., et al. 2022, GRB Coordinates Network, 32636, 1
- Vianello (2016) Vianello, G. 2016, gtburst: Release for Zenodo
- Williams et al. (2023) Williams, M. A., Kennea, J. A., Dichiara, S., et al. 2023, arXiv e-prints, arXiv:2302.03642
- Willingale et al. (2013) Willingale, R., Starling, R. L. C., Beardmore, A. P., Tanvir, N. R., & O’Brien, P. T. 2013, MNRAS, 431, 394
- Zhang et al. (2021) Zhang, B. T., Murase, K., Veres, P., & Mészáros, P. 2021, ApJ, 920, 55