Igneous Rim Accretion on Chondrules in Low-Velocity Shock Waves
Abstract
Shock wave heating is a leading candidate for the mechanisms of chondrule formation. This mechanism forms chondrules when the shock velocity is in a certain range. If the shock velocity is lower than this range, dust particles smaller than chondrule precursors melt, while chondrule precursors do not. We focus on the low-velocity shock waves as the igneous rim accretion events. Using a semi-analytical treatment of the shock-wave heating model, we found that the accretion of molten dust particles occurs when they are supercooling. The accreted igneous rims have two layers, which are the layers of the accreted supercooled droplets and crystallized dust particles. We suggest that chondrules experience multiple rim-forming shock events.
1 Introduction
Chondrules are a major ingredient of chondritic meteorites (up to 80% in volume). They are roughly millimeter-sized spherical igneous grains (e.g., Scott, 2007). Their spherical and igneous features are reproduced when their precursor grains were molten through flash heating events and cooled in the solar nebula (e.g., Hewins et al., 2005). Chondrules are often surrounded by rims. Rims are divided into two major groups: fine-grained rims and igneous rims. Fine-grained rims resemble the matrix and are considered as the formation by the accretion of fine-grained dust onto chondrules (e.g., Ashworth, 1977; Hanna & Ketcham, 2018). Igneous rims are composed of coarse grains and show evidence of appreciable melting during flash heating events similar to chondrule formation ones (e.g., Rubin, 1984; Matsuda et al., 2019). These rims provide information about their accretion and heating events, which are additional information about chondrule-forming environments.
The formation process of igneous rims is often interpreted as the melting of preexisting fine-grained rims (e.g., Rubin, 1984, 2010). This interpretation is consistent with multiple melting events of chondrules (e.g., Rubin & Wasson, 1987; Wasson, 1993; Baecker et al., 2017). However, this does not provide the explanation for the larger thicknesses of igneous rims compared to fine-grained rims (Matsumoto et al., 2021), the isotopic relations between igneous rims and their host chondrules (Jacquet et al., 2015), or the association between igneous rims and fine-grained rims (Pinto et al., 2022). Additional mechanisms would work to form igneous rims, such as the accretion of droplets (Jacquet et al., 2013, 2015).
A plausible event for droplet formation is heating events similar to chondrule formation events. Several mechanisms have been proposed for the chondrule formation events, such as shock waves (e.g., Hood & Horanyi, 1991; Iida et al., 2001), planetesimal collisions (e.g., Asphaug et al., 2011; Johnson et al., 2015; Wakita et al., 2017), and lightning (e.g., Horányi et al., 1995; Johansen & Okuzumi, 2018). Miura & Nakamoto (2005) reported that sized dust particles are molten and become droplets in the shock wave heating events when the shock speed is lower than that in chondrule formation events. This size is the minimum one of the dust particles that can survive in shock wave heating events, and dust particles smaller than this size evaporate away completely (see also Jacquet & Thompson, 2014). If chondrules accrete these droplets in the postshock region, the droplets form igneous rims.
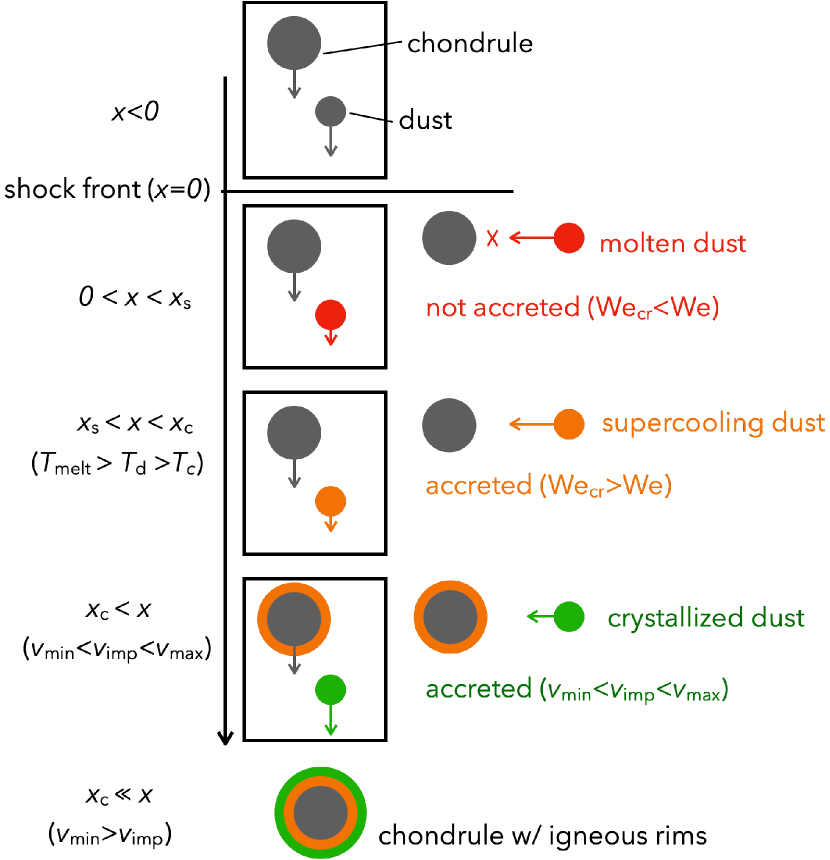
In this paper, we have investigated the accretion of igneous rims in the postshock regions. We consider the dynamical and thermal evolution of chondrules and dust particles behind the shock front and evaluate whether molten droplets are accreted onto chondrules. Our model is described in Section 2. We find the igneous rims are accreted behind the shock front. Figure 1 is a schematic figure of igneous rim accretion. We show how rims are accreted behind the shock front in Section 3. In Section 4, we summarize our results and discuss the accretion of the igneous rims.
2 Model
The dynamical and thermal evolution of chondrules behind the shock front are investigated by the studies of chondrule collisions (e.g., Nakamoto & Miura, 2004; Ciesla, 2006; Jacquet & Thompson, 2014; Arakawa & Nakamoto, 2019) and the accretion of fine-grained rims around chondrules (Arakawa et al., 2022) using one-dimensional normal shock models. In this paper, we adopt the one-dimensional normal shock model, which is based on Arakawa & Nakamoto (2019) and Arakawa et al. (2022), and modified it to roughly reproduce the results in Miura & Nakamoto (2005).
2.1 Gas Structure
We assume a simple gas structure. In our model, the gas velocity with respect to the shock front, , is expressed as a function of the distance from the shock front, :
| (3) |
where is the pre-shock gas velocity with respect to the shock front, namely, shock velocity, is the post-shock gas velocity with respect to the shock front, and is the spatial scale of the shock. The post-shock gas velocity is given by the Rankine–Hugoniot relations as , where is the ratio of specific heats, . We take as a parameter and its fiducial value is km (Miura & Nakamoto, 2005). The temperature of the gas, , is
| (6) |
where the preshock gas temperature is K and the post-shock gas temperature is K. The postshock region is approximately isobaric (e.g., Susa et al., 1998; Iida et al., 2001). According to the Rankine–Hugoniot relation, the gas number density in the postshock region, , can be expressed by
| (7) |
where is the preshock gas number density, , is the Boltzmann constant, and g is the gas molecule mass.
2.2 Dynamical and Temperature Evolution of Chondrules and Dust
In the postshock region, the velocities of chondrules and dust particles with respect to the shock front are given by
| (8) |
where , , and are the velocity, mass, and radius of a chondrule or particle. We consider the radii of chondrules, , and initial dust particles, , as parameters, and their fiducial values are m and m. The densities of the chondrules and the dust particles are the same, , whose values are taken from the typical values for chondrules (e.g., Hughes, 1978; Friedrich et al., 2015). This density is close to that of forsterite, from which we take the other material properties in this paper. The drag coefficient, , is given by (Arakawa et al., 2022)
where . This approximation works well when or . Either condition is satisfied behind the shock front when dust particles are molten.
The temperatures of chondrules and dust are derived by the equations of energy,
| (10) |
where is the specific heat, is the heating rate via the energy transfer from gas, is the radiative cooling, and is the latent heat cooling by evaporation per unit area, respectively (e.g., Miura et al., 2002; Miura & Nakamoto, 2005). The heating rate via the energy transfer from gas is given by
| (11) |
where the recovery temperature, , and the heat transfer function, , are (e.g., Gombosi et al., 1986)
| (12) | |||||
and
respectively. The radiative cooling rate is given by
| (14) |
where is the emission coefficient and is the Stefan–Boltzmann constant. The emission coefficient is (Rizk et al., 1991; Miura & Nakamoto, 2005)
| (15) |
The latent heat cooling by evaporation is the product of the evaporation rate, , and the latent heat of evaporation, ,
| (16) |
where is
| (17) | |||||
for forsterite (Miura et al., 2002; Miura & Nakamoto, 2005), and (Miura et al., 2002)111 We note that the effect of the net gas-grain flow on the product of the evaporation rate, which is unclear, is not included. . The ambient gas pressure, , is the summation of the hydrostatic pressure and the ram pressure,
| (18) |
and the melting temperature is K. The latent heat cooling by evaporation becomes effective when the temperature of dust or a chondrule approaches the melting temperature.
Dust particles begin to melt when their temperature reaches the melting temperature. According to Miura & Nakamoto (2005), we consider the phase transition of chondrules and dust between the solid and liquid. We express the phase transition by the solid (unmelted) mass fraction, ,
| (19) |
where is the latent heat of melting. During the phase transition (), we assume that the temperature of a chondrule or dust remains constant and the net energy input is used for the phase transition. Molten dust particles crystallize according to the cooling. Droplets, which are dust particles with , do not solidify immediately at since they cause supercooling (e.g., Nagashima et al., 2006, 2008; Arakawa & Nakamoto, 2016). In this study, we assume that the crystallization temperature of droplets is K. For simplicity, we do not consider collisions between droplets that cause crystallization (e.g., Arakawa & Nakamoto, 2016).
We consider the size evolution of dust particles. The size change of dust particles, , is given by the summation of its contribution from boiling and evaporation:
| (20) |
Dust particles boil when their vapor pressure, , exceeds the gas pressure, (Miura et al., 2002), where
| (21) |
The boiling rate of a dust particle is
where is the latent heat of boiling. The size of a dust particle also decreases due to evaporation from the precursor surface, and its rate is
| (23) |
Miura & Nakamoto (2005) showed that evaporation is the main mechanism to shrink the dust size since the period of dust boiling is very short. We do not consider the size evolution of chondrules since evaporation works more for smaller grains.
2.3 Accretion of Rims
Chondrules accrete droplets and/or crystallized them in the postshock region due to their relative velocities. The accretion rate is
| (24) |
where is the accretion efficiency, is the number density of the dust particles, and is the impact velocity. We simply consider that the number density of the dust particles is
| (25) |
where the dust-to-gas ratio is set at 0.1. This is higher than 0.01 (the column dust-to-gas mass ratio in the minimum mass solar nebula (Hayashi, 1981)), considering that chondrules and igneous rims are accreted in dusty environments (Rubin, 2010; Schrader et al., 2013; Tenner et al., 2015). We do not consider the evolution of behind the shock front. This is because the dust particles are expected to be well coupled to the gas at the location of accretion. The final accreted rim thicknesses can be scaled by . We note that the realistic value is affected by dust velocity, accretion from chondrules, dust recondensation, dust evaporated from planetesimals (Tanaka et al., 2013; Arakawa et al., 2022) and disruption in collisions (e.g., Jacquet & Thompson, 2014; Liffman, 2019). The growth rate of the rim thickness is given by
| (26) |
under the assumption that the density of the accreted rim is the same as . The average thickness of the rims, , is the difference between the chondrule size and the size of the chondrules with the accreted rims.
We consider the accretion criteria for molten dust particles and solid dust particles. For molten dust particles, we consider the accretion criteria of the molten (or partially molten) particles on the solid chondrules. The accretion condition between molten (or partially molten) particles is given by the Weber number, , which is the ratio of the impact energy to the surface energy,
| (27) |
where is the surface tension (Murase & McBirney, 1973). According Mundo et al. (1995), we consider that molten dust particles are accreted when the Weber number is smaller than the critical Weber number for accretion,
| (28) |
where –3 is the ratio of the maximum spreading diameter of the droplet to its initial diameter (Chandra & Avedisian, 1991), is the contact angle, and is the capillary number,
| (29) |
which is the function of the viscosity, , (Hubbard, 2015)
| (30) |
We ignore the dependence of the viscosity on the solid mass fraction (e.g., Roscoe, 1952; Liu et al., 2018) since droplets are rapidly crystallized in the postshock region and the temperature dependence is stronger. We simply adopt the maximum values by taking and . These values do not affect results much since the critical Weber number is significantly affected by , i.e., , and . We assume when , otherwise , for molten dust particles.
The accretion efficiency of solid dust particles is
| (33) |
where , , and , taking from the fiducial case of Arakawa et al. (2022). The velocity range of the accretion is based on the experimental studies, which consider the adhesion of ceramic particles on a ceramic substrate (e.g., Hanft et al., 2015). Dust particles with impact velocities less than bounce and do not stick. We ignore erosion in high-velocity collisions. We do not consider collisions between dust particles.
3 Results
3.1 Typical Accretion
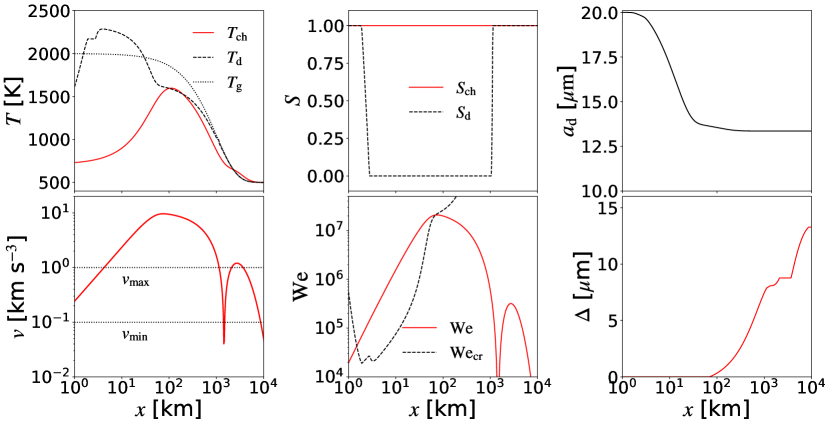
We explain how igneous rims are accreted behind the shock front in our fiducial case, with , , , , and . The temperature of the dust particles increases quickly and reaches the melting temperature (the top left panel of Figure 2). The temperature of the dust particles is constant during melting, and it increases again after they become droplets (, the top middle panel of Figure 2). The temperature of the droplets becomes peaked at km when the heating rate is balanced with the cooling rate, which becomes higher as the temperature increases. Droplets are cooled by evaporation, initially, and then radiation. Droplets are crystallized at . Through this evolution, the dust size shrinks and the final size is 13 m (the top right panel of Figure 2).
Chondrules are also heated and they reach the peak temperature at km. The peak temperature is lower than the melting temperature. This is because chondrules have a higher radiative cooling rate than dust since the emission coefficient increases as the size of the particle increases (Equation 15). Chondrules do not melt and is always 1.
The impact velocity between chondrules and dust particles initially increases (the bottom left panel of Figure 2). Due to the stopping length dependence on the size,
the relative velocity of a dust particle to the gas decreases, and that of a chondrule does not change. The impact velocity becomes maximum, , which is close to , at km. The impact velocity decreases as the relative velocity of a chondrule to gas decreases. The impact velocity once reaches 0 but increases again (Arakawa & Nakamoto, 2019; Arakawa et al., 2022, see also Appendix A). The second peak impact velocity is at km, and then the impact velocity decreases.
The Weber number and the critical Weber number are given by the temperature and impact velocity and are shown in the bottom middle panel of Figure 2. The Weber number is larger than the critical Weber number during . The Weber number peaks at km and begins to decrease, reflecting its dependence. The critical Weber number continues to increase due to its temperature dependence. As a result, the Weber number becomes smaller than the critical Weber number at km, where dust is in the supercooling state ( K). The condition of the droplet accretion () is satisfied in the supercooling state since
| (35) | |||||
which is about 1600 K. The droplet accretion occurs in . The droplet accretion stops when the supercooling droplets crystallize at km. Through the droplet accretion, chondrules acquire m igneous rims (the bottom right panel of Figure 2).
The crystallized dust particles continue to be accreted onto chondrules. When the dust particles crystallize at km, the impact velocity is and decreasing. Dust particles are accreted except around the second peak impact velocity, where . Finally, the thickness of an igneous rim becomes m222 The rim thickness is less than the final dust size, indicating that the thickness is not uniform. .
We find that two stages of the accretion of igneous rims: droplet accretion and subsequent crystallized dust accretion (see Figure 1). The component dust particles of both layers experience a melting event. The accretion of the crystallized dust particles occurs since chondrules still have the relative velocity to gas when the dust crystallize. Considering , which works well when the dust stopping length, , is shorter than the shock scale, , the dust crystallize when the dust temperature becomes at , which is given by
| (36) |
When the relative velocity of chondrules is not totally damped at , i.e., , chondrules accrete crystallized dust particles. The effect of the relation between and is described in Section 3.2.2.
3.2 Parameter Dependence
3.2.1 Shock Velocity, Preshock Gas Number Density, and Initial Dust Size
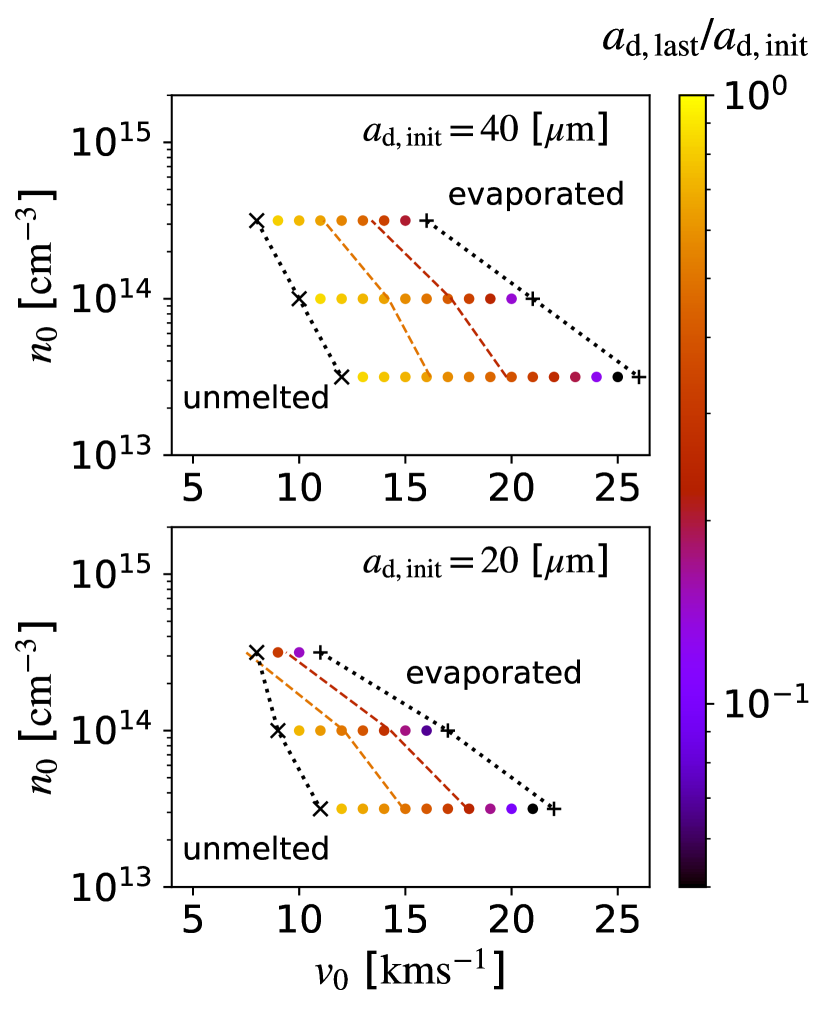
Igneous rims are accreted on chondrules in low-velocity shock waves. In this section, we present when the igneous rim accretion occurs and how thick the rims are. The accretion of igneous rims occurs when droplets are formed: the dust becomes droplets and does not evaporate completely. These conditions depend on the shock velocity, preshock gas number density, and initial dust size (Miura & Nakamoto, 2005). We plot the condition for the formation of droplets in Figure 3. For example, the droplet formation occurs when is between and in the case that , , , and . Dust evaporates completely when the shock velocity is higher than this range, and dust does not melt when the shock velocity is lower. Both boundary velocities of the melting and evaporation of dust become lower as the preshock gas number density increases. This is because the heating rate via the energy transfer from gas is proportional to the preshock gas number density (Equation 11), although the radiative cooling rate is independent of the preshock gas number density (Equation 14). We note that chondrules also melt in high and/or .
The shock velocity range for the droplet formation becomes wider as the initial dust size increases since a higher shock velocity is needed to evaporate completely. In these shock velocity ranges, dust particles evaporate and their sizes shrink. The accreted dust sizes are different according to the shock velocity, preshock gas number density, and initial dust size. We plot the size ratios between the final and initial dust sizes, in Figure 3. The dust sizes shrink more as the shock velocity and preshock gas number density are higher. This suggests that if we consider a certain dust size, igneous rims are composed of larger grains as the disk gas dissipates when the shock velocity is the same. The observed dust sizes of the components of the igneous rims are ranging from –m, and the averaged dust sizes are m in Allende and m in Semarkona (Rubin, 1984). Such size distributions are reproduced in a single rim-forming shock event when the precursor dust particles have size distributions, where the precursor dust sizes are between the observed maximum size and the boundary size of the dust evaporation.
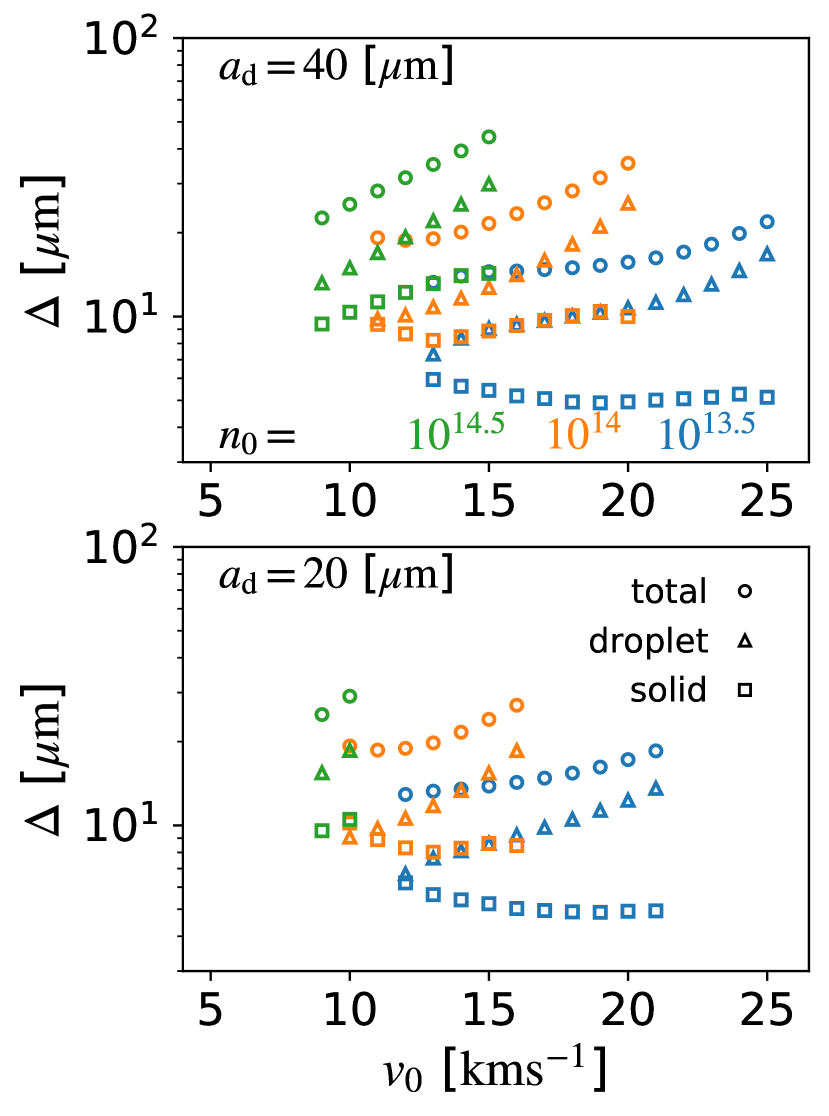
The thicknesses of the accreted rims are shown in Figure 4. This figure shows that the thickness increases as the shock velocity increases. This dependence is mainly because the dust number density increases as the shock velocity increases (Equations 7 and 25). This makes the thicknesses of the rims from the accretions of both droplets and crystallized particles larger. However, the thicknesses of the rims from crystallized particles are not an increasing function of the shock velocity when the preshock gas number densities are and . In these cases, the impact velocity of the crystallized particles exceeds (Appendix A). This makes the region, where the crystallized particles can be accreted by chondrules, shorter as the shock velocity increases.
The preshock gas number density also affects the rim thickness through the dust number density. The rims from the accretion of the droplets become thicker as the preshock gas number density increases due to the dust number density. In addition to the dust number density, the preshock gas number density affects the rim thickness of the crystallized particles through the length of the accretion region. We assume that the accretion region of the crystallized particles finishes when (Equation 33). When the gas number density is high, the stopping length becomes short (Equation LABEL:eq:l_stop), and the impact velocity becomes lower than , quickly (Appendix A).
The rim thicknesses are similar between the m cases and m cases. This is because the precursor dust size mainly changes the peak locations of the dust temperature and impact velocity, which are much shorter than the accretion ranges of the droplets and crystallized dust. This indicates that our results are good examples to consider the rim thicknesses that are composed of the observed coarse grains.
3.2.2 Shock Scale
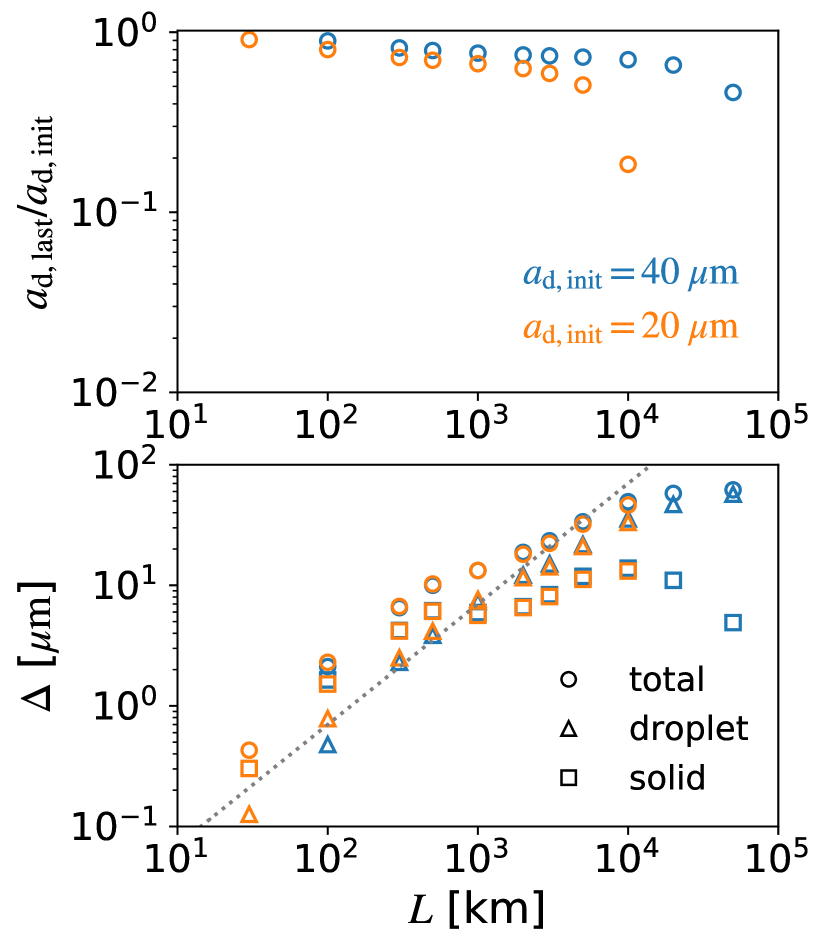
The spatial scales of the shock waves are expected to depend on the shock-driving mechanisms, shock-driving bodies, and particle trajectories (e.g., Morris et al., 2012; Desch et al., 2012). We present how the shock scale affects the accretion condition and thickness of igneous rims. Figure 5 shows the size ratio between the final dust and initial dust () and thickness of the accreted rims as a function of the shock scale in the m and m cases. The other parameters are , , and . As the cases for the shock velocity and preshock gas number, dust does not melt completely when the shock scale is short, ( km for m dust and km for m dust) and dust is evaporated when the shock scale is long ( km for m dust and km for m dust). In the larger dust size case, a longer shock scale is needed for melting and evaporation.
The total thicknesses increase as the shock scale increases. The droplets are accreted more as increases since the accretion of the droplets takes place at (Equation 36). The thickness of the accreted crystallized particles is also an increasing function of when . This is because the accretion range of crystallized dust particles increases as increases. The accretion of crystallized dust particles occurs between and the location where the impact velocity becomes lower than after the impact velocity reaches the second peak (Figure 1, Section 3.1). In the accretion of crystallized dust particles, the impact velocity is almost equal to the relative velocity of chondrules to gas in this range when since crystallized dust particles are well coupled with gas. When , the chondrule velocity barely changes behind the shock front since the gas velocity recovers to the preshock velocity at (Arakawa & Nakamoto, 2019). As increases, chondrules need longer to recover their velocities, which makes the accretion range of crystallized dust particles longer. The thickness of the accreted crystallized particles is peaked around and begins to decrease. When , the chondrule velocity is close to the gas velocity at , and the accretion rate of crystallized dust particles decreases (Appendix A).
3.2.3 Chondrule size
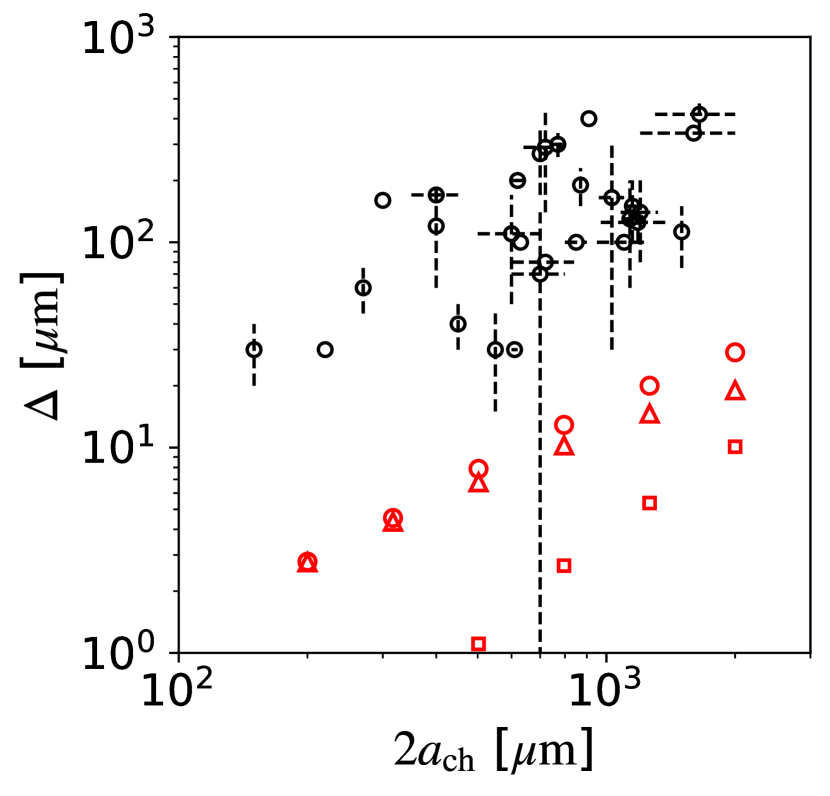
The observed igneous rims tend to increase as the chondrule size increases (Matsumoto et al., 2021). This tendency is reproduced in our results. Figure 6 shows the thicknesses of the rims in the case that , , , and . As the chondrule size increases, the stopping length of chondrules becomes longer. This makes high impact velocity accretion for droplets (Appendix A). Small-size chondrules do not have the rims of the accreted crystallized particles since (Section 3.2.2).
Although the observed igneous rims have a range in thickness, the observed rims are times thicker than the rims in our results. Multiple rim-forming shock events are needed to explain the thickness of the observed igneous rims, if the accretion behind the shock waves is the main source of the observed igneous rims. We consider that multiple rim-forming shock events are plausible when chondrules form by shock events. The rim-forming shock events are expected to be more frequent than the chondrule-forming shock events. If a planetesimal generates a chondrule-forming bow shock, dust particles in higher impact parameters experience lower peak temperatures (Boley et al., 2013). Moreover, the shock velocity depends on its longitude (Nagasawa et al., 2019). These indicate that when a chondrule-forming bow shock is generated in a part of an orbit and at a certain impact parameter, the rim-forming bow shock is also generated in a wider part of the orbit and higher impact parameter, which means more chance to form igneous rims. Such shock regions will help explain the depletion of volatile elements in the matrix (Hubbard & Ebel, 2014). Igneous rims are accreted in multiple melting events as chondrules experience multiple (partial) melting events (e.g., Rubin & Wasson, 1987; Baecker et al., 2017).
4 Conclusion and Discussion
Igneous rims are chondrule-enveloping structures and are composed of coarse grains, which show evidence of melting. We have explored whether igneous rims are accreted behind shock waves, which cause the melting of dust. Our key findings are summarized as follows:
-
1.
We show that droplets, which are totally molten dust particles, are accreted onto chondrules. Droplets are accreted in their supercooling regime. Dust particles continue to be accreted after they are crystallized. These make two layers of rims.
-
2.
Due to dust evaporation, the size of the accreted dust particles changes according to the shock velocity, preshock gas number density, and shock spatial scale. As gas depletes, dust particles evaporate less and igneous rims become to be composed of larger grains at a certain velocity shock wave.
-
3.
The total thicknesses of the accreted rims increase as the shock velocity increases, the preshock gas number density increases, and the shock spatial scale increases.
-
4.
The thickness relation between the droplet layer and the crystallized-dust layer depends on the relation between the stopping length and the shock spatial scale, at which supercooling droplets are crystallized.
-
5.
To reproduce the thicknesses of the observed igneous rims, rim-forming shock events are needed.
We suggest that observed chondrules with igneous rims experience multiple shock events. If chondrules with igneous rims experience multiple bow shock events, some of them, which have small impact parameters, reach melting temperature, are totally molten and form large single chondrules. These large chondrules do not accrete droplets and crystallized dust since dust evaporates completely. Some, which have large impact parameters, are not molten, accrete dust and become to have thicker igneous rims. This scenario provides the reason why not all chondrules have igneous rims.
Behind the shock front, not only igneous texture dust but also fine-grained dust will be accreted onto chondrules. There are some fine-grained dust forming mechanisms behind the shock front such as dust recondensation, evaporation of planetesimals (Tanaka et al., 2013; Arakawa et al., 2022), and disruption from chondrules (e.g., Jacquet & Thompson, 2014; Liffman, 2019). These are also accreted onto chondrules behind shock waves. In addition, fine-grained dust is accreted onto chondrules in the solar nebula (e.g., Metzler et al., 1992; Matsumoto et al., 2021). Such accreted dust will be transformed into igneous rims by shock waves or the other remelting events (e.g., Rubin, 1984).
In this study, we do not consider erosive collisions. In the accretion of the crystallized dust particles, erosive collisions do not change our results since the impact velocity is lower than in most cases. The impacts between chondrules and droplets are initially and not accretional. If these are erosive collisions, droplets would remove existing rims from the outer layers, which are composed of crystallized dust particles. Such erosive droplet impacts make two-layer structures unclear. Moreover, high-velocity collisions of droplets would cause chondrule erosion. Droplet erosion plays a key role in the erosion of the rims and chondrules behind the shock waves.
Appendix A Velocities of Chondrules and dust
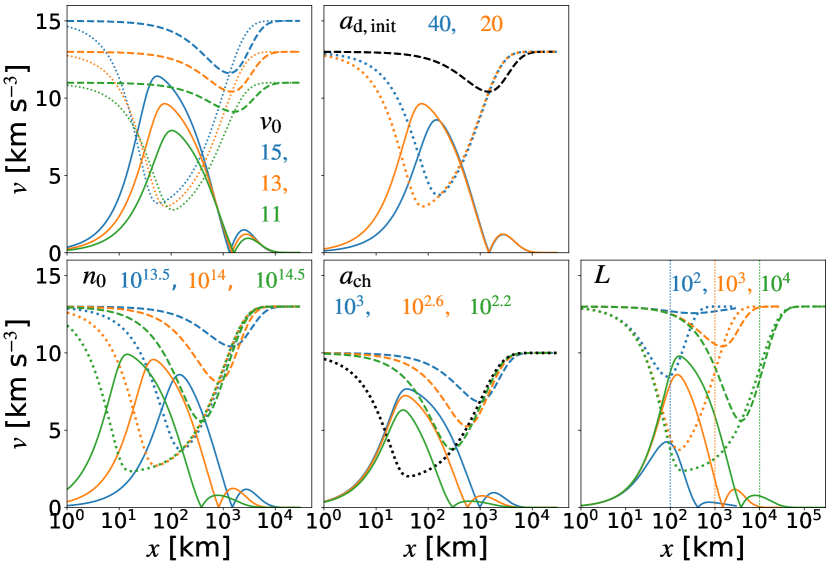
The velocity evolution of chondrules and dust particles is important to consider for the accretion of crystallized dust particles. Here, we show the evolution of velocities with changing parameters, shock velocity (), preshock gas number density (), initial dust size (), chondrules size (), and spatial scale of the shock (). The top-left panel of Figure 7 shows the dependence of the shock velocity (). The shock velocities are (blue), (orange), and (green), and the other parameters are , , , and . The shock velocity affects both velocities of chondrules and dust. As the shock velocity increases, the peak impact velocity becomes higher since the chondrule velocity is and the dust velocity is at the peak impact velocity (Section 3.1). In contrast, the impact velocities are similar at . The velocities of chondrules are relaxed to the gas velocity, and the impact velocity is hardly affected by the shock velocity in the accretion of crystallized dust particles.
The bottom-left panel shows the dependence of the preshock gas number density (). The preshock gas number densities are (blue), (orange), and (green), and the other parameters are , , , and . As the preshock gas number density decreases, the stopping lengths of chondrules and dust increase, which makes the impact velocity damped slowly. The peak impact velocity increases as the preshock gas number density increases. The second peak impact velocity becomes peaked at . When and , the second peak impact velocities exceed .
The top-middle panel shows the dependence on the initial dust size (). The initial dust sizes are m (blue) and m (orange), and the other parameters are , , , and . Smaller dust particles have shorter stopping lengths and their velocities quickly become the gas velocity. After dust velocities are well coupled to the gas velocity, the impact velocities are the same.
The bottom-middle panel shows the dependence on the chondrules size (). The chondrule sizes are m (blue), m (orange), and m (green), and the other parameters are , , , and . Smaller chondrules quickly reach velocities comparable to the gas due to the short stopping length, resulting in a lower peak impact velocity. In addition, smaller chondrules have lower second peaks of the impact velocities, which are quickly damped.
The bottom-right panel shows the dependence of the spatial scale of the shock (). We note that the range of the horizontal axis in this panel is different from those in the other panels. The shock spatial scales are km (blue), km (orange), and km (green), and the other parameters are , , , and . The spatial shock scales change the gas velocity, which changes the velocities of chondrules and dust particles. When km (), dust velocities are the same as the gas velocity at . In this range, the gas velocity recovers to the preshock velocity before , and chondrule velocities barely change. As increases, the gas velocity at decreases (Equation 3). The impact velocity becomes higher since dust velocities are relaxed to the gas velocity at a lower velocity. Moreover, chondrules velocities change more as increases, which makes the second peak structure of the impact velocity wider range. When km (), the impact velocity at the second peak becomes the highest. The second-peak velocity decreases as increases at since the gas velocity does not change in the interval of .
References
- Arakawa et al. (2022) Arakawa, S., Kaneko, H., & Nakamoto, T. 2022, ApJ, 927, 188, doi: 10.3847/1538-4357/ac5254
- Arakawa & Nakamoto (2016) Arakawa, S., & Nakamoto, T. 2016, Icarus, 276, 102, doi: 10.1016/j.icarus.2016.04.041
- Arakawa & Nakamoto (2019) —. 2019, ApJ, 877, 84, doi: 10.3847/1538-4357/ab1b3e
- Ashworth (1977) Ashworth, J. R. 1977, Earth and Planetary Science Letters, 35, 25, doi: 10.1016/0012-821X(77)90024-3
- Asphaug et al. (2011) Asphaug, E., Jutzi, M., & Movshovitz, N. 2011, Earth and Planetary Science Letters, 308, 369, doi: 10.1016/j.epsl.2011.06.007
- Baecker et al. (2017) Baecker, B., Rubin, A. E., & Wasson, J. T. 2017, Geochim. Cosmochim. Acta, 211, 256, doi: 10.1016/j.gca.2017.05.013
- Boley et al. (2013) Boley, A. C., Morris, M. A., & Desch, S. J. 2013, ApJ, 776, 101, doi: 10.1088/0004-637X/776/2/101
- Chandra & Avedisian (1991) Chandra, S., & Avedisian, C. T. 1991, Proceedings of the Royal Society of London Series A, 432, 13, doi: 10.1098/rspa.1991.0002
- Ciesla (2006) Ciesla, F. J. 2006, \maps, 41, 1347, doi: 10.1111/j.1945-5100.2006.tb00526.x
- Desch et al. (2012) Desch, S. J., Morris, M. A., Connolly, H. C., & Boss, A. P. 2012, \maps, 47, 1139, doi: 10.1111/j.1945-5100.2012.01357.x
- Friedrich et al. (2015) Friedrich, J. M., Weisberg, M. K., Ebel, D. S., et al. 2015, Chemie der Erde / Geochemistry, 75, 419, doi: 10.1016/j.chemer.2014.08.003
- Gombosi et al. (1986) Gombosi, T. I., Nagy, A. F., & Cravens, T. E. 1986, Reviews of Geophysics, 24, 667, doi: 10.1029/RG024i003p00667
- Hanft et al. (2015) Hanft, D., Exner, J., Schubert, M., et al. 2015, Journal of Ceramic Science and Technology, 6, 147, doi: 10.4416/JCST2015-00018
- Hanna & Ketcham (2018) Hanna, R. D., & Ketcham, R. A. 2018, Earth and Planetary Science Letters, 481, 201, doi: 10.1016/j.epsl.2017.10.029
- Hayashi (1981) Hayashi, C. 1981, Progress of Theoretical Physics Supplement, 70, 35, doi: 10.1143/PTPS.70.35
- Hewins et al. (2005) Hewins, R. H., Connolly, H. C., Lofgren, G. E., J., & Libourel, G. 2005, in Astronomical Society of the Pacific Conference Series, Vol. 341, Chondrites and the Protoplanetary Disk, ed. A. N. Krot, E. R. D. Scott, & B. Reipurth, 286
- Hood & Horanyi (1991) Hood, L. L., & Horanyi, M. 1991, Icarus, 93, 259, doi: 10.1016/0019-1035(91)90211-B
- Horányi et al. (1995) Horányi, M., Morfill, G., Goertz, C. K., & Levy, E. H. 1995, Icarus, 114, 174, doi: 10.1006/icar.1995.1052
- Hubbard (2015) Hubbard, A. 2015, Icarus, 254, 56, doi: 10.1016/j.icarus.2015.02.030
- Hubbard & Ebel (2014) Hubbard, A., & Ebel, D. S. 2014, Icarus, 237, 84, doi: 10.1016/j.icarus.2014.04.015
- Hughes (1978) Hughes, D. W. 1978, Earth and Planetary Science Letters, 38, 391, doi: 10.1016/0012-821X(78)90113-9
- Iida et al. (2001) Iida, A., Nakamoto, T., Susa, H., & Nakagawa, Y. 2001, Icarus, 153, 430, doi: 10.1006/icar.2001.6682
- Jacquet et al. (2015) Jacquet, E., Alard, O., & Gounelle, M. 2015, Geochim. Cosmochim. Acta, 155, 47, doi: 10.1016/j.gca.2015.02.005
- Jacquet et al. (2013) Jacquet, E., Paulhiac-Pison, M., Alard, O., Kearsley, A. T., & Gounelle, M. 2013, \maps, 48, 1981, doi: 10.1111/maps.12212
- Jacquet & Thompson (2014) Jacquet, E., & Thompson, C. 2014, ApJ, 797, 30, doi: 10.1088/0004-637X/797/1/30
- Johansen & Okuzumi (2018) Johansen, A., & Okuzumi, S. 2018, A&A, 609, A31, doi: 10.1051/0004-6361/201630047
- Johnson et al. (2015) Johnson, B. C., Minton, D. A., Melosh, H. J., & Zuber, M. T. 2015, Nature, 517, 339, doi: 10.1038/nature14105
- Liffman (2019) Liffman, K. 2019, Geochimica et Cosmochimica Acta, 264, 118, doi: 10.1016/j.gca.2019.08.009
- Liu et al. (2018) Liu, Z., Pandelaers, L., Blanpain, B., & Guo, M. 2018, Metallurgical and Materials Transactions B, 49, 2469, doi: 10.1007/s11663-018-1374-9
- Matsuda et al. (2019) Matsuda, N., Sakamoto, N., Tachibana, S., & Yurimoto, H. 2019, Chemie der Erde / Geochemistry, 79, 125524, doi: 10.1016/j.chemer.2019.07.006
- Matsumoto et al. (2021) Matsumoto, Y., Hasegawa, Y., Matsuda, N., & Liu, M.-C. 2021, Icarus, 367, 114538, doi: 10.1016/j.icarus.2021.114538
- Metzler et al. (1992) Metzler, K., Bischoff, A., & Stoeffler, D. 1992, Geochimica et Cosmochimica Acta, 56, 2873, doi: 10.1016/0016-7037(92)90365-P
- Miura & Nakamoto (2005) Miura, H., & Nakamoto, T. 2005, Icarus, 175, 289, doi: 10.1016/j.icarus.2004.11.011
- Miura et al. (2002) Miura, H., Nakamoto, T., & Susa, H. 2002, Icarus, 160, 258, doi: 10.1006/icar.2002.6964
- Morris et al. (2012) Morris, M. A., Boley, A. C., Desch, S. J., & Athanassiadou, T. 2012, ApJ, 752, 27, doi: 10.1088/0004-637X/752/1/27
- Mundo et al. (1995) Mundo, C. H. R., Sommerfeld, M., & Tropea, C. 1995, International journal of multiphase flow, 21, 151, doi: 10.1016/0301-9322(94)00069-V
- Murase & McBirney (1973) Murase, T., & McBirney, A. R. 1973, Geological Society of America Bulletin, 84, 3563, doi: 10.1130/0016-7606(1973)84<3563:POSCIR>2.0.CO;2
- Nagasawa et al. (2019) Nagasawa, M., Tanaka, K. K., Tanaka, H., et al. 2019, ApJ, 871, 110, doi: 10.3847/1538-4357/aaf795
- Nagashima et al. (2008) Nagashima, K., Moriuchi, Y., Tsukamoto, K., Tanaka, K. K., & Kobatake, H. 2008, Journal of Mineralogical and Petrological Sciences, 103, 204, doi: 10.2465/jmps.070620c
- Nagashima et al. (2006) Nagashima, K., Tsukamoto, K., Satoh, H., Kobatake, H., & Dold, P. 2006, Journal of Crystal Growth, 293, 193, doi: 10.1016/j.jcrysgro.2006.01.064
- Nakamoto & Miura (2004) Nakamoto, T., & Miura, H. 2004, in Lunar and Planetary Science Conference, ed. S. Mackwell & E. Stansbery, Lunar and Planetary Science Conference, 1847
- Pinto et al. (2022) Pinto, G. A., Marrocchi, Y., Jacquet, E., & Olivares, F. 2022, \maps, 57, 1004, doi: 10.1111/maps.13812
- Rizk et al. (1991) Rizk, B., Hunten, D. M., & Engel, S. 1991, J. Geophys. Res., 96, 1303, doi: 10.1029/90JA01998
- Roscoe (1952) Roscoe, R. 1952, British Journal of Applied Physics, 3, 267, doi: 10.1088/0508-3443/3/8/306
- Rubin (1984) Rubin, A. E. 1984, Geochimica et Cosmochimica Acta, 48, 1779, doi: 10.1016/0016-7037(84)90032-2
- Rubin (2010) —. 2010, Geochimica et Cosmochimica Acta, 74, 4807, doi: 10.1016/j.gca.2010.05.018
- Rubin & Wasson (1987) Rubin, A. E., & Wasson, J. T. 1987, Geochim. Cosmochim. Acta, 51, 1923, doi: 10.1016/0016-7037(87)90182-7
- Schrader et al. (2013) Schrader, D. L., Connolly, H. C., Lauretta, D. S., et al. 2013, Geochim. Cosmochim. Acta, 101, 302, doi: 10.1016/j.gca.2012.09.045
- Scott (2007) Scott, E. R. D. 2007, Annual Review of Earth and Planetary Sciences, 35, 577, doi: 10.1146/annurev.earth.35.031306.140100
- Susa et al. (1998) Susa, H., Uehara, H., Nishi, R., & Yamada, M. 1998, Progress of Theoretical Physics, 100, 63, doi: 10.1143/PTP.100.63
- Tanaka et al. (2013) Tanaka, K. K., Yamamoto, T., Tanaka, H., et al. 2013, ApJ, 764, 120, doi: 10.1088/0004-637X/764/2/120
- Tenner et al. (2015) Tenner, T. J., Nakashima, D., Ushikubo, T., Kita, N. T., & Weisberg, M. K. 2015, Geochim. Cosmochim. Acta, 148, 228, doi: 10.1016/j.gca.2014.09.025
- Wakita et al. (2017) Wakita, S., Matsumoto, Y., Oshino, S., & Hasegawa, Y. 2017, ApJ, 834, 125, doi: 10.3847/1538-4357/834/2/125
- Wasson (1993) Wasson, J. T. 1993, Meteoritics, 28, 14, doi: 10.1111/j.1945-5100.1993.tb00244.x