GADFORMER: AN ATTENTION-BASED MODEL FOR
GROUP ANOMALY DETECTION
ON TRAJECTORIES
Abstract
Group Anomaly Detection (GAD) reveals anomalous behavior among groups consisting of multiple member instances, which are, individually considered, not necessarily anomalous. This task is of major importance across multiple disciplines, in which also sequences like trajectories can be considered as a group. However, with increasing amount and heterogenity of group members, actual abnormal groups get harder to detect, especially in an unsupervised or semi-supervised setting. Recurrent Neural Networks are well established deep sequence models, but recent works have shown that their performance can decrease with increasing sequence lengths. Hence, we introduce with this paper GADFormer, a GAD specific BERT architecture, capable to perform attention-based Group Anomaly Detection on trajectories in an unsupervised and semi-supervised setting. We show formally and experimentally how trajectory outlier detection can be realized as an attention-based Group Anomaly Detection problem. Furthermore, we introduce a Block Attention-anomaly Score (BAS) to improve the interpretability of transformer encoder blocks for GAD. In addition to that, synthetic trajectory generation allows us to optimize the training for domain-specific GAD. In extensive experiments we investigate our approach versus GRU in their robustness for trajectory noise and novelties on synthetic and real world datasets.
1 Introduction
Group Anomaly Detection (GAD) is an important task across many disciplines and domains like social networks [?], mobility [?], physics [?; ?] and many more. In these domains, GAD is suitable for various types of group anomalies. Since group member instances can be an arbitrary representation, the GAD paradigm also applies to the detection of anomalous sequences like trajectories, to which [?] refers to as collective anomalies. Especially in the spatio-temporal domain, Trajectory Anomaly Detection is a common task to reveal abnormal behavior as the authors [?; ?; ?] confirm.
However, although sequential steps of a trajectory obviously represent a group structure, the detection of individual anomalous trajectories has not been addressed as a group anomaly detection problem yet.
The current state of the art approaches for anomaly detection on trajectories are recurrent neural networks (RNNs) like LSTMs [?] and GRUs [?; ?], but the potential of deep learning methods for Group Anomaly Detection has rather been sparsely investigated. So far GAD tasks have more likely been solved by generative topic models [?; ?; ?; ?] or SVM-based methods [?; ?; ?]. Despite recent advances, deep generative models got only involved in form of Adversarial Autoencoders (AAEs) and Variational Autoencoders (VAEs) [?] to perform GAD for images. [?] offers different machine learning based algorithms to detect anomalous groups of multiple trajectories, but does not identify the detection of individual anomalous trajectories (a sequence of group members) as group anomaly detection problem.
However, anomalous behavior is not ensured to just appear within short trajectory segments. It is challenging for recurrent neural networks, sometimes even LSTM and GRU, to learn very long-term dependencies [?].
A further challenge for deep learning based group anomaly detection on trajectories is, that it is due the high availability of trajectory data not uncommon, that they are rather weakly labeled or do not overcome the nonground-truth problem [?] at all.
In order to tackle these challenges we introduce our approach GADFormer, a BERT[?] based architecture with transformer[?] encoder blocks for attention-based group anomaly detection on trajectories. Extending the idea of [?] to optimize also image, audio or video sequence tasks by their transformer approach, we identify transformer based models for a sequence of trajectory points/segments as group member instances of a group anomaly detection task as similarly beneficial. Our model can be trained in an unsupervised as well as in an semi-supervised setting so that there is no or only reduced need for labeled trajectories. Furthermore, we introduce a Block Attention-anomaly Score (BAS), which allows us to provide an interpretable view to the capability of the transformer encoder blocks to distinguish normal from abnormal trajectory attention matrices. We show with extensive experiments on synthetic and real world datasets that our approach is on par with the state of the art methods.
Hence, the contributions of our work can be summarized as follows:
-
•
Transformer-Encoder-architecture capable to perform attention-based group anomaly detection in an unsupervised and semi-supervised setting.
-
•
Identification of the detection of individual anomalous trajectories as Group Anomaly Detection problem for BERT based transformer models.
-
•
Block Attention-anomaly Score for transformer encoder block interpretability for the task of GAD.
-
•
Extensive ablation and robustness studies addressing trajectory noise, novelties and standardization.
The remainder of this work is structured as follows. Section 2 introduces the a formal description of the addressed problem before in Section 3 the architecture, training and interpretability of GADFormer is proposed. The experiments in Section 4 demonstrate relevance and suitability of our approach across multiple domains and Section 5 distinguishes our approach from related work. A final summary of the paper as well as an outline to future work is given by Section 6.
2 Preliminaries and Problem Definition
This section provides preliminary terminology and definitions used in this work so far not referenced otherwise.
2.1 Preliminaries
Group Anomaly Detection (GAD) aims to identify groups that deviate from the regular group pattern[?].
Group is a set or sequence of at least two group member instances.
Group Member Instance is an arbitrary data entity described by a n-dimensional feature vector as part of a group.
[Group Anomaly or] Collective Anomaly refers to a collection of data points that belong together and, as a group, deviate from the rest of the data.[?]
2.2 Problem Definition
The definitions for GAD align with [?] for deep generative models, but got partially a different notation to emphasize its suitability for group anomaly detection on individual trajectories. The GAD problem is described as follows:
Let be an instance with and with attribute , the feature space, with
Be a group member instance of the th group with
| (1) |
and a group anomaly detection dataset, which is a set of all groups:
| (2) |
The objective of the group anomaly detection task is to distinguish normal in-distribution groups from abnormal out-of-distribution groups A with the help of a pseudo group as an approximated reference for normal in-distribution groups. Therefore, a characterization function with
| (3) |
and an aggregation function with
| (4) |
compose to
| (5) |
where maps the groups to -dimensional feature vectors representing the relationship characteristics of its group members and aggregates them to one -dimensional feature vector representing one reference for the distribution of normal groups.
Finally, the abnormality of a group is defined by a group anomaly score measuring the deviation by a distance measure , between and the normal group reference . Thus, the abnormality score is defined as follows:
| (6) |
whereby the decision between normal and abnormal groups is defined by a threshold with
| (7) |
Having the group anomaly detection problem described according to [?], we also elaborate on the task of trajectory anomaly detection aligning with the notations of [?] with their slightly different problem of group trajectory anomaly detection instead of the here described individual trajectory anomaly detection:
A trajectory point is defined as
| (8) |
A trajectory segment is defined as
| (9) |
A trajectory is defined as
| (10) |
A trajectory dataset is defined as
| (11) |
Considering the task of detecting abnormal individual trajectories as group anomaly detection problem, the following associations are identified:
A trajectory applies to the semantic of a group by considering trajectory segments as group members , including the case of segment length L = 1, where one group member is represented by only one trajectory point . A trajectory point is associated with an instance .
Thus, individual abnormal trajectories can be detected similarly to the group anomaly detection problem as follows:
| (12) |
| (13) |
After revealing the associations between the GAD approach of [?] and our related proposal for trajectories, also our proposed GADFormer approach (cf. Section 3) is potentially able to be trained for each arbitrary group anomaly detection problem on sequences or non-ordered sets revealing abnormal patterns as groups.
3 GADFormer
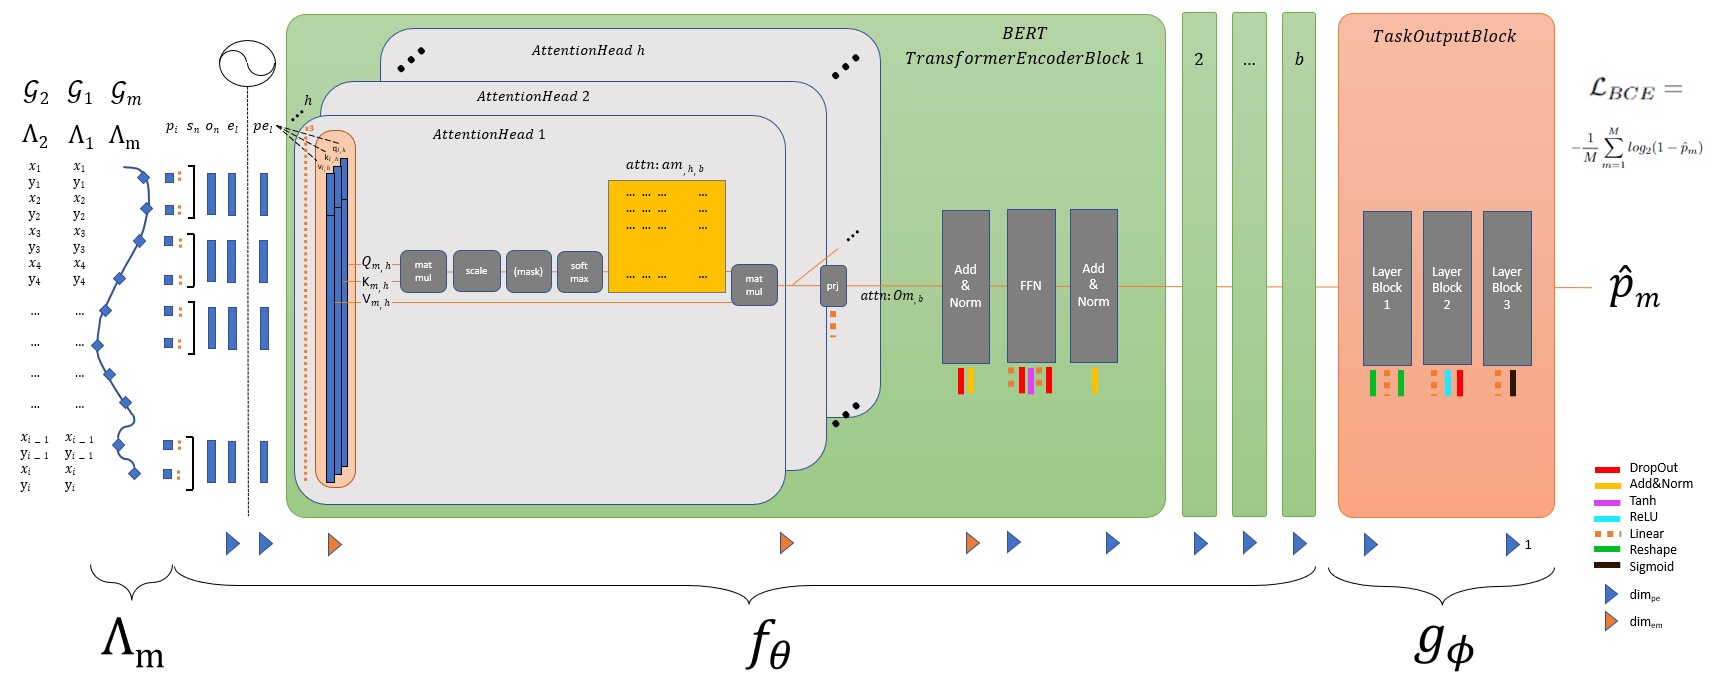
In this section we propose GADFormer, a deep BERT based transformer encoder model architecture for attention-based Group Anomaly Detection (GAD). After we showed in Section 2 by the example of [?] theoretically that the GAD problem can also be applied to trajectories, we introduce with GADFormer a new deep GAD model in this section and demonstrate its performance on trajectory datasets in Section 4. Figure 1 provides an overview to the GADFormer architecture in combination with the example of 2D trajectory point inputs, but also high-dimensional group members (trajectory points) are possible.
3.1 Architecture and Loss Objective
Differently to the GAD characterization and aggregation function (cf. Eq. 3 and Eq. 4) of the deep generative models of [?] our deep bidirectional GADFormer models the characterization and aggregation functions as follows with
| (14) |
The characterization function of GADFormer maps the bidirectional relationships between group members of a group m (representations of trajectory point or segment of trajectory ) to an attention-based feature map , representing the behavior of an individual group (the individual trajectory path). This is realized by a BERT [?] encoder, a composition of layers for input embedding, positional encoding and multi-head self-attention blocks (cf. Figure 1) using group member embeddings as input tokens.
| (15) |
The aggregation function of GADFormer approximates instead of a distribution for normal group representations with distance measure a probability for abnormal group behavior (abnormal trajectory path). This is realized by non-linear custom task layers of the output block, which maps the group behavior characteristics to a task specific feature map representation .
| (16) |
Afterwards, a sigmoid function maps this representation to a probability for group abnormality, with for normal groups and for abnormal groups (trajectories).
| (17) |
Because of the rare label availability for groups (trajectories), the loss objective of GADFormer is defined for an unsupervised and semi-supervised learning setting aussuming the majority dataset instances to be normal. Therefore, we define the binary cross entropy loss as our loss function (cf. Eq. 19). We consider this loss function as a suitable choice, since entropy as a measure of unpredictability is when the model is most uncertain about its abnormality prediction, and when the model is very certain about its abnormality prediction.
| (18) |
Due to the heavily imbalanced learning setting with a large majority of normal groups (trajectories) one can neglect the minority of abnormal groups (trajectories) and set a fix auxiliary target probability for certain normal-predictions () for the majority of normal group probabilities . In case the model faces true abnormal groups, then it is rather uncertain about its decision yielding a probability close to resulting in a high entropy loss, whereas true normal groups on whose pattern the model is trained, result in a low entropy loss for .
| (19) |
Since in our setting the model effectively predicts only abnormality probabilities for the range of normal groups with , where means that a group (trajectory) is not abnormal at all, the abnormality of a group is defined by a group anomaly score as follows
| (20) |
for our GADFormer approach.
3.2 Training
Anomalous trajectories are rare by definition and labeling by domain experts tends to be rather expensive. We address this challenge by two different learning settings which are: 1) Unsupervised learning, which requires no labels at all under the assumption that the ratio of anomalous trajectories is low and has no remarkable influence during model training. 2) Semi-Supervised Learning, which relies on verified normal samples only. As proposed in the section before, these learning settings allow us to set a fix auxiliary target probability , so that no ground truth for abnormal trajectories is needed for the GADFormer training.
Algorithm 1 describes the training steps of our approach. The inputs of our algorithm are trajectory dataset as group dataset , the GADFormer model with initialized parameters and the loss objective function . Furthermore, we use the algorithm parameters dataset split ratios for train, validation and test, a model optimizer, the total number of epochs, batch size bs, learning rate , weight decay and learning rate schedulers with patience parameter are in use. The output of the algorithm is model with parameters leading to the lowest validation loss, its GA scores and the related losses . After variable initialization (lines 1-4) we repeat the training for the given number of epochs or until the model converges (line 5, 23, 24). In each training epoch (lines 5-25) we pass the group (trajectory) batches to the model, return its group abnormality probability and use it to calculate the binary cross entropy loss and the related group anomaly score . This is done for the training set (lines 6-11), the validation set (lines 12-16) and test set (lines 26-30) equally, just during training the gradients are calculated and model weight updates are done (line 9). At the end of each training epoch the best model with losses and GA scores is kept saved (lines 17-21) based on the validation loss . Finally, as described for the output, the best model with related losses and group anomaly scores is returned (line 31).
Input: groups , model , loss objective
Parameter: ratios, optimizer, epochs, bs, lr , wd, sched, patience
Output: model , GA scores , losses
3.3 Interpretability
Deep learning models are known to be rather complex and their training usually requires a deep understanding for its model architecture, losses, preprocessing and data distributions to take the right decisions for fine-tuning, but still then it partially remains a blackbox as more layers, blocks and parameters exist.
In order to achieve a higher model interpretability addressing CH6, one of the main deep anomaly detection challenges of [?], we introduce a Block Attention-anomaly Score (BAS) for our GADFormer model. This score represents a group abnormality by the ratio of a block attention matrix weighted output and the average outputs of a transformer encoder block layer. This allows to show the capability of a transformer encoder block layer to 1) generally distinguish pattern of different groups (trajectories) and 2) to separate between normal and abnormal groups (individual trajectories).
Since the cells of an attention matrix contain the scaled dot product of and (two projected group embeddings projected from input tokens which are either embeddings of trajectory points or embeddings of trajectory segments as group members ), their similarity weights the importance of the bidirectional relationship of a group member pair in different heads and with that, focuses with different views to the behavioral pattern of a group (trajectory path pattern in the context of the task of GAD on individual trajectories), whereas its concatenated projected dot product with the third projected group member embeddings provides the overall-importance-weighted attention output matrix emphasizing task relevant behavior of a concrete group (task relevant trajectory path segments of an individual trajectory m).
The BAS for each group within each transformer encoder block is calculated by Algorithm 2. The inputs of this algorithm are group attention matrices of the transformer encoder blocks and the euclidean distance measure. Further parameters are the ratio for the top N abnormal groups, block index b and groups M.
Input: group attention matrices , distance measure
Parameters: , block b, groups M
Output: block attention-anomaly scores
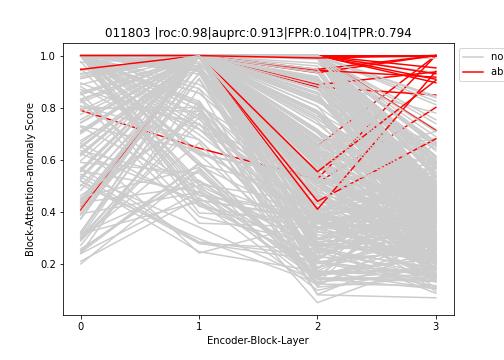
The average attention matrix for a group in heads is calculated for all attention matrices as well as for their average over all groups (line 1-2). According to the given the top N most distant abnormal group attention matrices from are used to calculate an average abnormal group attention matrix in order to have a solid abnormal representation for distance calculation (line 4-7). Next, the distance between a group attention matrix to the normal group attention matrix average as well as the distance between the normal group attention matrix average and the abnormal group attention matrix average is used to request the ratio between both which represents the Block Attention-anomaly Score (line 9).
Considering the following illustrations of the trajectory BAS within the four GADFormer encoder block layers, one observes at Figure 2 that the first encoder block layers (0-2) are not able to distinguish between normal and abnormal trajectories whereas in the last layer the amount of potential false positive scores gets less indicating a better capability of the model to extract relevant feature for abnormal trajectories.
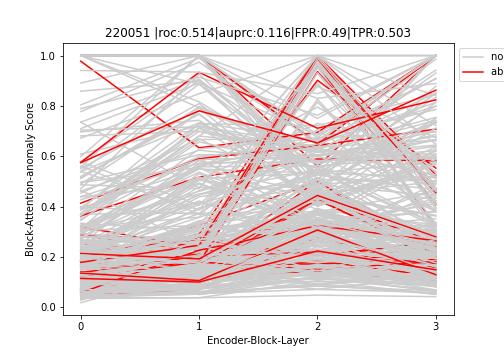
The trajectory BAS within the layers of Figure 3 indicate that the model is over all layers not really able to distinguish between normal and abnormal trajectory scores, not even between the characteristics of single trajectories within the class of normal trajectories.
In summary, the BAS provides us a view to the transformer encoder block layers and allows us to reason reasonable changes to hyperparameters and model architecture to improve the performance of the model.
4 Experiments
In this section we evaluate the performance of our GADFormer approach on synthetic and real-world datasets and compare it against GRU, one of the state of the art methods for individual trajectory anomaly detection.
4.1 Experimental Setup and Datasets
For our experiments we used an Ubuntu Focal 20.04.5 LTS server with AMD Ryzen 7 3700X 8-Core Processor with 16 CPUs, 64GB RAM and a 16GB NVIDIA RTX A4000 GPU. We conducted our experiments on three trajectory datasets, which are an own synthetic dataset with several noise and novelty data variants (cf. Table 8) as well as two real-world datasets from amazon111https://github.com/amazon-science/goal-gps-ordered-activity-labels describing walk or driving paths and brightkite 222https://snap.stanford.edu/data/loc-brightkite.html with location-based social-networking provider trajectory data. Both have a maximal length of 72 steps. For the latter we have no labels available why we utilize a z-score range of ]-2.1;+2.1[ in order to label individual anomalous trajectories with maximal length of 500 steps based on their PCA embedding. We split our data in a train, valid and testset with a ratio of 0.9 for normal data for each set (except for semi-supervised training when no abnormal data is in the training set). Further details can be seen in Table 1.
| dataset | set | all | n | a | trajLen |
|---|---|---|---|---|---|
| synthe | unsu | 3400 | 3083 | 158 | 72 |
| synthe | semi | 3400 | 3271 | 129 | 72 |
| amazon | unsu | 805 | 757 | 48 | 72 |
| amazon | semi | 777 | 652 | 125 | 72 |
| bright | unsu | 2241 | 2052 | 189 | 500 |
| bright | semi | 2218 | 2052 | 66 | 500 |
| setting | dataset | exp | model | scaler | roc | auprc |
|---|---|---|---|---|---|---|
| U | synthe | noise .0 | GADFormer | standard | 0.997 | 0.975 |
| U | synthe | noise .0 | GRU | standard | 0.905 | 0.811 |
| U | synthe | noise .2 | GADFormer | standard | 0.987 | 0.907 |
| U | synthe | noise .2 | GRU | standard | 0.891 | 0.775 |
| U | synthe | noise .5 | GRU | standard | 0.904 | 0.513 |
| U | synthe | noise .5 | GADFormer | standard | 0.904 | 0.513 |
| setting | dataset | exp | model | scaler | roc | auprc |
|---|---|---|---|---|---|---|
| E | synthe | noise .0 | GADFormer | standard | 0.978 | 0.912 |
| E | synthe | noise .0 | GRU | standard | 0.909 | 0.814 |
| E | synthe | noise .2 | GADFormer | standard | 0.96 | 0.864 |
| E | synthe | noise .2 | GRU | standard | 0.894 | 0.782 |
| E | synthe | noise .5 | GADFormer | standard | 0.916 | 0.737 |
| E | synthe | noise .5 | GRU | standard | 0.843 | 0.569 |
| setting | dataset | exp | model | scaler | roc | auprc |
|---|---|---|---|---|---|---|
| U | synthe | orig | GRU | robust | 0.946 | 0.733 |
| U | synthe | orig | GADFormer | robust | 0.803 | 0.302 |
| U | amazon | orig | GADFormer | robust | 0.722 | 0.104 |
| U | amazon | orig | GRU | robust | 0.496 | 0.093 |
| U | bright | orig | GADFormer | robust | 0.536 | 0.112 |
| U | bright | orig | GRU | robust | 0.502 | 0.132 |
| setting | dataset | exp | model | scaler | roc | auprc |
|---|---|---|---|---|---|---|
| E | synthe | orig | GRU | robust | 0.948 | 0.741 |
| E | synthe | orig | GADFormer | robust | 0.943 | 0.768 |
| E | bright | orig | GADFormer | robust | 0.59 | 0.149 |
| E | bright | orig | GRU | robust | 0.503 | 0.132 |
| E | amazon | orig | GRU | robust | 0.589 | 0.404 |
| E | amazon | orig | GADFormer | robust | 0.499 | 0.353 |
| setting | dataset | exp | model | scaler | roc | auprc |
|---|---|---|---|---|---|---|
| U | synthe | novelty .0 | GADFormer | standard | 0.997 | 0.975 |
| U | synthe | novelty .0 | GRU | standard | 0.905 | 0.811 |
| U | synthe | novelty .01 | GADFormer | standard | 0.993 | 0.852 |
| U | synthe | novelty .01 | GRU | standard | 0.938 | 0.854 |
| U | synthe | novelty .05 | GADFormer | standard | 0.965 | 0.565 |
| U | synthe | novelty .05 | GRU | standard | 0.951 | 0.881 |
| setting | dataset | exp | model | scaler | roc | auprc |
|---|---|---|---|---|---|---|
| E | synthe | novelty .0 | GADFormer | standard | 0.978 | 0.912 |
| E | synthe | novelty .0 | GRU | standard | 0.909 | 0.814 |
| E | synthe | novelty .01 | GADFormer | standard | 0.971 | 0.845 |
| E | synthe | novelty .01 | GRU | standard | 0.941 | 0.86 |
| E | synthe | novelty .05 | GADFormer | standard | 0.957 | 0.649 |
| E | synthe | novelty .05 | GRU | standard | 0.952 | 0.884 |
The code has been developed in Python, utilizing the Pytorch and PyTorch Lightning Framework, to implement each layer, and it’s sub-layer of the GADFormer and to carry out the model-training and testing procedure, respectively. For Model training, the PyTorch lightning Trainer is initialized with Early Stopping and Checkpoint callback along with a Gradient Clipping value to avoid exploding gradients. Furthermore, weight initialization gets applied in order to achieve better convergence. In addition to that, hyperparameter search conducted in order to find the ideal training parameters and model architecture.
The synthetically generated trajectory dataset (cf. Table 8) consists of trajectory member instances (trajectory steps), one per row, where one group member has different attributes such as ’Person’ (one trajectory per person), ’Sequence Step’, ’XCoord’ and ’YCoord’. A GAD-label is defined for one complete group (trajectory) stating whether a group (a trajectory) is anomalous (1) or normal (0).
| Person | Sequence step | XCoord | YCoord | GAD-Label |
| 1 | 0 | 1 | -3 | |
| 1 | 1 | 2 | 8 | 0 |
| 1 | 2 | 3 | 5 | |
| … | … | … | … | |
| 1 | 100 | 150 | ||
| 2 | 0 | 2 | -2 | |
| 2 | 1 | 3 | 7 | 0 |
| 2 | 2 | 2 | 6 | |
| … | … | … | … | |
| 2 | 110 | 155 | ||
| … | … | … | … | … |
| 0 | 3 | -1 | ||
| 1 | 4 | 4 | 1 | |
| 2 | 5 | 2 | ||
| … | … | … | … | |
| 114 | 152 |
We used for 72 for synthetic and amazon dataset and for brightkite 500. The is for all 8, the hidden is 2048. We trained for 100 epochs with earlystopping, used learning rates 1e-5, 1e-5 and 1e-6 and wd 1e-5, 1e-5 and 1e-6, 8 heads as well as encoder layers. For synthetic dataset no dropout was in use, for amazon and brightkite 0.05. We used batch sizes 25, 25 and 250 respectively.
4.2 Evaluation
For the evaluation of our model, we follow the goals of having a low miss rate (false negatives) as well as achieve as less false alerts (false positives) as possible. In addition to that, the quality of the model scores needs to be evaluated. Therefore and to be comparable to related approaches, we evaluate the model performance by:
-
•
-
•
Precision =
-
•
Recall =
Areas Under the Curve (AUC) for thresholds :
-
•
AUPRC = AP = Precision vs. Recall
-
•
AUROC = TPR vs. FPR
4.3 Results and Discussion
In comparison with GRU the GADFormer performs better on synthetic dataset for the settings U-noise 0.0 and 0.5 (cf. Table 2) and in semi-supervised setting E-noise for all ratios (cf. Table 3). Other studies which GADFormer could achieve a better performance was U-novelty for all ratios in unsupervised as well as in semi-supervised setting (cf. Table 6 and Table 7). Furthermore, we evaluated also the performance of both approaches on the original synthetic and real-world datasets. Even on large datasets like brightkite performed GADFormer on par with GRU, and was on amazon driver real-world dataset even considerably better than GRU. Only on the synthetically generated dataset GRU could outperform GADFormer in this setting of Table 4. GADFormer performed comparably well even on the massive brightkite dataset in semi-supervised setting. Just on synthetic data GADFormer is slightly weaker than GRU, but both are with over 0.94 ROC and 0.74 AUPRC on par.
5 Related Work
Reviewing the literature, we could identify the following related work, which is distinguished from our approach within this section. Instead of considering the detection of individual trajectory anomalies as a Group Anomaly Detection problem as our approach does, the vision in the works of [?; ?] is to observe trajectories as a NLP problem. In their papers they mention preliminary work, but do not provide a concrete model architecture for group anomaly detection although TrajBERT is proposed as a holistic framework for an efficient and practical solution for almost all fundamental trajectory analysis problems. Another work of [?] uses for the task of Trajectory-User-Linking (TUL), instead of GAD, a combination out of RNN and transformer network with cross entropy loss but compared to our approach, they do not take trajectory segments into account and the model lacks in layer interpretability. Addressing long-range trajectory anomaly detection as well the work of [?] proposes an unsupervised normalizing flow (NF) model. They utilize trajectory segments and negative log-likelihood as well but use it in combination with NF-based density estimation. The work of [?] introduced the problem of group trajectory outlier detection (GTOD), which is also addressed by [?], and provide the approach CDkNN, which creates DBSCAN-based microclusters, pruned by kNN and scored with a specific pattern mining algorithm. However, both works perform anomaly detection while considering complete individual trajectories as group members, whereas we address the slightly different problem of considering single trajectory points as group members for the problem group anomaly detection. The work of [?] proposes a model for content-aware anomaly detection on event log messages instead of anomalous trajectories as our approach. In addition to that, their approach takes also the content of the messages into account and allows to run it, as our approach, by the task-specific encoder-part or, differently as ours, run the model with the typical BERT[?] encoder-decoder architecture. Summarizing the identified related work, there is best to our knowledge no interpretable attention-based transformer-encoder-approach for group anomaly detection on trajectories.
6 Conclusion
In this work we proposed GADFormer, a transformer-encoder-architecture, capable to perform attention-based group anomaly detection in an unsupervised and semi-supervised setting. We emphasized, how the detection of individual anomalous trajectories can be solved as a Group Anomaly Detection (GAD) problem for BERT based transformer models. Furthermore, we introduced BAS, a Block Attention-anomaly Score to improve the interpretability of transformer encoder blocks the task of GAD. Extensive ablation and robustness studies addressing trajectory noise and novelties on synthetic and real world datasets demonstrated, that our approach is on par with related approaches. Further potential for improvement could be to approximate a normal-group-distribution instead of abnormal-group-probabilities by the output-block of our model, combining the pattern attention-based group pattern extraction of our approach and the group anomaly scoring and loss objectives of [?]. Vice versa, with appropriate preprocessing, the performance of the GADFormer model architecture could also be evaluated on image data, audio or text data. Finally, the potential of transfer learning could be investigated by training e.g. on trajectories of buses and applying that pre-trained model on trajectories of cars.
Ethical Statement
There are no ethical issues.
References
- [Belhadi et al., 2021] Asma Belhadi, Youcef Djenouri, Djamel Djenouri, Tomasz Michalak, and Jerry Chun-Wei Lin. Machine learning for identifying group trajectory outliers. ACM Trans. Manage. Inf. Syst., 12(2), jan 2021.
- [Blei et al., 2003] David M. Blei, Andrew Y. Ng, and Michael I. Jordan. Latent dirichlet allocation. 3(null):993–1022, mar 2003.
- [Chalapathy et al., 2018] Raghavendra Chalapathy, Edward Toth, and Sanjay Chawla. Group anomaly detection using deep generative models. In Michele Berlingerio, Francesco Bonchi, Thomas Gärtner, Neil Hurley, and Georgiana Ifrim, editors, Machine Learning and Knowledge Discovery in Databases - European Conference, ECML PKDD 2018, Dublin, Ireland, September 10-14, 2018, Proceedings, Part I, volume 11051 of Lecture Notes in Computer Science, pages 173–189. Springer, 2018.
- [Chen et al., 2022] Wei Chen, Shuzhe Li, Chao Huang, Yanwei Yu, Yongguo Jiang, and Junyu Dong. Mutual distillation learning network for trajectory-user linking. arXiv preprint arXiv:2205.03773, 2022.
- [Cho et al., 2014] Kyunghyun Cho, Bart van Merrienboer, Dzmitry Bahdanau, and Yoshua Bengio. On the properties of neural machine translation: Encoder-decoder approaches, 2014.
- [Devlin et al., 2019] Jacob Devlin, Ming-Wei Chang, Kenton Lee, and Kristina Toutanova. BERT: Pre-training of Deep Bidirectional Transformers for Language Understanding. In Jill Burstein, Christy Doran, and Thamar Solorio, editors, Proceedings of the 2019 Conference of the North American Chapter of the Association for Computational Linguistics: Human Language Technologies, NAACL-HLT 2019, Minneapolis, MN, USA, June 2-7, 2019, Volume 1 (Long and Short Papers), pages 4171–4186. Association for Computational Linguistics, 2019.
- [Dias et al., 2020] Madson L. D. Dias, César Lincoln C. Mattos, Ticiana L. C. da Silva, José Antônio F. de Macêdo, and Wellington C. P. Silva. Anomaly detection in trajectory data with normalizing flows. In 2020 International Joint Conference on Neural Networks (IJCNN), pages 1–8, 2020.
- [Djenouri et al., 2020] Youcef Djenouri, Kjetil Nørvåg, Heri Ramampiaro, and Jerry Chun-Wei Li. Fast and accurate group outlier detection for trajectory data. In Jérôme Darmont, Boris Novikov, and Robert Wrembel, editors, New Trends in Databases and Information Systems, pages 60–70, Cham, 2020. Springer International Publishing.
- [Foorthuis, 2020] Ralph Foorthuis. On the nature and types of anomalies: a review of deviations in data. International Journal of Data Science and Analytics, 12:297 – 331, 2020.
- [Hochreiter and Schmidhuber, 1997] Sepp Hochreiter and Jürgen Schmidhuber. Long short-term memory. Neural Comput., 9(8):1735–1780, nov 1997.
- [Jiang et al., 2017] Xiang Jiang, Xuan Liu, Erico N de Souza, Baifan Hu, Daniel L. Silver, and Stan Matwin. Improving point-based ais trajectory classification with partition-wise gated recurrent units. In 2017 International Joint Conference on Neural Networks (IJCNN), pages 4044–4051, 2017.
- [Lohrer et al., 2022] Andreas Lohrer, Johannes Josef Binder, and Peer Kröger. Group anomaly detection for spatio-temporal collective behaviour scenarios in smart cities. In Proceedings of the 15th ACM SIGSPATIAL International Workshop on Computational Transportation Science, IWCTS ’22, New York, NY, USA, 2022. Association for Computing Machinery.
- [Muandet and Schölkopf, 2013] Krikamol Muandet and Bernhard Schölkopf. One-class support measure machines for group anomaly detection. UAI’13, page 449–458, Arlington, Virginia, USA, 2013. AUAI Press.
- [Musleh et al., 2022] Mashaal Musleh, Mohamed F Mokbel, and Sofiane Abbar. Let’s speak trajectories. In Proceedings of the 30th International Conference on Advances in Geographic Information Systems, pages 1–4, 2022.
- [Musleh, 2022] Mashaal Musleh. Towards a unified deep model for trajectory analysis. In Proceedings of the 30th International Conference on Advances in Geographic Information Systems, pages 1–2, 2022.
- [Nachman and Shih, 2020] Benjamin Nachman and David Shih. Anomaly detection with density estimation. Phys. Rev. D, 101:075042, Apr 2020.
- [Pang et al., 2021] Guansong Pang, Chunhua Shen, Longbing Cao, and Anton Van Den Hengel. Deep learning for anomaly detection: A review. ACM Comput. Surv., 54(2), mar 2021.
- [Schölkopf et al., 2001] Bernhard Schölkopf, John C. Platt, John Shawe-Taylor, Alex J. Smola, and Robert C. Williamson. Estimating the support of a high-dimensional distribution. Neural Computation, 13(7):1443–1471, 2001.
- [Vaswani et al., 2017] Ashish Vaswani, Noam Shazeer, Niki Parmar, Jakob Uszkoreit, Llion Jones, Aidan N. Gomez, Łukasz Kaiser, and Illia Polosukhin. Attention is all you need. In Proceedings of the 31st International Conference on Neural Information Processing Systems, NIPS’17, page 6000–6010, Red Hook, NY, USA, 2017. Curran Associates Inc.
- [Wang et al., 2020] Zhongqiu Wang, Guan Yuan, Haoran Pei, Yanmei Zhang, and Xiao Liu. Unsupervised learning trajectory anomaly detection algorithm based on deep representation. International Journal of Distributed Sensor Networks, 16, 2020.
- [Xiong et al., 2011a] Liang Xiong, Barnabás Póczos, and Jeff Schneider. Group anomaly detection using flexible genre models. In Proceedings of the 24th International Conference on Neural Information Processing Systems, NIPS’11, page 1071–1079, Red Hook, NY, USA, 2011. Curran Associates Inc.
- [Xiong et al., 2011b] Liang Xiong, Barnabás Póczos, Jeff G. Schneider, Andrew J. Connolly, and J. Vanderplas. Hierarchical probabilistic models for group anomaly detection. In International Conference on Artificial Intelligence and Statistics, 2011.
- [Yu et al., 2014] Rose Yu, Xinran He, and Yan Liu. Glad: Group anomaly detection in social media analysis. 2014.
- [Zhang et al., 2022] Shengming Zhang, Yanchi Liu, Xuchao Zhang, Wei Cheng, Haifeng Chen, and Hui Xiong. Cat: Beyond efficient transformer for content-aware anomaly detection in event sequences. In Proceedings of the 28th ACM SIGKDD Conference on Knowledge Discovery and Data Mining, pages 4541–4550, 2022.