Enhanced detection of the presence and severity of COVID-19 from CT scans using lung segmentation
Melbourne Data Analytics Platform
University of Melbourne
Parkville, Victoria, Australia 3010
robert.turnbull@unimelb.edu.au
Abstract
Improving automated analysis of medical imaging will provide clinicians more options in providing care for patients. The 2023 AI-enabled Medical Image Analysis Workshop and Covid-19 Diagnosis Competition (AI-MIA-COV19D) provides an opportunity to test and refine machine learning methods for detecting the presence and severity of COVID-19 in patients from CT scans. This paper presents version 2 of Cov3d, a deep learning model submitted in the 2022 competition. The model has been improved through a preprocessing step which segments the lungs in the CT scan and crops the input to this region. It results in a validation macro F1 score for predicting the presence of COVID-19 in the CT scans at 93.2% which is significantly above the baseline of 74%. It gives a macro F1 score for predicting the severity of COVID-19 on the validation set for task 2 as 72.8% which is above the baseline of 38%.
Keywords COVID-19 Computed Tomography Deep Learning
1 Introduction
Advances in deep learning offers many opportunities for assisting clinicians in analysis of medical imaging. One possibility for such use is the detection of COVID-19 from computed tomography (CT) scans (Xie et al., 2020; Kollias et al., 2018; Harmon et al., 2020; Kollias et al., 2020a, b). To encourage research in this area, ‘AI-enabled Medical Image Analysis Workshop’ created a competition as part of the the International Conference on Computer Vision (ICCV) in 2021 (Kollias et al., 2021). This competition required participants to predict the presence of COVID-19 in a large database of CT scans (Arsenos et al., 2022). The winning submission achieved a macro F1 score on the test dataset of 90.43% (Hou et al., 2021). The competition was run as part of the 2022 European Conference on Computer Vision (ECCV) with an enlarged dataset and an additional task which was to predict the severity of COVID-19 in a subset of CT scans (Kollias et al., 2022). Two teams produced winning results in the task to predict the presence of COVID-19 with a macro F1 score of 89.11% (Hou et al., 2022; Hsu et al., 2022). One of those teams also produced the best submission for the second challenge to predict the severity of COVID-19, achieving a macro F1 score of 51.76% (Hou et al., 2022). A third competition is to be held as part of the IEEE International Conference on Acoustics Speech and Signal Processing (ICASSP) in 2023 with an even larger dataset (Kollias et al., 2023). This article presents version 2 of the Cov3d model which achieved a place of ‘runner-up’ in the challenge to detect the presence of COVID-19 in the 2022 competition with a macro F1 score of 87.87% and a ranking of fourth place in the challenge to predict the severity of COVID-19 with a macro F1 score of 46% (Turnbull, 2022).
2 The 2023 COV19-CT-DB Database
The 2023 version of the database includes 1,250 more scans in the training and validation partitions than in the previous year (table 1). There were many more non-COVID-19 scans added than positive ones which means that the training dataset contains about 30% COVID-19 positive scans. The test partition was reduced about 18% to 4,308.
For a subset of the dataset, two radiologists and two pulmonologists annotated COVID-19 positive CT scans with the severity of the disease in four classes: mild, moderate, severe and critical. The more severity the classification, the more pulmonary parenchymal involvement. These classifications are provided in Microsoft Excel files accompanying the dataset. The number of COVID-19 severity annotations increased substantially to 460 in the training partition and 101 in the validation partition compared to the 2022 version of the database (table 2). The number of scans in the test partition decreased from 265 to 231.
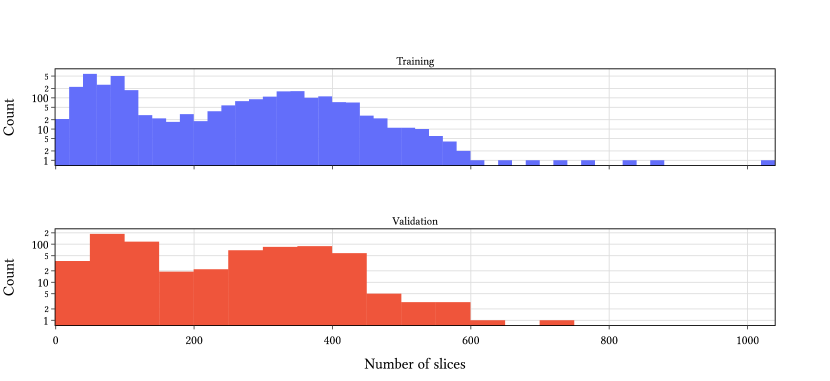
The scans are provided as two dimensional JPEG images of cross-sections (slices) in the transverse plane. The images were processed from DICOM files and were clipped to a window of -1150 Hounsfield Units (HU) to 350 HU. Each cross section is of the resolution 512 512 pixels. The number of slices varies considerably (fig. 1). Both the training and validation partitions have a bimodal distribution of number of slices, with peaks around 60 and in the mid-300s.
| COVID-19 | Training | Validation | Test |
|---|---|---|---|
| Positive | 922 (40) | 225 (10) | – |
| Negative | 2,110 (1,000) | 469 (200) | – |
| Total | 3,032 (1,040) | 694 (210) | 4,308 (973) |
| Index | Severity | Training | Validation | Test |
|---|---|---|---|---|
| 1 | Mild | 132 (47) | 31 (9) | – |
| 2 | Moderate | 123 (61) | 20 (10) | – |
| 3 | Severe | 166 (81) | 45 (21) | – |
| 4 | Critical | 39 (13) | 5 (0) | – |
| Total | 460 (202) | 101 (40) | 231 (34) |
2.1 Cross-Validation
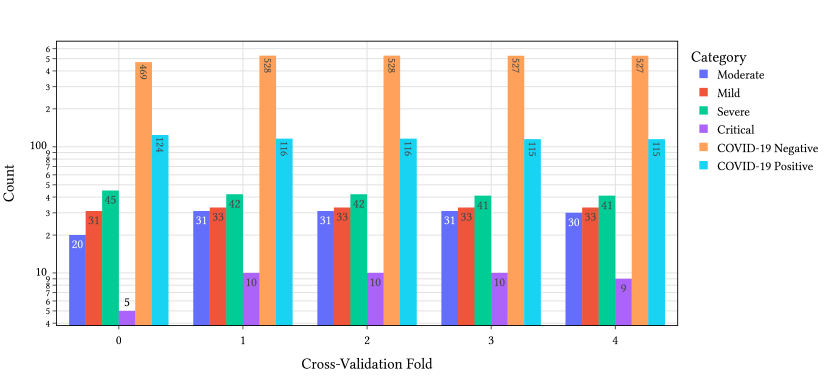
Even with the enlarged database, the number of scans in the validation partition is limited, especially for the different severity categories. The small sample size means that it is difficult to know how well results on the validation partition will reflect on other unseen data. To remedy this we used 5-fold cross validation, as did Kienzle et al. (2022). We used the existing validation set as one of the folds and labeled fold ‘zero’. We then split the remaining training data into four evenly split folds whilst keeping a balance of six categories of the scan (i.e. non-COVID, one of the four severity categories or an otherwise unannotated COVID-19 positive scan). This resulted in five fairly evenly balanced training/validation partitions (fig. 2).
3 Methods
This paper discusses version 2 of Cov3d, a classifier of CT scan images using three dimensional neural networks.111 https://github.com/rbturnbull/cov3d/ Cov3d uses TorchApp which is a wrapper for packaging deep learning packages which use PyTorch (Paszke et al., 2019) and fastai (Howard and Gugger, 2020).222TorchApp is available as an alpha release at: https://github.com/rbturnbull/torchapp/.
3.1 Preprocessing
One challenge of working with the COV19-CT-DB database is the variability of the number of cross-sectional slices (fig. 1). Ideally, they will all be a standard size in order to efficiently train the model in batches. Also, the scans with a large number of slices will not be able to fit into the memory for the graphics processing units (GPU) available. That is why the previous version of Cov3d first preprocessed the scan volumes to preset sizes. This usually meant a loss of detail as the volumes were converted to a lower resolution. This can cause a problem if the lungs only constitute a small proportion of the volume since a lot of the detail for detecting the effects of COVID-19 will be lost. To rectify this, first we segmented the lungs in the volume and cropped the volumes to a bounding box containing the voxels identified as part of the lungs. We first attempted to use the ‘lungmask’ neural network software package to perform the segmentation (Hofmanninger et al., 2020). This worked well for slices where the lungs were visible. However, false positive results were produced on slices where no lungs were present. Instead we used an automated procedure of 3D image morphological operations, adapted from Rister et al. (2020). After cropping, the volumes were resized into standard sizes using scikit-image(van der Walt et al., 2014). The three standard sizes are described in table 3.
| Description | Depth (Size along longitudinal axis) | Width (Size along sagittal axis) | Height (Size along frontal axis) |
|---|---|---|---|
| Small | 64 | 128 | 128 |
| Medium | 256 | 256 | 176 |
| Large | 320 | 320 | 224 |
3.2 Loss
The original Cov3d model used a custom loss function which allowed the model to train simultaneously to predict the presence of COVID-19 and also its severity. This means that the model can be infused with an understanding of the severity of COVID when making predictions about whether or not COVID-19 is present and it allows the severity prediction to be trained on the whole dataset rather than the small subset with the relevant annotations. This combined loss function came through considering the non-COVID-19 scans as being in a fifth severity category. This perspective continued in version 2 of Cov3d but with a different approach.
The loss function for the latest version of Cov3d takes output scores of dimension 5, , where corresponds to being COVID-19 negative and corresponds to one of the four severity classes. This is converted to a probability distribution with the softmax function:
| (1) |
Cov3d then uses the Focal Loss (Lin et al., 2017):
| (2) |
where is a scaling factor and is a one hot encoded vector for the ground truth category, if it is in one of the severity categories or is COVID-19 negative. In the remaining category where the scan is known to be COVID-19 positive but without knowing the severity, the focal loss is calculated as follows:
| (3) |
since the probability that the scan is COVID-19 positive is given by .
This loss function reduces the contribution of easy examples to classify and forces the network to focus on the more challenging items. However, there is no sense in this loss function that the five categories to be predicted sit somehow along a dimensional axis such that the critical category is closer to the severe category than it is to being mild. For this, we use another component to the loss which is the ‘Earth Mover’s Distance’ (EMD) or the Wasserstein distance (Hou et al., 2016). To calculate this metric, we define a distance between adjacent categories: where is the distance from moving from category to category . Then we create a symmetrical distance matrix for all categories:
| (4) |
The EMD loss is then the probability values in each of the five categories multiplied by the distance to move that probability mass into the ground truth category:
| (5) |
For the remaining case for COVID-19 positive scans without severity annotations, the distance is zero to all severity categories which are COVID-19 positive and we define a distance which is the distance between the COVID19 negative and positive categories. Thus the EMD loss in this case is:
| (6) |
For the experiments to follow, this distance and distances between adjacent categories were all set to 1.
The final loss value is a linear combination of the Focal Loss and EMD Loss:
| (7) |
where is a hyper-parameter weighting between the two loss components.
3.3 Neural Network Architecture
The original Cov3d model used a 3D ResNet neural network architecture He et al. (2016); Tran et al. (2018). The architecture was adapted to use a single channel for input and to include dropout (Hinton et al., 2012) at each of the four main layers. The final layer was changed to produce the output required. An output of the architecture is shown in table 4.
In addition to the 3D ResNet, a Video Swin Transformer (Liu et al., 2021) was also used with a similar modification to the initial layer and a change to the final layer to the predictions. The ‘Tiny’ version was used for the sake of memory constraints on the GPU.
| Layer name | Description |
|---|---|
| Stem | 1×7×7, 64, stride 1×2×2 |
| Layer 1 | , Dropout |
| Layer 2 | , Dropout |
| Layer 3 | , Dropout |
| Layer 4 | , Dropout |
| Global Average Pooling | 1 × 1 × 1 |
| Penultimate Layer | 512 dimensions, Dropout |
| Final Layer | 5 dimensions |
3.4 Pretraining
The model was pretrained on a video classification task, the Kinetics-400 dataset (Kay et al., 2017). In some experiments, the network was further trained on the public STOIC dataset(Revel et al., 2021) of 2,000 CT scans with some being labeled as COVID-19 negative and some as COVID-19 positive in two severity categories. This was trained with the same loss function as above but with fewer severity categories and when used as a pretrained network for the COV19-CT-DB database, the weights for the lower severity category were initially mapped to the ‘Mild’ and ‘Moderate’ categories whilst the higher severity category was mapped to the ‘Severe’ and ‘Critical’ categories.
3.5 Training Procedure
The models were trained for 40 or 50 epochs with a batch size of two because of constraints on the GPU memory. Training used the Adam optimization method (Kingma and Ba, 2014). The learning rate was scheduled according to Smith’s ‘1cycle’ policy (Smith, 2018) with the maximum learning rate set to . The macro F1 scores were calculated using Scikit-learn (Pedregosa et al., 2011). The best model weights for each task were saved for inference on the test set.
3.6 Regularization and Data Augmentation
To allow for generalization to unseen data, the training dataset was augmented by randomly reflecting the input scans through the sagittal plane. For making inferences on the test set, both the original volume and the reflected volume where given to the network and the final result averaged the probability predictions.
The brightness and contrast of the input volume (, scaled from zero to one) was randomly adjusted by the following transformation:
| (8) | ||||
| where | ||||
Weight decay of was added to the loss function.
4 Results
4.1 Experiments
Several experiments using different combinations of hyper-parameters were run. The results are found in table 5. Cross validation was not able to be performed on all runs due to computational limitations. The best performing model on the official validation set for task 1 achieved a macro F1 score of 93.2% which was significantly higher than the baseline of 74%. The best performing model for task 2 achieved a macro F1 score of 72.8% which was also much higher than the baseline of 38%.
90
| Exp. | Arch. | Size | STOIC Pretrain | Dropout | Bright ness | Contrast | Epochs | Validation Task 1 macro F1 | Cross Validation Task 1 macro F1 | Validation Task 2 macro F1 | Cross Validation Task 2 macro F1 | |
|---|---|---|---|---|---|---|---|---|---|---|---|---|
| 1 | ResNet | Medium | Yes | 0.2 | 0.2 | 0.04 | 0.04 | 50 | 93.2 | 93.5 0.5 | 60.7 | 64.5 5.5 |
| 2 | ResNet | Medium | Yes | 0.2 | 0.2 | 0.04 | 0.04 | 50 | 93.1 | 93.3 0.7 | 59.5 | 66.7 6.6 |
| 3 | ResNet | Medium | Yes | 0.2 | 0.1 | 0.04 | 0.04 | 50 | 92.9 | 93.5 0.5 | 64.7 | 64.7 4.1 |
| 4 | ResNet | Medium | Yes | 0.2 | 0.2 | 0.04 | 0.0 | 50 | 92.8 | 93.4 0.7 | 57.6 | 61.1 5.9 |
| 5 | ResNet | Large | Yes | 0.5 | 0.1 | 0.04 | 0.0 | 40 | 92.2 | 93 1 | 61.9 | 64 5.9 |
| 6 | ResNet | Medium | No | 0.2 | 0.2 | 0.03 | 0.0 | 50 | 92.1 | 93.4 1 | 62.0 | 65.3 6.2 |
| 7 | ResNet | Large | Yes | 0.5 | 0.1 | 0.0 | 0.0 | 40 | 92.1 | 93 0.7 | 52.5 | 57.3 6.2 |
| 8 | ResNet | Medium | No | 0.2 | 0.2 | 0.0 | 0.0 | 40 | 92.0 | 93.2 0.9 | 62.0 | 64.8 4.4 |
| 9 | ResNet | Medium | No | 0.5 | 0.1 | 0.0 | 0.0 | 40 | 91.7 | 92.6 0.6 | 61.2 | 60.2 9.9 |
| 10 | ResNet | Medium | No | 0.5 | 0.5 | 0.0 | 0.0 | 40 | 91.6 | 93 0.9 | 54.6 | 58.6 4.2 |
| 11 | Swin | Small | No | - | 0.2 | 0.03 | 0.0 | 50 | 91.5 | 68.1 | ||
| 12 | ResNet | Small | No | 0.5 | 0.1 | 0.0 | 0.0 | 40 | 91.3 | 61.4 | ||
| 13 | ResNet | Large | Yes | 0.2 | 0.2 | 0.04 | 0.0 | 50 | 91.2 | 92.8 1.4 | 68.6 | 63 8.5 |
| 14 | ResNet | Medium | Yes | 0.5 | 0.1 | 0.04 | 0.0 | 40 | 91.2 | 92.8 1.1 | 51.6 | 61.4 9.1 |
| 15 | ResNet | Small | No | 0.5 | 0.5 | 0.0 | 0.0 | 40 | 91.2 | 66.3 | ||
| 16 | Swin | Small | No | - | 0.2 | 0.04 | 0.04 | 50 | 91.0 | 72.8 | ||
| 17 | ResNet | Large | Yes | 0.2 | 0.2 | 0.04 | 0.0 | 50 | 90.9 | 92.7 1 | 59.1 | 63.3 6.7 |
| 18 | Swin | Small | No | - | 0.2 | 0.03 | 0.0 | 40 | 90.9 | 70.0 | ||
| 19 | Swin | Small | No | - | 0.1 | 0.0 | 0.0 | 40 | 90.7 | 67.0 | ||
| 20 | ResNet | Small | No | 0.5 | 0.0 | 0.03 | 0.0 | 40 | 90.6 | 62.8 | ||
| 21 | Swin | Small | No | - | 0.1 | 0.03 | 0.0 | 40 | 90.6 | 67.6 | ||
| 22 | ResNet | Small | No | 0.5 | 0.9 | 0.0 | 0.0 | 40 | 90.2 | 51.0 |
5 Ensembles
Basic ensemble models were created by averaging the probabilities of the top performing models to predict the presence of COVID-19 for each of the 5 cross-validation folds (6). The best ensemble on the validation set achieved a macro F1 score of 93.4%. Cross validation showed improvements over the best single model as well.
| Ensemble Symbol | Experiments | Validation Task 1 macro F1 | Cross Validation Task 1 macro F1 |
|---|---|---|---|
| EP1 | 1, 2 | 93.2 | 94 0.6 |
| EP2 | 1, 2, 3 | 93.2 | 93.6 0.6 |
| EP3 | 1, 2, 3, 4 | 93.4 | 93.8 0.6 |
| EP4 | 1, 2, 3, 4, 5 | 93.2 | 93.8 0.8 |
Similar ensembles were created for the top 5 models for predicting the severity (table 7. These did not improve performance over the best single model.
| Ensemble Symbol | Experiments | Validation Task 2 macro F1 |
|---|---|---|
| ES1 | 16, 18 | 68.4 |
| ES2 | 16, 18, 13 | 67.5 |
| ES3 | 16, 18, 13, 11 | 66.5 |
| ES4 | 16, 18, 13, 11, 21 | 66.5 |
6 Test Set Prediction Submissions
The predictions on the test set for five models was submitted for each task. For task 1 to predict the presence of COVID-19, the following models were chosen:
-
•
Exp. 1: The best performing single model on the validation set for task 1.
-
•
Exp. 1 Cross Validation: an average of the predictions for the five cross validation folds of experiment 1.
-
•
Exp. 4 Cross Validation: An average of the predictions for the five cross validation folds for experiment 4 which achieved the highest mean macro F1 score.
-
•
EP3: The best performing ensemble on the validation set for task 1.
-
•
EP3 Cross Validation: An average of the predictions for the five cross validation folds for ensemble EP3.
For task 2 to predict the severity of COVID-19, the following models were used for the submissions:
-
•
Exp. 16: The best performing single model on the validation set for task 2.
-
•
Exp. 18: The second best performing single model on the validation set for task 2.
-
•
Exp. 13: The third best performing single model on the validation set for task 2.
-
•
Exp 13 Cross Validation: An average of the predictions for the five cross validation folds for experiment 13.
-
•
ES1: The best performing ensemble on the validation set for task 2.
NB. This section will be updated once the results of the competition is announced.
7 Conclusion
This version of Cov3d enhances its ability to detect the presence and severity of COVID-19 from CT scans through preprocessing the volumes to crop the focus on just the lungs and through a different loss function. The results for the two tasks of the challenge both significantly outperform the baseline set for the competition. This new version represents how further refinement of machine learning tools for medical imaging analysis is leading to better results and can open new opportunities for use in clinical settings.
8 Acknowledgements
This research was supported by the University of Melbourne’s Research Computing Services and the Petascale Campus. The work also benefited from computational resources provided by the Faculty of Engineering and Information Technology at the University of Melbourne.
References
- Xie et al. [2020] Xingzhi Xie, Zheng Zhong, Wei Zhao, Chao Zheng, Fei Wang, and Jun Liu. Chest CT for Typical Coronavirus Disease 2019 (COVID-19) Pneumonia: Relationship to Negative RT-PCR Testing. Radiology, 296(2):E41–E45, 2020. doi:10.1148/radiol.2020200343. URL https://doi.org/10.1148/radiol.2020200343. PMID: 32049601.
- Kollias et al. [2018] Dimitrios Kollias, Athanasios Tagaris, Andreas Stafylopatis, Stefanos Kollias, and Georgios Tagaris. Deep neural architectures for prediction in healthcare. Complex & Intelligent Systems, 4(2):119–131, 2018.
- Harmon et al. [2020] Stephanie A. Harmon, Thomas H. Sanford, Sheng Xu, Evrim B. Turkbey, Holger Roth, Ziyue Xu, Dong Yang, Andriy Myronenko, Victoria Anderson, Amel Amalou, Maxime Blain, Michael Kassin, Dilara Long, Nicole Varble, Stephanie M. Walker, Ulas Bagci, Anna Maria Ierardi, Elvira Stellato, Guido Giovanni Plensich, Giuseppe Franceschelli, Cristiano Girlando, Giovanni Irmici, Dominic Labella, Dima Hammoud, Ashkan Malayeri, Elizabeth Jones, Ronald M. Summers, Peter L. Choyke, Daguang Xu, Mona Flores, Kaku Tamura, Hirofumi Obinata, Hitoshi Mori, Francesca Patella, Maurizio Cariati, Gianpaolo Carrafiello, Peng An, Bradford J. Wood, and Baris Turkbey. Artificial intelligence for the detection of covid-19 pneumonia on chest ct using multinational datasets. Nature Communications, 11(1):4080, 2020. ISSN 2041-1723. doi:10.1038/s41467-020-17971-2. URL https://doi.org/10.1038/s41467-020-17971-2.
- Kollias et al. [2020a] Dimitrios Kollias, N Bouas, Y Vlaxos, V Brillakis, M Seferis, Ilianna Kollia, Levon Sukissian, James Wingate, and S Kollias. Deep transparent prediction through latent representation analysis. arXiv preprint arXiv:2009.07044, 2020a.
- Kollias et al. [2020b] Dimitris Kollias, Y Vlaxos, M Seferis, Ilianna Kollia, Levon Sukissian, James Wingate, and Stefanos D Kollias. Transparent adaptation in deep medical image diagnosis. In TAILOR, page 251–267, 2020b.
- Kollias et al. [2021] Dimitrios Kollias, Anastasios Arsenos, Levon Soukissian, and Stefanos Kollias. Mia-cov19d: Covid-19 detection through 3-d chest ct image analysis. arXiv preprint arXiv:2106.07524, 2021.
- Arsenos et al. [2022] Anastasios Arsenos, Dimitrios Kollias, and Stefanos Kollias. A Large Imaging Database and Novel Deep Neural Architecture for Covid-19 Diagnosis. In 2022 IEEE 14th Image, Video, and Multidimensional Signal Processing Workshop (IVMSP), pages 1–5, 2022. doi:10.1109/IVMSP54334.2022.9816321.
- Hou et al. [2021] Junlin Hou, Jilan Xu, Rui Feng, Yuejie Zhang, Fei Shan, and Weiya Shi. Cmc-cov19d: Contrastive mixup classification for covid-19 diagnosis. In 2021 IEEE/CVF International Conference on Computer Vision Workshops (ICCVW), pages 454–461, 2021. doi:10.1109/ICCVW54120.2021.00055.
- Kollias et al. [2022] Dimitrios Kollias, Anastasios Arsenos, and Stefanos Kollias. Ai-mia: Covid-19 detection & severity analysis through medical imaging. arXiv preprint arXiv:2206.04732, 2022.
- Hou et al. [2022] Junlin Hou, Jilan Xu, Rui Feng, and Yuejie Zhang. Fdvts’s solution for 2nd cov19d competition on covid-19 detection and severity analysis, 2022. URL https://arxiv.org/abs/2207.01758.
- Hsu et al. [2022] Chih-Chung Hsu, Chi-Han Tsai, Guan-Lin Chen, Sin-Di Ma, and Shen-Chieh Tai. Spatiotemporal feature learning based on two-step lstm and transformer for ct scans, 2022. URL https://arxiv.org/abs/2207.01579.
- Kollias et al. [2023] Dimitrios Kollias, Anastasios Arsenos, , and Stefanos Kollias. Ai-enabled analysis of 3-d ct scans for diagnosis of covid-19 & its severity. arXiv preprint, 2023.
- Turnbull [2022] Robert Turnbull. Cov3d: Detection of the presence and severity of covid-19 from ct scans using 3d resnets, 2022. URL https://arxiv.org/abs/2207.12218.
- Kienzle et al. [2022] Daniel Kienzle, Julian Lorenz, Robin Schön, Katja Ludwig, and Rainer Lienhart. Covid detection and severity prediction with 3d-convnext and custom pretrainings, 2022. URL https://arxiv.org/abs/2206.15073.
- Paszke et al. [2019] Adam Paszke, Sam Gross, Francisco Massa, Adam Lerer, James Bradbury, Gregory Chanan, Trevor Killeen, Zeming Lin, Natalia Gimelshein, Luca Antiga, Alban Desmaison, Andreas Kopf, Edward Yang, Zachary DeVito, Martin Raison, Alykhan Tejani, Sasank Chilamkurthy, Benoit Steiner, Lu Fang, Junjie Bai, and Soumith Chintala. Pytorch: An imperative style, high-performance deep learning library. In H. Wallach, H. Larochelle, A. Beygelzimer, F. d'Alché-Buc, E. Fox, and R. Garnett, editors, Advances in Neural Information Processing Systems 32, pages 8024–8035. Curran Associates, Inc., 2019. URL http://papers.neurips.cc/paper/9015-pytorch-an-imperative-style-high-performance-deep-learning-library.pdf.
- Howard and Gugger [2020] Jeremy Howard and Sylvain Gugger. Fastai: A Layered API for Deep Learning. Information, 11(2), 2020. ISSN 2078-2489. doi:10.3390/info11020108. URL https://www.mdpi.com/2078-2489/11/2/108.
- Hofmanninger et al. [2020] Johannes Hofmanninger, Forian Prayer, Jeanny Pan, Sebastian Röhrich, Helmut Prosch, and Georg Langs. Automatic lung segmentation in routine imaging is primarily a data diversity problem, not a methodology problem. European Radiology Experimental, 4(1):50, 2020. ISSN 2509-9280. doi:10.1186/s41747-020-00173-2. URL https://doi.org/10.1186/s41747-020-00173-2.
- Rister et al. [2020] Blaine Rister, Darvin Yi, Kaushik Shivakumar, Tomomi Nobashi, and Daniel L. Rubin. Ct-org, a new dataset for multiple organ segmentation in computed tomography. Scientific Data, 7(1):381, 2020. ISSN 2052-4463. doi:10.1038/s41597-020-00715-8. URL https://doi.org/10.1038/s41597-020-00715-8.
- van der Walt et al. [2014] Stéfan van der Walt, Johannes L. Schönberger, Juan Nunez-Iglesias, François Boulogne, Joshua D. Warner, Neil Yager, Emmanuelle Gouillart, Tony Yu, and the scikit-image contributors. scikit-image: image processing in Python. PeerJ, 2:e453, 6 2014. ISSN 2167-8359. doi:10.7717/peerj.453. URL https://doi.org/10.7717/peerj.453.
- Lin et al. [2017] Tsung-Yi Lin, Priya Goyal, Ross Girshick, Kaiming He, and Piotr Dollár. Focal loss for dense object detection, 2017. URL https://arxiv.org/abs/1708.02002.
- Hou et al. [2016] Le Hou, Chen-Ping Yu, and Dimitris Samaras. Squared earth mover’s distance-based loss for training deep neural networks, 2016. URL https://arxiv.org/abs/1611.05916.
- He et al. [2016] Kaiming He, Xiangyu Zhang, Shaoqing Ren, and Jian Sun. Deep residual learning for image recognition. In 2016 IEEE Conference on Computer Vision and Pattern Recognition (CVPR), pages 770–778, 2016. doi:10.1109/CVPR.2016.90.
- Tran et al. [2018] Du Tran, Heng Wang, Lorenzo Torresani, Jamie Ray, Yann LeCun, and Manohar Paluri. A closer look at spatiotemporal convolutions for action recognition. In 2018 IEEE/CVF Conference on Computer Vision and Pattern Recognition, pages 6450–6459, 2018. doi:10.1109/CVPR.2018.00675.
- Hinton et al. [2012] Geoffrey E. Hinton, Nitish Srivastava, Alex Krizhevsky, Ilya Sutskever, and Ruslan R. Salakhutdinov. Improving neural networks by preventing co-adaptation of feature detectors, 2012. URL https://arxiv.org/abs/1207.0580.
- Liu et al. [2021] Ze Liu, Jia Ning, Yue Cao, Yixuan Wei, Zheng Zhang, Stephen Lin, and Han Hu. Video swin transformer, 2021. URL https://arxiv.org/abs/2106.13230.
- Kay et al. [2017] Will Kay, Joao Carreira, Karen Simonyan, Brian Zhang, Chloe Hillier, Sudheendra Vijayanarasimhan, Fabio Viola, Tim Green, Trevor Back, Paul Natsev, Mustafa Suleyman, and Andrew Zisserman. The kinetics human action video dataset, 2017. URL https://arxiv.org/abs/1705.06950.
- Revel et al. [2021] Marie-Pierre Revel, Samia Boussouar, Constance de Margerie-Mellon, Inès Saab, Thibaut Lapotre, Dominique Mompoint, Guillaume Chassagnon, Audrey Milon, Mathieu Lederlin, Souhail Bennani, Sébastien Molière, Marie-Pierre Debray, Florian Bompard, Severine Dangeard, Chahinez Hani, Mickaël Ohana, Sébastien Bommart, Carole Jalaber, Mostafa El Hajjam, Isabelle Petit, Laure Fournier, Antoine Khalil, Pierre-Yves Brillet, Marie-France Bellin, Alban Redheuil, Laurence Rocher, Valérie Bousson, Pascal Rousset, Jules Grégory, Jean-François Deux, Elisabeth Dion, Dominique Valeyre, Raphael Porcher, Léa Jilet, and Hendy Abdoul. Study of thoracic ct in covid-19: The stoic project. Radiology, 301(1):E361–E370, 2021. doi:10.1148/radiol.2021210384. URL https://doi.org/10.1148/radiol.2021210384. PMID: 34184935.
- Kingma and Ba [2014] Diederik P. Kingma and Jimmy Ba. Adam: A method for stochastic optimization, 2014. URL https://arxiv.org/abs/1412.6980.
- Smith [2018] Leslie N. Smith. A disciplined approach to neural network hyper-parameters: Part 1 – learning rate, batch size, momentum, and weight decay, 2018. URL https://arxiv.org/abs/1803.09820.
- Pedregosa et al. [2011] F. Pedregosa, G. Varoquaux, A. Gramfort, V. Michel, B. Thirion, O. Grisel, M. Blondel, P. Prettenhofer, R. Weiss, V. Dubourg, J. Vanderplas, A. Passos, D. Cournapeau, M. Brucher, M. Perrot, and E. Duchesnay. Scikit-learn: Machine learning in Python. Journal of Machine Learning Research, 12:2825–2830, 2011.